4.1. Finite Element Analyses and Numerical Results of the STB-EH Device in Open-Circuit Configuration
The proposed device is modeled using the software ABAQUS for finite element analysis (FEA), in which it is possible to account for the electromechanical coupling and the nonlinearity of the bistable mechanism. A single deformable solid part is considered in the tridimensional modeling space and the various components are extruded from bidimensional shape. A linear elastic constitutive law is assumed for the different components, the values of Young’s modulus are , and for FR4, titanium and PZT, respectively; Poisson’s ratio , and ; mass density , and = 11,340 kg/m3. For the sake of simplicity, an equivalent isotropic model is adopted for FR4, in view of the fact that the curved beams are thin elements almost aligned with the material direction characterized by the abovementioned uniaxial stiffness. The restraint conditions applied to the model are of perfect clamps in correspondence with the four ends of the curved beams of the bistable mechanism. The model are meshed by means of quadratic hexaedral finite elements; in particular, those employed to model the piezoelectric layers belong to the piezoelectric family, whilst the remainder of the device is modeled with 3D stress elements.
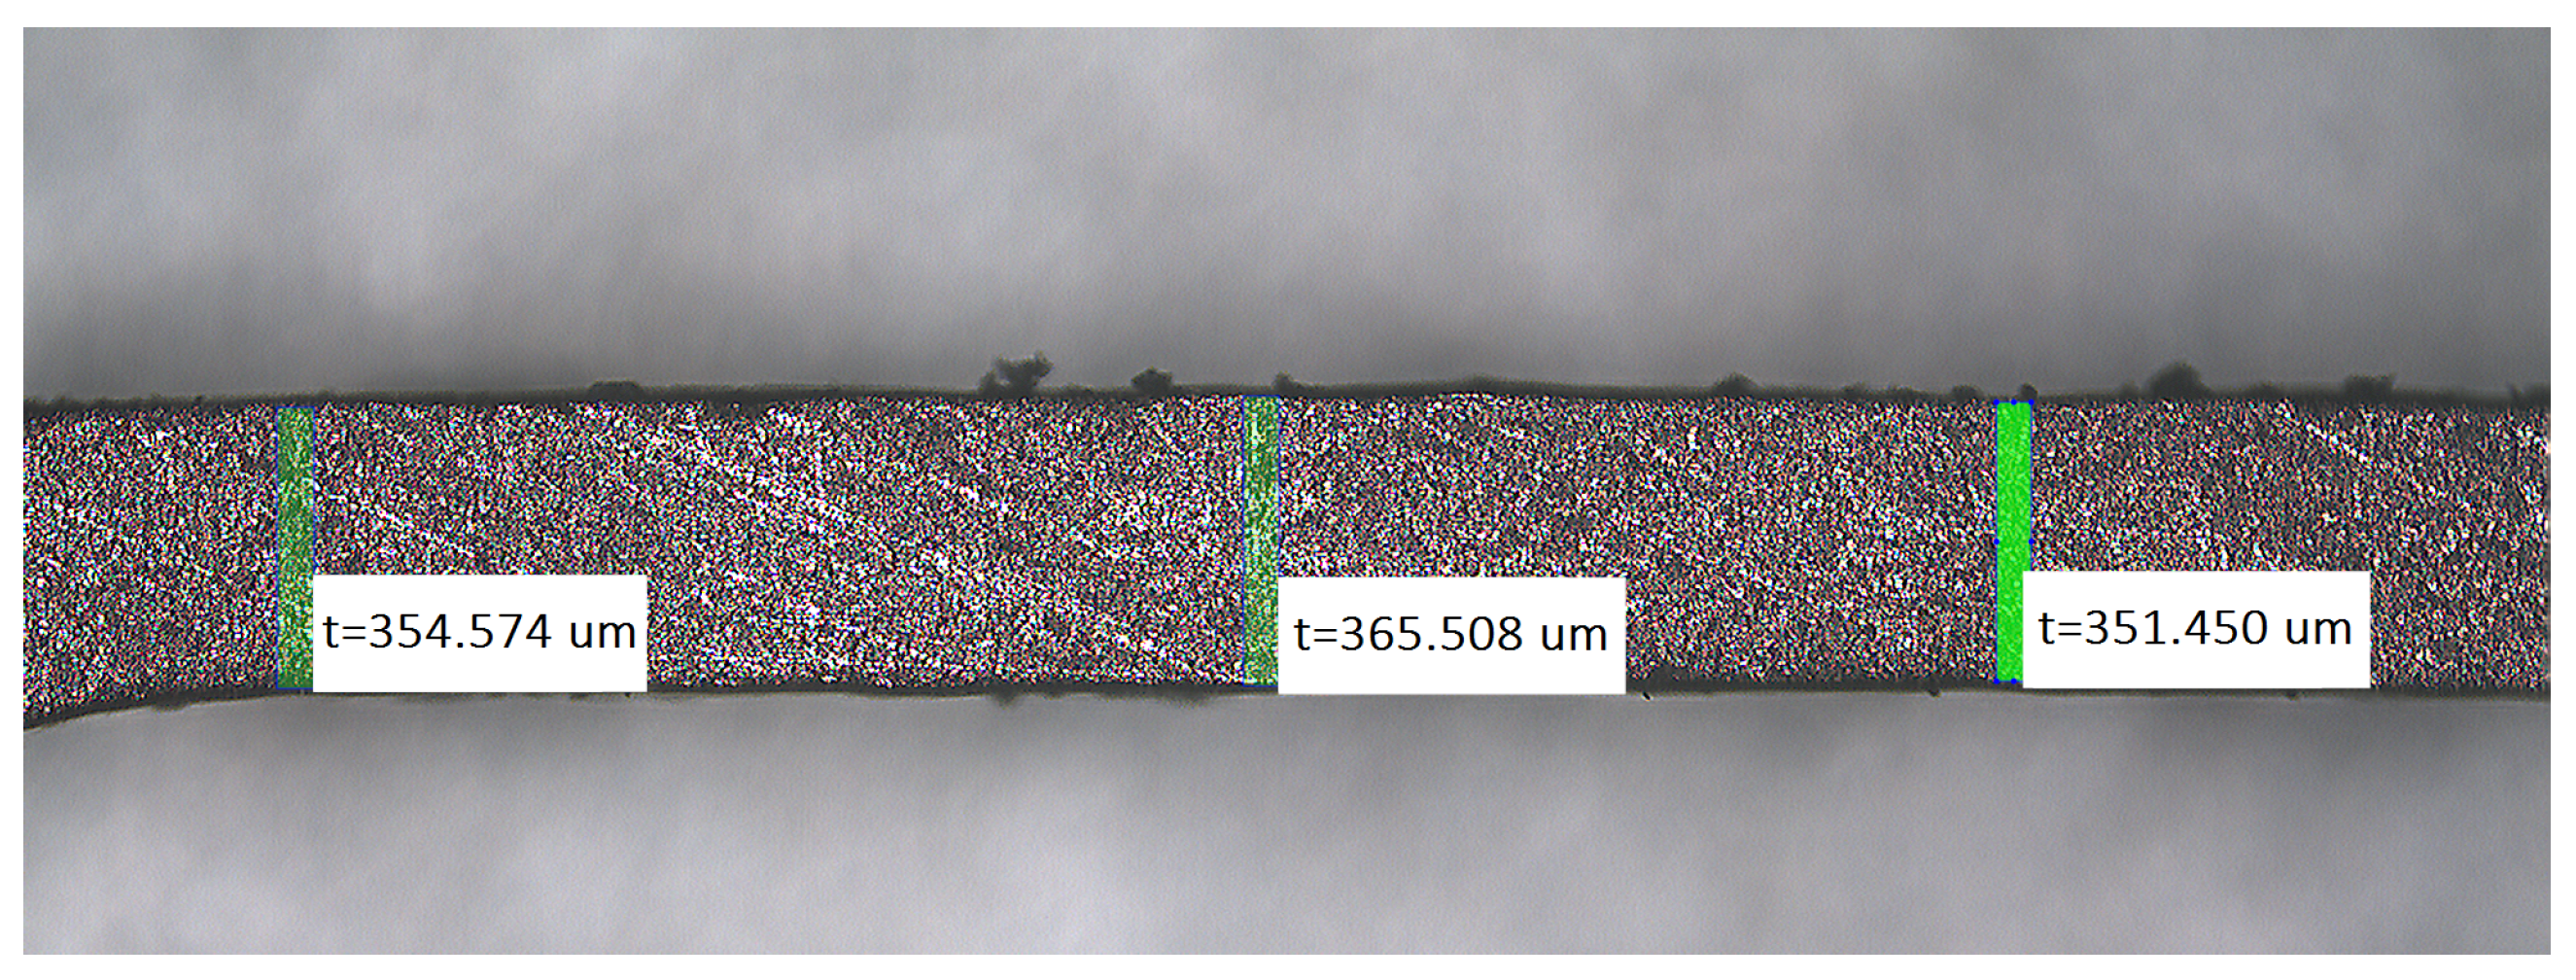
In order to model the bistable mechanism, it is necessary to preliminarily measure the thickness of the curved beams. Forty thickness measurements are made by means of an optical microscope along each of the four curved portions, as shown in
Figure 4. The measurements show how significantly the thickness varies along the length of the single curved beam: for instance, for the lower right-end beam, the maximum measured value is
m whilst the minimum measured value is
m. The mean values and coefficient of variations (CoV) are (refer to
Figure 2): top left beam
m (CoV 2.38%); bottom left beam
m (CoV 2.65%); top right beam
m (CoV 2.49%); bottom right beam
m (CoV 2.49%). In all the cases, the real thickness is lower than the nominal thickness of about 550
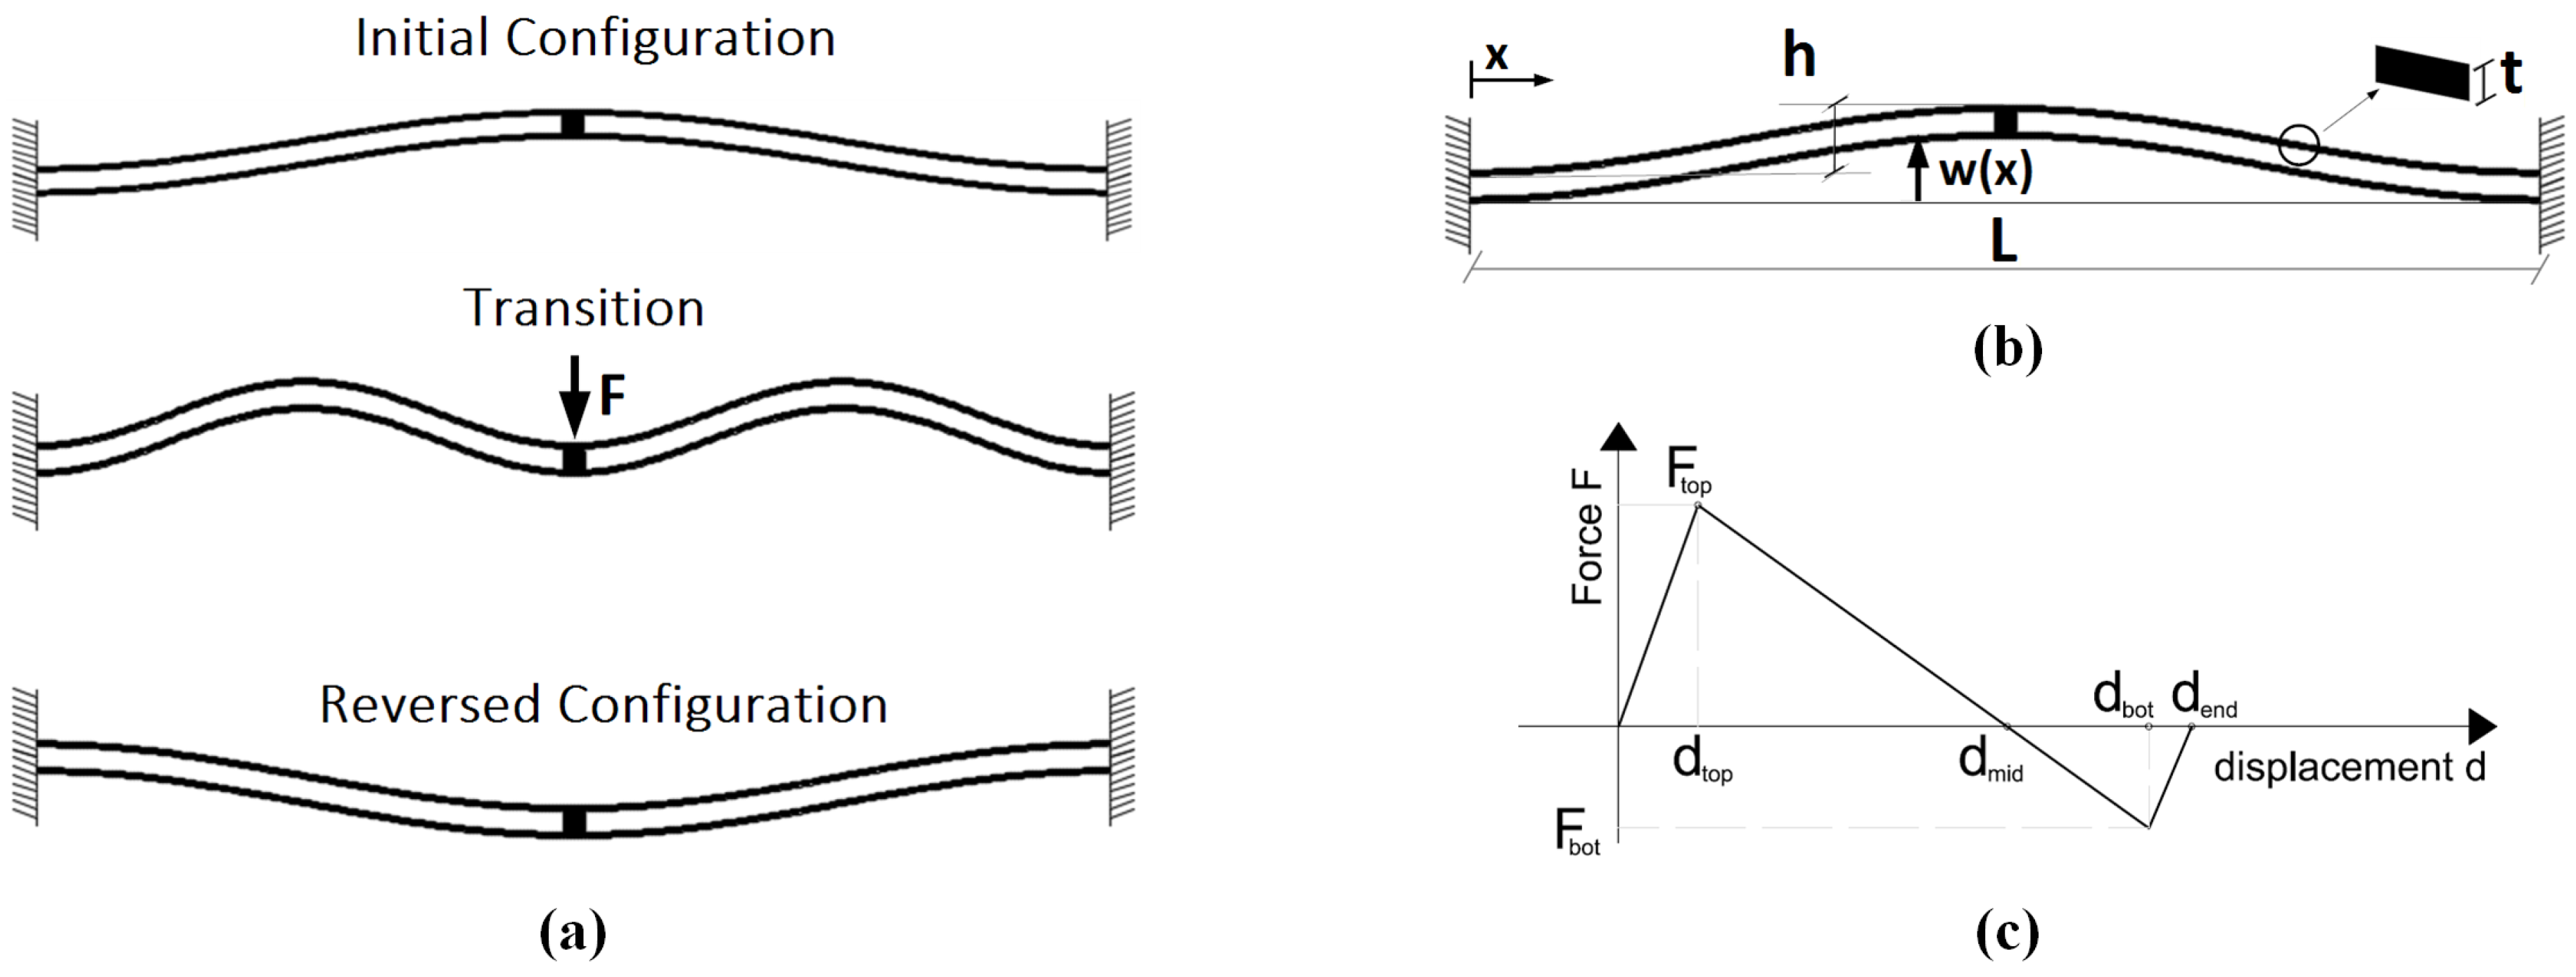
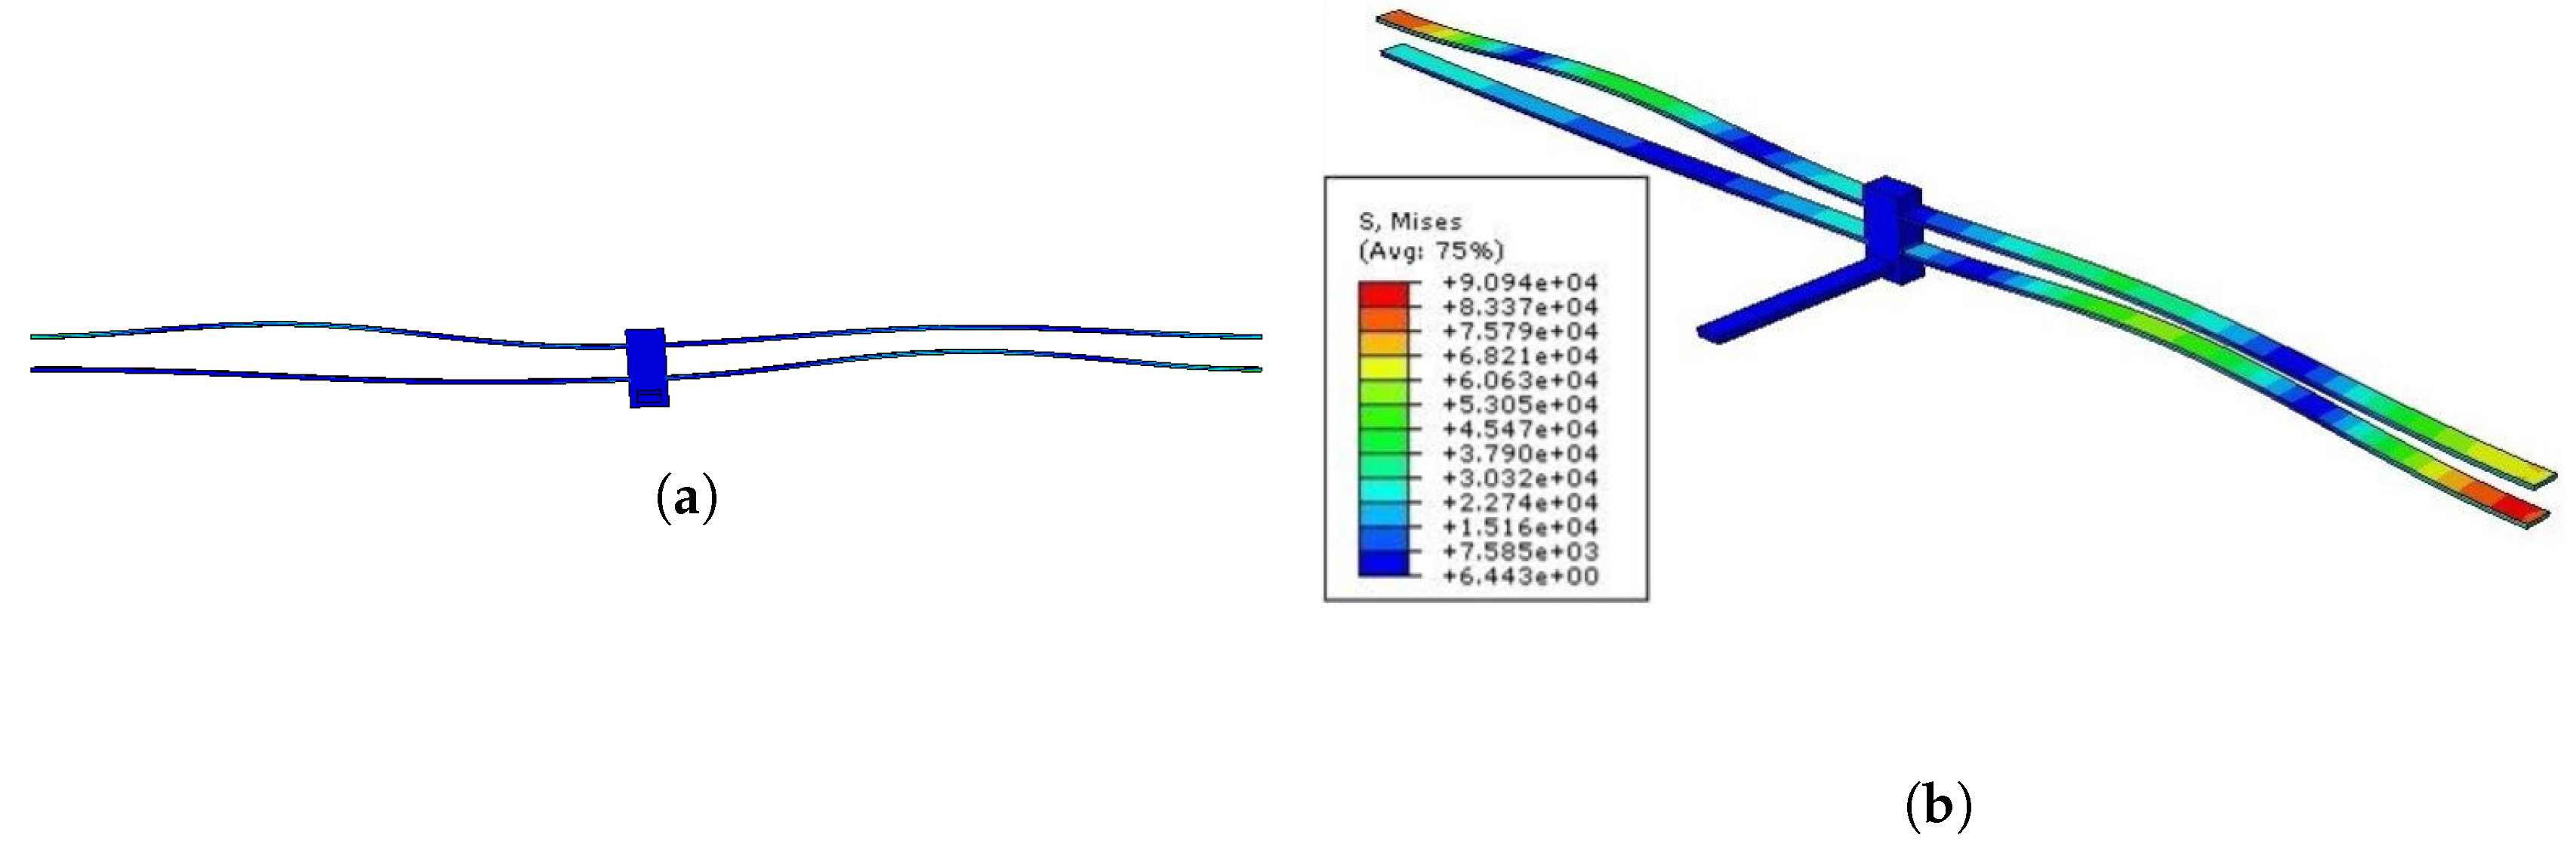
m. The asymmetry arising from the thickness variation caused by the tolerances of the fabrication process is modeled in the FEA simulation tool by assigning to the four curved element, for the sake of simplicity, the abovementioned mean value of thickness, uniform along each curved beam but varying from one beam to the other. The asymmetric nature of the bistable mechanism affects its expected bistable behavior, resulting in a rotation of the central clamp when a transition from the initial to the reversed state is triggered, as shown in
Figure 5. Similar results have been obtained with the execution of different analyses, e.g., by introducing some local variation in the thickness of each beam, according to the measurements.
Consequently, the second non-symmetrical buckling mode is not completely prevented, which is detrimental for the bistability. On the other hand, bistability depends also on the ratio : while the thickness varies randomly along the length of the bistable mechanism, the average thickness has a lower value than the expected nominal value, with an ensuing increase of Q and thus of bistability. Hence, the rotational motion of the bistable mechanism caused by the imperfections and the ensuing reduction of bistability are partially compensated by the increase of Q.
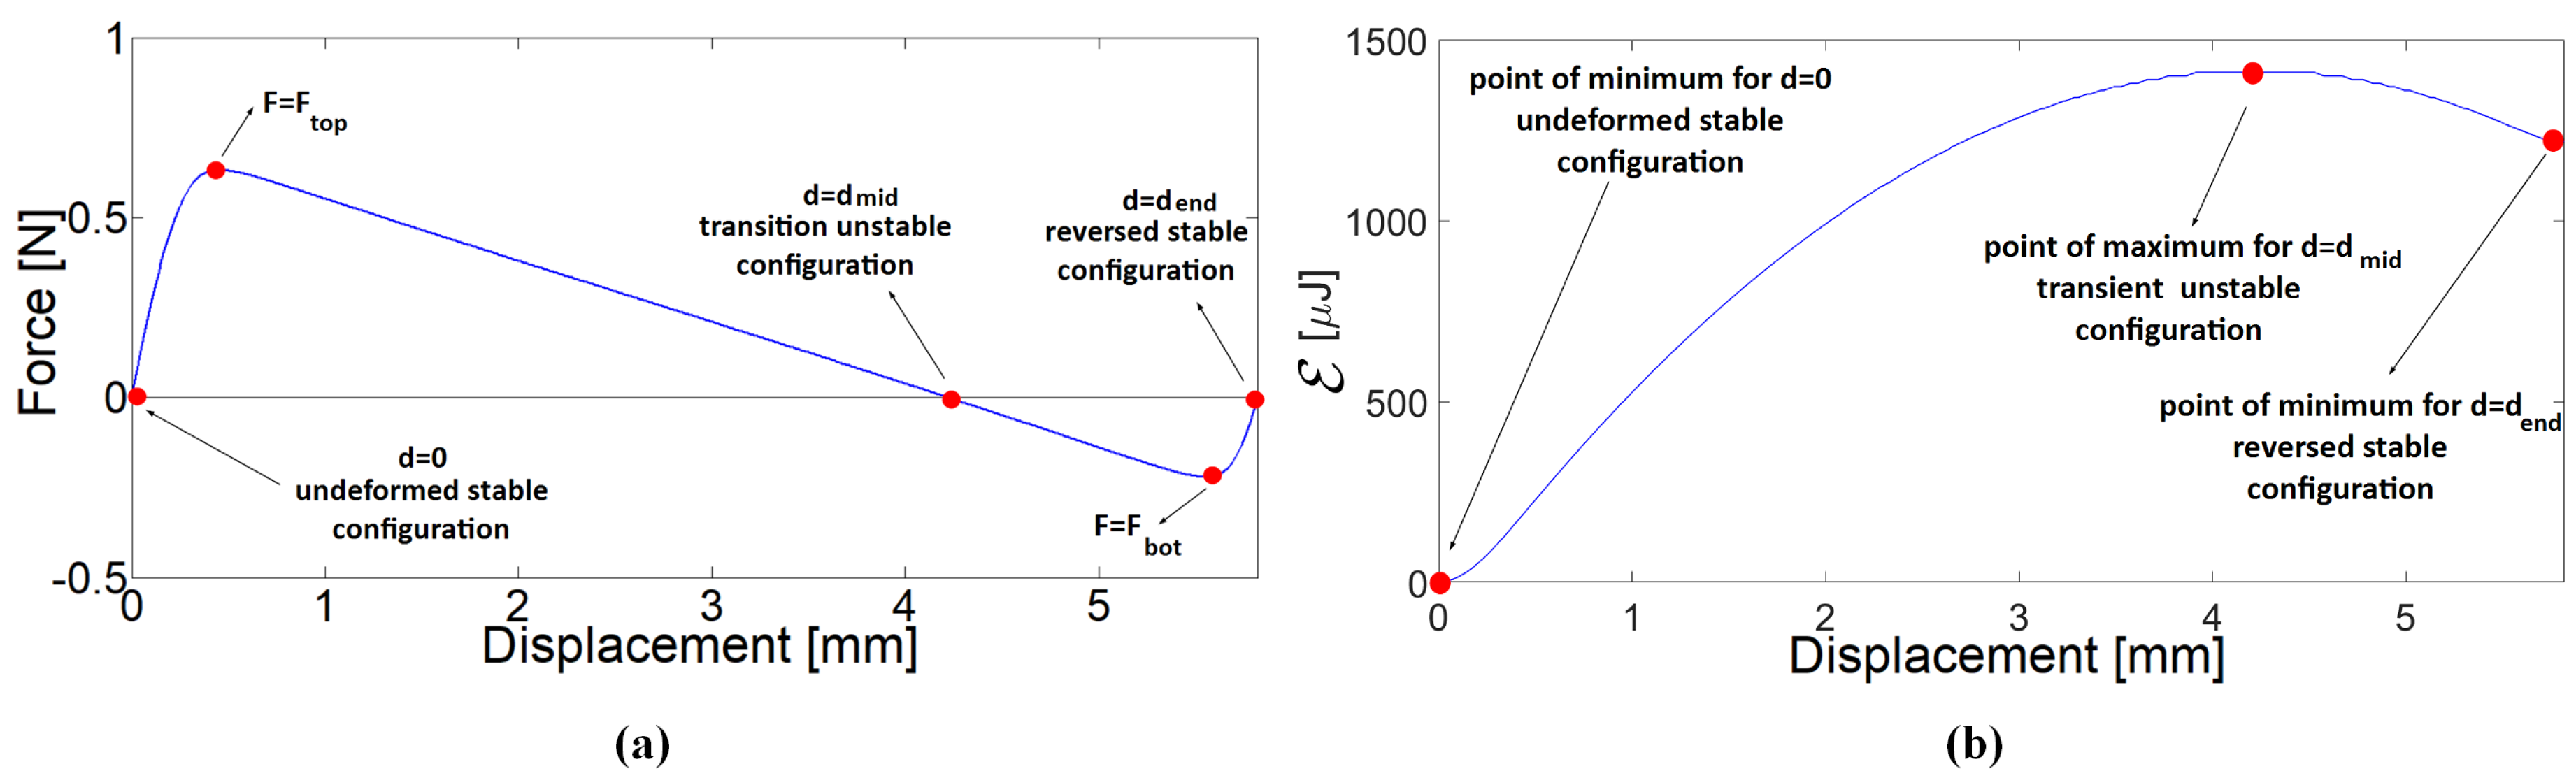
From the static nonlinear analysis under displacement control, the force–displacement and strain energy (
)-displacement curves are obtained, as shown in
Figure 6. The static analysis is performed via arc-length control accounting for geometrical nonlinearities. The analysis consists of applying a displacement along the
y-axis at the mid-span of the bistable mechanism, in correspondence with the central block, with a variation in the range
, where
. The reaction force is computed and the nonlinear curve is obtained. The bistable behavior of the mechanism is evidenced from the force–displacement curve: the latter, starting from the undeformed configuration and initially linear, becomes nonlinear as the stiffness of the bistable mechanism decreases. The STB force threshold
is hence reached, the stiffness becomes negative and the reaction force decays until becoming null in correspondence with the unstable configuration for
4.23 mm. As the force becomes negative, equilibrium is allowed only with a force of reversed sign: the point of minimum
is hence reached and corresponds to the the value of force which triggeres STB from the reversed to the initial configuration. The final point of the curve
indicates the reversed stable configuration.
The
-displacement curve is obtained from the same static nonlinear analysis as the sum of the strain energy of each finite element of the model. The curve is characterized by two points of local minimum, corresponding to the stable configurations, and a point of local maximum, corresponding to the transitional unstable configuration. As expected, the reversed configuration is less stable than the initial one, since the energy well corresponding to the reversed state (namely, the difference
) is significantly more shallow than the one relative to the undeformed configuration (
). This aspect can be explained in terms of forces: a lower magnitude of force is necessary to bring the mechanism from its reversed configuration to the initial one than vice versa. As a matter of fact, the values of forces obtained from the static analysis are
and
, respectively. It is worth noting that the theoretical predictions, given by Equations (
2) and (
3), are different with respect to the numerical outcomes. As a matter of fact, the formulas are referred to the perfect case, with equal thickness for all the beams. Taking into account the overall average thickness, i.e.,
m, and an equivalent Young’s modulus equal to 14 GPa for FR4, one finds
and
. The reduction of limit loads is a consequence of the sensitivity to imperfection of the considered structure [
36]: the asymmetry of beams’ thickness that characterizes the FE model entails a premature snap with respect to the theoretical framework.
For model A, the total mass, sum of the mass of the bimorph beam, and the mass of the bistable mechanism is and thus the value of input acceleration triggering STB, respectively, from the initial to the reversed state and vice versa are and . Vibrational piezoelectric energy harvesters are generally employed to scavenge energy from ambient vibrations, characterized by accelerations acting at low frequencies and magnitude. It is possible to decrease the magnitude of the acceleration necessary for STB by simply increasing the mass of the device: as a matter of fact, for model B, the total mass is . Given the increase of mass, in the simplifying hypothesis of invariance of snap loads for the models, a proportional reduction of the acceleration is expected. Furthermore, an increase of mass can be useful if the EH device has to scavenge energy under the effect of impacts or, in case the increase of mass is sufficiently high, if the device is tilted.
In addition to the static analysis, a modal analysis is carried out, by means of a frequency—linear perturbation analysis around the initial configuration of the bistable mechanism. The Lanczos eigenvalue solver is adopted and the obtained modal frequencies are listed in
Table 2 for model A and in
Table 3 for model B. Clearly, in the second case, the modal frequencies are relevantly lower due to the presence of the lead tip mass on the free end of the bimorph beam. The examination of the first mode shape indicates a significant out-of-plane motion of the bistable mechanism, together with the oscillation of the cantilever beam.
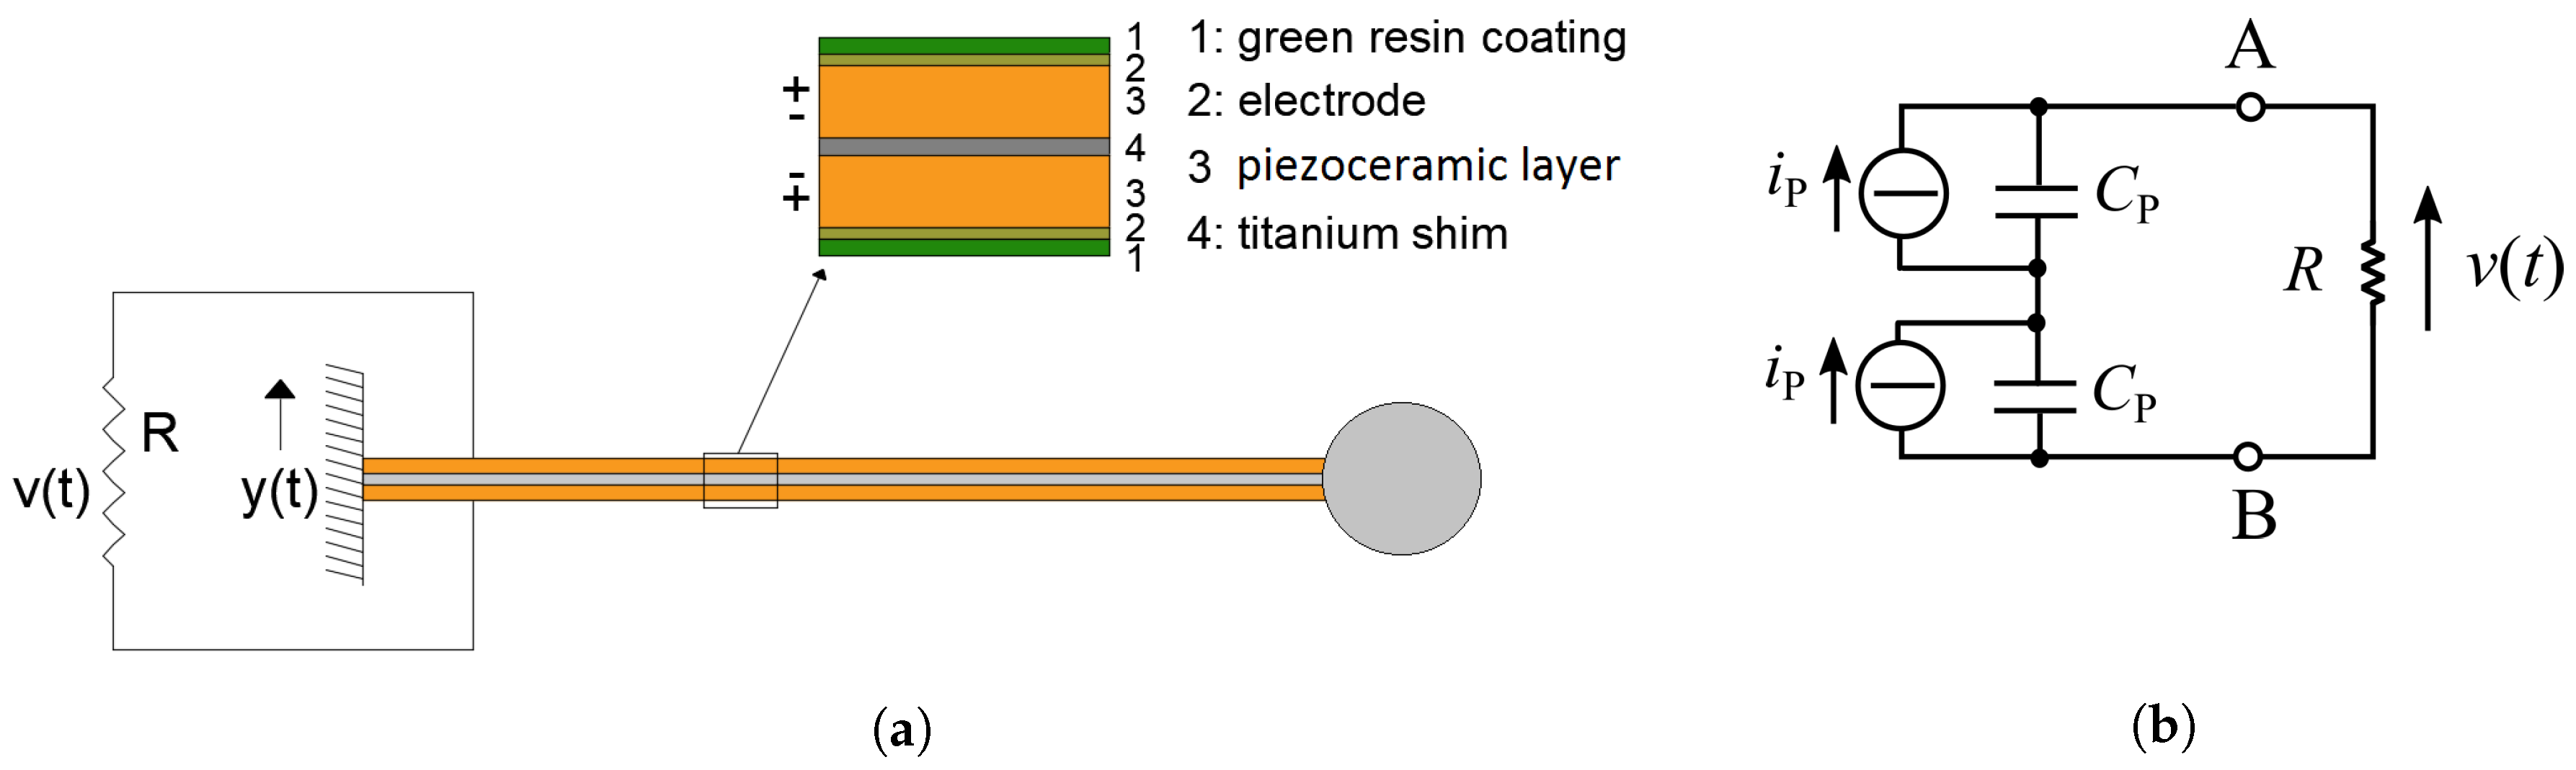
Subsequently, a dynamic implicit analysis accounting for geometrical nonlinearities and the electro-mechanical coupling is performed. In the FE model, the electromechanical coupling is accounted for by means of the piezoelectric coefficient . In addition, the following electrical boundary conditions are imposed: the bottom surface of the lower piezoelectric layer (lower electrode) is set to zero voltage, whereas the voltage on the top surface of the upper layer (upper electrode) is let free to vary in time but is set constant over the whole surface. The damping is introduced via the Rayleigh model, tuned in order to have an arbitrarily chosen damping ratio for the first eigenmode.
The test is here described with the help of the force–displacement curve shown in
Figure 6a. First, it is possible to verify that the structure does not show an abrupt transition from the initial to the reversed configuration. Then, the snap in the opposite sense is exploited. To that purpose, in the first phase, the bistable mechanism is brought to its reversed stable configuration (
). From this configuration, in the second phase, an opposite displacement is applied at mid-span beyond the point of inversion of the force sign (
), so that the bistable mechanism, in the third stage, automatically and impulsively snaps back to its initial configuration. On the FE model, the first two phases are modeled by means of nonlinear static analyses with assigned displacement. As
, the displacement restraint is released and a dynamic implicit analysis starts, with the mechanism switching back to its initial configuration, inducing oscillations of the bimorph beam. The dynamic step runs over 200 ms, with a time increment equal to 0.1 ms.
The numerical outcomes of the dynamic analyses are shown in the next section, along with the experimental counterparts. It can be observed that the response is dominated by the first two modal frequencies, which involve a combined motion of the bistable mechanism and of the bimorph beam.
4.2. Experimental Characterization of the STB-EH Prototypes in Open-Circuit Configuration
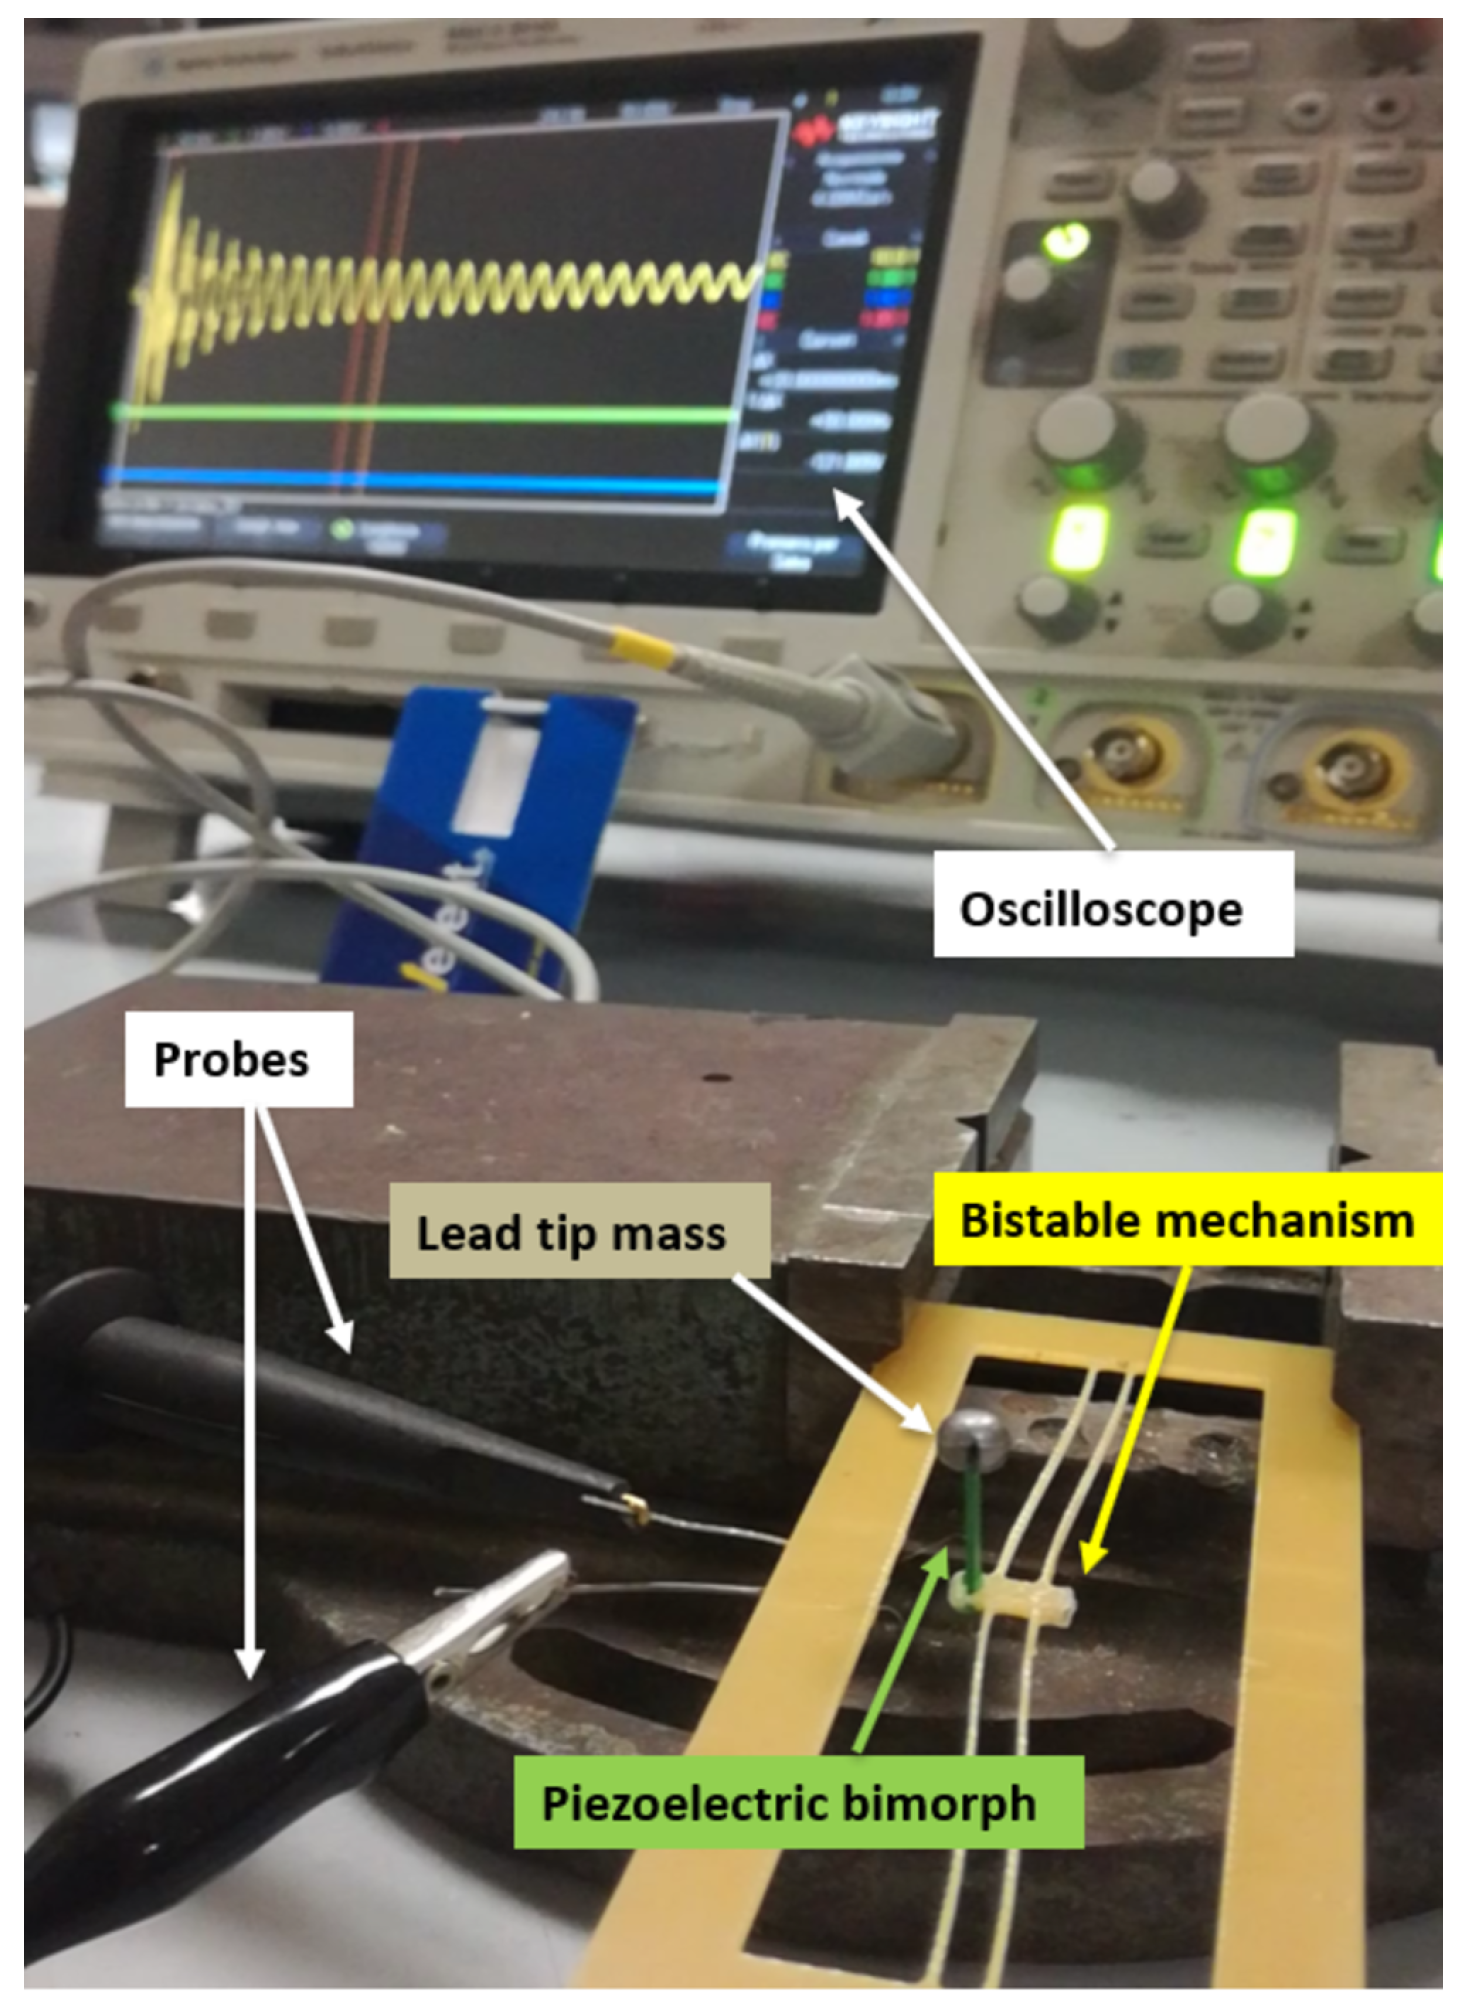
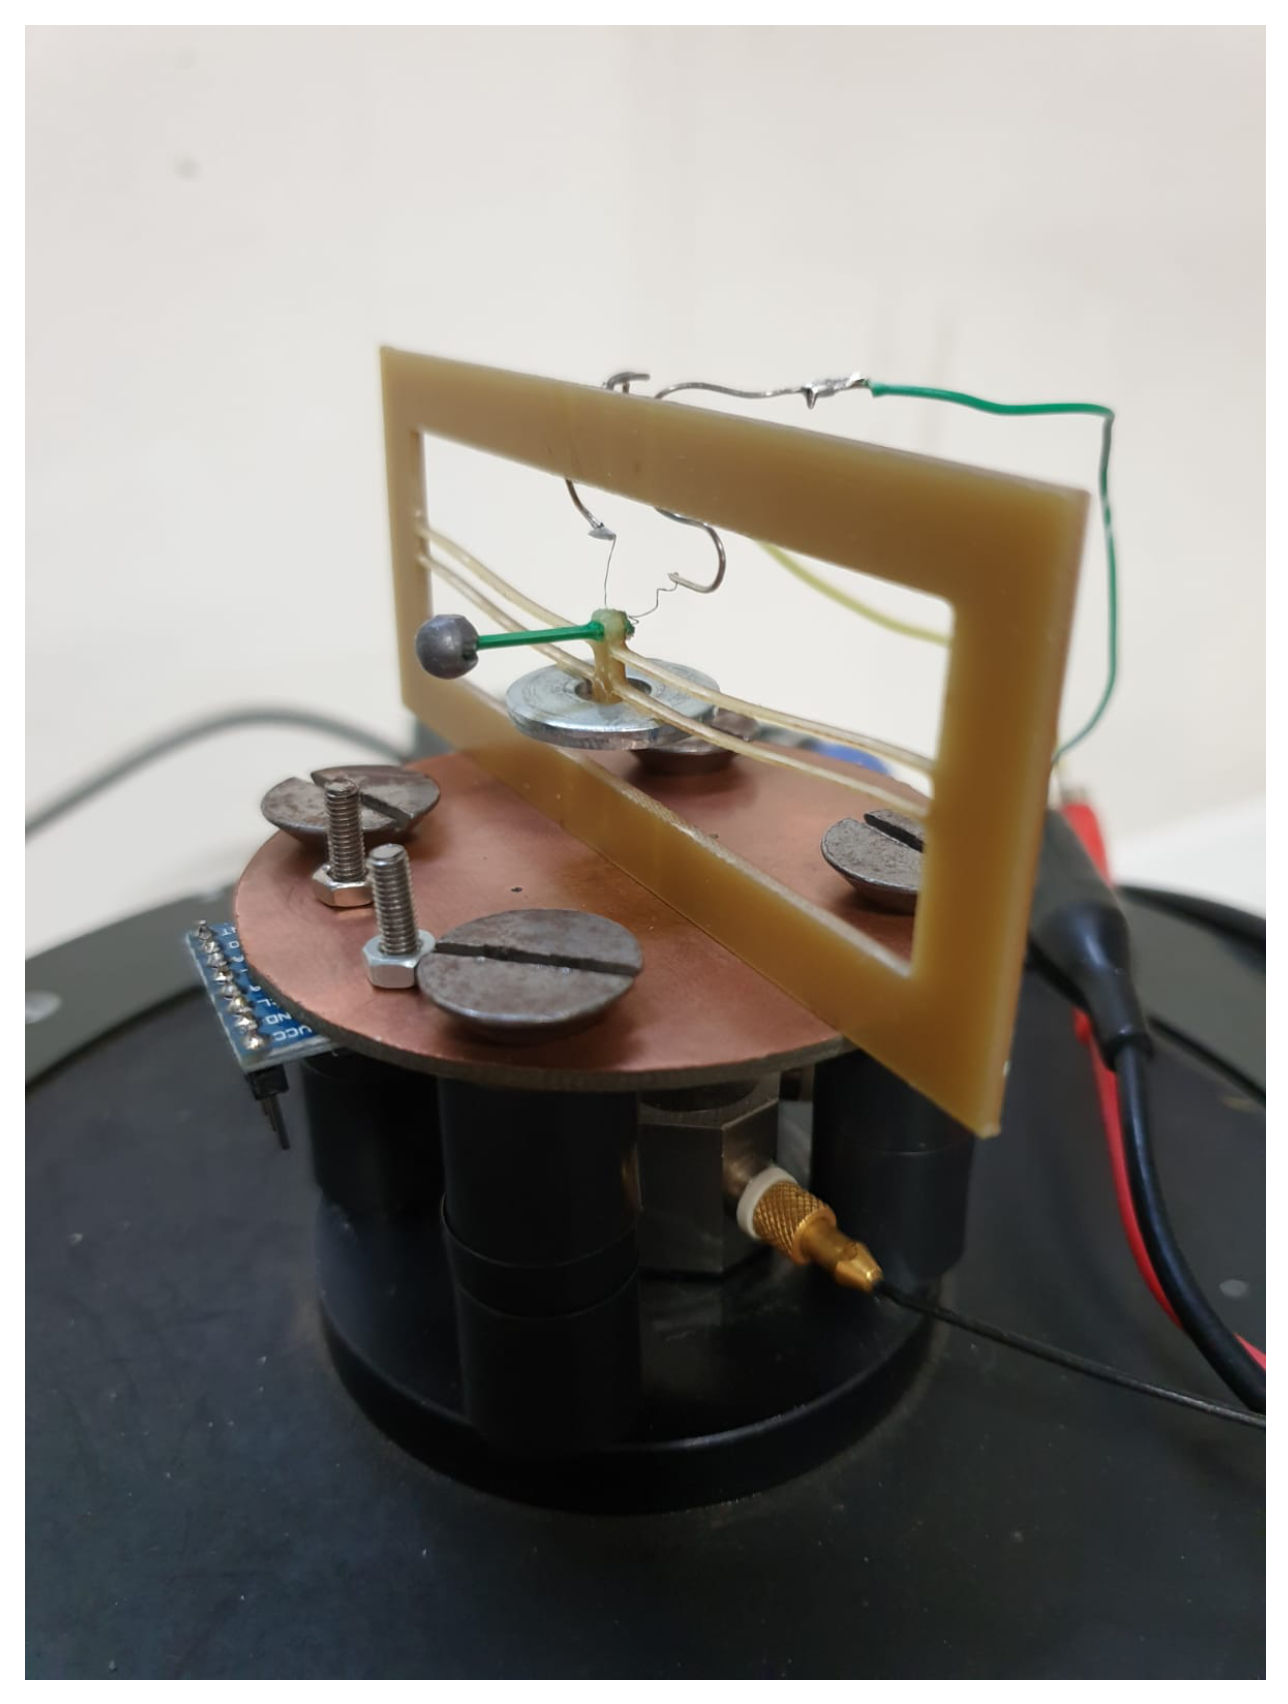
Figure 7 shows the experimental setup adopted to characterize the STB-EH prototypes (specifically, model B is shown in the figure, but the same setup is used also for the other tests). Voltage is measured by means of probes connected to an oscilloscope and to the electrodes of the bimorph beam.
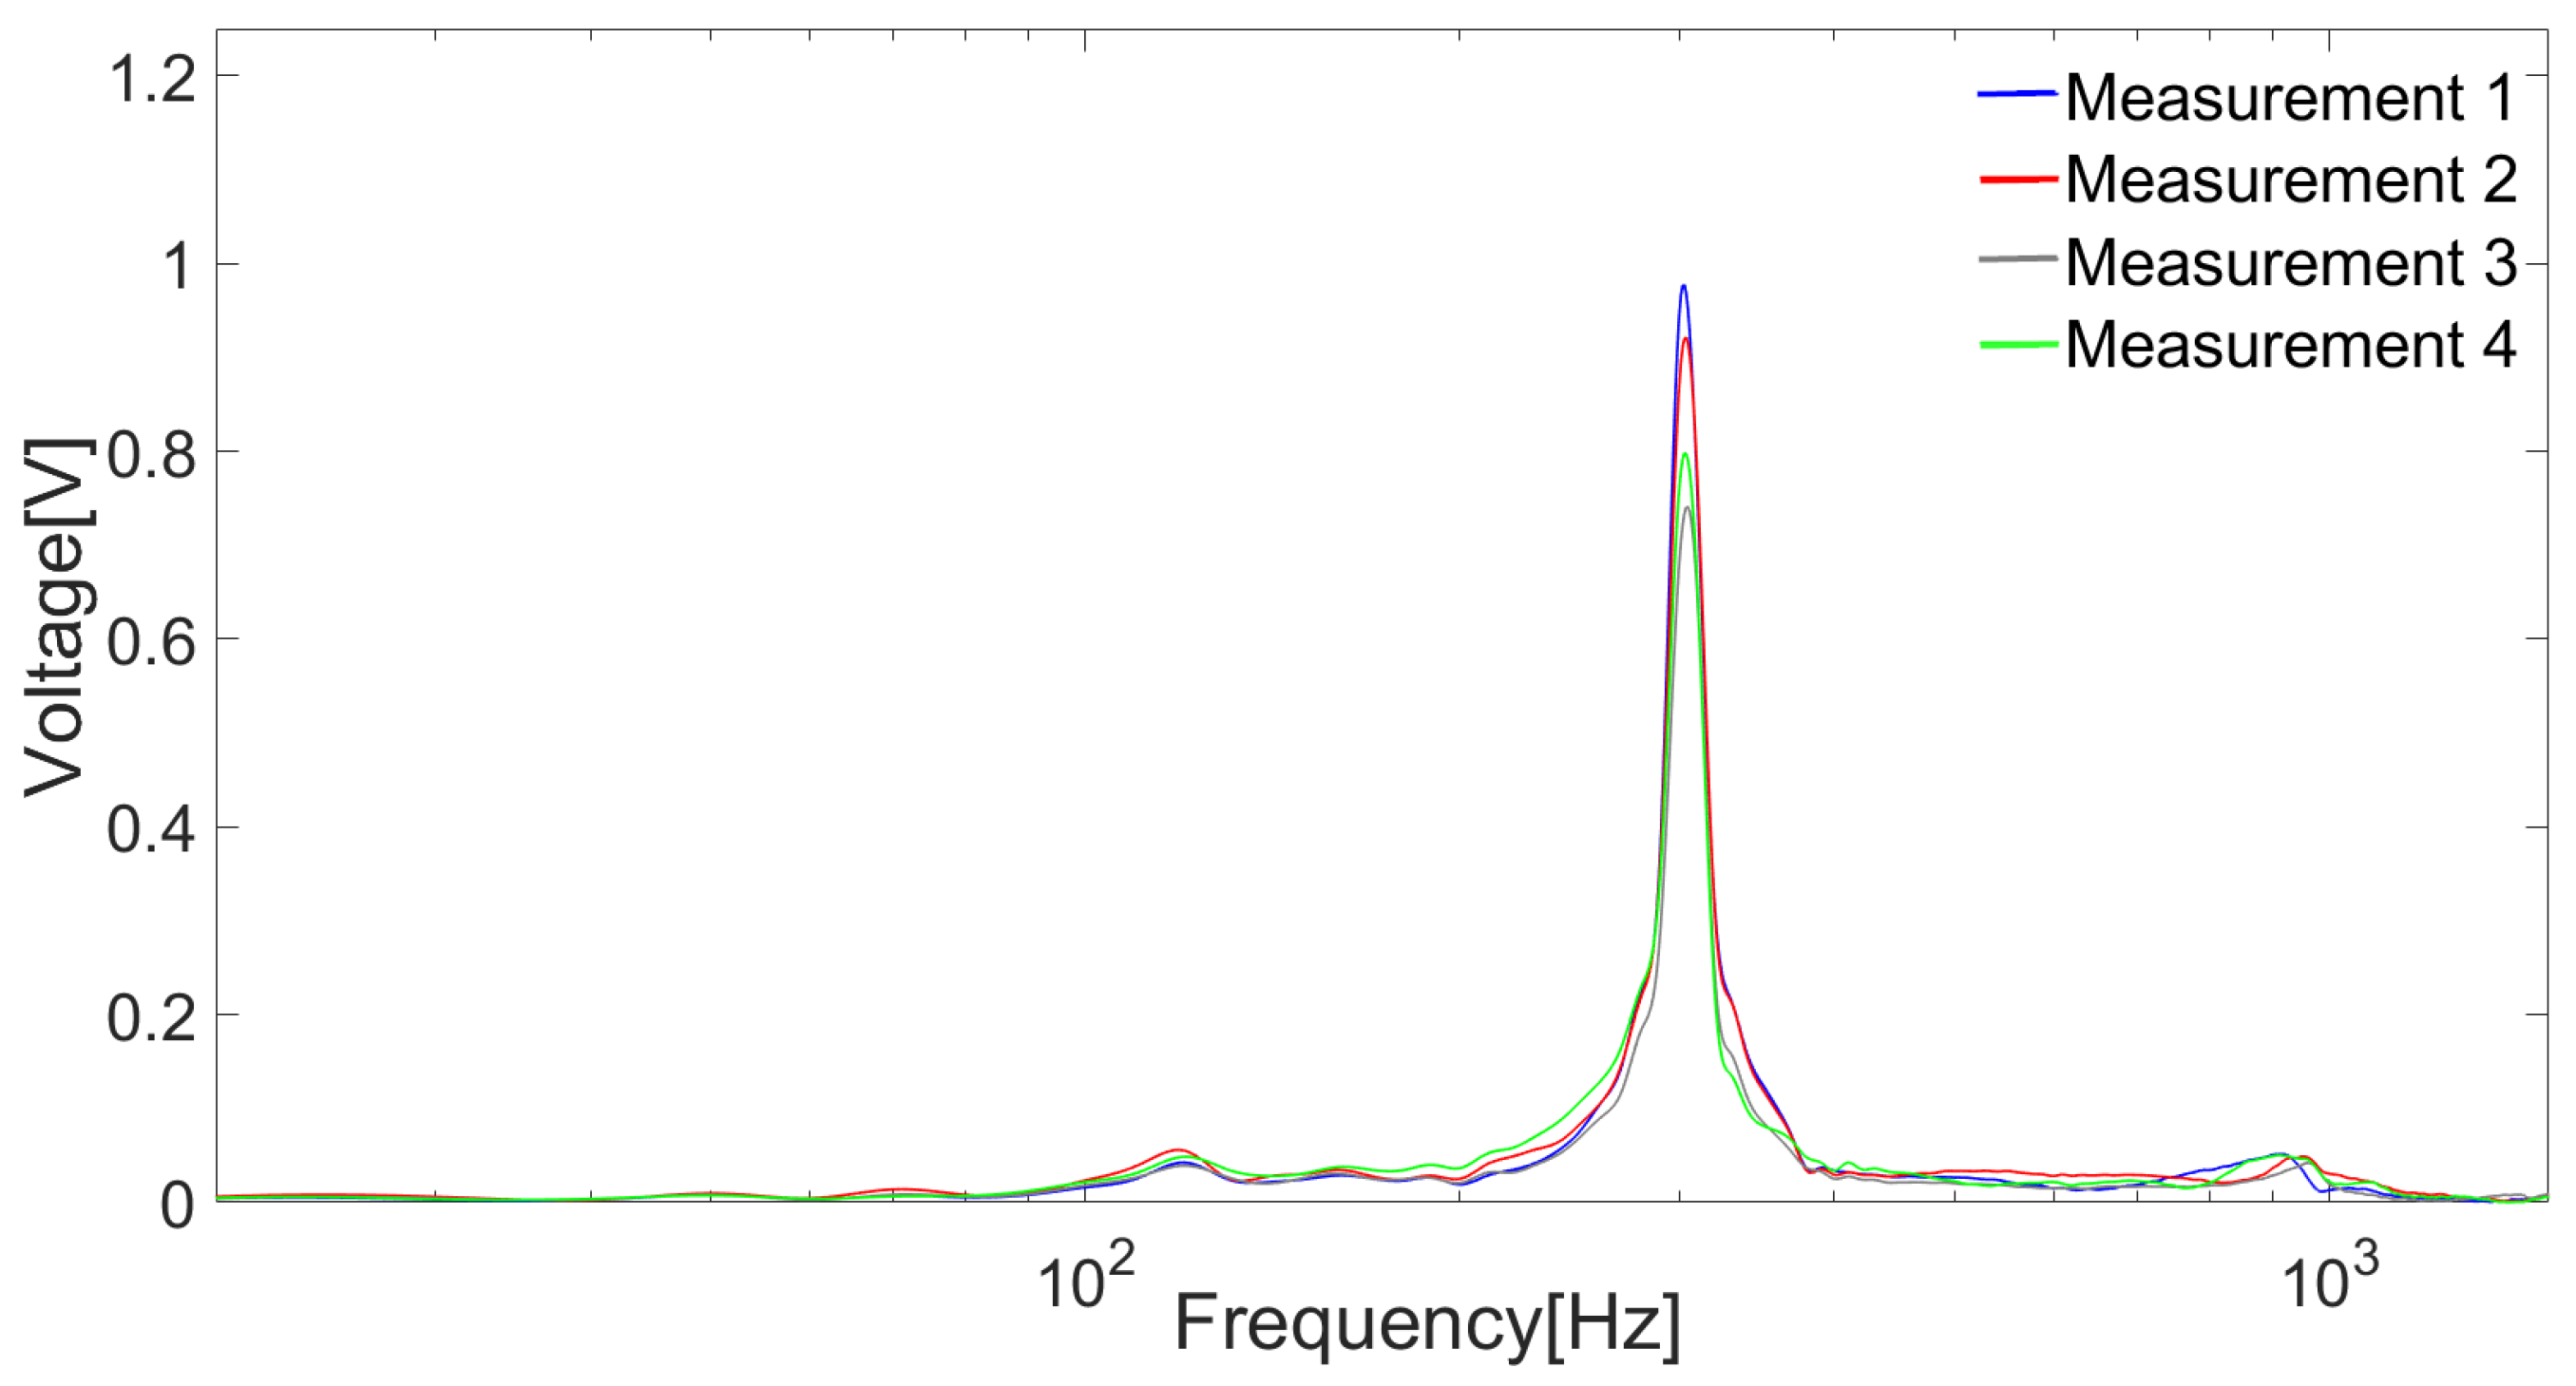
Firstly, the resonant frequencies of the bimorph beams for models A and B are estimated by measuring the open-circuit voltage subsequent to a mechanical impulse. To this purpose, the device is clamped in a vice with the exception of the bimorph beam which is let free to oscillate due to an imparted mechanical impulse to the vice.
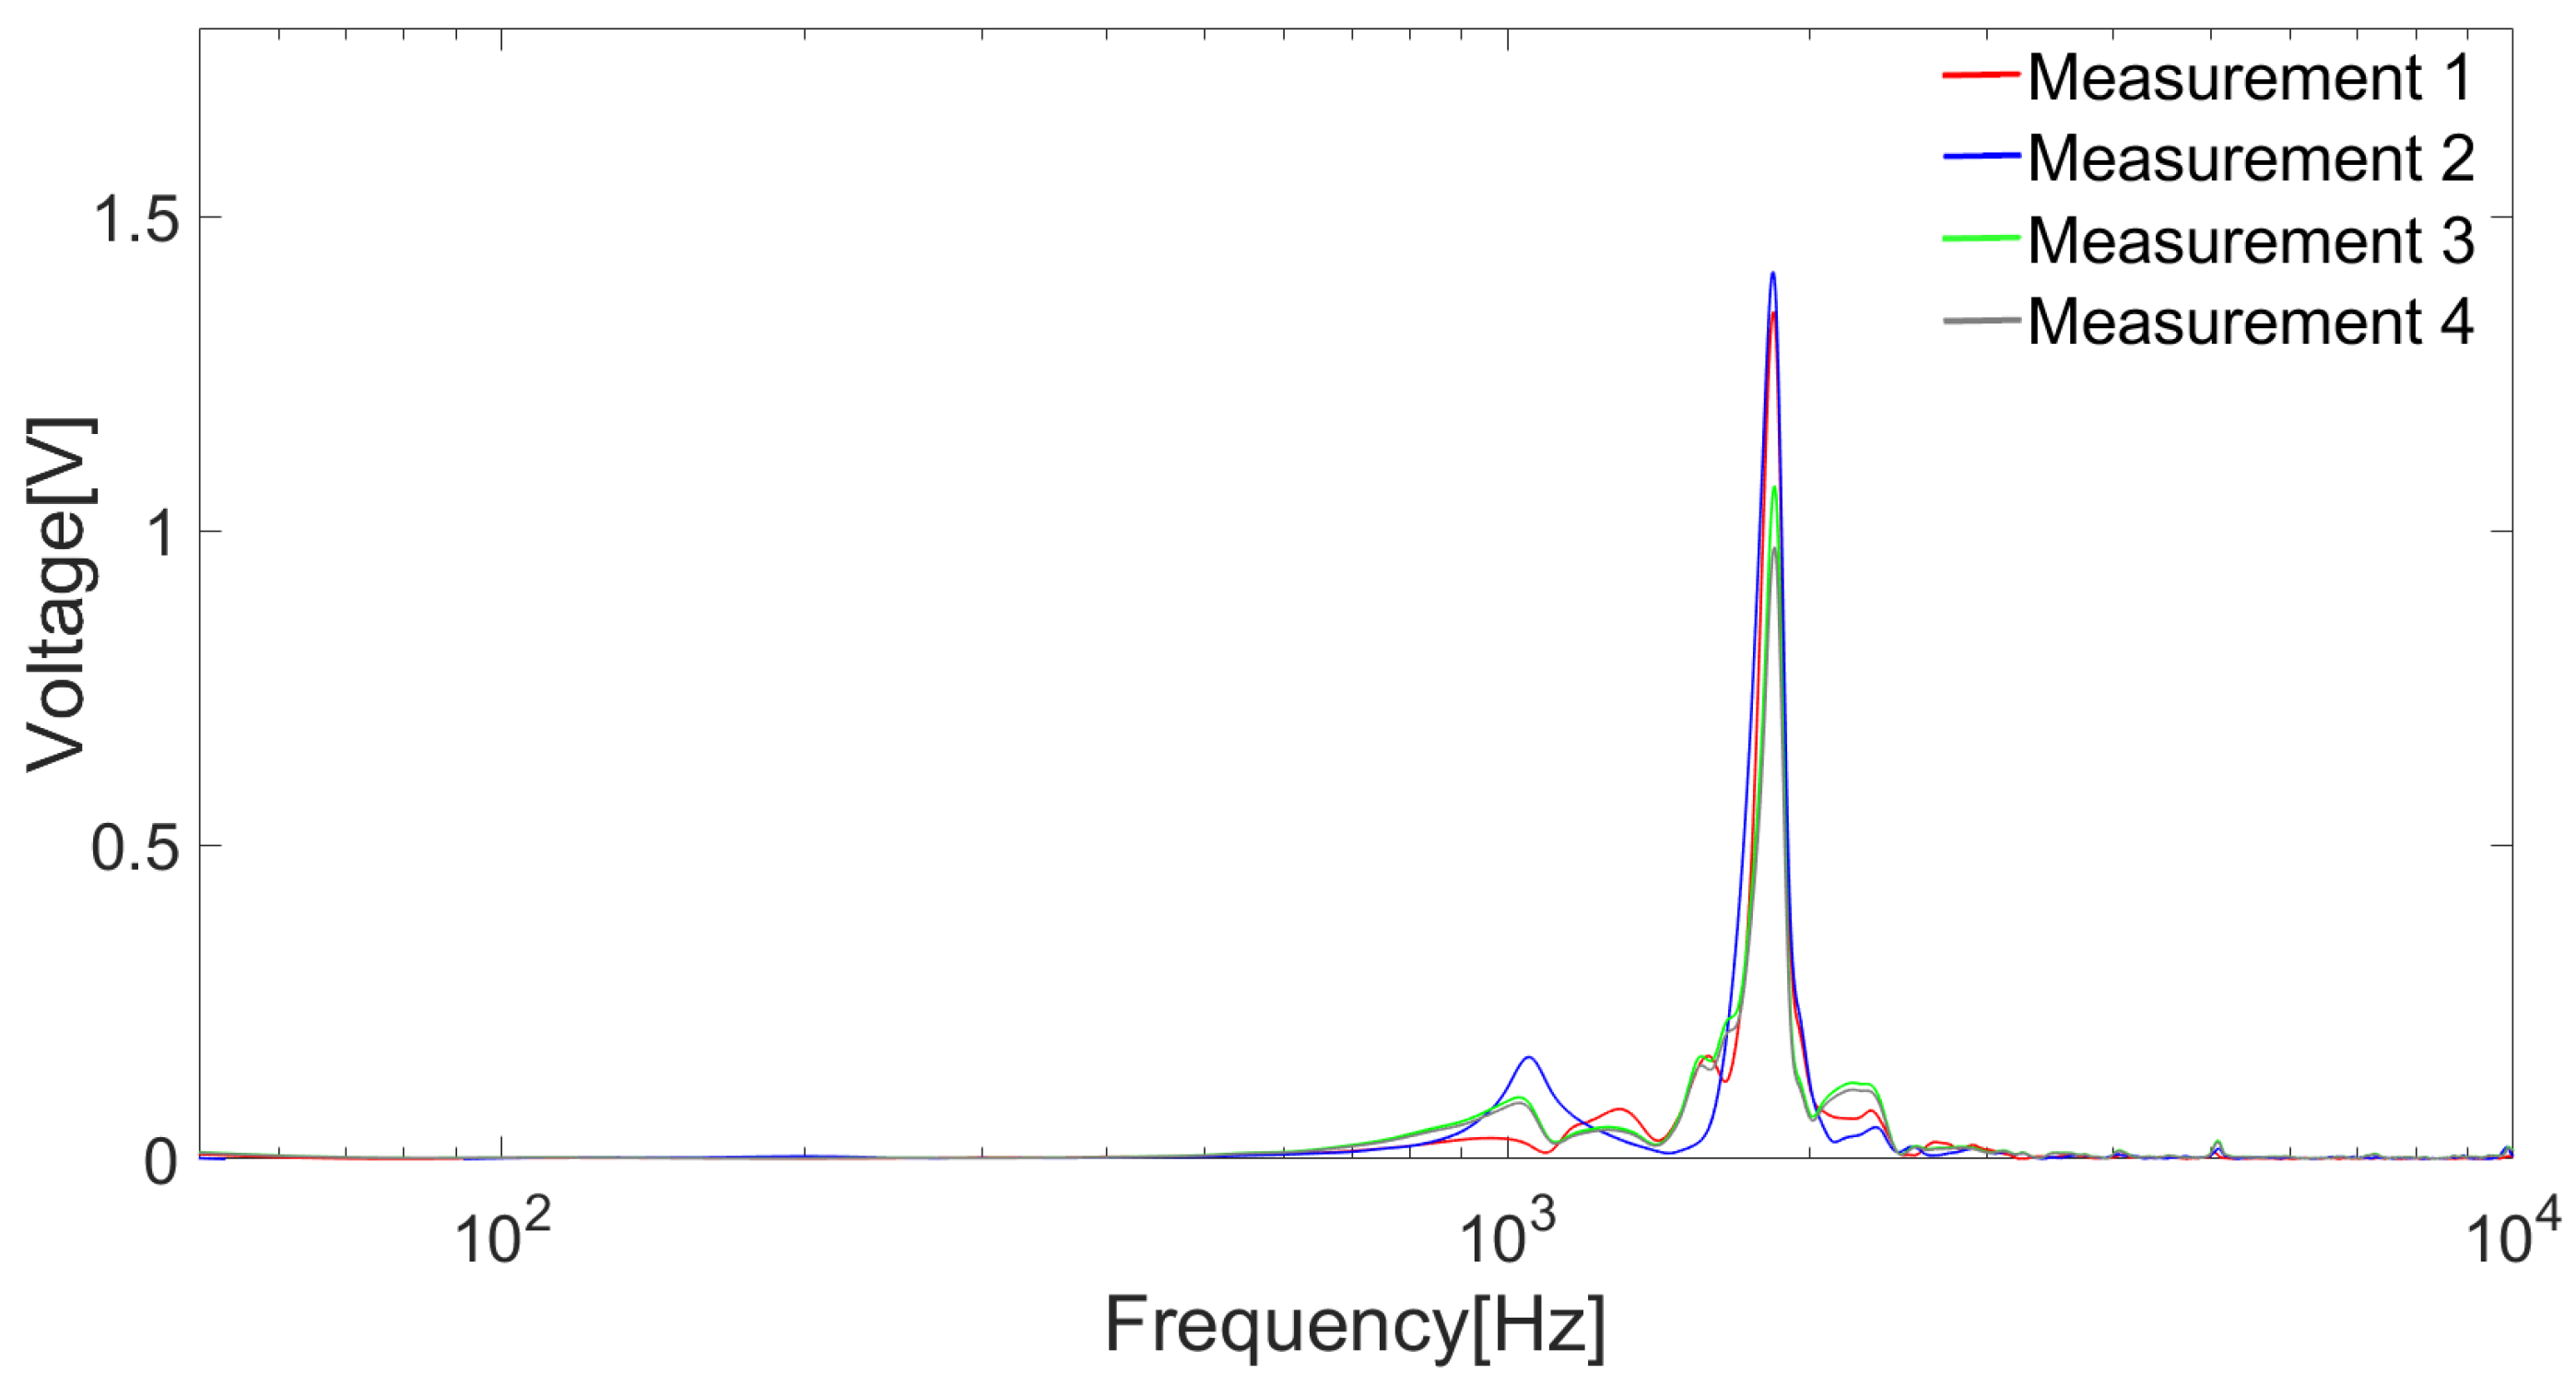
Figure 8 and
Figure 9 show the Fourier transform of four repeated measurements of the open-circuit output voltage of the piezoelectric cantilever beam of models A and B, respectively.
The peaks in the spectra correspond to the resonant frequencies of the piezoelectric cantilever beams, and for models A and B, respectively. The analytical values of the resonant frequencies, computed according to the well-known formula valid for cantilever beams, are and for models A and B, respectively. The overestimate of the analytical values is attributed to the fact that the bimorph beam is not perfectly clamped and that the actual mechanical and geometrical parameters of the beam may slightly differ from the ones employed for the computation.
Subsequently, the numerical analyses described in
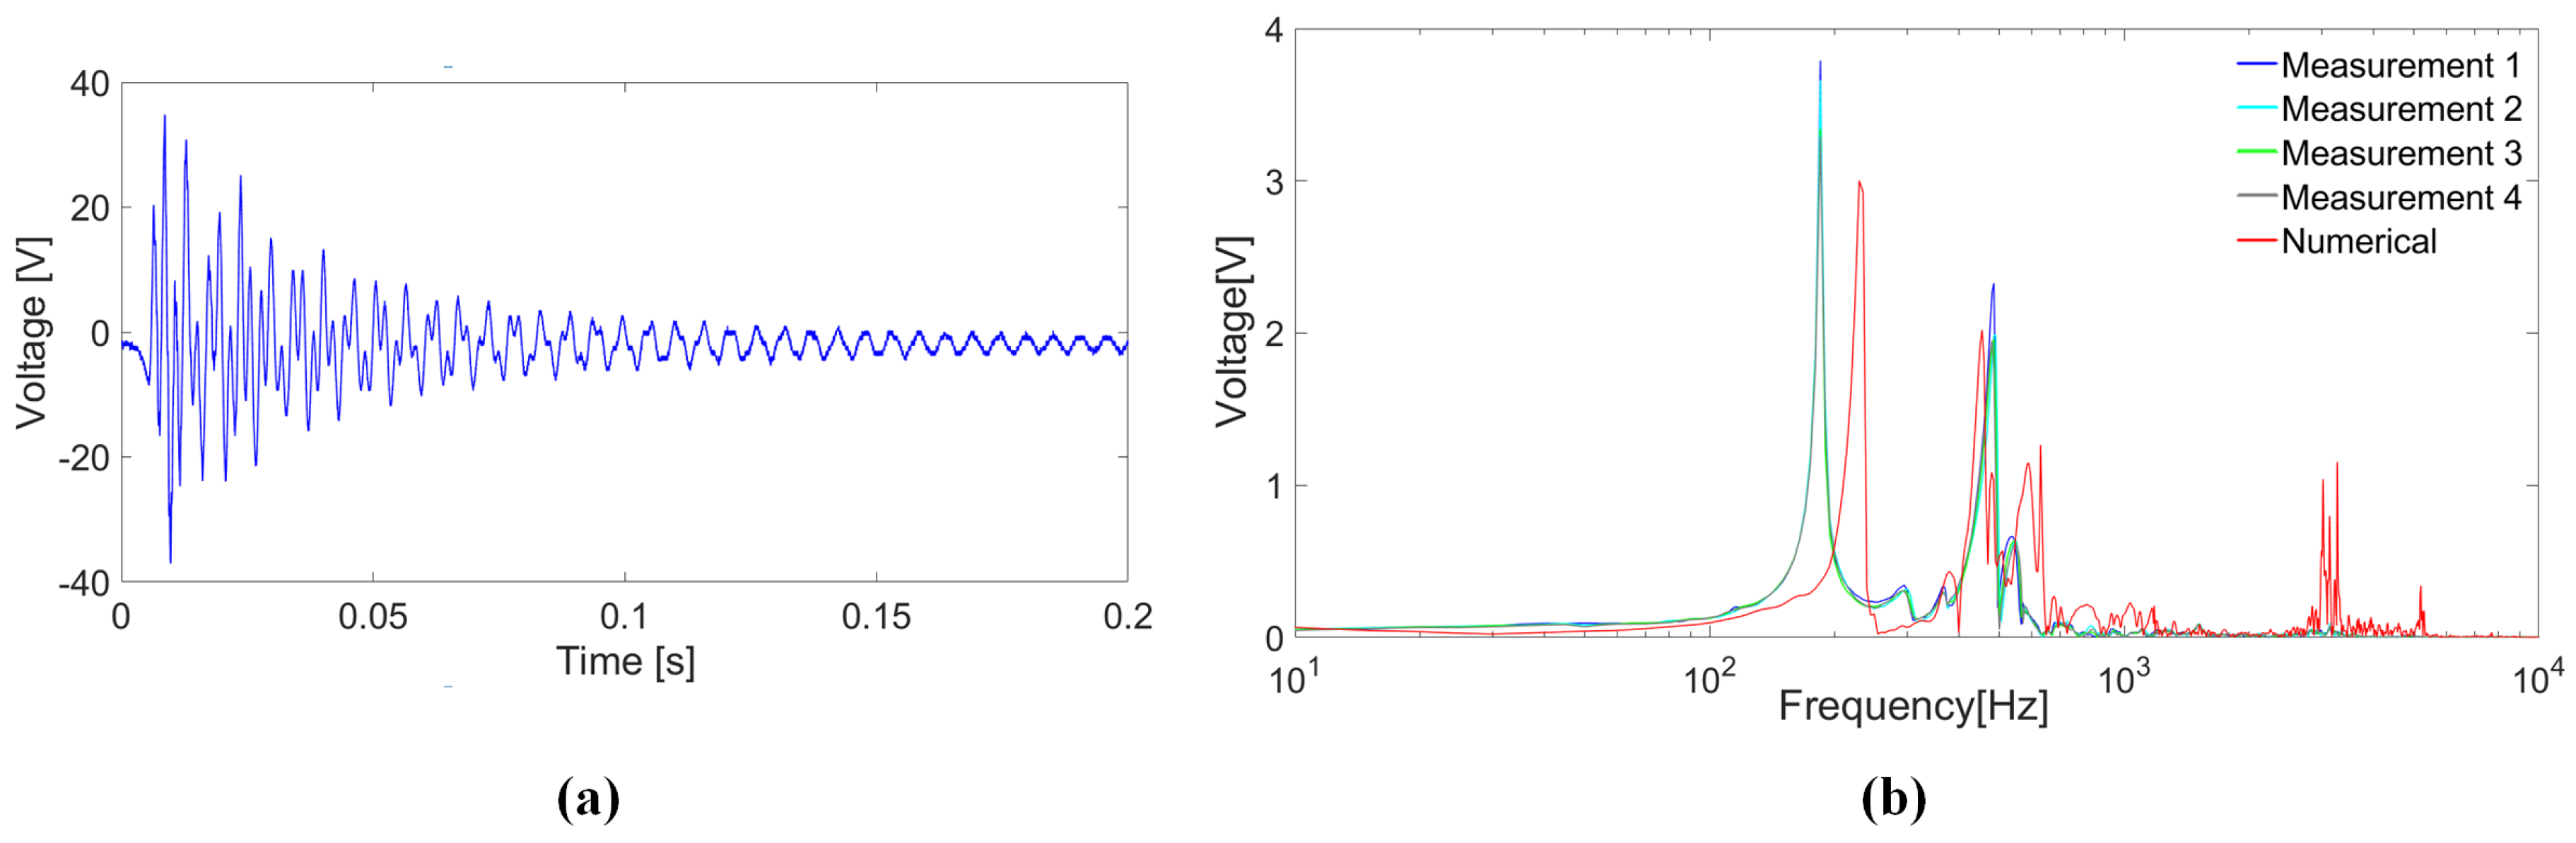
Section 4.1 are verified by different series of tests. In particular, the open-circuit output voltage arising from the oscillations induced by STB, which is triggered by manually displacing the bistable mechanism from the reversed to the initial undeformed configuration, is measured.
Figure 10a and
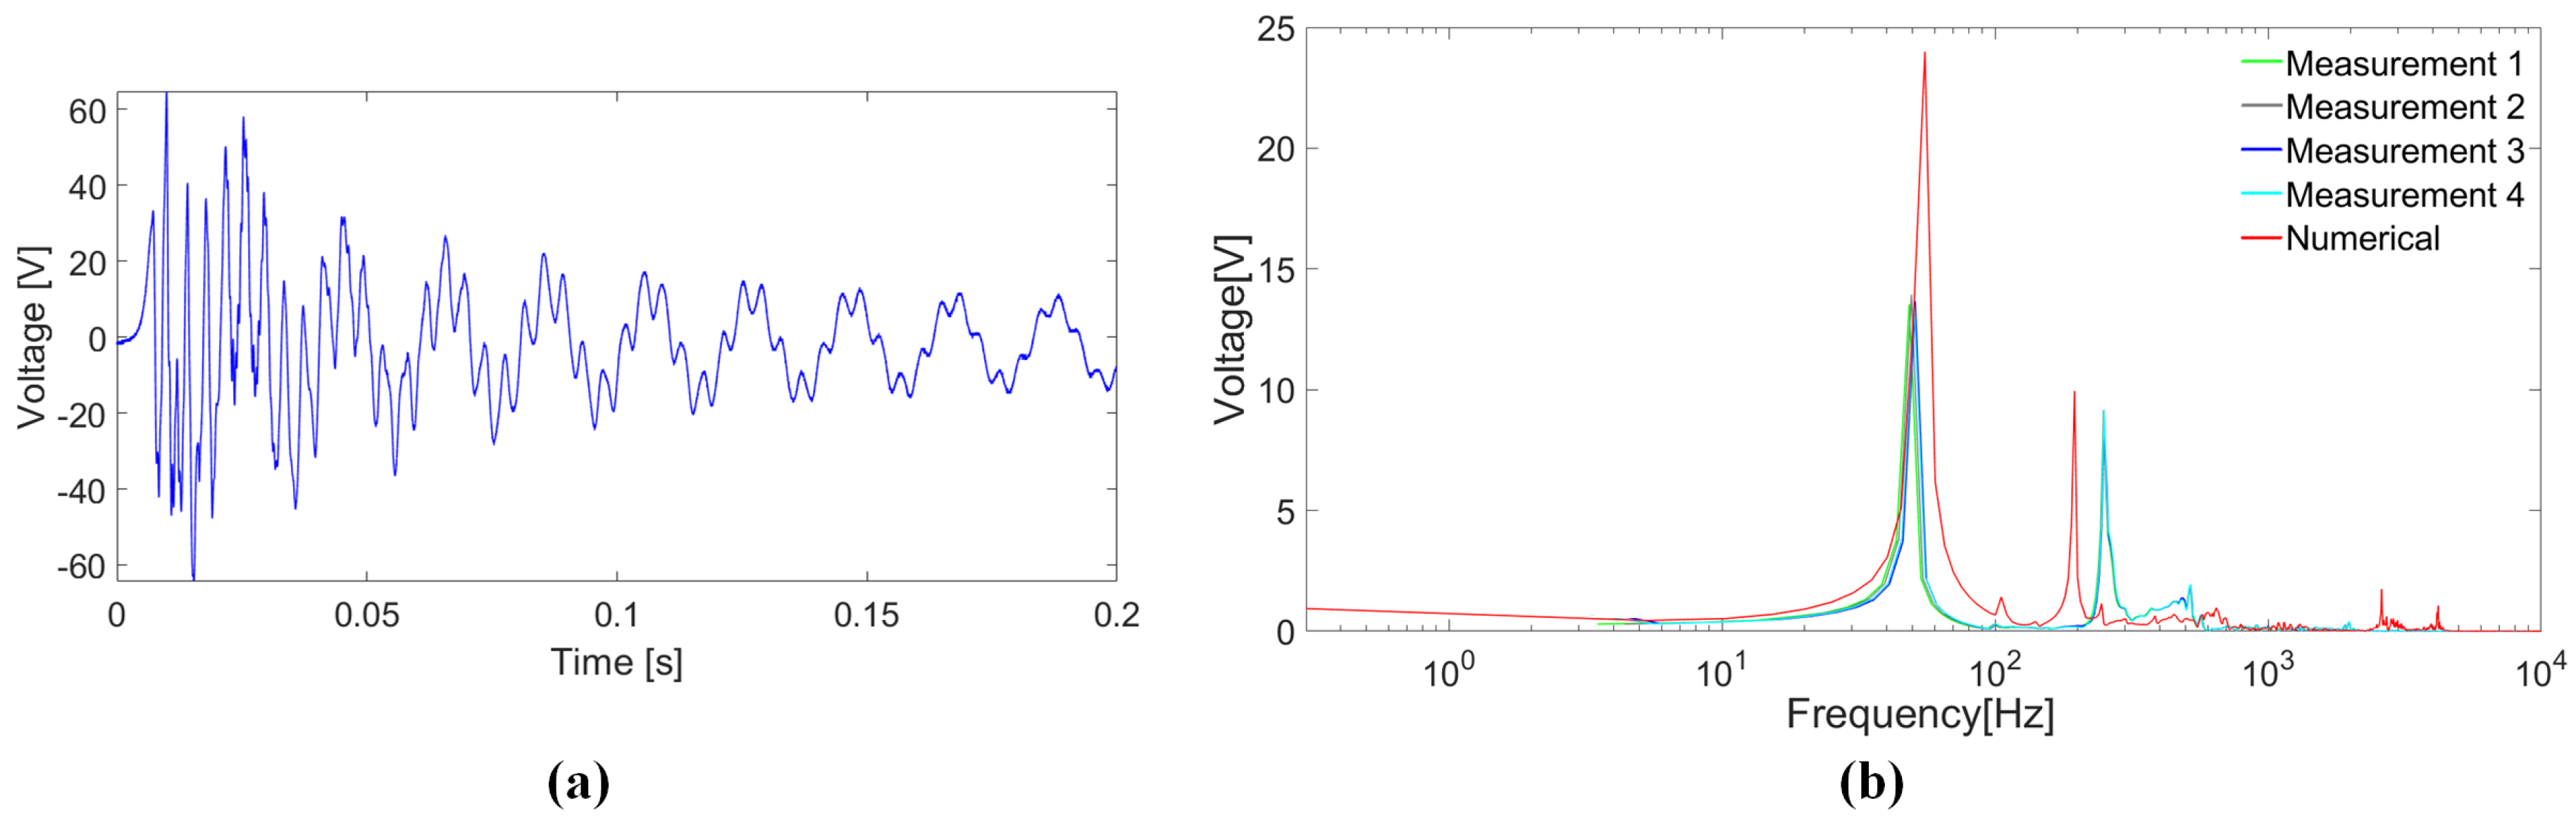
Figure 11a show the measured open-circuit output voltage obtained with the model A and model B, respectively.
The Fourier transform of four repeatead measurements for model A and model B are shown in
Figure 10b and
Figure 11b, respectively. The curves are characterized by two peaks for both models, which correspond to the two first global modes, namely those involving the motion of both the bistable mechanism and the bimorph beam.
Figure 10 and
Figure 11 also show the comparisons between the numerical and experimental results. In particular, a satisfactory agremeent is obtained, both in terms of frequency and magnitude.
With reference to model A, the resonant frequency () of the bimorph beam is higher than the two global modal frequencies and is hence far from being directly excited. Conversely, for model B, the resonant frequency () of the bimorph beam and the global frequencies are closer to one another, and consequently the induced oscillations and output voltage have higher amplitude.
The results shown in
Figure 10 and
Figure 11 refer to tests in which STB occurs from the reversed to the initial undeformed stable configurations. As explained by means of the numerical analyses, the curved beams of the bistable mechanism do not snap dynamically from the initial undeformed configuration to the reversed one and, in this situation, FuC does not occurr. The Fourier transform shown in
Figure 11b is characterized, in comparison with the one shown in
Figure 10b, by peaks at lower frequencies and higher values of voltage. These aspects are both due to the increase of mass caused by the presence of the lead sphere on the bimorph’s free edge in model B, which causes the reduction of the global modal frequencies and the increase of the compliance of the beam.
4.3. Experimental Characterization of the STB-EH Prototype Connected to a Resistive Load and to a Rectifier Circuit with Storage Capacitor
The tests described in the previous section aim at the characterization of the STB-EH prototype in the open-circuit situation, considering the manual activation of the bistable mechanism. An additional set of experiments is devoted to the investigation of the performances in the presence of an electrical load. As before, the bistable mechanism snaps from the reversed configuration to the inital undeformed one; two kinds of external circuits are considered, namely: a resistive load and a full-wave bridge rectifier circuit connected to a storage capacitor.
Model B is considered, since the experimental tests, reported in
Section 4.2, confirm that it is the most promising configuration. The STB-EH prototype is characterized connecting a resistive load
to the bimorph beam. The voltage across the resistance is measured after snap occurs, and the extracted power is computed according to the Joule’s law. Several experiments are executed with different attached resistances, in order to find the optimal value of
that gives the maximum value of the instantaneous power.
Figure 12 shows that the instantaneous power has a maximum value of 4 mW for
, which represents the optimal value for the free vibration of the STB-EH prototype after the snap. In this situation, the average power is computed as follows:
The corresponding energy, evaluated over a period of 190 ms, is
. For the sake of comparison, the energy barrier to activate the snap from the reversed to the initial configuration can be measured in
Figure 6 and it is equal to
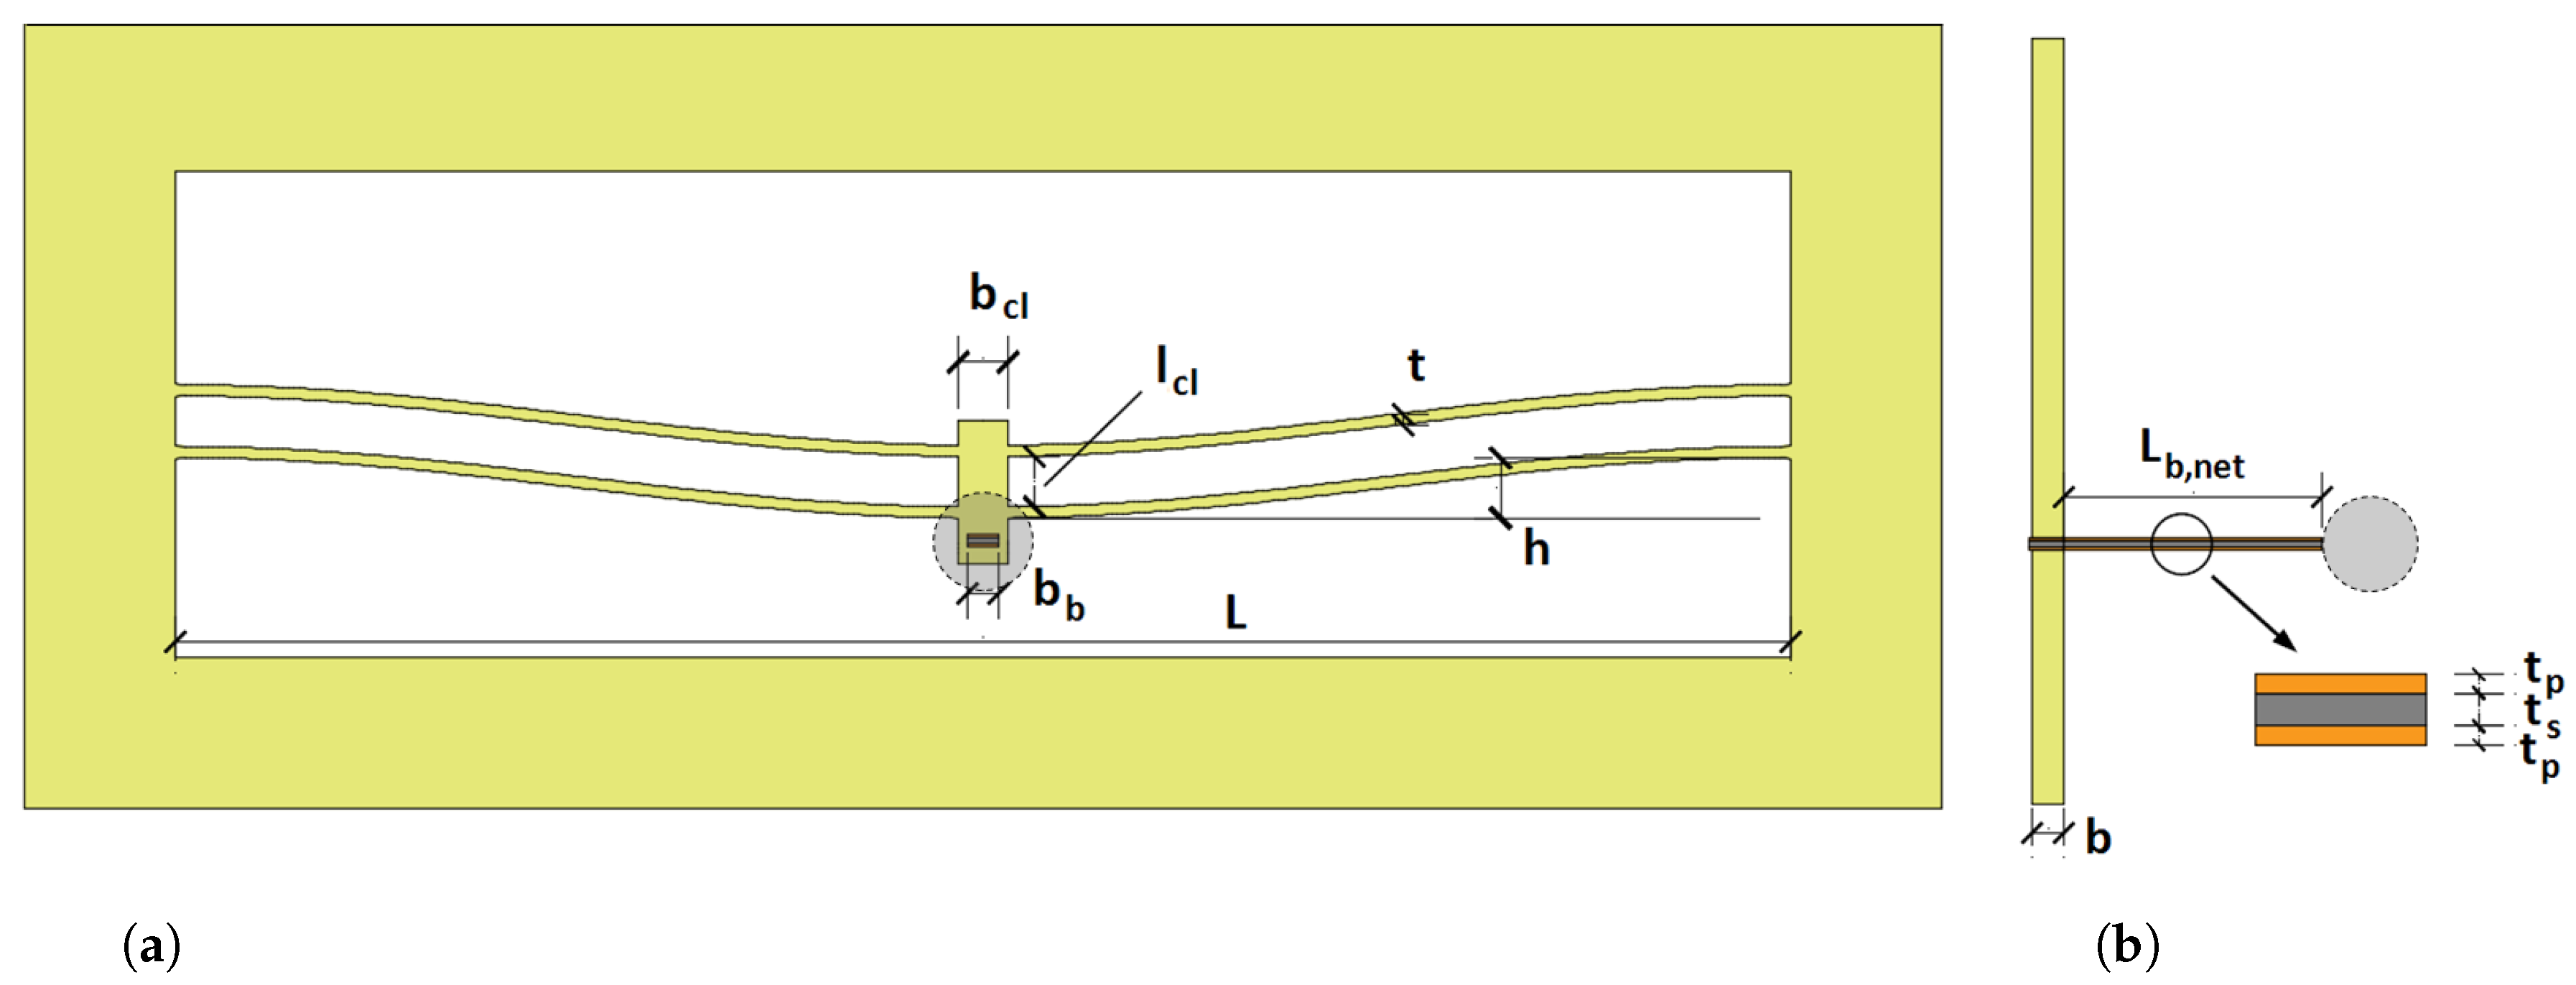
. Therefore, the harvested energy for a single snap is about 8.84% of the energy that is needed to activate the snap. The average power can be used to compute the power density, with respect to the volume of the active material. On an account taken of the geometric features summarized in
Table 1b, one finds that the power density is 9.11 mW/cm
. Such a value is in agreement with the data reported in [
37], where the median power density, over a set of 29 harvesters proposed in the literature, is 5.4 mW/cm
.
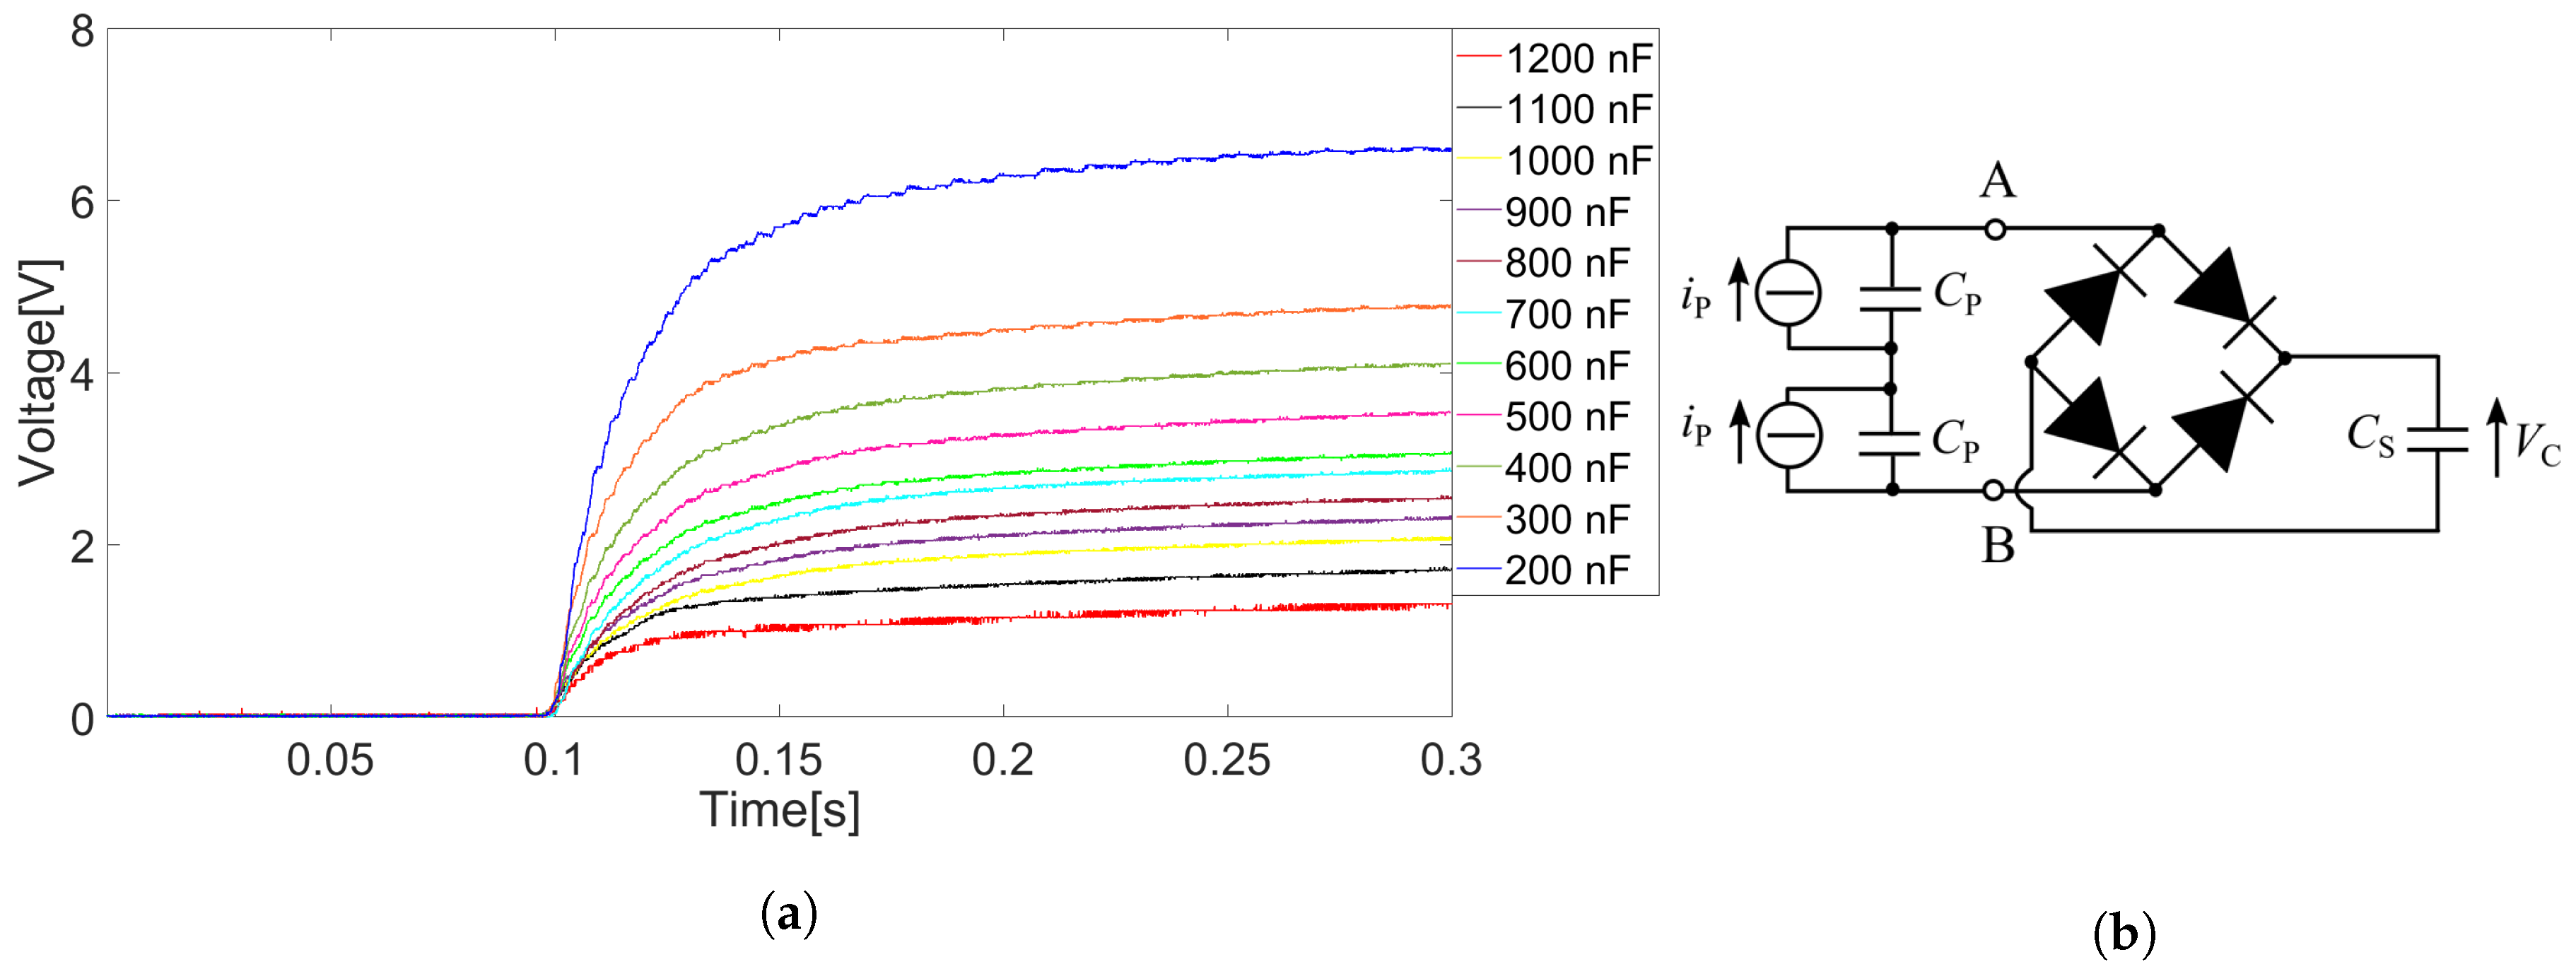
Subsequently, the output of the bimorph beam is connected to a circuit composed of a full-wave bridge rectifier and a storage capacitor, with capacitance
. For the rectifier, p-n diodes 1N4148 have been used. The energy
W stored in the capacitor is computed as:
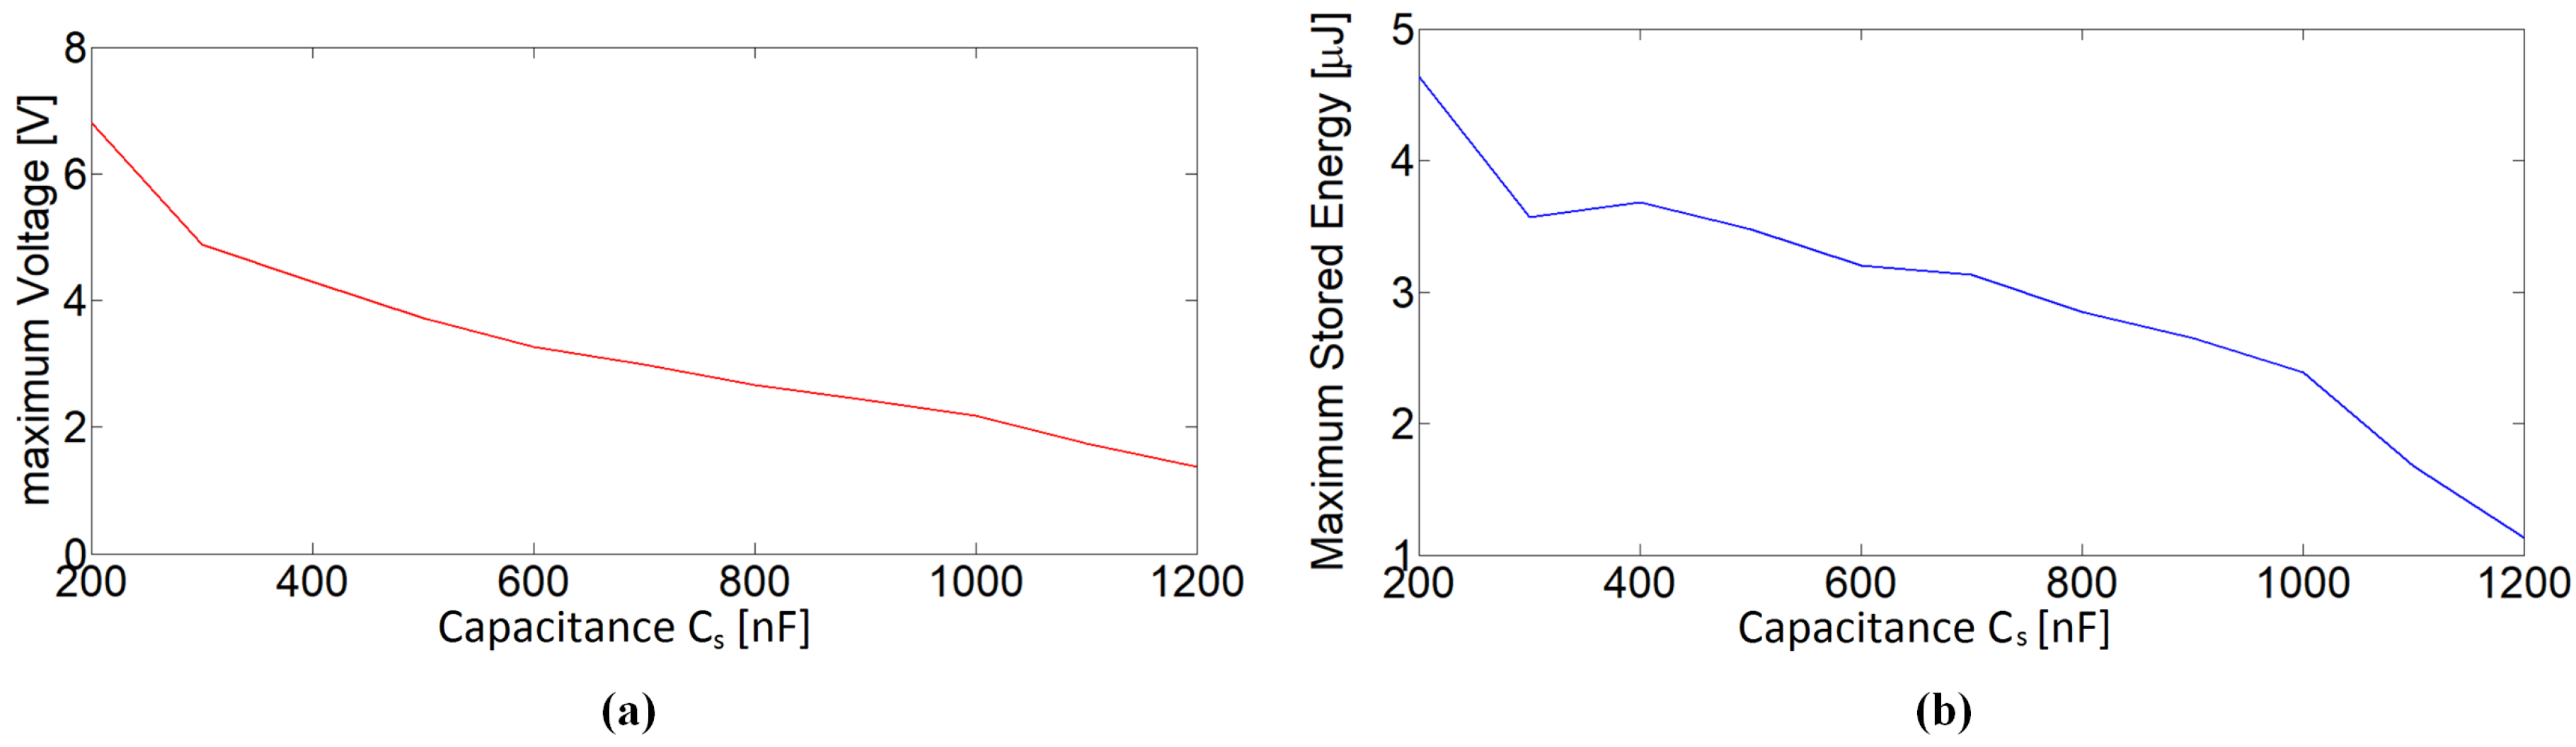
Figure 13a shows the voltage across the capacitor measured after triggering the snap from the reversed configuration to the initial undeformed one for different values of the capacitance. After the snap, the voltage exponentially increases, and the lower the value of capacitance, the lower the time constant, and the higher the voltage, as expected.
Figure 14 shows the values of voltage and stored energy measured
s after the snap for each capacitance value. The maximum stored energy,
, is about 2.28% of the mechanical energy that is needed to activate the snap.
4.4. Experimental Characterization of the STB-EH under Sinusoidal Excitation
Finally, to explore the response in case of an external acceleration history, the prototype is tested on an electrodynamic shaker (Bruel and Kjaer Vibration Exciter 4808). The acceleration necessary for the STB from the reversed to the initial configuration is excessive for the shaker capability, since, for model B, it exceeds 20 g. To carry out the experimental test, it is possible to introduce a modification of the prototypes to increase the overall mass without affecting the dynamic response of the cantilever. Consequently, a metal washer, with mass equal to 3.8 g, is added in a symmetric fashion on the central block of the bistable mechanism: the final experimental configuration is shown in
Figure 15. Focus is again restricted on model B, modified with the addition of the washer. The additional mass does not alter the vibration of the piezoelectric cantilever; moreover, it does not affect significantly the first eigenmode. The mass is increased in order to reduce the acceleration necessary for the STB from the reversed to the initial configuration. On the other hand, the introduction of the washer is detrimental for the performance of the STB mechanism, since a part of the released elastic energy is converted into kinetic energy of the mass which do not participate in the motion of the piezoelectric cantilever. As a consequence, performances are expected to be lower than reported in
Figure 11.
The prototype is pre-deformed so that the reversed configuration is achieved. Subsequently, the structure is excited with different time histories of acceleration, changing the frequency, the amplitude, and the shape of the signal. In the case of sinusoidal acceleration at frequencies well below the first eigenmode of the device, as long as the peak amplitude is lower than 2 g, STB does not happen and the measured voltage is negligible. The peak amplitude of 2 g is sufficient to pass over the energy barrier of the bistable mechanism and to trigger the FuC. This value of acceleration is lower than expected: such a difference can be explained in view of the uncertainties in the constitutive law of FR4 and the relevant properties. Nonetheless, the low-frequency, low-amplitude applied acceleration history is enough to trigger the STB of the bistable mechanism from its reversed configuration to the initial undeformed one. Hence, the bistable mechanism is less stable in its reversed configuration than assessed numerically, namely it is characterized by a lower absolute value of
than the one indicated in
Figure 6.
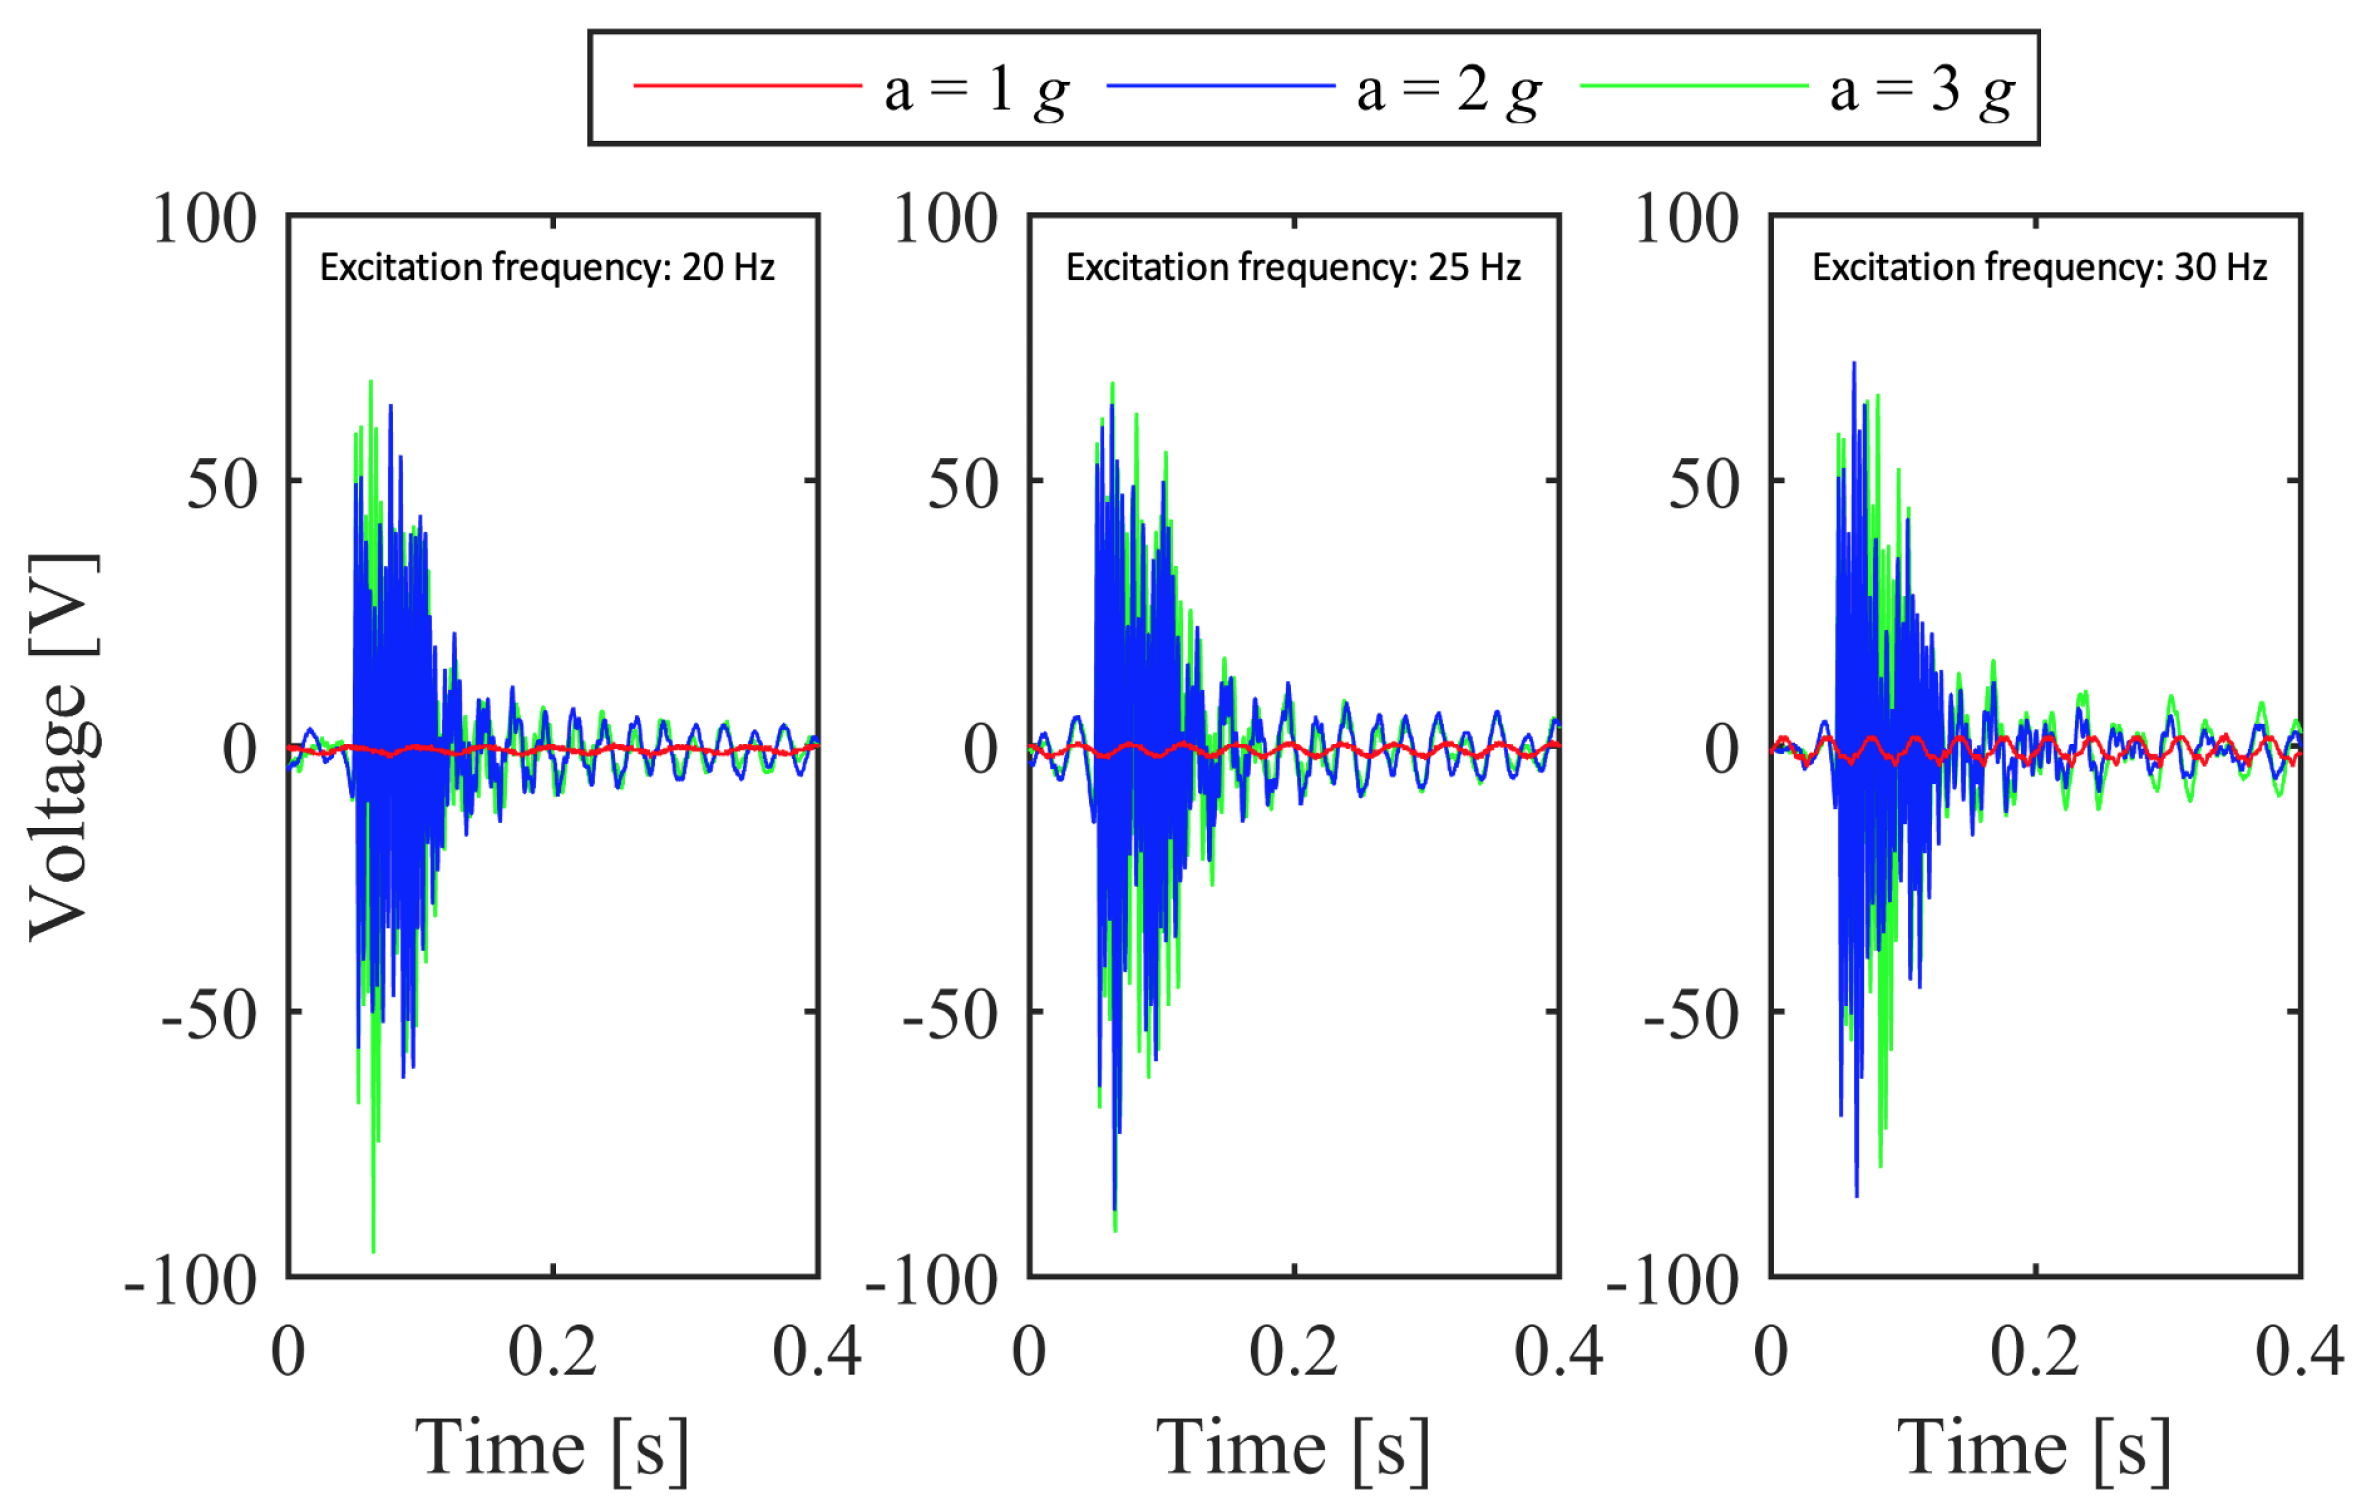
Figure 16 shows the open-circuit voltage, for sinusoidal accelerations with frequency 20 Hz, 25 Hz and 30 Hz, with different peak amplitude, namely 1 g, 2 g, and 3 g. When the peak acceleration is larger than or equal to 2 g, FuC is triggered and the open-circuit voltage attains peaks that are comparable with the case of
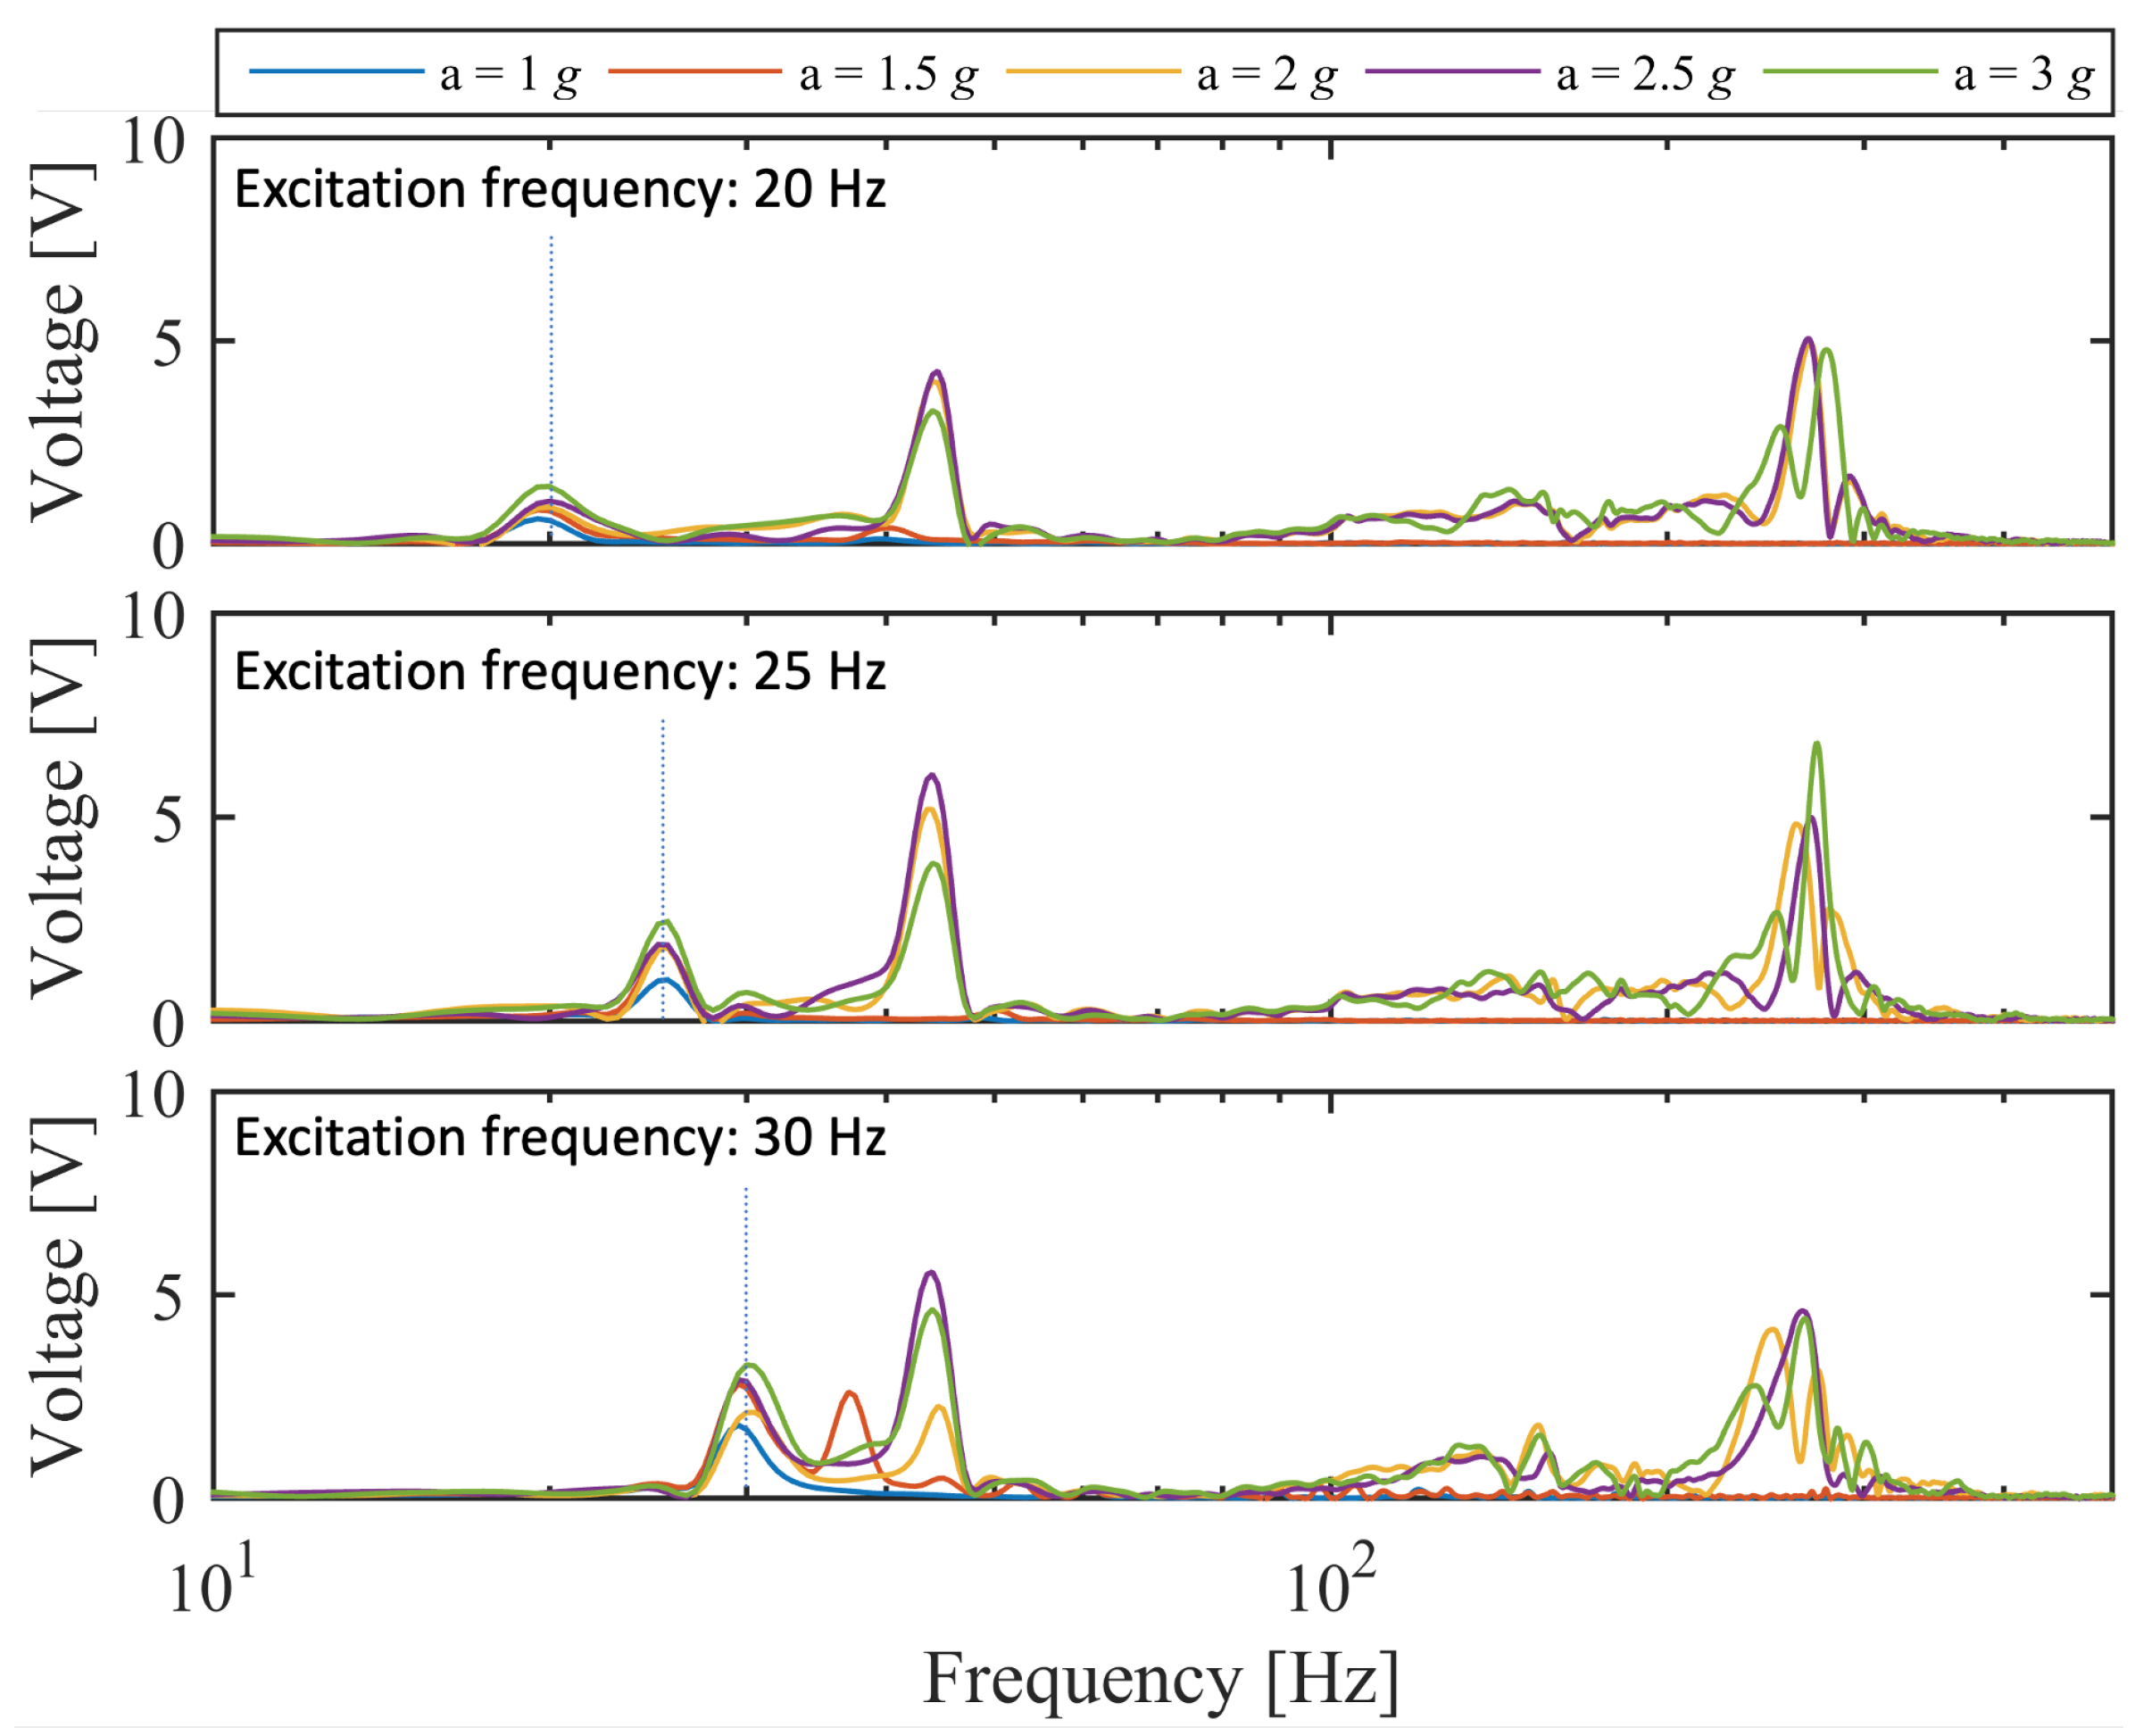
Figure 11, where STB is provoked manually. The achieved results confirm that, if the input signal is able to pass over the energy barrier of the second stable configuration, the occurence of STB adds high frequency components in the frequency spectrum of the output signal, in spite of the low-frequency input excitation, as shown in
Figure 17. The output voltage is distributed over a frequency band that is broader than the previous cases. Other tests are carried out, by attaching the piezoelectric material to a resistive load
, so that the extracted power can be computed on the basis of the recorded voltage and of Equation (
4).
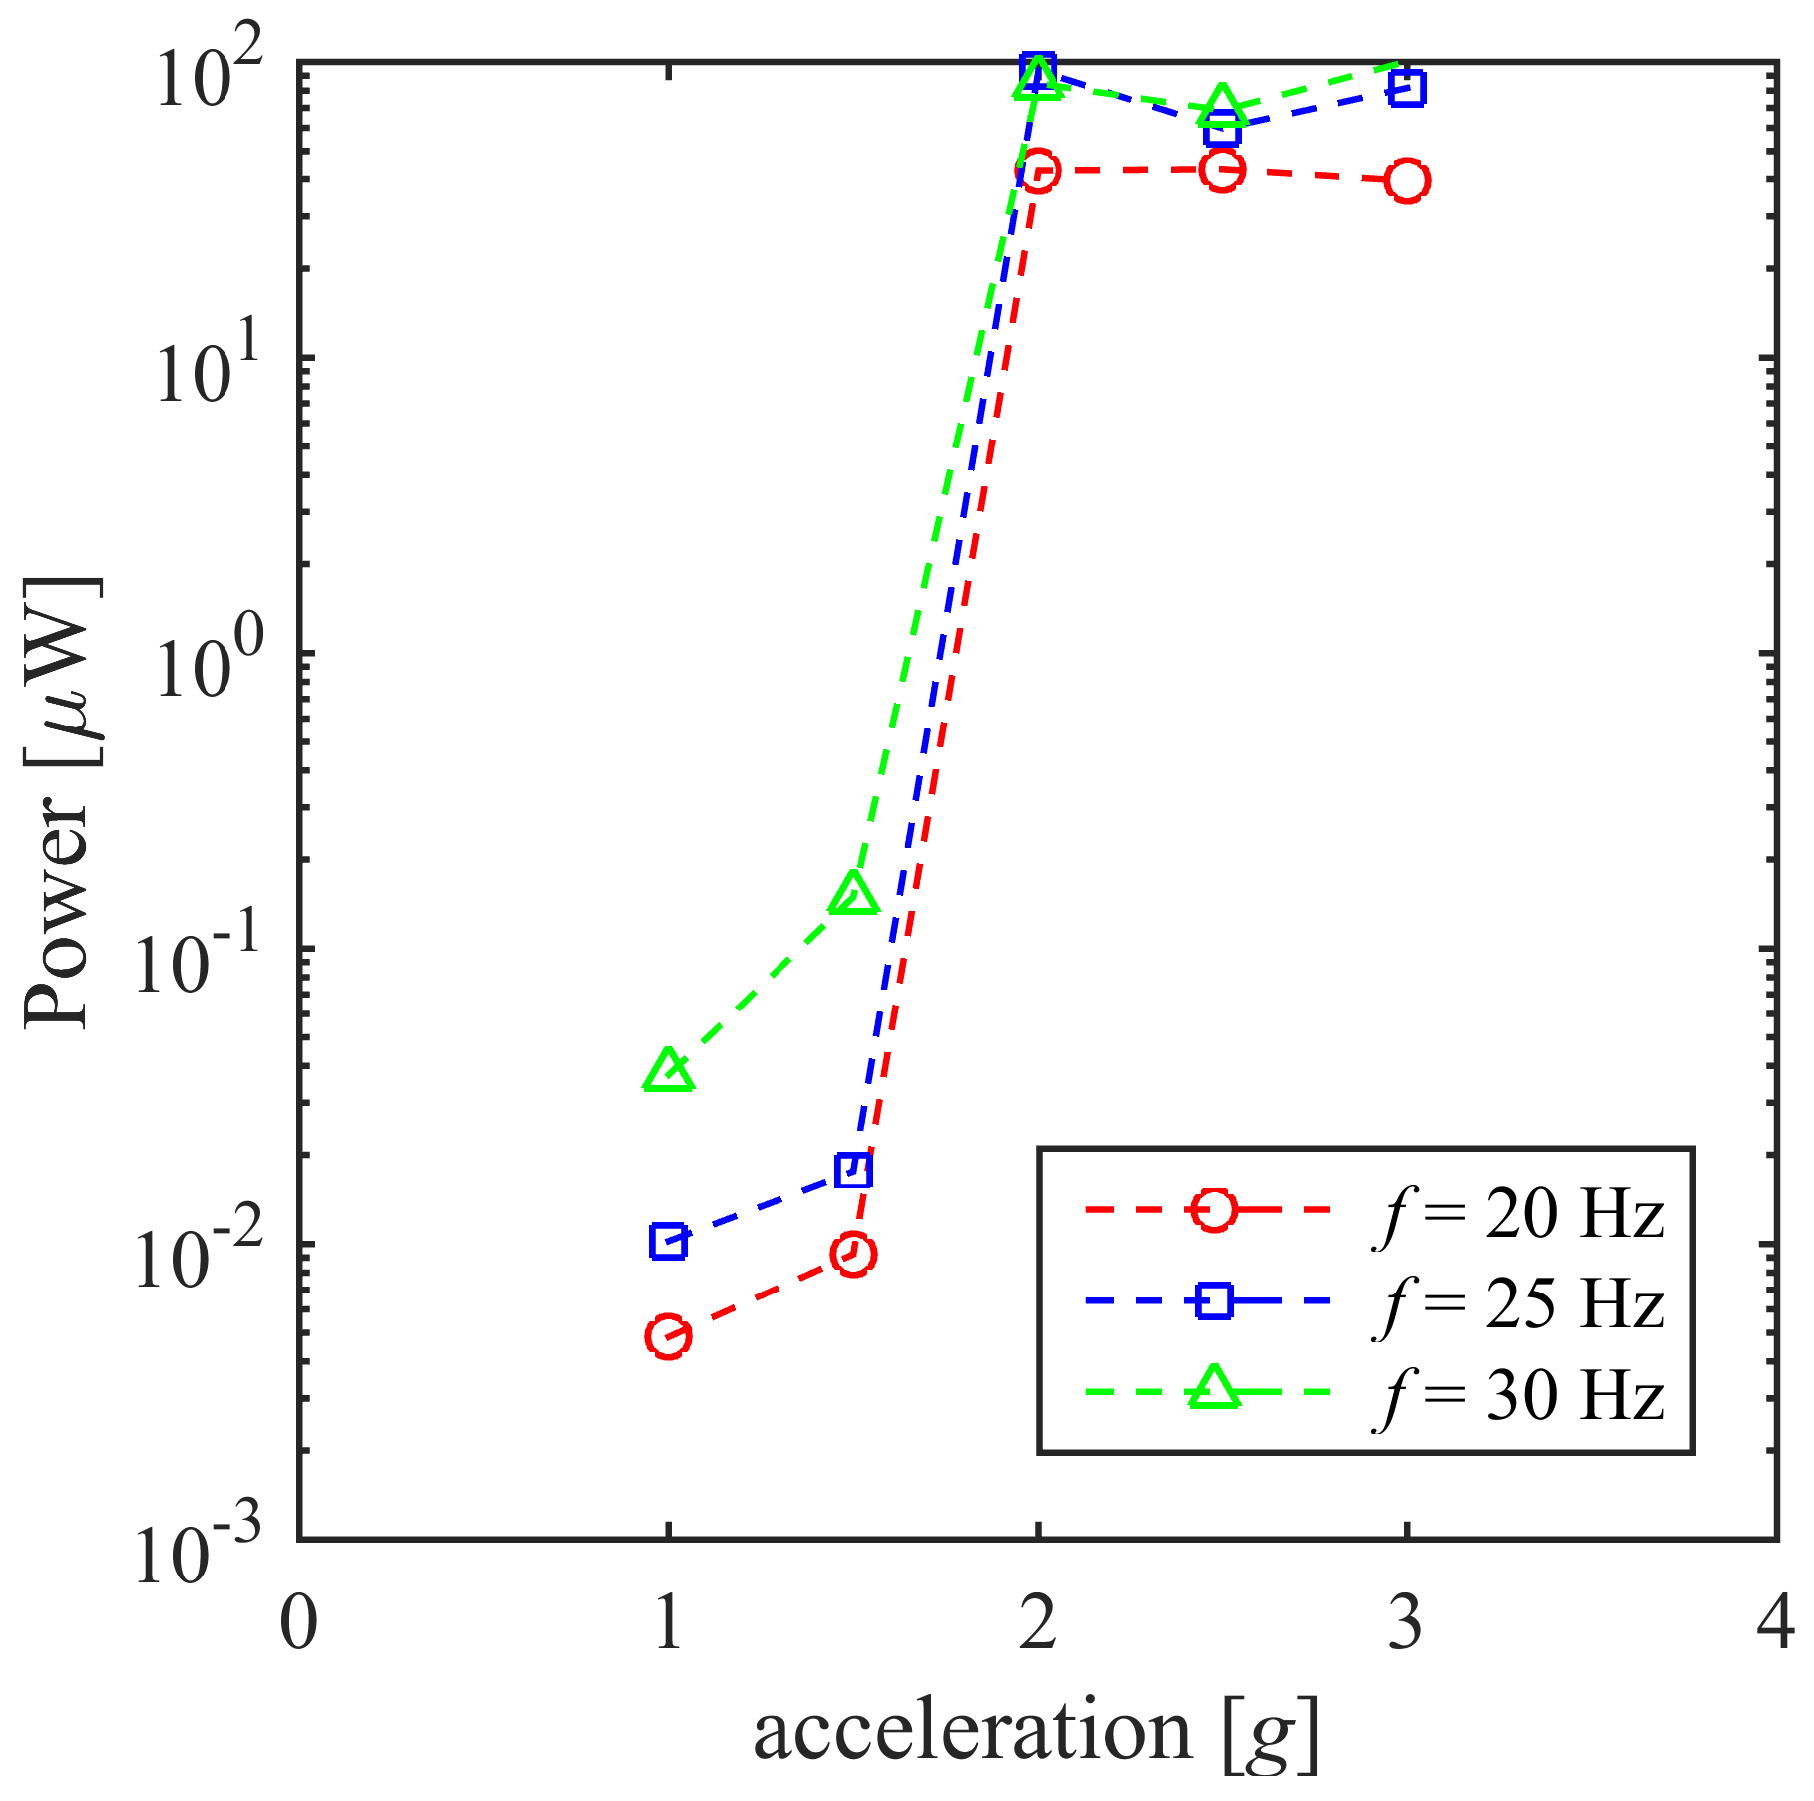
Figure 18 shows the average power that is obtained for different frequencies and peak accelerations. The results confirm that, for peak acceleration lower than 2 g, the average power is neglibible, since STB does not occur. When the peak acceleration attains the STB threshold, the average power attains values similar to the case shown in
Section 4.3. Peak accelerations larger than 2 g are considered as well: since the energy barrier is passed for 2 g, the same happens, a fortiori, for accelerations beyond that threshold and the extracted power does not change significantly.


 ,
, 


