Systematic Mapping Study on Remote Sensing in Agriculture

 ,
,  ,
,  , and
, and 
Abstract
:1. Introduction
- Type of platform where the sensor is mounted: in-field systems, ground vehicles, aircraft or satellites.
- Wavelengths of the electromagnetic spectrum that are captured; most frequently, they include visible, infrared, ultraviolet and microwaves.
- Number and width of the spectral bands captured: panchromatic (a single wide band), multispectral (a small number of broad bands), and hyperspectral (many narrow bands).
- Spatial resolution, measured in meters per pixel, which can be roughly classified in high (less than 1 mm for in-field cameras), medium, and low (around 1 km in some satellites and bands).
- Temporal resolution, i.e., capture frequency of the system, which can range from real-time (in-field cameras) to several weeks (in some satellites).
- Radiometric resolution, i.e., the number of bits per pixel and band (typically 8, 12, or 16 bits), and the source of energy (passive sensors or active sensors).
- Artificial Neural Networks (ANN). ANN models have shown great potential in various RS applications in PA. For example, Hassan-Esfahani et al. [66] used an ANN to compute surface soil moisture. Poblete et al. [67] developed an ANN system to predict vine water status. In [68], the authors used ANNs to separate maize plants from weeds.
- Support vector machines (SVM), naïve Bayes classifier, and k-mean clustering. These methods have also been applied in different areas of agricultural machine learning systems. Sannakki et al. [69] proposed a SVM classifier to detect diseases in pomegranate leaves at an early stage. Mokhtar et al. [70] presented a SVM-based technique for detecting diseases in tomato leaves. k-Nearest neighbors algorithm (kNN) was used in [71] to classify large agricultural land cover types. A system to discriminate weeds from crops using naïve Bayesian classifiers is presented in [72]. Moreover, in [73], Mondal et al. proposed a naïve Bayes classifier to detect gourd leaf diseases using color and texture features.
- Deep Learning (DL). The use of DL in agriculture is a recent and promising alternative to traditional methods [74,75]. It has been used in several applications in the domain of PA. For example, a fully convolutional neural network for mapping weed is used in [76]. Castro et al. [77] used a CNN model for the classification of crops using multitemporal optical and SAR data. Mortensen et al. [78] addressed the problem of segmenting mixed crops applying CNN methods. dos Santos Ferreira et al. [20] proposed a deep learning-based CNN algorithm to classify weeds from grass and broadleaf. Moreover, Kussul et al. [79] dealt with the crop mapping problem using a multi-level DL network.
2. Research Methodology
2.1. Formulation of the Mapping Questions
2.2. Definition of the Search Strategy
2.3. Study Selection
- EC1. Editorial papers, papers about colloquium and international meetings, and summer school papers.
- EC2. Papers that have a citation ratio of less than 6 citations per year.
2.4. Data Extraction Strategy
- MQ1. To answer this question, the publication source and channel for each paper should be identified. The channel can be classified in journals, books, and conferences. The source refers to the name of the corresponding journal, book, or conference.
- MQ2. In order to draw conclusions about the publication trends, articles should be classified per publication year. Therefore, this question extracts the year of each paper.
- MQ3. Research works can be of different types, for example, a paper can propose new methods and techniques, it can evaluate existing solutions in a new application, or it can describe a specific experience that could be useful for other researchers. According to the authors of [88], the types of research can be classified into the following categories.
- -
- Evaluation Research. In this case, the research consists of the evaluation of an approach in RSA. This class also includes identifying new problems in RSA.
- -
- Solution Proposal. Research works which involve proposing a new solution for an existing problem in RSA. The proposed approach must be new, or it can be relevant modification of some existing method. An extensive experimentation is not required.
- -
- Experience Papers. These articles describe the personal experience of the authors. The paper explains what has been done and how it has been done in practice, and the obtained results.
- -
- Other. Other types of research can include, for example, reviews, opinion papers, etc.
It is also possible to find some papers that can be classified into different categories, for example, an article can propose a new technique and perform an extensive experimental validation. - MQ4. Most of the research works are expected to have an empirical validation of the theoretical advances and proposals. These experimentation can be done in different ways. According to the authors of [89], the empirical research types can be classified into the following.
- -
- Case study. It is an empirical inquiry that investigates a phenomenon in its real-life context. One or many case studies can be described.
- -
- Survey. A survey is a method for collecting quantitative information related to aspects in RSA research, for example, through a questionnaire.
- -
- Experiment. This case refers to an empirical method applied under controlled conditions to observe its effects and the results of certain processes or treatments.
- -
- Data-based experiments. This is a different case from the previous category, as the research does not involve new experiments, but the data available from previous experiments is used. It can be either a public or private database.
- -
- Other. Other types can include meta-analysis, history-based evaluation, etc. It is also possible that some papers do not report any empirical validation.
- MQ5. Another interesting aspect to analyze is the type of techniques that are used in the papers, that is, the computer vision or machine learning tasks that are addressed in [14]. Many different classifications can be found in the literature. Following the work in [82], in the present review, the techniques are classified as follows.
- -
- Image preprocessing and segmentation. Although they are different problems, the two are closely related since the input are images and the output are also images. Besides, they are typically the first steps of many computer vision systems. Image preprocessing includes the techniques whose purpose is to improve the quality of the images captured [90], e.g., to remove noise, enhance image contrast, correct geometric deformations, or remove artifacts. Image segmentation consists in separating image regions in different categories [78], e.g., separating plants and background, or detecting the regions of a crop of interest. Segmentation can be considered a result by itself, or it can be the input for further processing.
- -
- Feature extraction. Most frequently, after segmenting the regions of interest in the images, a set of features are extracted from them, although it can also be applied to the entire image. Feature extractors are a set of techniques to obtain relevant and high-level data from the images. The most usual types of features in RSA are color, texture, shape, and spectral features [91]. In many cases, the features are not explicitly predefined by the human experts, but they are given by a machine learning algorithm [75]. The extracted features can be used later for computing parameters of interest from the images, such as the water stress of the plants, or the crop yield.
- -
- Similarity measures and maximum likelihood. Most empirical research has been dedicated to find effective similarity measures on the extracted features. Then, the similarity values can be used in a maximum likelihood approach [92]. This can be used, for example, to predict the evolution of a certain crop from other previously observed cases with similar characteristics.
- -
- Classification systems. Given an image, or an image region, classification consists of determining the most likely class among a predefined set of classes [32,39,40]. For example, it can be used to classify a segmented region of plants in crop or weed, it can be used to classify a plot in dry land or irrigated, or to classify a fruit in unripe/ripe/overripe. Common classifiers used in RSA include support vector machines (SVM) [69,70], decision trees (DT), and artificial neural networks (ANN) [52], although they can also be used in the other problems.
- -
- Recognition systems. The purpose of a recognition system is to find the specific identity of the object of the given class. For example, a segmentation step can be used to separate an image in plant/background; then, a classifier is applied to find if a plant region is a tree, a grass or a weed; finally, the recognition step would determine the specific type of tree, grass, or weed [77]. Obviously, a recognizer should not be prepared to deal with all the instances from all the classes, but only for those species of interest that have been trained.
- -
- Other machine learning algorithms. In this category we include additional applications of machine learning algorithms [14]. These can include regression algorithms (e.g., for estimating the crop evapotranspiration), decision support systems (e.g., for deciding the fertirrigation schedules), or methods to automatize different processes (e.g., harvesting or fumigation machines).
A complete computer vision system in agriculture should include many (if not all) of these techniques. Therefore, the papers have been classified according to the area where the most important contributions are done, although they could be classified into different categories. - MQ6. The platforms typically used to capture the images in agriculture are highly diversified [93]. They can be classified according to different criteria, such as the type of information captured (spectral or depth maps), the spatial, spectral and photometric resolution, or the type of cameras. However, they are most commonly classified considering the type of vehicles or devices in which they are mounted [80]. The main categories are listed as follows.
- -
- Satellite imagery. They are characterized for offering images of very large areas, with lower temporal resolution compared to the other platforms [94,95]. The high cost of this kind of device places them beyond the reach of farmers, being controlled by governmental or international institutions. However, in many cases, these organizations provide free access to the obtained satellite images for research purposes. Another characteristic of satellites is that most of them are equipped with multispectral or hyperspectral cameras [96].
- -
- Drones, UAVs, and manned aircraft. The use of these types of devices in agriculture has experienced a huge growth in the last decade [18]. In general, an aircraft is any vehicle which is able to fly. When they include a human pilot, they are referred as manned aircraft, while the term Unmanned Aerial Vehicle (UAV) is used when the vehicle can fly remotely (controlled by a human) or autonomously (without human control) [81]. The term drone is normally used as a synonym of UAV; however, it can also be used for other types of aquatic or land vehicles. Thus, all UAVs are drones, but not all drones are UAVs. The use of the term Unmanned Aerial System (UAS) is also frequent [97], which refers not only to the flying vehicle, but also to the ground control, communication units, support systems, etc. Compared to manned aircraft, UAVs are normally less expensive, less invasive, and safer tools, so they can be used in sensitive areas such as the polar regions [98]. The most common type of operation is the so-called visual line of sight (VLOS), where the pilot can directly see the UAV at all times; however, some systems are prepared to operate beyond visual line of sight (BVLOS) [99] allowing to cover larger extensions.
- -
- Other types of vehicles. In many cases, remote capture systems can be incorporated into the existing farm machinery [41], such as trucks, tractors, combine harvesters, etc. In this case, the images are typically used in real-time during the agricultural processes of plowing, irrigation, planting, weeding, or harvesting, more than for out-of-line analysis. We also include in this category other types of autonomous vehicles that can not be considered as UAVs, such as aerial balloons.
- -
- In-field installations. Remote image capture systems in agriculture also include field installations of fixed cameras. They can be considered remote in the sense that they are used and controlled remotely, not in the capture distance. They are usually based on inexpensive cameras communicating wirelessly, which are able to perform a real-time monitoring of the crops [13]. In counterpart, they have lower resolution than the other modalities, they only capture a small portion of the plots, and normally only RGB images are used. In some cases, they can be integrated into a wider Wireless Sensor Network (WSN) installed in the farms; these include other types of sensors (thermometers, barometers, lysimeters, etc.) that are out of the scope of the present review.
- MQ7. To date, a large number of different problems have been addressed with the RSA techniques listed above [83]. However, this fact does not limit the possibility that other new topics and areas of application will appear in the future. According to the recent reviews [17,100], the main applications of interest can be classified as follows.
- -
- Agricultural parameters estimation. In this case, remote images are used to estimate parameters of large plots that would be difficult or expensive to be obtained using in-field methods. These parameters of interest can include crops or cropland parameters [45], for example, the height of the plants, the leaf area index (LAI), the percentage of green cover (PGC), the total biomass, the depth of the roots, or the surface roughness can be estimated.
- -
- Drought stress, irrigation, and water productivity. Due to the great importance of water in agriculture, this category includes all applications related to water and irrigation (although some of them could also be understood as parameter estimation) [91,101]. Optimization of water resources is an essential aspect of global sustainability due to the great water shortage in many regions. A key parameter is water balance, which measures the water incomes and outcomes, including the crop evapotranspiration (ET).
- -
- Nutrient status. Nutrient efficiency and avoiding nutrient losses are other topics that have received much attention in the literature of RSA. The proper use of nutrients can also be aimed at reducing pollution of the environment. It is particularly relevant the use of nitrogen (N), which has proved to affect the leaf and plant reflectance signatures [17].
- -
- Growth vigor. Monitoring plant vigor during the different stages of growth is another of the principal applications of RSA [23]. It can be based on different parameters such as the growth of the plant height, the total biomass, and the PGC. We distinguish this category from the parameter estimation in that these works perform a temporal analysis of the images.
- -
- Detection of pathogens, diseases, and insect pests. Early detection of these problems can help reduce losses. Precision agriculture systems are able to reduce pesticide use by performing site-specific spraying [102]. Thus, the effectiveness of these systems is related with the obtained quality, yield and sustainability of the crops.
- -
- Weed detection. The appearance of weeds is another problem that can appear during the cultivation process, leading to a reduction in the water and nutrients available for the crops of interest [103]. As weeds are also plants, the distinction between crops and weeds must be done using color, texture, shape, or spectral features.
- -
- Yield prediction. Regarding the last stages of the cultivation process, remote sensing images have been used to predict the yield before the actual harvesting [58]. These systems are usually based on regression models using parameters extracted from the images, although the most precise methods use accumulated temporal information and crop growth models.
- -
- Automatic crop harvesting. Intelligent harvesting machinery and picking robots have emerged in the last years as a feasible alternative to traditional harvesting methods [80], although the first experimental systems for automatic harvesting using machine vision date back to the 1980s.
- MQ8. Computer vision systems in agriculture are not exclusively based on the use of visible light; a wide range of the electromagnetic spectrum has shown to be effective in different RSA applications, normally is frequencies lower than the visible wavelengths. Several reviews have analyzed the suitability of spectral information in different RSA problems [17,80,104]. The main types can be classified as follows.
- -
- RGB (visible spectrum). The visible spectrum corresponds to the wavelengths between 380 and 740 nm, which are visible by the human eye [105]. RGB cameras do not capture a complete spectrum of these wavelengths, but only three bands corresponding to red, green, and blue color. The main advantage of this category is the high availability, high spatial resolution, and low cost of the cameras, with respect to the other types of sensors. For these reasons, it is the predominant class in computer vision in general.
- -
- Red edge spectrum. This class corresponds to a small part of the visible spectrum, located at the end of the lowest frequencies, approximately from 670 to 740 nm. It is particularly important in agriculture [104], as the chlorophyll contained in vegetation reflects most of these wavelengths, while it absorbs a great part of the rest of the visible spectrum. Therefore, several vegetation indices have been defined based on the relationship between the reflection of red edge and red.
- -
- Near-infrared (NIR) and Vis-NIR. NIR includes the part of the infrared spectrum nearest to the visible region, approximately from 740 to 1500 nm. This class is also characterized by a high reflectance by the plants. The normalized difference vegetation index (NDVI) [23] is based on NIR and red bands, and is a very common parameter to study the amount and healthiness of vegetation. Consequently, most works include NIR and visible bands, being a typical range from 400 nm to 1500 nm; this is usually called visible-NIR or Vis-NIR.
- -
- Short-wave infrared. The term infrared refers to a broad slice of the electromagnetic spectrum ranging from 740 nm to 1 mm [93]. It is subdivided in near, short, mid, high, and far infrared, from lowest to highest wavelength. Short-wave infrared is located approximately from 1.5 to 3 m. This range is characterized by a high absorption from the water, so it is specially interesting for moisture analysis.
- -
- Long-wave infrared. This range corresponds to 8–15 m. It is also called thermal infrared [106], as it contains the wavelengths of the thermal emission of the objects. It is widely used in studies about soil moisture, crop evapotranspiration and water balance, which can be estimated from the relative temperatures [107].
- -
- Synthetic aperture radar (SAR). Unlike the previous passive sensing methods, SAR is an active sensing technique [45]. This means that the capture device emits some kind of radiation and receives the echo; normally, microwave radiations in different bands are used. This type of radar is called synthetic aperture because it takes advantage of the motion of the satellite or aircraft to simulate a large antenna, thus providing higher resolution images. Polarization properties of the waves are also used to provide more information of the land. The captured images are unaffected by the clouds, and it can be used in night-time operation. Although passive microwave capture is also possible, it is less used in RSA.
- -
- Light Detection and Ranging (LiDAR). This method also belongs to the category of active remote sensing, usually mounted on satellites and aircraft. In this case, the radiation is emitted by a laser beam, and the echo time is measured to calculate the distance to the objective. Unlike the other methods, which obtain radiation/absorption images in different wavelengths, the data obtained are depth images [108]. This type of images are also called digital elevation models (DEM). They can be used, for example, to estimate the height and volume of the plants.
In addition, two other related terms are multispectral and hyperspectral images. These categories do not correspond to specific wavelengths, but to the number of channels that are captured.- -
- Multispectral images (broad band). When the number of channels captured for each pixel is small, usually between three and 10 channels, we call them multispectral images [18]. Each channel corresponds to a broad range of the spectrum, which can have a descriptive name. For example, an RGB image can be understood as a multispectral image with three channels. In the review, this category has been used only when the paper cannot be classified in the previous classes. For example, satellite Lansat-8 (https://www.usgs.gov/land-resources/nli/landsat/landsat-8) is able to capture 11 different bands (although not all of them with the same spatial resolution).
- -
- Hyperspectral images (narrow band). These images are characterized by having a large number of channels, which can be some hundreds or even thousands [18]. For example, Hyperion imaging spectrometer is able to capture 224 bands with 10 nm wavelength intervals [109]. This high number of channels allows obtaining the spectral signature of the observed objects, in order to analyze their chemical composition. However, most computer vision techniques are designed for images with few channels. Specific methods should be applied when the spatial resolution of the images is small but the number of channels is very large.
2.5. Synthesis Procedure
3. Results of the Systematic Mapping Study
3.1. MQ1. What Publication Channels Are the Main Targets for RSA?
3.2. MQ2. How Has the Frequency of Approaches Related to RSA Changed over Time?
3.3. MQ3. What Are the Main Research Types of RSA Studies?
3.4. MQ4. Are RSA Studies Empirically Validated?
3.5. MQ5. What Types of Techniques Were Reported in RSA Research?
3.6. MQ6. What Are the Platforms Used to Capture the Images for RSA?
3.7. MQ7. What Are the Research Topics by RSA?
3.8. MQ8. What Are the Different Types of Spectral Information Used?
4. Discussion
4.1. Main Findings and Implications for Researchers and Practitioners
- The main publication channels of the selected papers are journals, at a great distance from books and conferences. This is caused by the introduction of the strict exclusion criterion EC2 of six citations per year. Publications in journals are known to be cited more than those in conferences. Although conferences are important publication venues for computer science researchers [205], the research community tends to prefer publishing in journals due to the tenure and promotion guidelines in many institutions which only consider publications in high-impact factor journals [206]. However, the role of conferences as a means of spreading new ideas, showing ongoing research and connecting researchers should not be dismissed.
- The research field of RSA has gained an increasing interest since the beginning of the millennium. This can be explained by the new technologies that appeared in this period (cameras, satellites, and UAVs) in addition to the improvements in telecommunications and data transmission. The decrease of publications observed in 2019 is a collateral effect of the review procedure and the minimum required number of citations. Thus, the increasing interest in RSA is expected to continue in the near future, favoring the appearance of new journals and conferences more specialized in the different areas of RSA.
- Most of the selected papers are evaluation research using data sets. Solution proposals represent almost one-third of the selected papers, which indicates that the field has reached a certain maturity and researchers are more interested in evaluating existing technologies rather than proposing new ones. This is also supported by the large number of reviews identified. On the other hand, this highlights the importance of creating public and comprehensive datasets where the results of different authors can be compared. It would be recommended that this effort be carried out by existing institutions and associations, rather than particular research groups. One example of these public resources is EuroSAT [40], a public dataset of 27,000 labeled and georeferenced images from Sentinel-2 satellite useful for the classification of land usages; the DeepSat Airborne Dataset [94], with 500,000 image patches in Vis-NIR range; or the Copernicus Programme, which offers satellite and in-situ images for land monitoring (https://land.copernicus.eu/).
- The majority of the selected empirically evaluated publications were conducted through experiments. Only two case studies have been identified in the selected papers, which means that it is difficult to perform this type of studies in RSA, as normally the research is done under uncontrolled settings. The small number of meta-analysis papers that were found indicates that there is an interesting opportunity to apply this type of statistical analysis whose purpose is to combine the results of multiple previous scientific works to assess these results and derive conclusions.
- The computer vision task most frequently found in the selected papers is classification: given a image patch or region, classify it into a predefined set of classes of interest. This is an expected observation, as it is one of the most studied machine learning problems, it has a simple a clear definition, and its results can be used in different applications. Decision trees, support vector machines, classical neural networks, k-nearest neighbors. and Bayes classifiers are among the most frequent techniques. However, deep learning methods are gaining popularity [20,74,76,77,78,79], proving to overcome other techniques in many domains. It is recommended that it should be applied when it is really of interest and not as a fad. An interesting alternative could be the use of ensemble classification systems that have not been widely used in RSA research. Other problems that have been identified in the selected papers include feature extraction, maximum likelihood, image preprocessing and segmentation, and recognition systems. As a general recommendation, we advice to make use of free tools and libraries for machine learning and computer vision, taking advantage of the great effort done by the free software community, for example using Python with tools such as the scientific programming environment Scikit-Learn (https://scikit-learn.org/stable/) and deep learning ecosystem PyTorch (https://pytorch.org/).
- The main types of platforms employed in RSA to capture the images are satellites, UAVs, and manned aircraft. However, in-field cameras and ground vehicles have not been widely used in RSA. The reason these images are used instead of the ground-based ones could be explained by the fact that they provide a broader view of the land. In addition, the resolution of the cameras permits to go from a global perspective to a more detailed view of a specific area. The fusion of satellite and UAV imagery [207] is an emerging field that would be very useful to harness the power of both capture systems. It is interesting to observe that many satellite imagery is freely available for research purposes, so this would be a convenient source for beginners. Among the most cited satellites in the selected papers, NASA’s Landsat missions (https://landsat.gsfc.nasa.gov), ESA’s Sentinel missions (https://sentinel.esa.int/), and ESA’s Envisat satellite (https://www.esa.int/Applications/Observing_the_Earth/Envisat/Mission_overview) can be mentioned. Other satellites that are referred in several papers include Proba-1/2, Spot, QuickBird, Ikonos, TerraSAR-X, and Radarsat-2. In the domain of UAVs, some research teams are specifically dedicated to the hardware development of capture systems that can be applied for different task, such as the system PhenoFly (https://kp.ethz.ch/infrastructure/uav-phenofly.html), which has been used in many publications.
- The main research topics addressed by the RSA community were growth vigor, cropland parameter extraction, and water usage. From a general perspective, these problems have the potential to impact on the sustainability of agriculture. As a matter of fact, the better usage of the water together with an adequate knowledge on the cropland, the better growth vigor, crop quality, and efficiency is achieved. Indeed, sustainability is one of the main goals of precision agriculture, in line with the United Nations’ Sustainable Development Goals (SDG2: End hunger, achieve food security and improved nutrition and promote sustainable agriculture. SDG14. Protect, restore and promote sustainable use of terrestrial ecosystems, sustainably manage forests, combat desertification, and halt and reverse land degradation and halt biodiversity loss.). Sustainability was not a topic specifically addressed in the present mapping study, although all the problems are in some way related to it. The detection of pathogens, diseases, and insect pests attempts to reduce the amount of pesticides and insecticides; weed detection allows the use of site-specific spraying of herbicides, and nutrient analysis is related to the optimal use of fertilizers. On the other hand, yield prediction and automatic crop harvesting seek to optimize the productivity of farming. It cannot be discarded that new problems and applications appear in the future with the advance in technology, such as those involved in a completely automated cropping cycle.
- Concerning the types of the images used, standard RGB images continue to be the most frequently used image type. This can be explained by the low cost and high availability of RGB cameras, and the fact that they are the main source for computer vision in general. In this sense, RSA research is commonly observed as a sub-domain of computer vision and image processing. New methodologies should be developed more specific to the agricultural domain, for example considering the spectral, temporal, and phenotypic dimensions. In many works, NIR channel is added to RGB tuples, forming a 4-valued tuple for each pixel. Visible spectrum allows to validate the results from simple inspection, but important information may be lost or not detected with this type of images. For example, the temperature of the objects cannot be measured with Vis-NIR images, but this could be useful to estimate the water status of the plants. In these applications, hyperspectral images and thermal infrared were found in a second level of usage, and on a third group near infrared, red edge spectrum and multispectral images. When the spectral bands of interest can be known a priori, multispectral images can be more interesting than hyperspectral, focusing on the wavelengths of interest. In this way, an interesting domain of research in RSA that deserves much more work is the determination of the optimal spectral bands for each problem [208]. Ideally, new cameras could be made that are specific to the selected and reduced number of wavelengths for each problem.
4.2. Limitations of the Mapping Study
- Using only Scopus as a source of publications. Other relevant publications that are not indexed in Scopus could have impacted the final results. However, our focus was to provide an overview on the most highly cited papers. For this reason, we chose to focus on Scopus as it is one of the largest databases available. Moreover, it has one of the most complete searching methods allowing Boolean combinations and wildcards.
- Some missing terms in the search string might have impacted the results. In order to reduce this limitation, we formed the search string to include a broad range of terms of interest to this study. Besides, the search string was refine in several trials, by observing some papers that were not initially included. Therefore, we consider this threat is low.
- Other classification criteria not present in this study might have provided interesting views on the selected papers. The eight mapping questions included provide interesting findings to researchers and practitioners, although other questions could be also useful.
- The exclusion criterion of six cites per year could have rejected some interesting papers. This criterion was added to select only the most relevant works in the literature. This has shown to be very restrictive both for recent papers (only two papers from 2019 received more than six citations) and for older publications (e.g., the papers before year 2000 require more than 120 citations). However, as the purpose of the mapping study is to analyze the trends of the most relevant works, this is not a threat to the validity of the study.
5. Conclusions
Author Contributions
Funding
Conflicts of Interest
References
- Brisco, B.; Brown, R.; Hirose, T.; McNairn, H.; Staenz, K. Precision agriculture and the role of remote sensing: A review. Can. J. Remote Sens. 1998, 24, 315–327. [Google Scholar] [CrossRef]
- Chang, K.T. Introduction to Geographic Information Systems; McGraw-Hill Higher Education: Boston, FL, USA, 2006. [Google Scholar]
- Der Sarkissian, R.; Zaninetti, J.M.; Abdallah, C. The use of geospatial information as support for Disaster Risk Reduction; contextualization to Baalbek-Hermel Governorate/Lebanon. Appl. Geogr. 2019, 111, 102075. [Google Scholar] [CrossRef]
- Chaikaew, P. Land Use Change Monitoring and Modelling using GIS and Remote Sensing Data for Watershed Scale in Thailand. In Land Use-Assessing the Past, Envisioning the Future; IntechOpen: London, UK, 2019. [Google Scholar]
- Bai, Y.; Kaneko, I.; Kobayashi, H.; Kurihara, K.; Takayabu, I.; Sasaki, H.; Murata, A. A Geographic Information System (GIS)-based approach to adaptation to regional climate change: A case study of Okutama-machi, Tokyo, Japan. Mitig. Adapt. Strateg. Glob. Chang. 2014, 19, 589–614. [Google Scholar] [CrossRef] [Green Version]
- Gökkaya, K.; Budhathoki, M.; Christopher, S.F.; Hanrahan, B.R.; Tank, J.L. Subsurface tile drained area detection using GIS and remote sensing in an agricultural watershed. Ecol. Eng. 2017, 108, 370–379. [Google Scholar] [CrossRef]
- Wu, Q. GIS and remote sensing applications in wetland mapping and monitoring. In Comprehensive Geographic Information Systems; Elsevier: Amsterdam, The Netherlands, 2018; pp. 140–157. [Google Scholar]
- Sanga, B.; Mohanty, D.; Singh, A.; Singh, R. Nexgen Technologies for Mining and Fuel Industries; Allied Publishers: New Delhi, India, 2017. [Google Scholar]
- Rocha, F.; Oliveira Neto, A.; Bottega, E.; Guerra, N.; Rocha, R.; Vilar, C. Weed mapping using techniques of precision agriculture. Planta Daninha 2015, 33, 157–164. [Google Scholar] [CrossRef] [Green Version]
- Slaughter, D.C.; Pérez Ruiz, M.; Fathallah, F.; Upadhyaya, S.; Gliever, C.J.; Miller, B. GPS-based intra-row weed control system: Performance and labor savings. In Automation Technology for Off-Road Equipment; ASABE: St. Joseph, MO, USA, 2012. [Google Scholar]
- De Castro, A.I.; Torres-Sánchez, J.; Peña, J.M.; Jiménez-Brenes, F.M.; Csillik, O.; López-Granados, F. An automatic random forest-OBIA algorithm for early weed mapping between and within crop rows using UAV imagery. Remote Sens. 2018, 10, 285. [Google Scholar] [CrossRef] [Green Version]
- Khanal, S.; Fulton, J.; Shearer, S. An overview of current and potential applications of thermal remote sensing in precision agriculture. Comput. Electron. Agric. 2017, 139, 22–32. [Google Scholar] [CrossRef]
- Mateo-Aroca, A.; García-Mateos, G.; Ruiz-Canales, A.; Molina-García-Pardo, J.M.; Molina-Martínez, J.M. Remote Image Capture System to Improve Aerial Supervision for Precision Irrigation in Agriculture. Water 2019, 11, 255. [Google Scholar] [CrossRef] [Green Version]
- Liakos, K.G.; Busato, P.; Moshou, D.; Pearson, S.; Bochtis, D. Machine learning in agriculture: A review. Sensors 2018, 18, 2674. [Google Scholar] [CrossRef] [Green Version]
- Lindblom, J.; Lundström, C.; Ljung, M.; Jonsson, A. Promoting sustainable intensification in precision agriculture: Review of decision support systems development and strategies. Precis. Agric. 2017, 18, 309–331. [Google Scholar] [CrossRef] [Green Version]
- Tmušić, G.; Manfreda, S.; Aasen, H.; James, M.R.; Gonçalves, G.; Ben-Dor, E.; Brook, A.; Polinova, M.; Arranz, J.J.; Mészáros, J.; et al. Current Practices in UAS-based Environmental Monitoring. Remote Sens. 2020, 12, 1001. [Google Scholar] [CrossRef] [Green Version]
- Maes, W.H.; Steppe, K. Perspectives for remote sensing with unmanned aerial vehicles in precision agriculture. Trends Plant Sci. 2019, 24, 152–164. [Google Scholar] [CrossRef] [PubMed]
- Adão, T.; Hruška, J.; Pádua, L.; Bessa, J.; Peres, E.; Morais, R.; Sousa, J.J. Hyperspectral imaging: A review on UAV-based sensors, data processing and applications for agriculture and forestry. Remote Sens. 2017, 9, 1110. [Google Scholar] [CrossRef] [Green Version]
- Bah, M.D.; Hafiane, A.; Canals, R. Weeds detection in UAV imagery using SLIC and the hough transform. In Proceedings of the 2017 Seventh International Conference on Image Processing Theory, Tools and Applications (IPTA), Montreal, QC, Canada, 28 November–1 December 2017; pp. 1–6. [Google Scholar]
- dos Santos Ferreira, A.; Freitas, D.M.; da Silva, G.G.; Pistori, H.; Folhes, M.T. Weed detection in soybean crops using ConvNets. Comput. Electron. Agric. 2017, 143, 314–324. [Google Scholar] [CrossRef]
- Jung, J.; Maeda, M.; Chang, A.; Landivar, J.; Yeom, J.; McGinty, J. Unmanned aerial system assisted framework for the selection of high yielding cotton genotypes. Comput. Electron. Agric. 2018, 152, 74–81. [Google Scholar] [CrossRef]
- Han, L.; Yang, G.; Yang, H.; Xu, B.; Li, Z.; Yang, X. Clustering field-based maize phenotyping of plant-height growth and canopy spectral dynamics using a UAV remote-sensing approach. Front. Plant Sci. 2018, 9, 1638. [Google Scholar] [CrossRef] [Green Version]
- Wahab, I.; Hall, O.; Jirström, M. Remote sensing of yields: Application of uav imagery-derived ndvi for estimating maize vigor and yields in complex farming systems in sub-saharan africa. Drones 2018, 2, 28. [Google Scholar] [CrossRef] [Green Version]
- Quebrajo, L.; Perez-Ruiz, M.; Pérez-Urrestarazu, L.; Martínez, G.; Egea, G. Linking thermal imaging and soil remote sensing to enhance irrigation management of sugar beet. Biosyst. Eng. 2018, 165, 77–87. [Google Scholar] [CrossRef]
- Albornoz, C.; Giraldo, L.F. Trajectory design for efficient crop irrigation with a UAV. In Proceedings of the 2017 IEEE 3rd Colombian Conference on Automatic Control (CCAC), Cartagena, Colombia, 18–20 October 2017; pp. 1–6. [Google Scholar]
- Kerkech, M.; Hafiane, A.; Canals, R. Deep leaning approach with colorimetric spaces and vegetation indices for vine diseases detection in UAV images. Comput. Electron. Agric. 2018, 155, 237–243. [Google Scholar] [CrossRef]
- Montero, D.; Rueda, C. Detection of palm oil bud rot employing artificial vision. In Proceedings of the IOP Conference Series: Materials Science and Engineering, Constanta, Romania, 13–16 June 2018; Volume 437, p. 012004. [Google Scholar]
- Xue, X.; Lan, Y.; Sun, Z.; Chang, C.; Hoffmann, W.C. Develop an unmanned aerial vehicle based automatic aerial spraying system. Comput. Electron. Agric. 2016, 128, 58–66. [Google Scholar] [CrossRef]
- Garre, P.; Harish, A. Autonomous agricultural pesticide spraying uav. In Proceedings of the IOP Conference Series: Materials Science and Engineering, Constanta, Romania, 13–16 June 2018; Volume 455, p. 012030. [Google Scholar]
- Perich, G.; Hund, A.; Anderegg, J.; Roth, L.; Boer, M.P.; Walter, A.; Liebisch, F.; Aasen, H. Assessment of multi-image UAV based high-throughput field phenotyping of canopy temperature. Front. Plant Sci. 2020, 11, 150. [Google Scholar] [CrossRef] [PubMed]
- Maurya, P. Hardware Implementation of a Flight Control System for an Unmanned Aerial Vehicle. 2015. Available online: http://www.cse.iitk.ac.in/users/moona/students/Y2258.pdf (accessed on 14 March 2020).
- Park, J.K.; Park, J.H. Crops classification using imagery of unmanned aerial vehicle (UAV). J. Korean Soc. Agric. Eng. 2015, 57, 91–97. [Google Scholar]
- Punjani, A.; Abbeel, P. Deep learning helicopter dynamics models. In Proceedings of the 2015 IEEE International Conference on Robotics and Automation (ICRA), Seattle, WA, USA, 26–30 May 2015; pp. 3223–3230. [Google Scholar]
- Peña Barragán, J.M.; Kelly, M.; Castro, A.I.d.; López Granados, F. Object-based approach for crop row characterization in UAV images for site-specific weed management. In Proceedings of the 4th GEOBIA, Rio de Janeiro, Brazil, 7–9 May 2012; pp. 426–430. [Google Scholar]
- Näsi, R.; Viljanen, N.; Kaivosoja, J.; Alhonoja, K.; Hakala, T.; Markelin, L.; Honkavaara, E. Estimating biomass and nitrogen amount of barley and grass using UAV and aircraft based spectral and photogrammetric 3D features. Remote Sens. 2018, 10, 1082. [Google Scholar] [CrossRef] [Green Version]
- Zheng, H.; Li, W.; Jiang, J.; Liu, Y.; Cheng, T.; Tian, Y.; Zhu, Y.; Cao, W.; Zhang, Y.; Yao, X. A comparative assessment of different modeling algorithms for estimating leaf nitrogen content in winter wheat using multispectral images from an unmanned aerial vehicle. Remote Sens. 2018, 10, 2026. [Google Scholar] [CrossRef] [Green Version]
- Wang, D.C.; Zhang, G.L.; Zhao, M.S.; Pan, X.Z.; Zhao, Y.G.; Li, D.C.; Macmillan, B. Retrieval and mapping of soil texture based on land surface diurnal temperature range data from MODIS. PLoS ONE 2015, 10, 1–14. [Google Scholar] [CrossRef]
- Shafian, S.; Maas, S.J. Index of soil moisture using raw Landsat image digital count data in Texas high plains. Remote Sens. 2015, 7, 2352–2372. [Google Scholar] [CrossRef] [Green Version]
- Tong, X.Y.; Xia, G.S.; Lu, Q.; Shen, H.; Li, S.; You, S.; Zhang, L. Land-cover classification with high-resolution remote sensing images using transferable deep models. Remote Sens. Environ. 2020, 237, 111322. [Google Scholar] [CrossRef] [Green Version]
- Helber, P.; Bischke, B.; Dengel, A.; Borth, D. Eurosat: A novel dataset and deep learning benchmark for land use and land cover classification. IEEE J. Sel. Top. Appl. Earth Obs. Remote Sens. 2019, 12, 2217–2226. [Google Scholar] [CrossRef] [Green Version]
- Maes, W.; Steppe, K. Estimating evapotranspiration and drought stress with ground-based thermal remote sensing in agriculture: A review. J. Exp. Bot. 2012, 63, 4671–4712. [Google Scholar] [CrossRef] [Green Version]
- Soliman, A.; Heck, R.J.; Brenning, A.; Brown, R.; Miller, S. Remote sensing of soil moisture in vineyards using airborne and ground-based thermal inertia data. Remote Sens. 2013, 5, 3729–3748. [Google Scholar] [CrossRef] [Green Version]
- Daponte, P.; De Vito, L.; Glielmo, L.; Iannelli, L.; Liuzza, D.; Picariello, F.; Silano, G. A review on the use of drones for precision agriculture. In Proceedings of the IOP Conference Series: Earth and Environmental Science, Bogor, Indonesia, 10–11 September 2019; Volume 275, p. 012022. [Google Scholar]
- Daponte, P.; De Vito, L.; Mazzilli, G.; Picariello, F.; Rapuano, S. A height measurement uncertainty model for archaeological surveys by aerial photogrammetry. Measurement 2017, 98, 192–198. [Google Scholar] [CrossRef]
- Liu, C.A.; Chen, Z.X.; Yun, S.; Chen, J.S.; Hasi, T.; Pan, H.Z. Research advances of SAR remote sensing for agriculture applications: A review. J. Integr. Agric. 2019, 18, 506–525. [Google Scholar] [CrossRef] [Green Version]
- Tan, C.P.; Ewe, H.T.; Chuah, H.T. Agricultural crop-type classification of multi-polarization SAR images using a hybrid entropy decomposition and support vector machine technique. Int. J. Remote Sens. 2011, 32, 7057–7071. [Google Scholar] [CrossRef]
- Kussul, N.; Lemoine, G.; Gallego, F.J.; Skakun, S.V.; Lavreniuk, M.; Shelestov, A.Y. Parcel-based crop classification in Ukraine using Landsat-8 data and Sentinel-1A data. IEEE J. Sel. Top. Appl. Earth Obs. Remote Sens. 2016, 9, 2500–2508. [Google Scholar] [CrossRef]
- Stankiewicz, K.A. The efficiency of crop recognition on ENVISAT ASAR images in two growing seasons. IEEE Trans. Geosci. Remote Sens. 2006, 44, 806–814. [Google Scholar] [CrossRef]
- Ziliani, M.G.; Parkes, S.D.; Hoteit, I.; McCabe, M.F. Intra-season crop height variability at commercial farm scales using a fixed-wing UAV. Remote Sens. 2018, 10, 2007. [Google Scholar] [CrossRef] [Green Version]
- Torres-Sánchez, J.; de Castro, A.I.; Pena, J.M.; Jiménez-Brenes, F.M.; Arquero, O.; Lovera, M.; López-Granados, F. Mapping the 3D structure of almond trees using UAV acquired photogrammetric point clouds and object-based image analysis. Biosyst. Eng. 2018, 176, 172–184. [Google Scholar] [CrossRef]
- De Castro, A.I.; Jiménez-Brenes, F.M.; Torres-Sánchez, J.; Peña, J.M.; Borra-Serrano, I.; López-Granados, F. 3-D characterization of vineyards using a novel UAV imagery-based OBIA procedure for precision viticulture applications. Remote Sens. 2018, 10, 584. [Google Scholar] [CrossRef] [Green Version]
- Sa, I.; Popović, M.; Khanna, R.; Chen, Z.; Lottes, P.; Liebisch, F.; Nieto, J.; Stachniss, C.; Walter, A.; Siegwart, R. Weedmap: A large-scale semantic weed mapping framework using aerial multispectral imaging and deep neural network for precision farming. Remote Sens. 2018, 10, 1423. [Google Scholar] [CrossRef] [Green Version]
- Marino, S.; Alvino, A. Detection of homogeneous wheat areas using multitemporal UAS images and ground truth data analyzed by cluster analysis. Eur. J. Remote Sens. 2018, 51, 266–275. [Google Scholar] [CrossRef] [Green Version]
- de Souza, C.H.W.; Mercante, E.; Johann, J.A.; Lamparelli, R.A.C.; Uribe-Opazo, M.A. Mapping and discrimination of soya bean and corn crops using spectro-temporal profiles of vegetation indices. Int. J. Remote Sens. 2015, 36, 1809–1824. [Google Scholar] [CrossRef]
- Zheng, Y.; Zhang, M.; Zhang, X.; Zeng, H.; Wu, B. Mapping winter wheat biomass and yield using time series data blended from PROBA-V 100-and 300-m S1 products. Remote Sens. 2016, 8, 824. [Google Scholar] [CrossRef] [Green Version]
- Gouveia, C.; Trigo, R.; Beguería, S.; Vicente-Serrano, S.M. Drought impacts on vegetation activity in the Mediterranean region: An assessment using remote sensing data and multi-scale drought indicators. Glob. Planet. Chang. 2017, 151, 15–27. [Google Scholar] [CrossRef] [Green Version]
- Zhang, C.; Ren, H.; Qin, Q.; Ersoy, O.K. A new narrow band vegetation index for characterizing the degree of vegetation stress due to copper: The copper stress vegetation index (CSVI). Remote Sens. Lett. 2017, 8, 576–585. [Google Scholar] [CrossRef]
- Rembold, F.; Atzberger, C.; Savin, I.; Rojas, O. Using low resolution satellite imagery for yield prediction and yield anomaly detection. Remote Sens. 2013, 5, 1704–1733. [Google Scholar] [CrossRef] [Green Version]
- Mavridou, E.; Vrochidou, E.; Papakostas, G.A.; Pachidis, T.; Kaburlasos, V.G. Machine Vision Systems in Precision Agriculture for Crop Farming. J. Imaging 2019, 5, 89. [Google Scholar] [CrossRef] [Green Version]
- Khan, Z.; Rahimi-Eichi, V.; Haefele, S.; Garnett, T.; Miklavcic, S.J. Estimation of vegetation indices for high-throughput phenotyping of wheat using aerial imaging. Plant Methods 2018, 14, 20. [Google Scholar] [CrossRef]
- Bah, M.D.; Hafiane, A.; Canals, R. Deep learning with unsupervised data labeling for weed detection in line crops in UAV images. Remote Sens. 2018, 10, 1690. [Google Scholar] [CrossRef] [Green Version]
- Bah, M.D.; Dericquebourg, E.; Hafiane, A.; Canals, R. Deep learning based classification system for identifying weeds using high-resolution UAV imagery. In Proceedings of the Science and Information Conference, Las Vegas, NV, USA, 25–26 April 2018; pp. 176–187. [Google Scholar]
- Kruse, O.M.O.; Prats-Montalbán, J.M.; Indahl, U.G.; Kvaal, K.; Ferrer, A.; Futsaether, C.M. Pixel classification methods for identifying and quantifying leaf surface injury from digital images. Comput. Electron. Agric. 2014, 108, 155–165. [Google Scholar] [CrossRef]
- Albetis, J.; Jacquin, A.; Goulard, M.; Poilvé, H.; Rousseau, J.; Clenet, H.; Dedieu, G.; Duthoit, S. On the potentiality of UAV multispectral imagery to detect Flavescence dorée and Grapevine Trunk Diseases. Remote Sens. 2019, 11, 23. [Google Scholar] [CrossRef] [Green Version]
- Kurtulmuş, F.; Ünal, H. Discriminating rapeseed varieties using computer vision and machine learning. Expert Syst. Appl. 2015, 42, 1880–1891. [Google Scholar] [CrossRef]
- Hassan-Esfahani, L.; Torres-Rua, A.; Jensen, A.; McKee, M. Assessment of surface soil moisture using high-resolution multi-spectral imagery and artificial neural networks. Remote Sens. 2015, 7, 2627–2646. [Google Scholar] [CrossRef] [Green Version]
- Poblete, T.; Ortega-Farías, S.; Moreno, M.A.; Bardeen, M. Artificial neural network to predict vine water status spatial variability using multispectral information obtained from an unmanned aerial vehicle (UAV). Sensors 2017, 17, 2488. [Google Scholar] [CrossRef] [PubMed] [Green Version]
- Jeon, H.Y.; Tian, L.F.; Zhu, H. Robust crop and weed segmentation under uncontrolled outdoor illumination. Sensors 2011, 11, 6270–6283. [Google Scholar] [CrossRef] [PubMed]
- Sannakki, S.S.; Rajpurohit, V.S.; Nargund, V. SVM-DSD: SVM Based diagnostic system for the detection of pomegranate leaf diseases. In Proceedings of the International Conference on Advances in Computing, Mumbai, India, 18–19 January 2013; pp. 715–720. [Google Scholar]
- Mokhtar, U.; El Bendary, N.; Hassenian, A.E.; Emary, E.; Mahmoud, M.A.; Hefny, H.; Tolba, M.F. SVM-based detection of tomato leaves diseases. In Intelligent Systems’ 2014; Springer: Berlin/Heidelberg, Germany, 2015; pp. 641–652. [Google Scholar]
- Dingle Robertson, L.; King, D.J. Comparison of pixel-and object-based classification in land cover change mapping. Int. J. Remote Sens. 2011, 32, 1505–1529. [Google Scholar] [CrossRef]
- De Rainville, F.M.; Durand, A.; Fortin, F.A.; Tanguy, K.; Maldague, X.; Panneton, B.; Simard, M.J. Bayesian classification and unsupervised learning for isolating weeds in row crops. Pattern Anal. Appl. 2014, 17, 401–414. [Google Scholar] [CrossRef]
- Mondal, D.; Kole, D.K.; Roy, K. Gradation of yellow mosaic virus disease of okra and bitter gourd based on entropy based binning and Naive Bayes classifier after identification of leaves. Comput. Electron. Agric. 2017, 142, 485–493. [Google Scholar] [CrossRef]
- Tsouros, D.C.; Bibi, S.; Sarigiannidis, P.G. A review on UAV-based applications for precision agriculture. Information 2019, 10, 349. [Google Scholar] [CrossRef] [Green Version]
- Kamilaris, A.; Prenafeta-Boldú, F.X. Deep learning in agriculture: A survey. Comput. Electron. Agric. 2018, 147, 70–90. [Google Scholar] [CrossRef] [Green Version]
- Huang, H.; Deng, J.; Lan, Y.; Yang, A.; Deng, X.; Zhang, L. A fully convolutional network for weed mapping of unmanned aerial vehicle (UAV) imagery. PLoS ONE 2018, 13, e0196302. [Google Scholar] [CrossRef] [Green Version]
- Castro, J.D.B.; Feitoza, R.Q.; La Rosa, L.C.; Diaz, P.M.A.; Sanches, I.D.A. A Comparative analysis of deep learning techniques for sub-tropical crop types recognition from multitemporal optical/SAR image sequences. In Proceedings of the 2017 30th SIBGRAPI Conference on Graphics, Patterns and Images (SIBGRAPI), Niteroi, Brazil, 17–20 October 2017; pp. 382–389. [Google Scholar]
- Mortensen, A.K.; Dyrmann, M.; Karstoft, H.; Jørgensen, R.N.; Gislum, R. Semantic segmentation of mixed crops using deep convolutional neural network. In Proceedings of the International Conference of Agricultural Engineering (CIGR), Aarhus, Denmark, 26–29 June 2016. [Google Scholar]
- Kussul, N.; Lavreniuk, M.; Skakun, S.; Shelestov, A. Deep learning classification of land cover and crop types using remote sensing data. IEEE Geosci. Remote Sens. Lett. 2017, 14, 778–782. [Google Scholar] [CrossRef]
- Tian, H.; Wang, T.; Liu, Y.; Qiao, X.; Li, Y. Computer Vision Technology in Agricultural Automation—A review. Inf. Process. Agric. 2019, 7, 1–19. [Google Scholar] [CrossRef]
- Mogili, U.R.; Deepak, B. Review on application of drone systems in precision agriculture. Procedia Comput. Sci. 2018, 133, 502–509. [Google Scholar] [CrossRef]
- Tripathi, M.K.; Maktedar, D.D. A role of computer vision in fruits and vegetables among various horticulture products of agriculture fields: A survey. Inf. Process. Agric. 2019. [Google Scholar] [CrossRef]
- Weiss, M.; Jacob, F.; Duveiller, G. Remote sensing for agricultural applications: A meta-review. Remote Sens. Environ. 2020, 236, 111402. [Google Scholar] [CrossRef]
- Ouhbi, S.; Idri, A.; Fernández-Alemán, J.L.; Toval, A. Predicting software product quality: A systematic mapping study. Comput. Sist. 2015, 19, 547–562. [Google Scholar] [CrossRef] [Green Version]
- Petersen, K.; Vakkalanka, S.; Kuzniarz, L. Guidelines for conducting systematic mapping studies in software engineering: An update. Inf. Softw. Technol. 2015, 64, 1–18. [Google Scholar] [CrossRef]
- Mongeon, P.; Paul-Hus, A. The journal coverage of Web of Science and Scopus: A comparative analysis. Scientometrics 2016, 106, 213–228. [Google Scholar] [CrossRef]
- Moher, D.; Liberati, A.; Tetzlaff, J.; Altman, D.G. Preferred reporting items for systematic reviews and meta-analyses: The PRISMA statement. Ann. Intern. Med. 2009, 151, 264–269. [Google Scholar] [CrossRef] [Green Version]
- Ouhbi, S.; Idri, A.; Fernández-Alemán, J.L.; Toval, A. Requirements engineering education: A systematic mapping study. Requir. Eng. 2015, 20, 119–138. [Google Scholar] [CrossRef]
- Ouhbi, S.; Idri, A.; Aleman, J.L.F.; Toval, A. Evaluating software product quality: A systematic mapping study. In Proceedings of the 2014 Joint Conference of the International Workshop on Software Measurement and the International Conference on Software Process and Product Measurement, Rotterdam, The Netherlands, 6–8 October 2014; pp. 141–151. [Google Scholar]
- Minu, S.; Shetty, A.; Gopal, B. Review of preprocessing techniques used in soil property prediction from hyperspectral data. Cogent Geosci. 2016, 2, 1145878. [Google Scholar] [CrossRef]
- Atzberger, C. Advances in remote sensing of agriculture: Context description, existing operational monitoring systems and major information needs. Remote Sens. 2013, 5, 949–981. [Google Scholar] [CrossRef] [Green Version]
- Zhao, K.; García, M.; Liu, S.; Guo, Q.; Chen, G.; Zhang, X.; Zhou, Y.; Meng, X. Terrestrial lidar remote sensing of forests: Maximum likelihood estimates of canopy profile, leaf area index, and leaf angle distribution. Agric. For. Meteorol. 2015, 209, 100–113. [Google Scholar] [CrossRef]
- Angelopoulou, T.; Tziolas, N.; Balafoutis, A.; Zalidis, G.; Bochtis, D. Remote sensing techniques for soil organic carbon estimation: A review. Remote Sens. 2019, 11, 676. [Google Scholar] [CrossRef] [Green Version]
- Basu, S.; Ganguly, S.; Mukhopadhyay, S.; DiBiano, R.; Karki, M.; Nemani, R. Deepsat: A learning framework for satellite imagery. In Proceedings of the 23rd SIGSPATIAL International Conference on Advances in Geographic Information Systems, Seattle, WA, USA, 3–6 November 2015; pp. 1–10. [Google Scholar]
- Shelestov, A.; Lavreniuk, M.; Kussul, N.; Novikov, A.; Skakun, S. Exploring Google Earth Engine platform for big data processing: Classification of multitemporal satellite imagery for crop mapping. Front. Earth Sci. 2017, 5, 17. [Google Scholar] [CrossRef] [Green Version]
- Stagakis, S.; Markos, N.; Sykioti, O.; Kyparissis, A. Monitoring canopy biophysical and biochemical parameters in ecosystem scale using satellite hyperspectral imagery: An application on a Phlomis fruticosa Mediterranean ecosystem using multiangular CHRIS/PROBA observations. Remote Sens. Environ. 2010, 114, 977–994. [Google Scholar] [CrossRef]
- Zmarz, A. Introduction to the special issue UAS for mapping and monitoring. Eur. J. Remote Sens. 2019, 52, 1. [Google Scholar] [CrossRef] [Green Version]
- Korczak-Abshire, M.; Zmarz, A.; Rodzewicz, M.; Kycko, M.; Karsznia, I.; Chwedorzewska, K.J. Study of fauna population changes on Penguin Island and Turret Point Oasis (King George Island, Antarctica) using an unmanned aerial vehicle. Polar Biol. 2019, 42, 217–224. [Google Scholar] [CrossRef] [Green Version]
- Fang, S.X.; O’Young, S.; Rolland, L. Development of small uas beyond-visual-line-of-sight (bvlos) flight operations: System requirements and procedures. Drones 2018, 2, 13. [Google Scholar] [CrossRef] [Green Version]
- Rehman, T.U.; Mahmud, M.S.; Chang, Y.K.; Jin, J.; Shin, J. Current and future applications of statistical machine learning algorithms for agricultural machine vision systems. Comput. Electron. Agric. 2019, 156, 585–605. [Google Scholar] [CrossRef]
- Alchanatis, V.; Cohen, Y.; Cohen, S.; Moller, M.; Sprinstin, M.; Meron, M.; Tsipris, J.; Saranga, Y.; Sela, E. Evaluation of different approaches for estimating and mapping crop water status in cotton with thermal imaging. Precis. Agric. 2010, 11, 27–41. [Google Scholar] [CrossRef]
- Lamichhane, J.R.; Dachbrodt-Saaydeh, S.; Kudsk, P.; Messéan, A. Toward a reduced reliance on conventional pesticides in European agriculture. Plant Dis. 2016, 100, 10–24. [Google Scholar] [CrossRef] [PubMed] [Green Version]
- Sabzi, S.; Abbaspour-Gilandeh, Y.; García-Mateos, G. A fast and accurate expert system for weed identification in potato crops using metaheuristic algorithms. Comput. Ind. 2018, 98, 80–89. [Google Scholar] [CrossRef]
- Huang, Y.; Chen, Z.X.; Tao, Y.; Huang, X.Z.; Gu, X.F. Agricultural remote sensing big data: Management and applications. J. Integr. Agric. 2018, 17, 1915–1931. [Google Scholar] [CrossRef]
- Hernández-Hernández, J.; García-Mateos, G.; González-Esquiva, J.; Escarabajal-Henarejos, D.; Ruiz-Canales, A.; Molina-Martínez, J.M. Optimal color space selection method for plant/soil segmentation in agriculture. Comput. Electron. Agric. 2016, 122, 124–132. [Google Scholar] [CrossRef]
- Jones, H.G.; Serraj, R.; Loveys, B.R.; Xiong, L.; Wheaton, A.; Price, A.H. Thermal infrared imaging of crop canopies for the remote diagnosis and quantification of plant responses to water stress in the field. Funct. Plant Biol. 2009, 36, 978–989. [Google Scholar] [CrossRef] [Green Version]
- Mangus, D.L.; Sharda, A.; Zhang, N. Development and evaluation of thermal infrared imaging system for high spatial and temporal resolution crop water stress monitoring of corn within a greenhouse. Comput. Electron. Agric. 2016, 121, 149–159. [Google Scholar] [CrossRef]
- Liu, X.; Bo, Y. Object-based crop species classification based on the combination of airborne hyperspectral images and LiDAR data. Remote Sens. 2015, 7, 922–950. [Google Scholar] [CrossRef] [Green Version]
- Pearlman, J.; Carman, S.; Segal, C.; Jarecke, P.; Clancy, P.; Browne, W. Overview of the Hyperion imaging spectrometer for the NASA EO-1 mission. In Proceedings of the IGARSS 2001. Scanning the Present and Resolving the Future. IEEE 2001 International Geoscience and Remote Sensing Symposium (Cat. No. 01CH37217), Piscataway, NJ, USA, 9–13 July 2001; Volume 7, pp. 3036–3038. [Google Scholar]
- Poblete-Echeverría, C.; Olmedo, G.; Ingram, B.; Bardeen, M. Detection and segmentation of vine canopy in ultra-high spatial resolution RGB imagery obtained from unmanned aerial vehicle (UAV): A case study in a commercial vineyard. Remote Sens. 2017, 9, 268. [Google Scholar] [CrossRef] [Green Version]
- Lucas, R.; Rowlands, A.; Brown, A.; Keyworth, S.; Bunting, P. Rule-based classification of multitemporal satellite imagery for habitat and agricultural land cover mapping. ISPRS J. Photogramm. Remote Sens. 2007, 62, 165–185. [Google Scholar] [CrossRef]
- Asaari, M.S.M.; Mishra, P.; Mertens, S.; Dhondt, S.; Inzé, D.; Wuyts, N.; Scheunders, P. Close-range hyperspectral image analysis for the early detection of stress responses in individual plants in a high-throughput phenotyping platform. ISPRS J. Photogramm. Remote Sens. 2018, 138, 121–138. [Google Scholar] [CrossRef]
- Müllerová, J.; Brŭna, J.; Bartaloš, T.; Dvořák, P.; Vítková, M.; Pyšek, P. Timing is important: Unmanned aircraft vs. satellite imagery in plant invasion monitoring. Front. Plant Sci. 2017, 8, 887. [Google Scholar] [CrossRef] [PubMed] [Green Version]
- Duveiller, G.; Defourny, P. A conceptual framework to define the spatial resolution requirements for agricultural monitoring using remote sensing. Remote Sens. Environ. 2010, 114, 2637–2650. [Google Scholar] [CrossRef]
- Wei, Z.; Han, Y.; Li, M.; Yang, K.; Yang, Y.; Luo, Y.; Ong, S.H. A small UAV based multitemporal image registration for dynamic agricultural terrace monitoring. Remote Sens. 2017, 9, 904. [Google Scholar] [CrossRef] [Green Version]
- Ji, S.; Zhang, C.; Xu, A.; Shi, Y.; Duan, Y. 3D convolutional neural networks for crop classification with multitemporal remote sensing images. Remote Sens. 2018, 10, 75. [Google Scholar] [CrossRef] [Green Version]
- Yang, C.; Everitt, J.H.; Murden, D. Evaluating high resolution SPOT 5 satellite imagery for crop identification. Comput. Electron. Agric. 2011, 75, 347–354. [Google Scholar] [CrossRef]
- Zhang, X.; Liu, F.; He, Y.; Gong, X. Detecting macronutrients content and distribution in oilseed rape leaves based on hyperspectral imaging. Biosyst. Eng. 2013, 115, 56–65. [Google Scholar] [CrossRef]
- Ač, A.; Malenovskỳ, Z.; Olejníčková, J.; Gallé, A.; Rascher, U.; Mohammed, G. Meta-analysis assessing potential of steady-state chlorophyll fluorescence for remote sensing detection of plant water, temperature and nitrogen stress. Remote Sens. Environ. 2015, 168, 420–436. [Google Scholar] [CrossRef] [Green Version]
- Baghdadi, N.; Boyer, N.; Todoroff, P.; El Hajj, M.; Bégué, A. Potential of SAR sensors TerraSAR-X, ASAR/ENVISAT and PALSAR/ALOS for monitoring sugarcane crops on Reunion Island. Remote Sens. Environ. 2009, 113, 1724–1738. [Google Scholar] [CrossRef]
- Baret, F.; Houles, V.; Guérif, M. Quantification of plant stress using remote sensing observations and crop models: The case of nitrogen management. J. Exp. Bot. 2007, 58, 869–880. [Google Scholar] [CrossRef] [Green Version]
- Baret, F.; Buis, S. Estimating canopy characteristics from remote sensing observations: Review of methods and associated problems. In Advances in Land Remote Sensing; Springer: Berlin/Heidelberg, Germany, 2008; pp. 173–201. [Google Scholar]
- Behmann, J.; Steinrücken, J.; Plümer, L. Detection of early plant stress responses in hyperspectral images. ISPRS J. Photogramm. Remote Sens. 2014, 93, 98–111. [Google Scholar] [CrossRef]
- Bellvert, J.; Marsal, J.; Girona, J.; Gonzalez-Dugo, V.; Fereres, E.; Ustin, S.; Zarco-Tejada, P. Airborne thermal imagery to detect the seasonal evolution of crop water status in peach, nectarine and Saturn peach orchards. Remote Sens. 2016, 8, 39. [Google Scholar] [CrossRef] [Green Version]
- Bendig, J.; Bolten, A.; Bennertz, S.; Broscheit, J.; Eichfuss, S.; Bareth, G. Estimating biomass of barley using crop surface models (CSMs) derived from UAV-based RGB imaging. Remote Sens. 2014, 6, 10395–10412. [Google Scholar] [CrossRef] [Green Version]
- Blaes, X.; Vanhalle, L.; Defourny, P. Efficiency of crop identification based on optical and SAR image time series. Remote Sens. Environ. 2005, 96, 352–365. [Google Scholar] [CrossRef]
- Clevers, J.G.; Kooistra, L.; Schaepman, M.E. Estimating canopy water content using hyperspectral remote sensing data. Int. J. Appl. Earth Obs. Geoinf. 2010, 12, 119–125. [Google Scholar] [CrossRef]
- Er-Raki, S.; Chehbouni, A.; Guemouria, N.; Duchemin, B.; Ezzahar, J.; Hadria, R. Combining FAO-56 model and ground-based remote sensing to estimate water consumptions of wheat crops in a semi-arid region. Agric. Water Manag. 2007, 87, 41–54. [Google Scholar] [CrossRef] [Green Version]
- Garrigues, S.; Allard, D.; Baret, F.; Weiss, M. Influence of landscape spatial heterogeneity on the non-linear estimation of leaf area index from moderate spatial resolution remote sensing data. Remote Sens. Environ. 2006, 105, 286–298. [Google Scholar] [CrossRef]
- Glenn, E.P.; Neale, C.M.; Hunsaker, D.J.; Nagler, P.L. Vegetation index-based crop coefficients to estimate evapotranspiration by remote sensing in agricultural and natural ecosystems. Hydrol. Process. 2011, 25, 4050–4062. [Google Scholar] [CrossRef]
- Gonzalez-Dugo, M.; Neale, C.; Mateos, L.; Kustas, W.; Prueger, J.; Anderson, M.; Li, F. A comparison of operational remote sensing-based models for estimating crop evapotranspiration. Agric. For. Meteorol. 2009, 149, 1843–1853. [Google Scholar] [CrossRef]
- Houborg, R.; Anderson, M.; Daughtry, C. Utility of an image-based canopy reflectance modeling tool for remote estimation of LAI and leaf chlorophyll content at the field scale. Remote Sens. Environ. 2009, 113, 259–274. [Google Scholar] [CrossRef]
- Kaliramesh, S.; Chelladurai, V.; Jayas, D.; Alagusundaram, K.; White, N.; Fields, P. Detection of infestation by Callosobruchus maculatus in mung bean using near-infrared hyperspectral imaging. J. Stored Prod. Res. 2013, 52, 107–111. [Google Scholar] [CrossRef]
- Kong, W.; Zhang, C.; Liu, F.; Nie, P.; He, Y. Rice seed cultivar identification using near-infrared hyperspectral imaging and multivariate data analysis. Sensors 2013, 13, 8916–8927. [Google Scholar] [CrossRef] [PubMed] [Green Version]
- Kullberg, E.G.; DeJonge, K.C.; Chávez, J.L. Evaluation of thermal remote sensing indices to estimate crop evapotranspiration coefficients. Agric. Water Manag. 2017, 179, 64–73. [Google Scholar] [CrossRef] [Green Version]
- Lanorte, A.; De Santis, F.; Nolè, G.; Blanco, I.; Loisi, R.V.; Schettini, E.; Vox, G. Agricultural plastic waste spatial estimation by Landsat 8 satellite images. Comput. Electron. Agric. 2017, 141, 35–45. [Google Scholar] [CrossRef]
- Lawrence, R.L.; Wood, S.D.; Sheley, R.L. Mapping invasive plants using hyperspectral imagery and Breiman Cutler classifications (RandomForest). Remote Sens. Environ. 2006, 100, 356–362. [Google Scholar] [CrossRef]
- Li, H.; Zheng, L.; Lei, Y.; Li, C.; Liu, Z.; Zhang, S. Estimation of water consumption and crop water productivity of winter wheat in North China Plain using remote sensing technology. Agric. Water Manag. 2008, 95, 1271–1278. [Google Scholar] [CrossRef]
- Li, Y.; Zhou, Q.; Zhou, J.; Zhang, G.; Chen, C.; Wang, J. Assimilating remote sensing information into a coupled hydrology-crop growth model to estimate regional maize yield in arid regions. Ecol. Model. 2014, 291, 15–27. [Google Scholar] [CrossRef]
- Lobell, D.B.; Asner, G.P.; Ortiz-Monasterio, J.I.; Benning, T.L. Remote sensing of regional crop production in the Yaqui Valley, Mexico: Estimates and uncertainties. Agric. Ecosyst. Environ. 2003, 94, 205–220. [Google Scholar] [CrossRef] [Green Version]
- López-López, M.; Calderón, R.; González-Dugo, V.; Zarco-Tejada, P.; Fereres, E. Early detection and quantification of almond red leaf blotch using high-resolution hyperspectral and thermal imagery. Remote Sens. 2016, 8, 276. [Google Scholar] [CrossRef] [Green Version]
- Löw, F.; Duveiller, G. Defining the spatial resolution requirements for crop identification using optical remote sensing. Remote Sens. 2014, 6, 9034–9063. [Google Scholar] [CrossRef] [Green Version]
- Lowe, A.; Harrison, N.; French, A.P. Hyperspectral image analysis techniques for the detection and classification of the early onset of plant disease and stress. Plant Methods 2017, 13, 80. [Google Scholar] [CrossRef] [PubMed]
- Mahesh, S.; Jayas, D.; Paliwal, J.; White, N. Hyperspectral imaging to classify and monitor quality of agricultural materials. J. Stored Prod. Res. 2015, 61, 17–26. [Google Scholar] [CrossRef]
- Marshall, M.; Thenkabail, P. Developing in situ non-destructive estimates of crop biomass to address issues of scale in remote sensing. Remote Sens. 2015, 7, 808–835. [Google Scholar] [CrossRef] [Green Version]
- Mehl, P.; Chao, K.; Kim, M.; Chen, Y. Detection of defects on selected apple cultivars using hyperspectral and multispectral image analysis. Appl. Eng. Agric. 2002, 18, 219. [Google Scholar]
- Moran, M.S.; Inoue, Y.; Barnes, E. Opportunities and limitations for image-based remote sensing in precision crop management. Remote Sens. Environ. 1997, 61, 319–346. [Google Scholar] [CrossRef]
- Moudrỳ, V.; Gdulová, K.; Fogl, M.; Klápště, P.; Urban, R.; Komárek, J.; Moudrá, L.; Štroner, M.; Barták, V.; Solskỳ, M. Comparison of leaf-off and leaf-on combined UAV imagery and airborne LiDAR for assessment of a post-mining site terrain and vegetation structure: Prospects for monitoring hazards and restoration success. Appl. Geogr. 2019, 104, 32–41. [Google Scholar] [CrossRef]
- Müllerová, J.; Pergl, J.; Pyšek, P. Remote sensing as a tool for monitoring plant invasions: Testing the effects of data resolution and image classification approach on the detection of a model plant species Heracleum mantegazzianum (giant hogweed). Int. J. Appl. Earth Obs. Geoinf. 2013, 25, 55–65. [Google Scholar] [CrossRef]
- Pandey, A.; Chowdary, V.; Mal, B. Identification of critical erosion prone areas in the small agricultural watershed using USLE, GIS and remote sensing. Water Resour. Manag. 2007, 21, 729–746. [Google Scholar] [CrossRef]
- Pinter, P.J., Jr.; Hatfield, J.L.; Schepers, J.S.; Barnes, E.M.; Moran, M.S.; Daughtry, C.S.; Upchurch, D.R. Remote sensing for crop management. Photogramm. Eng. Remote Sens. 2003, 69, 647–664. [Google Scholar] [CrossRef] [Green Version]
- Prasad, A.K.; Chai, L.; Singh, R.P.; Kafatos, M. Crop yield estimation model for Iowa using remote sensing and surface parameters. Int. J. Appl. Earth Obs. Geoinf. 2006, 8, 26–33. [Google Scholar] [CrossRef]
- Schlerf, M.; Atzberger, C. Inversion of a forest reflectance model to estimate structural canopy variables from hyperspectral remote sensing data. Remote Sens. Environ. 2006, 100, 281–294. [Google Scholar] [CrossRef]
- Siachalou, S.; Mallinis, G.; Tsakiri-Strati, M. A hidden Markov models approach for crop classification: Linking crop phenology to time series of multi-sensor remote sensing data. Remote Sens. 2015, 7, 3633–3650. [Google Scholar] [CrossRef] [Green Version]
- Thomas, S.; Kuska, M.T.; Bohnenkamp, D.; Brugger, A.; Alisaac, E.; Wahabzada, M.; Behmann, J.; Mahlein, A.K. Benefits of hyperspectral imaging for plant disease detection and plant protection: A technical perspective. J. Plant Dis. Prot. 2018, 125, 5–20. [Google Scholar] [CrossRef]
- Xie, C.; Yang, C.; He, Y. Hyperspectral imaging for classification of healthy and gray mold diseased tomato leaves with different infection severities. Comput. Electron. Agric. 2017, 135, 154–162. [Google Scholar] [CrossRef]
- Yue, J.; Feng, H.; Jin, X.; Yuan, H.; Li, Z.; Zhou, C.; Yang, G.; Tian, Q. A comparison of crop parameters estimation using images from UAV-mounted snapshot hyperspectral sensor and high-definition digital camera. Remote Sens. 2018, 10, 1138. [Google Scholar] [CrossRef] [Green Version]
- Ma, Y.; Wang, S.; Zhang, L.; Hou, Y.; Zhuang, L.; He, Y.; Wang, F. Monitoring winter wheat growth in North China by combining a crop model and remote sensing data. Int. J. Appl. Earth Obs. Geoinf. 2008, 10, 426–437. [Google Scholar]
- Zhao, Y.; Chen, S.; Shen, S. Assimilating remote sensing information with crop model using Ensemble Kalman Filter for improving LAI monitoring and yield estimation. Ecol. Model. 2013, 270, 30–42. [Google Scholar] [CrossRef]
- Anderson, L.O.; Malhi, Y.; Aragão, L.E.; Ladle, R.; Arai, E.; Barbier, N.; Phillips, O. Remote sensing detection of droughts in Amazonian forest canopies. New Phytol. 2010, 187, 733–750. [Google Scholar] [CrossRef]
- Bendig, J.; Bolten, A.; Bareth, G. UAV-based imaging for multitemporal, very high Resolution Crop Surface Models to monitor Crop Growth VariabilityMonitoring des Pflanzenwachstums mit Hilfe multitemporaler und hoch auflösender Oberflächenmodelle von Getreidebeständen auf Basis von Bildern aus UAV-Befliegungen. Photogramm. Fernerkund. Geoinf. 2013, 2013, 551–562. [Google Scholar]
- Calera, A.; Campos, I.; Osann, A.; D’Urso, G.; Menenti, M. Remote sensing for crop water management: From ET modelling to services for the end users. Sensors 2017, 17, 1104. [Google Scholar] [CrossRef] [Green Version]
- Kamble, B.; Kilic, A.; Hubbard, K. Estimating crop coefficients using remote sensing-based vegetation index. Remote Sens. 2013, 5, 1588–1602. [Google Scholar] [CrossRef] [Green Version]
- Leinonen, I.; Jones, H.G. Combining thermal and visible imagery for estimating canopy temperature and identifying plant stress. J. Exp. Bot. 2004, 55, 1423–1431. [Google Scholar] [CrossRef] [Green Version]
- Möller, M.; Alchanatis, V.; Cohen, Y.; Meron, M.; Tsipris, J.; Naor, A.; Ostrovsky, V.; Sprintsin, M.; Cohen, S. Use of thermal and visible imagery for estimating crop water status of irrigated grapevine. J. Exp. Bot. 2006, 58, 827–838. [Google Scholar] [CrossRef] [PubMed] [Green Version]
- Park, S.; Ryu, D.; Fuentes, S.; Chung, H.; Hernández-Montes, E.; O’Connell, M. Adaptive estimation of crop water stress in nectarine and peach orchards using high-resolution imagery from an unmanned aerial vehicle (UAV). Remote Sens. 2017, 9, 828. [Google Scholar] [CrossRef] [Green Version]
- Santesteban, L.; Di Gennaro, S.; Herrero-Langreo, A.; Miranda, C.; Royo, J.; Matese, A. High-resolution UAV-based thermal imaging to estimate the instantaneous and seasonal variability of plant water status within a vineyard. Agric. Water Manag. 2017, 183, 49–59. [Google Scholar] [CrossRef]
- Suárez, L.; Zarco-Tejada, P.J.; Sepulcre-Cantó, G.; Pérez-Priego, O.; Miller, J.; Jiménez-Muñoz, J.; Sobrino, J. Assessing canopy PRI for water stress detection with diurnal airborne imagery. Remote Sens. Environ. 2008, 112, 560–575. [Google Scholar] [CrossRef]
- Torres-Sánchez, J.; López-Granados, F.; Peña, J.M. An automatic object-based method for optimal thresholding in UAV images: Application for vegetation detection in herbaceous crops. Comput. Electron. Agric. 2015, 114, 43–52. [Google Scholar] [CrossRef]
- Capolupo, A.; Kooistra, L.; Berendonk, C.; Boccia, L.; Suomalainen, J. Estimating plant traits of grasslands from UAV-acquired hyperspectral images: A comparison of statistical approaches. ISPRS Int. J. Geo-Inf. 2015, 4, 2792–2820. [Google Scholar] [CrossRef]
- Carreiras, J.M.; Pereira, J.M.; Pereira, J.S. Estimation of tree canopy cover in evergreen oak woodlands using remote sensing. For. Ecol. Manag. 2006, 223, 45–53. [Google Scholar] [CrossRef]
- Cohen, Y.; Alchanatis, V.; Meron, M.; Saranga, Y.; Tsipris, J. Estimation of leaf water potential by thermal imagery and spatial analysis. J. Exp. Bot. 2005, 56, 1843–1852. [Google Scholar] [CrossRef] [Green Version]
- Di Gennaro, S.F.; Battiston, E.; Di Marco, S.; Facini, O.; Matese, A.; Nocentini, M.; Palliotti, A.; Mugnai, L. Unmanned Aerial Vehicle (UAV)-based remote sensing to monitor grapevine leaf stripe disease within a vineyard affected by esca complex. Phytopathol. Mediterr. 2016, 55, 262–275. [Google Scholar]
- Drake, J.B.; Knox, R.G.; Dubayah, R.O.; Clark, D.B.; Condit, R.; Blair, J.B.; Hofton, M. Above-ground biomass estimation in closed canopy neotropical forests using lidar remote sensing: Factors affecting the generality of relationships. Glob. Ecol. Biogeogr. 2003, 12, 147–159. [Google Scholar] [CrossRef]
- Hütt, C.; Koppe, W.; Miao, Y.; Bareth, G. Best accuracy land use/land cover (LULC) classification to derive crop types using multitemporal, multisensor, and multi-polarization SAR satellite images. Remote Sens. 2016, 8, 684. [Google Scholar] [CrossRef] [Green Version]
- Possoch, M.; Bieker, S.; Hoffmeister, D.; Bolten, A.; Schellberg, J.; Bareth, G. Multi-temporal crop surface models combined with the RGB vegetation index from UAV-based images for forage monitoring in grassland. Int. Arch. Photogramm. Remote Sens. Spat. Inf. Sci. 2016, 41, 991. [Google Scholar] [CrossRef]
- Sagan, V.; Maimaitijiang, M.; Sidike, P.; Eblimit, K.; Peterson, K.T.; Hartling, S.; Esposito, F.; Khanal, K.; Newcomb, M.; Pauli, D.; et al. Uav-based high resolution thermal imaging for vegetation monitoring, and plant phenotyping using ici 8640 p, flir vue pro r 640, and thermomap cameras. Remote Sens. 2019, 11, 330. [Google Scholar] [CrossRef] [Green Version]
- Schirrmann, M.; Giebel, A.; Gleiniger, F.; Pflanz, M.; Lentschke, J.; Dammer, K.H. Monitoring agronomic parameters of winter wheat crops with low-cost UAV imagery. Remote Sens. 2016, 8, 706. [Google Scholar] [CrossRef] [Green Version]
- Swain, K.C.; Thomson, S.J.; Jayasuriya, H.P. Adoption of an unmanned helicopter for low-altitude remote sensing to estimate yield and total biomass of a rice crop. Trans. ASAE Am. Soc. Agric. Eng. 2010, 53, 21. [Google Scholar]
- Yebra, M.; Van Dijk, A.; Leuning, R.; Huete, A.; Guerschman, J.P. Evaluation of optical remote sensing to estimate actual evapotranspiration and canopy conductance. Remote Sens. Environ. 2013, 129, 250–261. [Google Scholar] [CrossRef]
- Agapiou, A.; Alexakis, D.D.; Hadjimitsis, D.G. Spectral sensitivity of ALOS, ASTER, IKONOS, LANDSAT and SPOT satellite imagery intended for the detection of archaeological crop marks. Int. J. Digit. Earth 2014, 7, 351–372. [Google Scholar] [CrossRef]
- Chianucci, F.; Disperati, L.; Guzzi, D.; Bianchini, D.; Nardino, V.; Lastri, C.; Rindinella, A.; Corona, P. Estimation of canopy attributes in beech forests using true colour digital images from a small fixed-wing UAV. Int. J. Appl. Earth Obs. Geoinf. 2016, 47, 60–68. [Google Scholar] [CrossRef] [Green Version]
- Inglada, J.; Vincent, A.; Arias, M.; Marais-Sicre, C. Improved early crop type identification by joint use of high temporal resolution SAR and optical image time series. Remote Sens. 2016, 8, 362. [Google Scholar] [CrossRef] [Green Version]
- Li, W.; Niu, Z.; Chen, H.; Li, D.; Wu, M.; Zhao, W. Remote estimation of canopy height and aboveground biomass of maize using high-resolution stereo images from a low-cost unmanned aerial vehicle system. Ecol. Indic. 2016, 67, 637–648. [Google Scholar] [CrossRef]
- Mintenig, S.; Int-Veen, I.; Löder, M.G.; Primpke, S.; Gerdts, G. Identification of microplastic in effluents of waste water treatment plants using focal plane array-based micro-Fourier-transform infrared imaging. Water Res. 2017, 108, 365–372. [Google Scholar] [CrossRef] [PubMed]
- Wu, B.; Meng, J.; Li, Q.; Yan, N.; Du, X.; Zhang, M. Remote sensing-based global crop monitoring: Experiences with China’s CropWatch system. Int. J. Digit. Earth 2014, 7, 113–137. [Google Scholar] [CrossRef]
- Bock, C.; Poole, G.; Parker, P.; Gottwald, T. Plant disease severity estimated visually, by digital photography and image analysis, and by hyperspectral imaging. Crit. Rev. Plant Sci. 2010, 29, 59–107. [Google Scholar] [CrossRef]
- Bovensmann, H.; Buchwitz, M.; Burrows, J.; Reuter, M.; Krings, T.; Gerilowski, K.; Schneising, O.; Heymann, J.; Tretner, A.; Erzinger, J. A remote sensing technique for global monitoring of power plant CO2 emissions from space and related applications. Atmos. Meas. Tech. 2010, 3, 781–811. [Google Scholar] [CrossRef] [Green Version]
- Chaerle, L.; Leinonen, I.; Jones, H.G.; Van Der Straeten, D. Monitoring and screening plant populations with combined thermal and chlorophyll fluorescence imaging. J. Exp. Bot. 2006, 58, 773–784. [Google Scholar] [CrossRef] [Green Version]
- Jin, X.; Liu, S.; Baret, F.; Hemerlé, M.; Comar, A. Estimates of plant density of wheat crops at emergence from very low altitude UAV imagery. Remote Sens. Environ. 2017, 198, 105–114. [Google Scholar] [CrossRef] [Green Version]
- Lasaponara, R.; Masini, N. Detection of archaeological crop marks by using satellite QuickBird multispectral imagery. J. Archaeol. Sci. 2007, 34, 214–221. [Google Scholar] [CrossRef]
- Prince, G.; Clarkson, J.P.; Rajpoot, N.M. Automatic detection of diseased tomato plants using thermal and stereo visible light images. PLoS ONE 2015, 10, e0123262. [Google Scholar]
- Rhee, J.; Im, J.; Carbone, G.J. Monitoring agricultural drought for arid and humid regions using multi-sensor remote sensing data. Remote Sens. Environ. 2010, 114, 2875–2887. [Google Scholar] [CrossRef]
- Smith, M.L.; Ollinger, S.V.; Martin, M.E.; Aber, J.D.; Hallett, R.A.; Goodale, C.L. Direct estimation of aboveground forest productivity through hyperspectral remote sensing of canopy nitrogen. Ecol. Appl. 2002, 12, 1286–1302. [Google Scholar] [CrossRef]
- Yue, J.; Yang, G.; Li, C.; Li, Z.; Wang, Y.; Feng, H.; Xu, B. Estimation of winter wheat above-ground biomass using unmanned aerial vehicle-based snapshot hyperspectral sensor and crop height improved models. Remote Sens. 2017, 9, 708. [Google Scholar] [CrossRef] [Green Version]
- Zarco-Tejada, P.J.; Guillén-Climent, M.L.; Hernández-Clemente, R.; Catalina, A.; González, M.; Martín, P. Estimating leaf carotenoid content in vineyards using high resolution hyperspectral imagery acquired from an unmanned aerial vehicle (UAV). Agric. For. Meteorol. 2013, 171, 281–294. [Google Scholar] [CrossRef] [Green Version]
- Elarab, M.; Ticlavilca, A.M.; Torres-Rua, A.F.; Maslova, I.; McKee, M. Estimating chlorophyll with thermal and broadband multispectral high resolution imagery from an unmanned aerial system using relevance vector machines for precision agriculture. Int. J. Appl. Earth Obs. Geoinf. 2015, 43, 32–42. [Google Scholar] [CrossRef] [Green Version]
- Kalacska, M.; Lalonde, M.; Moore, T. Estimation of foliar chlorophyll and nitrogen content in an ombrotrophic bog from hyperspectral data: Scaling from leaf to image. Remote Sens. Environ. 2015, 169, 270–279. [Google Scholar] [CrossRef]
- Moeckel, T.; Dayananda, S.; Nidamanuri, R.; Nautiyal, S.; Hanumaiah, N.; Buerkert, A.; Wachendorf, M. Estimation of vegetable crop parameter by multitemporal UAV-borne images. Remote Sens. 2018, 10, 805. [Google Scholar] [CrossRef] [Green Version]
- Moshou, D.; Bravo, C.; Oberti, R.; West, J.; Bodria, L.; McCartney, A.; Ramon, H. Plant disease detection based on data fusion of hyperspectral and multi-spectral fluorescence imaging using Kohonen maps. Real-Time Imaging 2005, 11, 75–83. [Google Scholar] [CrossRef]
- Rußwurm, M.; Korner, M. Temporal vegetation modelling using long short-term memory networks for crop identification from medium-resolution multi-spectral satellite images. In Proceedings of the IEEE Conference on Computer Vision and Pattern Recognition Workshops, Honolulu, HI, USA, 21–26 July 2017; pp. 11–19. [Google Scholar]
- Skakun, S.; Kussul, N.; Shelestov, A.Y.; Lavreniuk, M.; Kussul, O. Efficiency assessment of multitemporal C-band Radarsat-2 intensity and Landsat-8 surface reflectance satellite imagery for crop classification in Ukraine. IEEE J. Sel. Top. Appl. Earth Obs. Remote Sens. 2015, 9, 3712–3719. [Google Scholar] [CrossRef]
- Xie, C.; Shao, Y.; Li, X.; He, Y. Detection of early blight and late blight diseases on tomato leaves using hyperspectral imaging. Sci. Rep. 2015, 5, 16564. [Google Scholar] [CrossRef]
- Gracia-Romero, A.; Kefauver, S.C.; Fernandez-Gallego, J.A.; Vergara-Díaz, O.; Nieto-Taladriz, M.T.; Araus, J.L. UAV and ground image-based phenotyping: A proof of concept with Durum wheat. Remote Sens. 2019, 11, 1244. [Google Scholar] [CrossRef] [Green Version]
- Franceschet, M. The role of conference publications in CS. Commun. ACM 2010, 53, 129–132. [Google Scholar] [CrossRef]
- Vrettas, G.; Sanderson, M. Conferences versus journals in computer science. J. Assoc. Inf. Sci. Technol. 2015, 66, 2674–2684. [Google Scholar] [CrossRef]
- Zou, Y.; Li, G.; Wang, S. The Fusion of Satellite and Unmanned Aerial Vehicle (UAV) Imagery for Improving Classification Performance. In Proceedings of the 2018 IEEE International Conference on Information and Automation (ICIA), Wuyishan, China, 11–13 August 2018; pp. 836–841. [Google Scholar]
- Abbaspour-Gilandeh, Y.; Sabzi, S.; Benmouna, B.; García-Mateos, G.; Hernández-Hernández, J.L.; Molina-Martínez, J.M. Estimation of the Constituent Properties of Red Delicious Apples Using a Hybrid of Artificial Neural Networks and Artificial Bee Colony Algorithm. Agronomy 2020, 10, 267. [Google Scholar] [CrossRef] [Green Version]


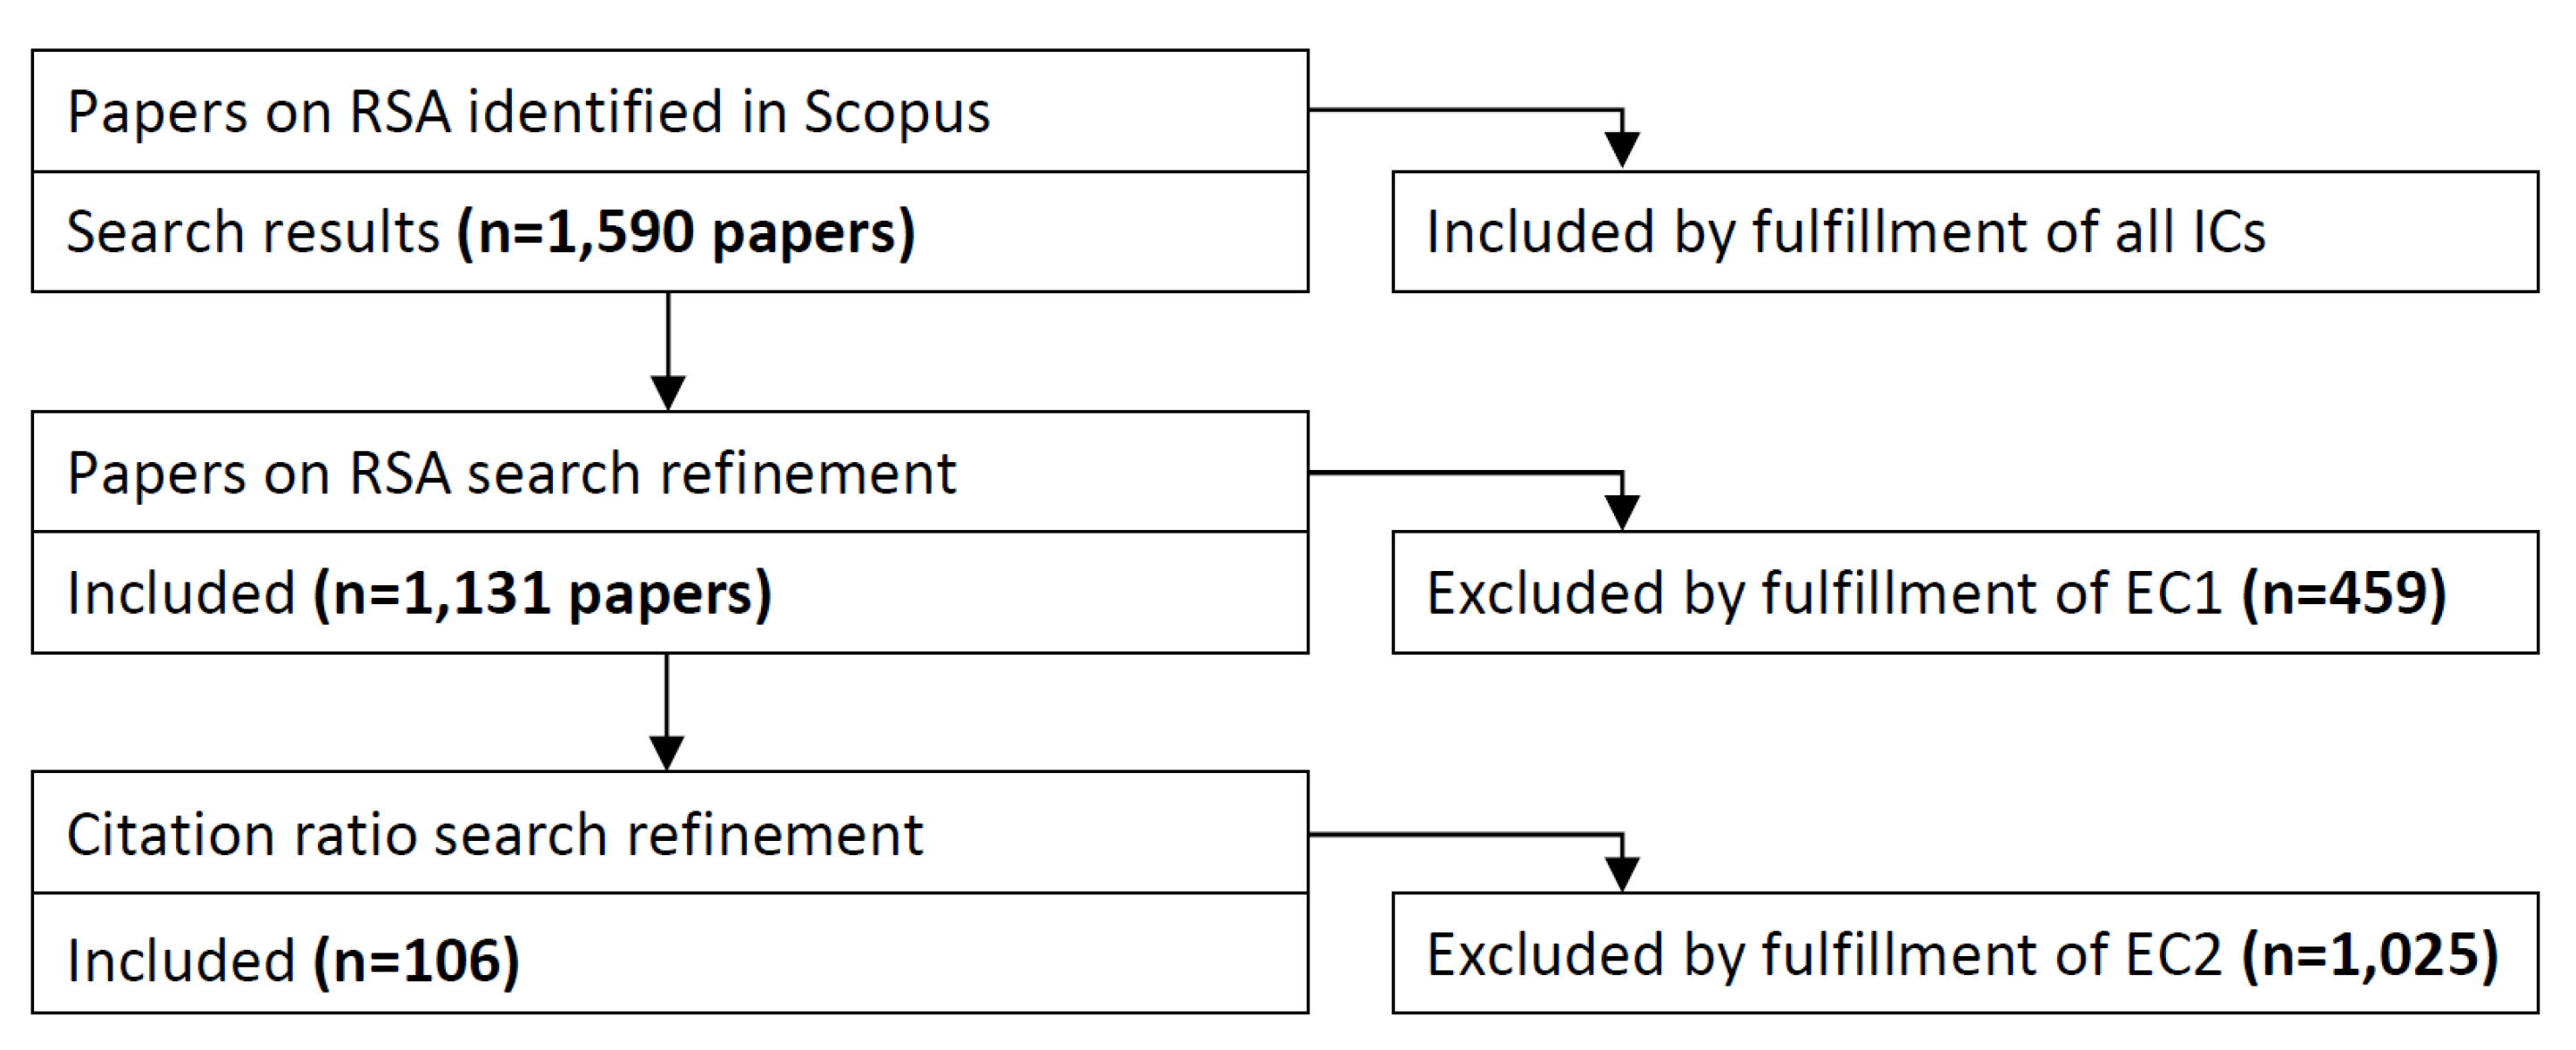
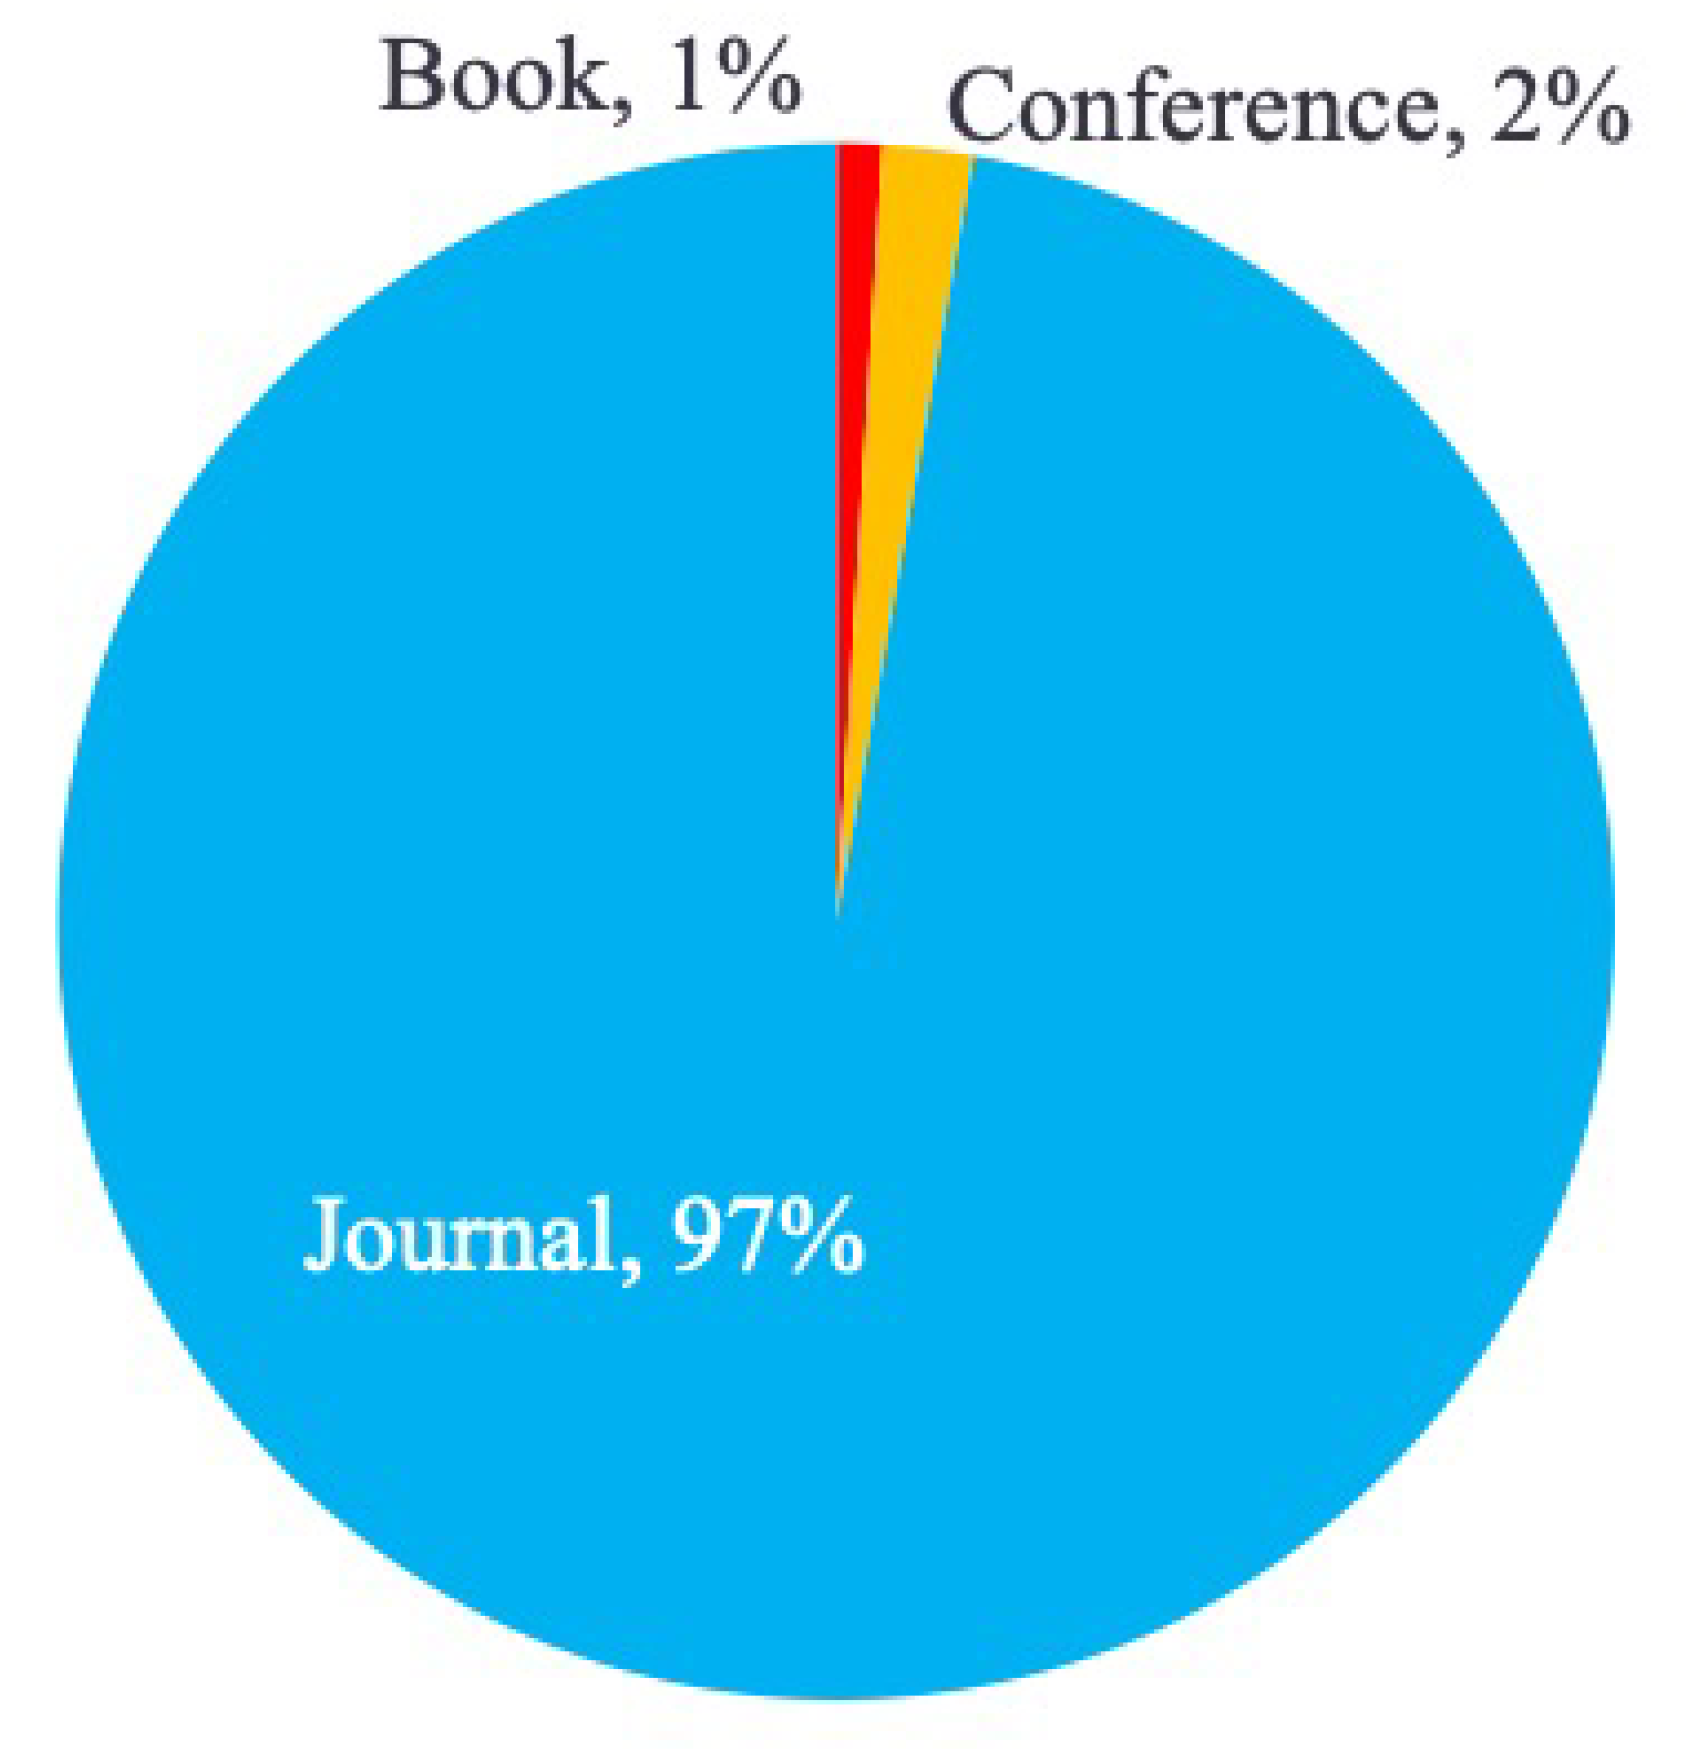
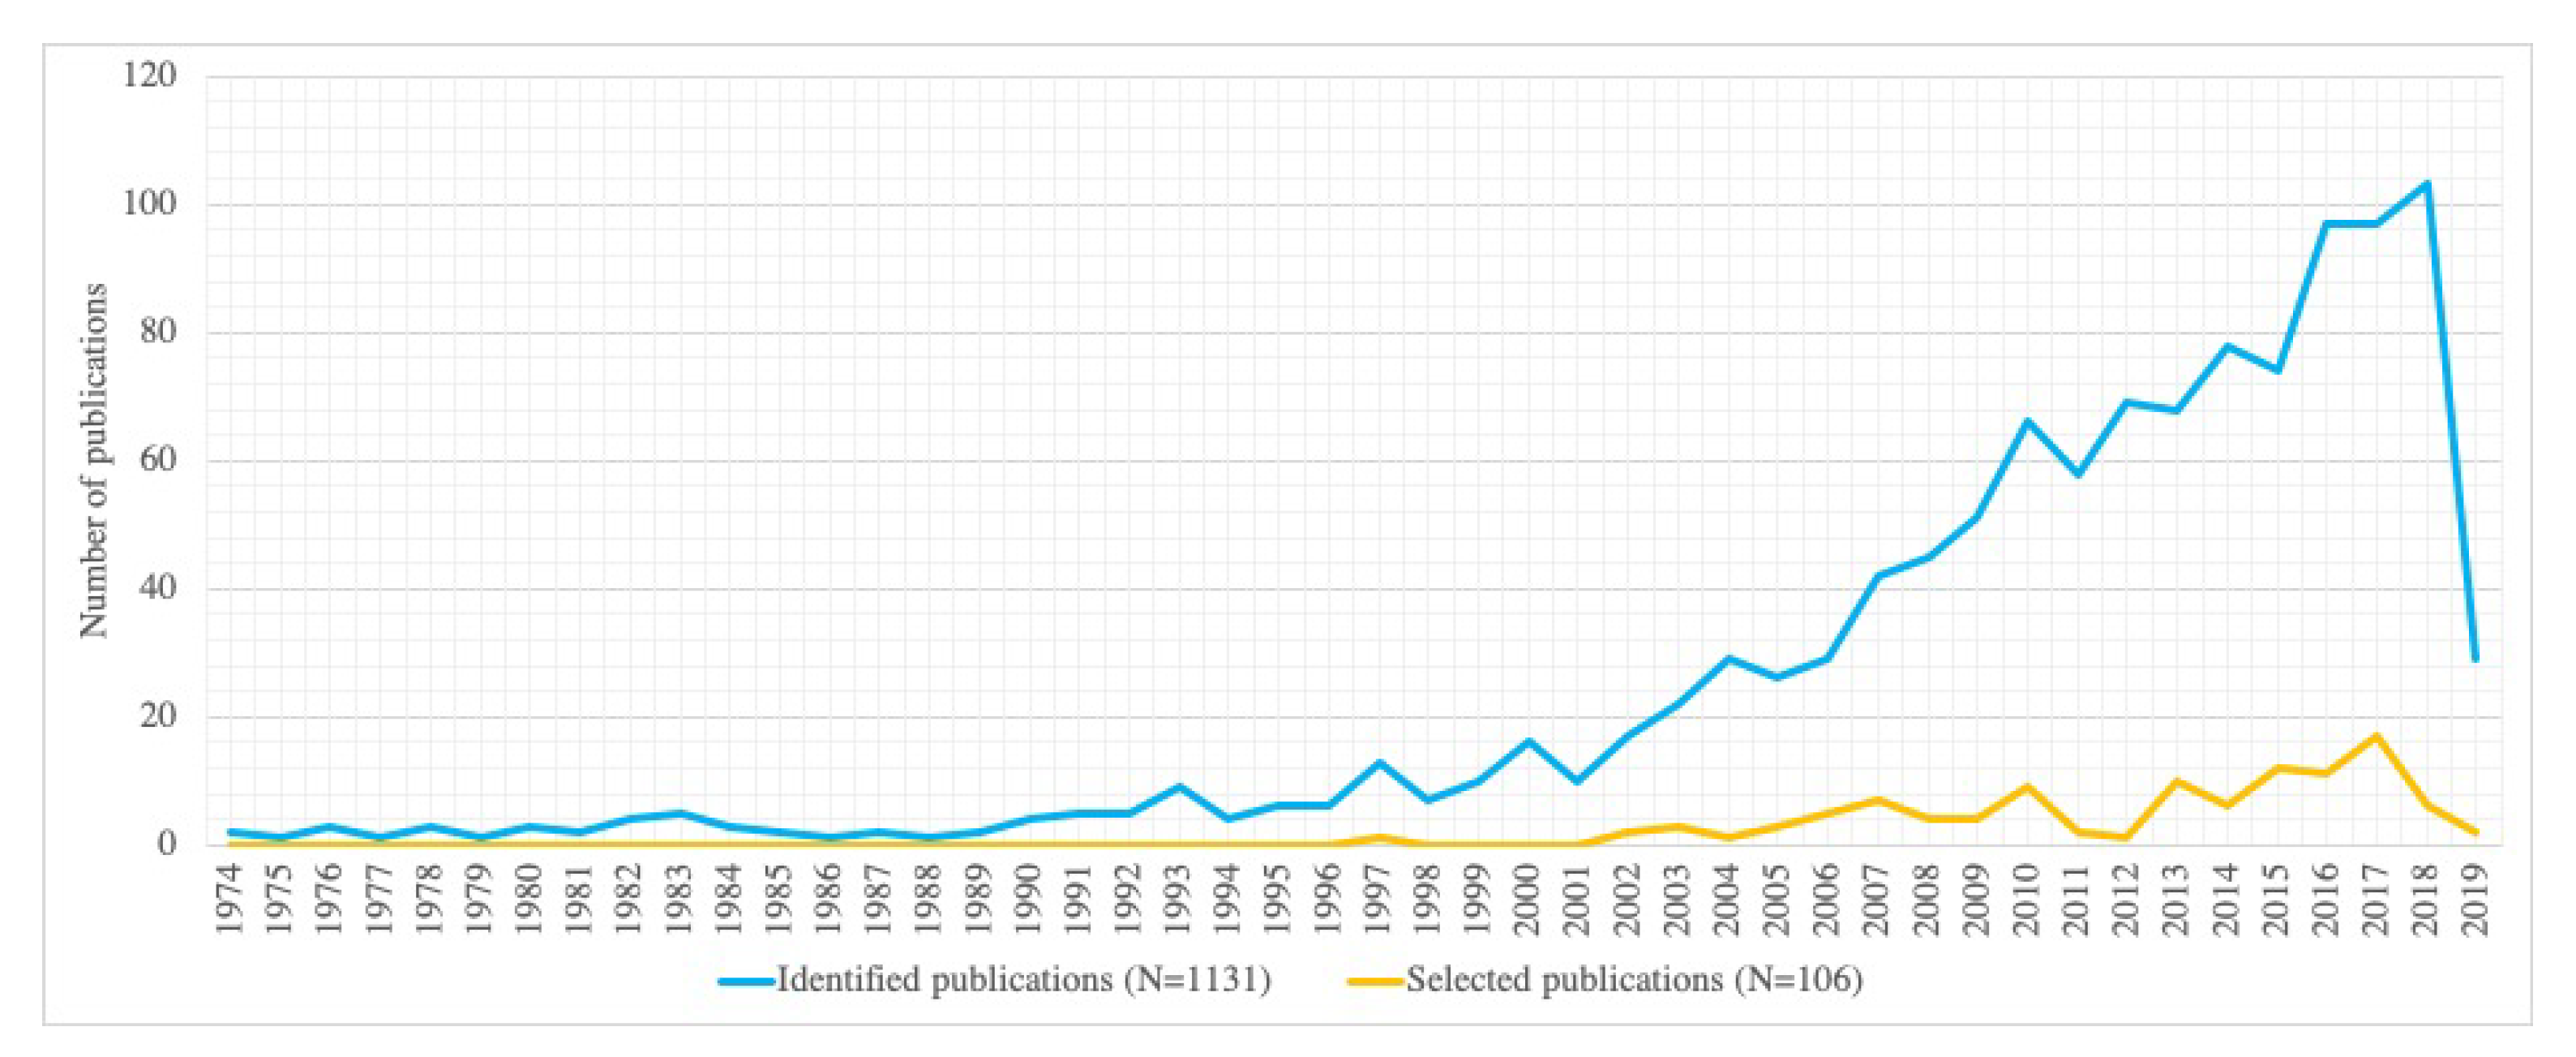
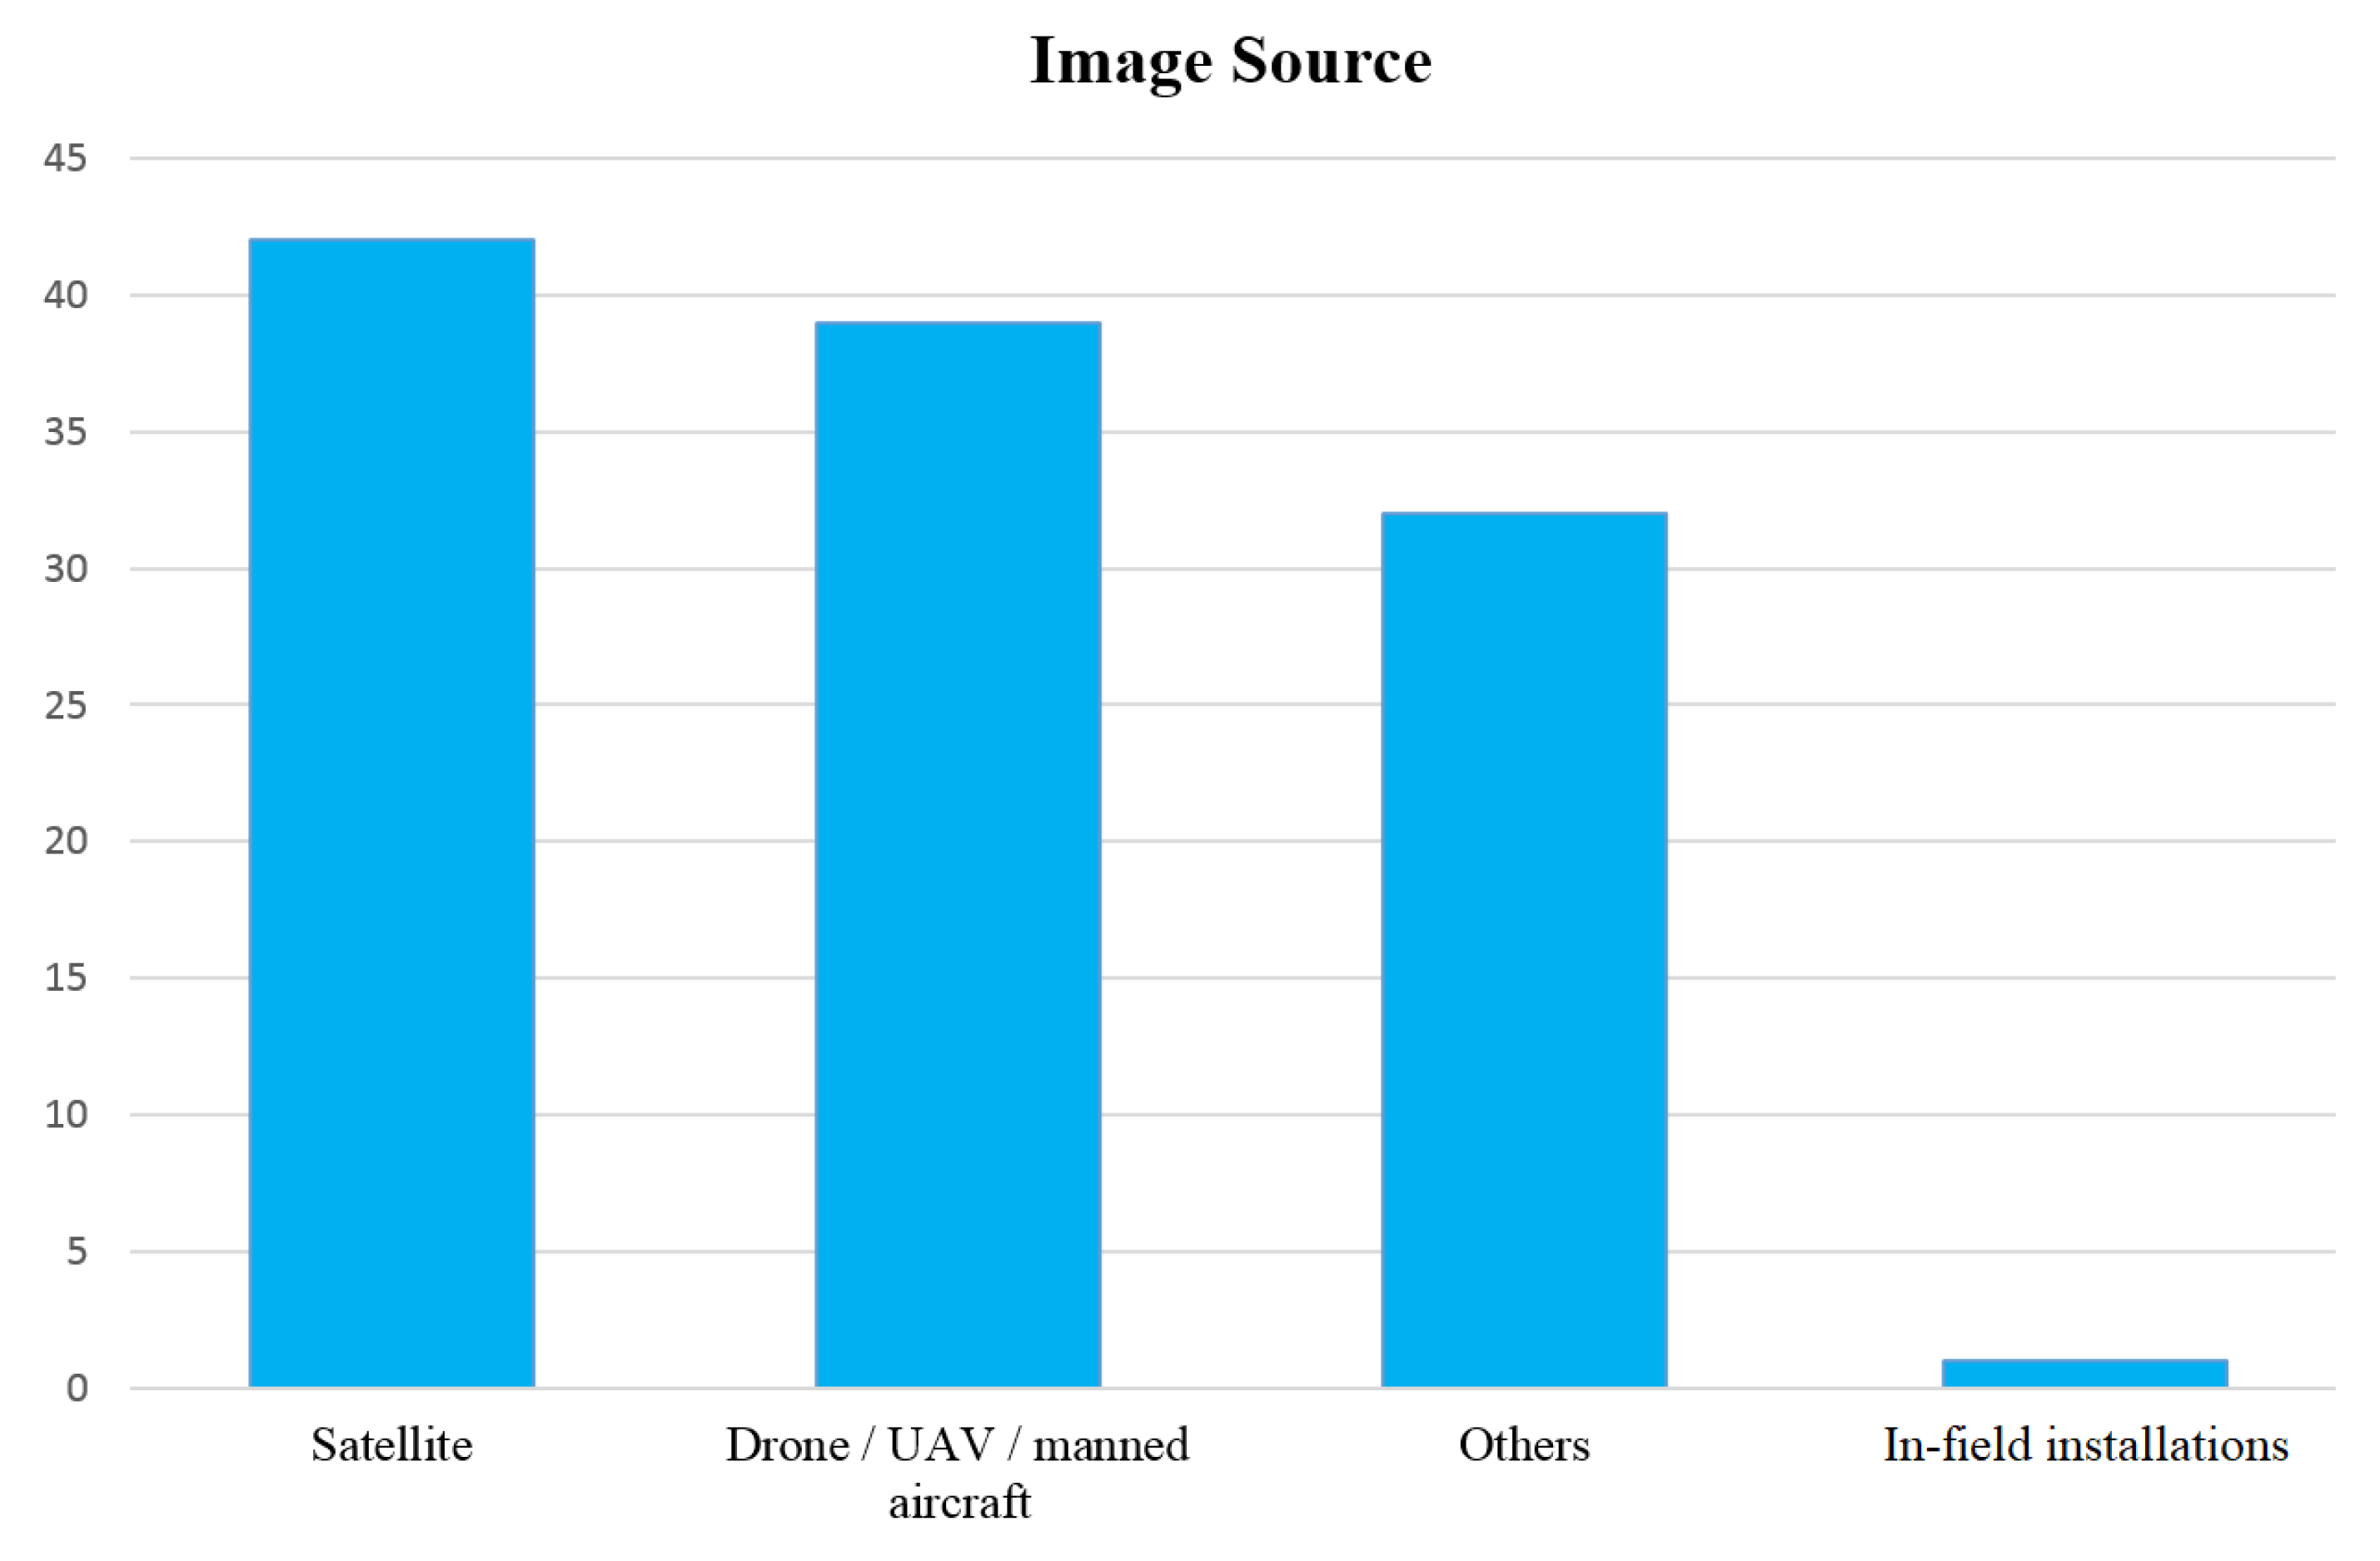
| ID | Mapping Question | Rationale |
|---|---|---|
| MQ1 | What publication channels are the main targets for RSA? | Identifying where RSA research can be found, and the most adequate publication channels for future works |
| MQ2 | How has the frequency of approaches related to RSA changed over time? | Identifying publication trends over time related to RSA |
| MQ3 | What are the main research types of RSA studies? | Exploring different types of research existing in the literature about RSA |
| MQ4 | Are RSA studies empirically validated? | Discovering if research works on RSA has been validated with empirical methods |
| MQ5 | What types of techniques were reported in RSA research? | Detecting the most important types of computer vision and machine learning techniques reported in the existing RSA literature |
| MQ6 | What are the platforms used to capture the images for RSA? | Exposing the main types of devices employed to obtain the images in RSA |
| MQ7 | What are the research topics addressed by RSA? | Studying what are the most prominent topics currently tackled in RSA research |
| MQ8 | What are the different types of spectral information used? | Analyzing what types of images are the most frequently used in RSA research |
| Journal Name | Total |
|---|---|
| Remote Sensing | 20 |
| Remote Sensing of Environment | 15 |
| Journal of Experimental Botany | 6 |
| International Journal of Applied Earth Observation and Geoinformation | 6 |
| Computers and Electronics in Agriculture | 5 |
| Agricultural Water Management | 4 |
| Agricultural and Forest Meteorology | 3 |
| ISPRS Journal of Photogrammetry and Remote Sensing | 3 |
| Journal of Stored Products Research | 2 |
| Ecological Modelling | 2 |
| International Journal of Digital Earth | 2 |
| Techniques | Ref. | Total |
|---|---|---|
| Classification systems | [101,104,106,108,110,111,112,113,114,115,116,117,118,119,120,121,122,123,124,125,126,127,128,129,130,131,132,133,134,135,136,137,138,139,140,141,142,143,144,145,146,147,148,149,150,151,152,153,154,155,156,157,158,159] | 54 |
| Feature extraction | [41,91,107,108,111,155,160,161,162,163,164,165,166,167,168,169] | 16 |
| Similarity and maximum likelihood | [92,117,118,170,171,172,173,174,175,176,177,178,179,180] | 14 |
| Preprocessing and segmentation | [108,112,113,114,115,181,182,183,184,185,186] | 11 |
| Recognition systems | [96,187,188,189,190,191,192,193,194,195,196] | 11 |
| Other machine learning algorithms | [79,95,110,116,197,198,199,200,201,202,203] | 11 |
| Research Topic | Ref. | Total |
|---|---|---|
| Agricultural parameters extraction | [79,91,95,96,104,108,110,111,114,120,122,125,126,129,136,142,147,148,150,153,154,157,161,175,178,181,182,183,184,188,191,196,201,202] | 34 |
| Growth vigor | [91,92,114,115,116,117,132,139,142,144,145,152,158,159,161,171,174,176,177,184,189,190,194,195,197,199] | 26 |
| Drought stress, irrigation and water productivity | [91,101,106,107,119,124,127,128,130,131,135,138,151,155,162,163,165,166,167,172,180] | 21 |
| Detection of pathogens, diseases and insect pests | [133,141,143,146,155,156,173,187,192,200,203] | 11 |
| Yield prediction | [91,134,140,151,152,159,179,186] | 8 |
| Weed detection | [113,137,149,169,170] | 5 |
| Nutrient status | [118,121,151,198] | 4 |
| Automatic crop harvesting | - | 0 |
| Spectral Information | Ref. | Total |
|---|---|---|
| RGB (visible spectrum) | [79,91,95,104,110,111,113,115,116,117,118,121,122,125,126,130,132,140,142,145,147,148,150,151,152,160,161,162,164,165,169,171,176,178,179,180,182,183,184,186,187,188,190,192,193,199] | 46 |
| Hyperspectral (narrow band) | [91,96,104,108,112,118,123,127,134,137,141,143,144,146,153,155,156,157,168,170,187,194,195,196,198,200,201,203] | 28 |
| Long-wave infrared (thermal) | [41,101,106,107,124,131,135,136,138,141,151,155,164,165,166,167,168,172,177,189,193,197] | 22 |
| Near infrared (NIR) | [116,117,118,121,130,133,134,142,145,151,158,181,186,193] | 14 |
| Multispectral (broad band) | [114,129,139,146,149,154,159,163,171,173,197,200,201] | 13 |
| Red edge spectrum | [101,104,119,128,132,142,158,160,181,185,188,191] | 12 |
| Synthetic aperture radar (SAR) | [79,104,120,121,126,183,202] | 7 |
| Light detection and ranging (LiDAR) | [92,108,148,174] | 4 |
| Short-wave infrared | [117,121] | 2 |
© 2020 by the authors. Licensee MDPI, Basel, Switzerland. This article is an open access article distributed under the terms and conditions of the Creative Commons Attribution (CC BY) license (http://creativecommons.org/licenses/by/4.0/).
Share and Cite
García-Berná, J.A.; Ouhbi, S.; Benmouna, B.; García-Mateos, G.; Fernández-Alemán, J.L.; Molina-Martínez, J.M. Systematic Mapping Study on Remote Sensing in Agriculture. Appl. Sci. 2020, 10, 3456. https://doi.org/10.3390/app10103456
García-Berná JA, Ouhbi S, Benmouna B, García-Mateos G, Fernández-Alemán JL, Molina-Martínez JM. Systematic Mapping Study on Remote Sensing in Agriculture. Applied Sciences. 2020; 10(10):3456. https://doi.org/10.3390/app10103456
Chicago/Turabian StyleGarcía-Berná, José Alberto, Sofia Ouhbi, Brahim Benmouna, Ginés García-Mateos, José Luis Fernández-Alemán, and José Miguel Molina-Martínez. 2020. "Systematic Mapping Study on Remote Sensing in Agriculture" Applied Sciences 10, no. 10: 3456. https://doi.org/10.3390/app10103456
APA StyleGarcía-Berná, J. A., Ouhbi, S., Benmouna, B., García-Mateos, G., Fernández-Alemán, J. L., & Molina-Martínez, J. M. (2020). Systematic Mapping Study on Remote Sensing in Agriculture. Applied Sciences, 10(10), 3456. https://doi.org/10.3390/app10103456