Article

An Effective Method for Minimizing Electric Generation Costs of Thermal Systems with Complex Constraints and Large Scale

by
Bach Hoang Dinh
1,
Thanh Van Pham
2,
Thang Trung Nguyen
1,
Gabriela Nicoleta Sava
3 and
Minh Quan Duong
4,*
1
Power System Optimization Research Group, Faculty of Electrical and Electronics Engineering, Ton Duc Thang University, Ho Chi Minh City 700000, Vietnam
2
Faculty of Electrical and Electronics Engineering, Cao Thang Technical College, Ho Chi Minh City 700000, Vietnam
3
Faculty of Power Engineering, University Politehnica of Bucharest, Splaiul Independentei 313, Sector 6, RO-060042 Bucharest, Romania
4
Faculty of Electrical Engineering, The University of Danang—University of Science and Technology, Da Nang city 550000, Vietnam
*
Author to whom correspondence should be addressed.
Appl. Sci. 2020, 10(10), 3507; https://doi.org/10.3390/app10103507
Submission received: 22 April 2020 / Revised: 10 May 2020 / Accepted: 12 May 2020 / Published: 19 May 2020
(This article belongs to the Special Issue Soft Computing in Applied Sciences and Industrial Applications)

Abstract

:
In this paper, an improved antlion optimization algorithm (IALO) was proposed to search for promising solutions for optimal economic load dispatch (ELD) problems to minimize electrical generation fuel costs in power systems with thermal units and to ensure all constraints are within operating ranges. IALO can be more effective than the original method, called the antlion optimization algorithm (ALO), because of the high performance of the applied modifications on the new solutions searching process. In order to evaluate the abilities of the IALO method, we completed many tests on thermal generating systems including 10, 15, 20, 30, 60, 80, and 90 units with different constraints and fuel-consuming characteristics. The results suggest that the offered method is superior to the ALO method with more stable search ability, faster convergence velocity, and shorter calculation times. Furthermore, the obtained results of the IALO method are much better than those of almost all the other methods used to solve problems for the same systems. As a result, IALO is suggested to be a highly effective method, and it can be applied to other problems in power systems instead of ALO, which has a lower performance.

1. Introduction

Economic load dispatch (ELD) is known as a means of lowering fuel costs for electricity generation in thermal power plants. In power system operation, the main purpose of the ELD problem is to allocate the power output of each power plant continuously, while observing the conditions such as fuel consumption characteristics, capacity of each generator, technical requirements in the system, and total demand of all loads. The objective function of this problem is to reduce the values of a quadratic function, a non-convex function, or a non-smooth function as much as possible. So, the complexity of the problem is partially dependent on the complexity level of the objective function. Basically, a solution can be regarded as an acceptable operation method if all constraints are exactly met. Thus, complex of constraints is also a challenge for the complexity level of the ELD problem. Due to these challenges, approximately all studies have focused on the objective function and the considered constraints to demonstrate their method’s efficiency.
In the later years of the previous century, traditional methods were effectively applied to solve the ELD problem with acceptable results. These methods are the lambda-iteration method (LIM) [1], gradient method (GM) [1], hierarchical method (HM) [2], Lagrange relaxation (LR) [3], linear programming technique (LPT) [4], Newton’s method (NM) [1], and fast Newton Raphson method (FNM) [5]. Traditional methods have the advantage of using a small number of iterations, and results are the same for different runs because they are deterministic methods. However, traditional methods have to take the partial derivative in the process of finding solutions. So, these methods have some restrictions if they solve the ELD problem for complex systems, for example, those with non-smooth shape objective functions.
Another method group that appeared after these traditional methods and has also been successfully applied to solve the ELD problems is composed of the artificial neural network (ANN)-based methods. This group includes the Hopfield neural network (HNN) [6], adaptive Hopfield neural network (AHNN) [7], new Hopfield model (NHM) [8], enhanced augmented Lagrange Hopfield network (EALHN) [9], and augmented Lagrange Hopfield network (ALHN) [10]. ANN-based methods perform better than traditional methods by combining the Lagrange function and Hopfield network. However, these methods, like traditional methods, struggle with complex objective functions.
In contrast to the above methods, evolutionary algorithms (EAs) and improved evolutionary algorithms (IEAs) have been popularly applied to solve the ELD problem with complex systems. These types of algorithms include the improved genetic algorithm (IGA) [11], real-code genetic algorithm (RCGA) [12], new RCGA (NRCGA) [12], evolutionary strategy optimization (ESO) [13], improved differential evolution (IDE) [14], differential evolution (DE) [15], hybrid integer coded differential evolution and dynamic programming (HDE-DP) [16], and stud differential evolution (SDE) [17]. Among these methods, RCGA [12] is the best because it can solve the ELD problem with valve point effects (VPEs), multi fuels (MFs), ramp rate limit (RRL), prohibited operating zones (POZs), and spinning reserve (SR), whereas IDE [14] is the best method in terms of solving problems considering transmission losses.
Similar to IEAs, metaheuristic-based methods have been very quickly developing for solving the ELD problem, and there have been a large number of methods developed from the metaheuristic algorithms such as Particle swarm optimization (PSO) [18], Quantum-inspired particle swarm optimization (QIPSO) [19], Particle Swarm Optimization and Tabu Search Algorithm (DSPSO-TSA) [20], Fuzzy and Self-Adaptive Particle Swarm Optimization (FSAPSO) [21], Theta Particle Swarm Optimization (θ-PSO) [22], Modified Particle Swarm Optimization (MPSO) [23], Artificial Immune System Algorithm (AISA) [24], Biogeography-based Optimization (BBO) [25], Chaotic Firefly Optimization Algorithm (CFOA) [26], Cuckoo Search Algorithm (CSA) [27], Modified Cuckoo Search Algorithm (MCSA) [28], One Rank Cuckoo Search Algorithm (RCSA) [29], CSA [30], MCSA [31], Krill Herd Algorithm (KHA) [32,33], Modified Krill Herd Algorithm (MKHA) [34], Modified Firefly Algorithm (MFA) [35], Varying Firefly Optimization Algorithm (VFOA) [36], Firefly Optimization Algorithm (FOA) [37], Improved Firefly Optimization Algorithm (IFOA) [37], Effectively Modified Firefly Algorithm (EMFA) [38], Immune Algorithm (IA) [39], Grey Wolf Optimization Algorithm (GWOA) [40], Chaotic Bat Optimization Algorithm (CBOA) [41], Exchange Market Algorithm (EMA) [42], Antlion Optimization Algorithm (ALO) [43,44], and Spotted Hyena Optimizer (SHO) [45]. Among the metaheuristic-based methods, EMFA [38] has been tested on many systems with complicated constraints such as transmission losses, POZs, ramp rate limits, spinning reserve, and fuel consuming characteristics such as MFs and VPEs. In addition, the method has been tried for very large-scale problems with a high number of generators and a high number of control variables. The results showed that the EMFA method provided the highest quality results compared to all other methods including the FOA, PSO, DE, CSA, and genetic algorithm (GA). In summary, improved methods have a good ability to search for better optimal solutions. Conversely, these methods become complex because of the combination of the original algorithms-based developed methods and modified mechanisms.
In this paper, an improved antlion optimization algorithm (IALO) is suggested for solving the ELD problem. Constraints such as transmission losses, POZ, RRL, and SR are considered. Moreover, we take into account the consuming characteristics of MFs and VPEs. In 2015, Mirjalili [43] suggested the antlion optimization (ALO) algorithm for solving technology problems. The ALO method has been applied for solving the ELD problem in very small-scale electricity systems considering VPEs [44]. More research is needed to further clarify the efficiency of the ALO method. The suggested IALO method was tested on five different systems with different consuming characteristics and constraints. The results obtained by the IALO were analyzed, evaluated, and compared in other papers in the literature. The goals of the current work can be summarized as follows:
  • Present all the computation steps of the ALO in detail and analyze drawbacks of the method;
  • Discuss improved versions of the ALOs that previous studies have proposed;
  • Propose a highly effective modification to produce a promising solution search strategy;
  • Combine our proposal with a modification that was proposed in a previous work. The combination of the highly effective proposed modification and the applied modification can support the proposed IALO method in finding optimal solutions effectively and quickly;
  • Consider the different systems that contain complex objective functions and constraints;
  • Compare our proposed IALO with classic ALO. Our proposed IALO can achieve much better results than those of the ALO with the same settings for control parameters. The proposed method is better or equal to other existing methods in comparing quality of solution, but it is more robust than these methods when comparing computational steps.
The remaining parts of the paper are organized as follows: Section 2 expresses the mathematical formulation of the ELD problem. 
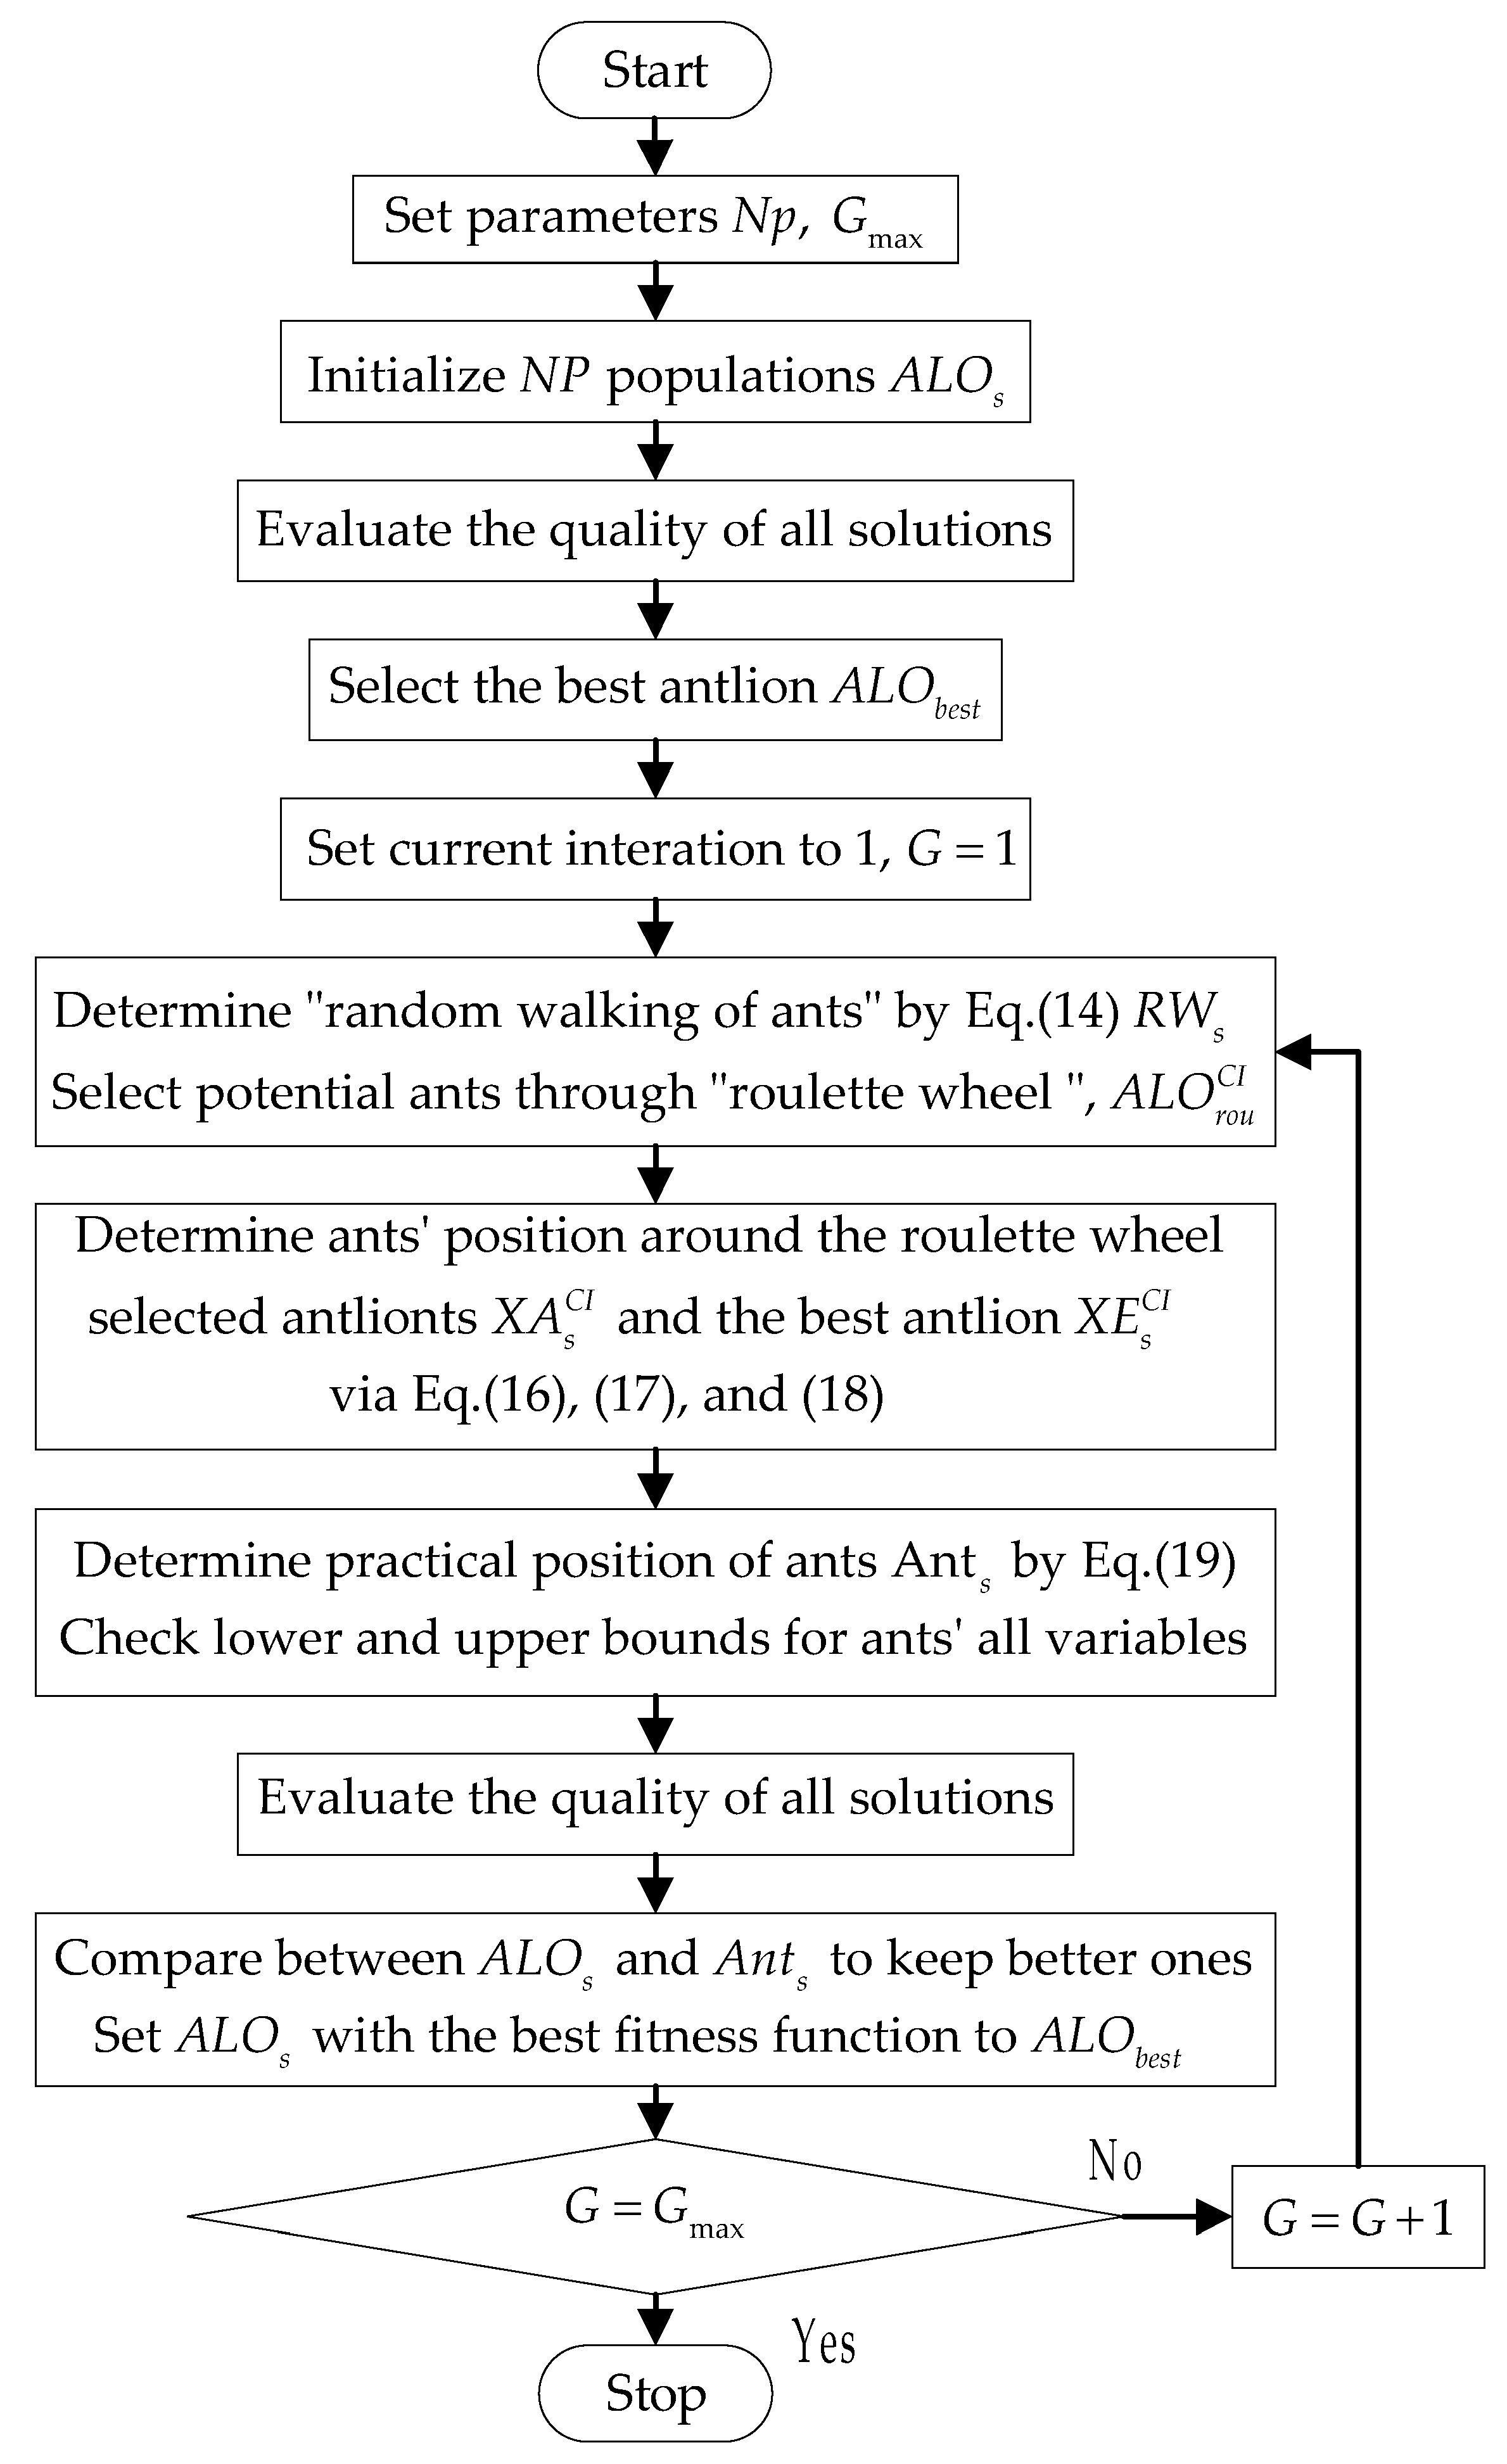
Section 3 presents the ALO and IALO methods in detail. Section 4 shows the detailed implementation of IALO for the ELD problem. Section 5 presents simulation results and discussion. Section 6 summarize the achievement and conclusions of the study.

2. The ELD Problem Formulation

2.1. Objective Function of the ELD Problem with a Single Fuel Option

In the optimization operation of a system powered by thermal generation units (TGUs), a great concern in the optimal load dispatch problem is the technique to reduce fuel cost of the system. This problem can be described by using the following equation.
f = i = 1 n f i ( p i )
In accordance with this theory, the fuel cost function (FCF) of the ith generating unit is written as the single quadratic function form with a variable for real power output, which can be seen by the next equation:
f i ( p i ) = α i p i 2 + β i p i + γ i
where αi, βi, and γi are the known coefficients in function fi(pi) of the ith TGU and pi is the power generated by the ith TGU.
When TGUs consider VPEs, the FCF is more complicated, as given in the following model.
f i ( p i ) = α i p i 2 + β i p i + γ i + | δ i × s i n ( ε i × ( p i i , m i n ) ) |
where δi and εi are the known coefficients in FCF of the ith TGU considering VPEs and pi,min is the minimum real power output of the ith TGU.

2.2. Objective Function of the ELD Problem with MFs

Because coefficients of each TGU are modified according to the different types of fuel being used, the fuel cost function form is the sum of different quadratic functions, as in (4). When VPEs are considered, the form is more complex with the presence of a sinusoidal function, and the objective function can be expressed as in (5):
f i ( p i ) = { α i 1 p i 2 + β i 1 p i + γ i 1 f o r   p i , 1 , min p i p i , 1 , max α i 2 p i 2 + β i 2 p i + γ i 2 f o r   p i , 2 , min p i p i , 2 , max α i m p i 2 + β i m p i + γ i m f o r   p i , m , min p i p i , m , max
f i ( p i ) = { α i 1 p i 2 + β i 1 p i + γ i 1 + | δ i 1 × sin ( ε i 1 × ( p i , min p i ) ) | f o r   p i , 1 , min p i p i , 1 , max α i 2 p i 2 + β i 2 p i + γ i 2 + | δ i 2 × sin ( ε i 2 × ( p i , min p i ) ) | f o r   p i , 2 , min p i p i , 2 , max α i m p i 2 + β i m p i + γ i m + | δ i m × sin ( ε i m × ( p i , min p i ) ) | f o r   p i , m , min p i p i , m , max
where αim, βim, and γim are the known coefficients of FCF of the ith TGU corresponding to the mth fuel type for the case without VPEs; δim and εim are the known coefficients of FCF of the ith TGU corresponding to the mth fuel type for the case with VPEs; and pi,m,min and pi,m,max are the minimum and maximum power outputs of the ith TGU corresponding to the mth fuel type.

2.3. Considered Constraints in the ELD Problem

2.3.1. Power Balance Requirement

The active power generated by power sources has to be equal to the sum of the total load demand (pd) and transmission loss (pl). It can be seen by the function in the following formula.
i = 1 n p i = p d + p l
where total real power loss is calculated by using the Kron’s formula below:
p l = i = 1 n j = 1 n p i B i j p j + i = 1 n B 0 i p i + B 00
where Bij, B0i, and B00 are transmission loss coefficients.
Power output limits requirement: Each TGU has serious limits within the upper level and lower level of generation. They must not exceed this segment as shown in the following rule.
p i , min p i p i , max
where pi,max is the highest acceptable working power of the ith TGU.

2.3.2. POZ, SR, and RRL Constraints

Technically, TGUs are not allowed to work in restricted areas because negative impacts on these units will cause damage to steam turbines, even the bearings can be destroyed. Therefore, POZ is a constraint that must be strictly observed in the operation process of TGUs. The fuel–power curve of TGUs will be interrupted due to the presence of POZs, so the determination of the power position of the units in neighboring POZs is quite complicated. In addition, if a TGU in the system is stopped due to a breakdown, the power balance constraint must still be met. Therefore, each unit must reserve power to ensure stability for the system. The solution to this problem is called a spinning reserve. Another important constraint is the ramp rate limit (RRL), which does not allow the TGU to generate power with values beyond a predetermined space. This constraint considers increase and decrease limits for power output of the TGU. The details of the constraints are as follows:
Prohibited operating zones: According to the POZ constraint, the TGU can operate at power ranges as shown in the following model.
p i = { | p i , ( h 1 ) u , p i , h l | }   ,   h = 1 ,   2 ,   3 ,   ,   ( n z + 1 ) ;   i Ω
where p h l and p h u are lower and upper power output of the ith at the hth zones; p i , 0 u = p i , min considering h = 1 and p i , n z + 1 l = p i , max ; nz is the number of POZs.
Determining the power generated by the TGU beyond the POZs must be done first and then other constraints such as spinning reserve and online power balance can be considered.
Spinning reserve: To ensure energy security issues, the system always reserves a power under the following inequality:
i = 1 n p r i p r a l l
where pri is the real power reserve of the ith TGU; and prall is the required spinning reserve of the whole system. The spinning reserve is managed by the following equation:
{ p r i = { p i , max p i if       p r i , max >   ( p i , m a x   p i )   p r i , max o t h e r w i s e   ;   i Ω p r i = 0     ;     i Ω
where Ω is the set of TGUs that can supply reserve power to loads.
Ramp rate limit constraint: Increasing or lowering of the power generated by the TGU in the process of operation must be managed to keep the output within a permissible limit. If RUL is the ramp up limit and RDL is the ramp down limit of the ith TGU, the ramp rate constraint is defined as follows:
p i , 0 R U L i p i p i , 0 + R D L i
where pi,0 is the initial power output from the previous operating hour of the ith TGU.

3. IALO for the ELD Problem

3.1. Conventional ALO

3.1.1. Population Initialization

Each antlion represents a solution and it must be born at the beginning by the following rule:
A L O s = B o u n d l o w e r + ρ × ( B o u n d u p p e r B o u n d l o w e r )
where Boundlower and Boundupper, respectively, are the lowest values and highest values of control variables; Np is population; and ρ is a random number in the range of [0, 1].
Among the initialized solutions, the solution with the best fitness function is set to the best antlion, ALObest.

3.1.2. New Solution Update Process

In ALO, updating new solutions is the process of updating new positions of ants, which are the prey of antlions. The position of each ant is newly updated based on the following rule
A n t s = X A B s G + X A R W s G 2
where X A B s G is created by using a random walk around the best antlion ALObest and X A R W s G is determined by using a random walk around one antlion that is found by using a roulette wheel mechanism.
X A R W s G is determined by using the following steps:
Step 1: Determine the minimum limit and maximum limit for the positions of each antlion s based on the following models:
X A s G , min = A L O R W G + B o u n d l o w e r 10 w × G max G
X A s G , max = A L O R W G + B o u n d u p p e r 10 w × G max G
where A L O R W G is one antlion that is chosen by the roulette wheel mechanism; and w is obtained by one of the options below:
  • w = 1 if G < 0.1Gmax
  • w = 2 if G > 0.1Gmax
  • w = 3 if G > 0.5Gmax
  • w = 4 if G > 0.75Gmax
  • w = 5 if G > 0.9Gmax
  • w = 6 if G > 0.95Gmax
where Gmax is the number of iterations
Step 2: Determine step size for each antlion s by the function of the formula below:
S t e p s G = [ 0 , Csum ( 2 R ( t 1 ) 1 ) ,   Csum ( 2 R ( t 2 ) 1 ) , Csum ( 2 R ( t 3 ) 1 ) ,   ,   Csum ( 2 R ( G m a x ) 1 )   ]
where G is the current iteration; Csum is the cumulative sum; t is a step size of random walk; and R(t) is determined by the following model.
R ( t ) = { 0 if   ϕ <   0.5 1 e l s e
where ϕ is a random positive number not higher than 1.
Step 3: Determine X A R W s G by applying the formula below:
X A R W s G = X A s G , min + ( X A s G , max X A s G , min ) × ( S t e p s G S t e p s min S t e p s max S t e p s min )
For determining XABG, the following steps are applied:
Step 1: Determine the lower limit and upper limit for a random walk around the best antlion
X A B s G , min = A L O b e s t G 1 + B o u n d l o w e r 10 w × G max G
X A B s G , max = A L O b e s t G 1 + B o u n d u p p e r 10 w × G max G
where A L O b e s t G 1 is the best antlion in the previous iteration; and w is determined as mentioned above.
Step 2: Calculate step size for each antlion based on Equation (17).
Step 3: Apply the following equation for finding X A R W s G
X A B s G = X A B s G , min + ( X A B s G , max X A B s G , min ) × ( S t e p s G S t e p s min S t e p s max S t e p s min )

3.1.3. Selection Technique

All antlions are able to move to a new position of ants if the new positions are promising for finding prey. However, not every antlion moves, how many move depends on the potential of the new positions. In the case where the new position is more effective than the old one, the antlion will certainly move. This phenomenon is similar to the comparison between the quality of old solutions and new solutions for selection. The action is called selection technique, which can be accomplished by:
A L O s = { A n t s i f    F F ( A n t s ) F F ( A L O s ) A L O s e l s e
F F ( A L O s ) = { F F ( A n t s ) i f    F F ( A n t s ) F F ( A L O s ) F F ( A L O s ) e l s e
The search procedure of ALO is presented in Figure 1.

3.2. Discussions on the Improvement of IALO

Several improved versions of antlion optimization algorithms were introduced and presented in previous studies [46,47,48,49,50]. Each variant of the ALO was applied to minimize certain optimization problems. Hence, this section only considers the improved versions of the ALO without the relative problems. One is the enhanced antlion optimization algorithm (e-ALO) [46] in which the e-ALO replaced the uniform probability distribution function with a stochastic probability function. Consequently, the e-ALO could reach higher quality solutions than the Taguchi method (TM), Cat Swarm Optimization (CSO), artificial bee colony (ABC), genetic algorithm (GA), PSO, etc. In the next variation, the modified antlion optimization algorithm (MALO) [47] concentrated on the improvement of global search, and the balancing of local search and global search. Results from the optimal reactive power dispatch problem indicated that ALO should be replaced with MALO for reducing power losses. Another version of the ALO is named the opposition-based Lévy flight antlion optimizer (OB-LF-ALO) [48]. The authors of [48] showed that the ALO was prone to stagnate in local optimal zones. Thus, they replaced the uniform distribution-based random walk of the Lévy flight-based random walk for a better exploration ability. Therefore, the OB-LF-ALO could accelerate convergence by enhancing the original diversification and strongly exploiting it in the later iterations. According to the tournament selection-based antlion optimization algorithm (TALO) [49,50], the authors pointed out that the classical ALO has some major drawbacks, including many computation steps and dependence on randomization, which prevent it from becoming a powerful method for optimization problems. Thus, they abandoned the roulette wheel selection mechanism and employed a tournament selection mechanism. As a result, the method was demonstrated to be more effective than the ALO, GA, PSO, and firefly optimization algorithm (FOA). In summary, the ALO is a weak method for optimization problems and it should abandon its ineffective mechanisms and apply more robust ones.

3.3. The Proposed IALO Method

The proposed IALO method was developed based on the following points
  • Divide the whole population into two different groups in which solutions with better fitness functions are grouped into a potential set and the remaining solutions are put into an ineffective set;
  • The group classification criterion is based on the fitness function of each individual and average fitness function of all solutions;
  • Solutions in the potential set are updated based on their own old positions and an updated step size;
  • Solutions in the ineffective set are updated based on the best solution and an updated step size.
The details of the proposed modifications are as follows:
Step 1: Sort solutions based on the fitness function so that the best solution with the smallest fitness function is put in the first position and the worst solution with the highest fitness function is put in the final position.
Step 2: Calculate the average fitness function of the whole population,
F F m e a n = 1 N p F F ( A L O s ) N p .
Step 3: Select solutions for the potential set and the ineffective set based on Algorithm 1.
Algorithm 1: Solution selection for the potential set and ineffective set
For s = 1:Np
  If FF(ALOs) < FFmean
    ALOs is stored in the potential set
  Else
    ALOs is stored in the ineffective set
  end
end
Step 4: Count the number of close solution pairs (Ncsp) based on the Algorithm 2 below:
Algorithm 2: Calculation of the number of close solution pairs
Ncsp = 0;
For s = 1:(Np − 1)
  For m = s + 1:Np
    Nsp = Nsp + 1;
    If | F F ( A L O s ) F F ( A L O m ) | [ F F m e a n F F ( A L O b e s t ) ]
      Ncsp = Ncsp + 1;
    end
  end
end
Step 5: Update new positions for solution in the potential group.
Determine the ratio of the number of close solution pairs to the number of solution pairs (Nsp) as follows:
R = N c s p N s p × 100 %
Update new solutions by using the following equations:
If R < 15%, the equation below is used to produce new solutions:
A n t s = A L O s + ( A L O r d 1 A L O r d 2 ) × ( S t e p s G S t e p s min S t e p s max S t e p s min )
In the case of R < 30%, the following model is used:
A n t s = A L O s + ( A L O r d 1 A L O r d 2 + A L O r d 3 A L O r d 4 ) × ( S t e p s G S t e p s min S t e p s max S t e p s min )
For all other cases, each solution is newly changed by:
A n t s = A L O b e s t + ( A L O r d 1 A L O r d 2 + A L O r d 3 A L O r d 4 + A L O r d 5 A L O r d 6 ) × ( S t e p s G S t e p s min S t e p s max S t e p s min )
Step 6: Update new positions for solutions in the ineffective group by using the following equation:
A n t s = A L O b e s t + χ × ( A L O b e s t A L O s ) × ζ 4
where ζ 4 is a random number within the range from 0 to 1; and χ is determined by [51]:
χ = r a n d h ( r a n d m ) 1 φ × [ Γ ( 1 + φ ) × sin ( π φ / 2 ) Γ ( 1 + φ 2 ) × φ × 2 ( φ 1 ) / 2 ]
where φ is selected to be 1.5 [51].

4. Implementation

4.1. Selection of Decision Variables

According to the algorithm, initializing the first population and creating the new population are influenced by random elements. Therefore, if there is no means to collect all of the elements in the possible search space, that will easily lead to a bad result. To solve this problem, the variables are divided into two types: decision variable and dependent variable. This article proposes decision variables consisting of the power output from the second TGU to the last TGU (p2, p3, …, pn), and only the power output of the first TGU (p1) belongs to the dependent variable. Minimum limit of solution ymin and maximum limit of solution ymax are defined as follows:
y min = [ p 2 , min , p 3 , min , , p n , min ] y max = [ p 2 , max , p 3 , max , , p n , max ]
In the next step, each solution is initially created based on the minimum and maximum limits of solution by the following equation:
A L O s = y min + r a n d ( y max y min ) ; s = 1 , ,   N p

4.2. Handling Constraints

The problem takes five constraints into account, including power balance, power output limits, prohibited operating zone, spinning reserve, and ramp rate limit. The five constraints can be solved by the following methods.

4.2.1. Redefining the Maximum and Minimum Power Outputs Considering RRL and POZ Constraints

The ramp up limit and the ramp down limit are redefined considering the RRL constraint by the following formulas:
p s , max = { p s , 0 + R U L s i f p s , max > p s , 0 + R U L s p s , max i f p s , max p s , 0 + R U L s ;   s = 1 ,   ,   n
p s , min = { p s , 0 R D L s i f p s , min < p s , 0 R D L s p s , min i f p s , min p s , 0 R D L s ;   s = 1 ,   ,   n
The redefined boundaries continue to be redefined for the second time by using Equations (36) and (37) considering the POZ constraints.
p s , max = { p s , h l i f p s , h l < p s , max < p s , h u & p s , max < p s , h u p s , max o t h e r w i s e ;   s = 1 , , n
p s , min = { p s , h u i f p s , h l < p s , max < p s , h u & p s , max > p s , h l p s , min o t h e r w i s e ;   s = 1 , , n

4.2.2. Handling the POZ Constraint for Decision Variables

In order to enable the new solutions to avoid violating the POZ constraints, correction is required and implemented by using the following equation:
p s = { p s h l i f p s h l < p s p s h l + p s h u 2 p s h u i f ( p s > p s h l + p s h u 2 ) & p s < p s h u p s e l s e ;   s = 1 , , n and h = 1 , , n z

4.2.3. Calculating the Dependent Variable (p1)

In order to satisfy the power balance requirement shown in Formula (6), p1 is regarded as a dependent variable. Thus, the violation of the power balance is converted into the violation of p1. Power outputs from the second to the last units are considered to be control variables and are provided by the duty of the proposed method, whereas p1 can be obtained by using Formulas (6) and (7). The formula below can find p1 exactly.
p 1 = ( B 01 1 + 2 s = 2 n B 1 s p s ) ± Δ 2 B 11
where
Δ = ( B 01 1 + 2 s = 2 n B 1 s p n ) 2 4 B 11 ( p d + B 00 s = 2 n p s + s = 2 n B 0 s p s + s = 2 n m = 2 n p s B s m p m )   ;   and   Δ 0
Calculating p1 deals with the power balance constraint. However, sometimes it can violate other constraints such as power output limits and POZ. Power output of the first TGU is checked and violations of the upper and lower limits are penalized using the following equation:
Δ p 1 , k = { p 1 , min p 1 , k i f p 1 , min > p 1 , k p 1 , k p 1 , max i f p 1 , max < p 1 , k 0 e l s e
where ∆p1,k is the penalty for violation of the upper bound and lower bound of p1. If ∆p1,k is zero, it means there are no violations of the bounds; however, p1 would continue to be checked for POZ constraints by the following model:
Δ p 1 , k = { p 1 p 1 k l i f p 1 k l < p 1 p 1 k l + p 1 k u 2 p 1 k u p 1 i f ( p 1 > p 1 k l + p 1 k u 2 ) & ( p 1 < p 1 k u ) 0 e l s e

4.2.4. Handing the SR Constraint

After all the TGUs are checked and penalized, the sum of the reserve power from all TGUs is calculated and compared to the reserve power of power system. If the reserve power of power system is not provided exactly, the penalty is as follows:
Δ p r a l l , k = { p r a l l s = 1 n p r s , k i f s = 1 n p r s , k < p r a l l 0 o r t h e r w i s e

4.3. Calculating the Fitness Function of the Solution

The sum of objective function and penalty factors are included in the fitness function for evaluating the quality of the solution. For the considered problem, the fitness function is as follows:
F i t k = i = 1 n f i ( p i , k ) + c ( ( Δ p r a l l , k ) 2 + ( Δ p 1 , k ) 2 )

4.4. Handling Lower and Upper Limits

If new solutions are outside the permitted limits, they will be adjusted using the following equation:
y k = { y max i f y k > y max y min i f y k < y min y k o t h e r w i s e ;   i = 1 , ,   N p

5. Numerical Results

To demonstrate the effectiveness of the proposed IALO method, four main study cases are implemented as follows:
(i)
Consider MFs for each unit of a 10-unit system;
  • Case 1: Consider four load cases of 2400, 2500, 2600, and 2700 MW without VPEs;
  • Case 2: Consider one load case of 2700 MW with VPEs;
  • Case 3: Consider one load case of 2700 MW with VPEs and constraints such as SR, POZ, and RRL.
(ii)
Consider SF for each unit of a 20-unit system supplying a 2500 MW load considering power loss;
(iii)
Consider MFs and VPEs for the 80-unit system with a 21,600 MW load;
(iv)
Consider SF for each unit for the 15, 30, 60, and 90-unit systems with POZ constraints.
The proposed method together with the ALO were programmed in the Matlab platform and run on a PC (Processor with 2.7 GHz, RAM with 4.0 GB). In order to investigate the real performance of the IALO method, another comparison criterion was also considered to be the number of fitness evaluations, Nfes, which is shown in the following equation:
N f e s = ω N p G max
In the equation above, ω is the number of new solution generation times in each iteration. The IALO method has only one generation time for each iteration, so ω is 1 for IALO while ω is 2 for CSA [27] and RCSA [29]. For other methods such as FOA and IFOA in [37], Nfes had another model as follows:
N f e s = N p ( N p + 1 ) G max 2
Furthermore, we also computed the improvement of the proposed method over other compared methods by using the best cost of the compared methods and our proposed method. The improvement in % (ic) can be obtained by the following model:
i c   ( % ) = Best   cost   of   another   method     Best   cost   of   IALO Best   cost   of   another   method × 100 %  
In Equation (48), values of ic can be classified into three cases in which Case 1 corresponds to positive values, Case 2 corresponds to zero values, and Case 3 corresponds to negative values. If Case 1 occurs, the suggested method is more effective than the compared method. In the case of an ic with zero value, the suggested method is as good as other ones. In contrast, Case 3 indicates the suggested method is less effective than the compared methods if the compared methods have reported valid solutions and used smaller Nfes values in Equation (47).

5.1. Comparison for Results from the 10-Unit System with Different Cost Function Characteristics

This system has ten thermal generating units with a non-smooth fuel cost function. There are three cases for this system consisting of MFs; MFs and VPEs; and MFs and VPEs under complex constraints. Data of the system are taken from [7] for Case 1 and [11] for Cases 2 and 3.

5.1.1. Case 1: 10-Unit Systems with MFs

The suggested IALO method was tested on four sub-cases of load demands consisting of 2400, 2500, 2600, and 2700 MW. For each case, 100 trial runs were executed to obtain results and comparisons. In order to investigate the search potential, we compared the proposed method with other methods based on the obtained results (including the best cost, minimum cost, and average cost) and the number of fitness evaluations Nfes (which was calculated by using Equation (46) with the presence of the population size and the number of iterations). The comparison of obtained results indicated the search performance of the methods, meanwhile the comparison of Nfes indicated the search speed of methods. For better comparison of search performance, we converted better cost into improvement in %, which was calculated by using Equation (48). Basically, methods have a better chance to reach better results if they are run with larger population sizes and more iterations. We wanted to reflect the real performance of the proposed method and so we compared the obtained results; however, Nfes was always compared to assure a fair comparison between the proposed method and other methods. In Table 1, a comparison is shown for the same system with four different load cases. We ignored the comparisons of the mean and maximum costs because there were four comparison cases. Furthermore, the proposed method was run by using smaller Nfes than that of other methods. Therefore, if the proposed method can reach the same best cost as the other methods, the proposed method is more effective because it is faster. Observing the best cost indicates that the suggested method is better than the ALO method in terms of the best cost for all of load demand cases. In comparison with the ALO, the highest improvement level was 0.931%, corresponding to the case of a 2600 MW load demand, and the lowest level of improvement was 0.330% for a 2700 MW load demand. As compared to the other methods, the IALO method can reach the same result as other methods, excluding CSA [27], which suffers from a slightly higher cost than the proposed method. For example, in the case of a load demand of 2600 MW, the best fuel cost of the IALO was 574.381 $/h. It is smaller than the 574.410 ($/h) value for the CSA, being tantamount to 0.005%. Although, the proposed method cannot reach better cost values than the other remaining methods, the proposed method uses smaller Nfes than all other methods excluding EALHN [9], which is not a population-based method. In fact, the proposed method produced about 750 fitness evaluations while the other methods produced from 2000 to 20,000 fitness evaluations. The search speed of the suggested method was 2.6–26 times faster than those of the other methods. The analysis of the best cost and search speed indicates that the application of the suggested method to solve a 10-unit system with multi-fuel options is absolutely effective.

5.1.2. Case 1: 10-Unit System with MFs and VPEs

This system had ten generating units with the sum of several non-convex functions. The load demand of the test system was 2700 MW. The obtained results including the best cost, mean cost, worst cots, and standard deviation for 100 trial runs are shown in Table 2. In addition, Np, Gmax, Nfes, and ic (%) are also reported for comparison in detail. The best cost value of the IALO method was the lowest among all compared methods, including PSO, FOA, IFOA, CSA, RCSA, and ALO. The highest improvement was 6.124% as compared to the FOA method and the lowest improvement was 0.004% as compared to the RCSA method. Clearly, FOA was not a powerful method for the system and it was modified and changed into IFOA with much better results with an ic of 0.007% even though the IFOA used only half of the number of fitness evaluations. CSA [27] used the highest number of fitness evaluations, at 10,000, among all compared methods, but it could not reach the best solution and, therefore, the proposed method reached improvement over that method with 0.005%. The proposed method reached the best solution, but it used the highest number of fitness evaluations, excluding the comparison with CSA. The results show that it is hard to improve the results for the system with a small number of fitness evaluations, similar to the other compared methods. However, the running time of the proposed method was small compared to those of the other methods. Consequently, the proposed method is a potential method for 10-unit system taking multi-fuel options and vale point loading effects into account.

5.1.3. Case 3: 10-Unit System with MFs, VPEs, and Other Complexity Constraints

Next, we added several complex constraints such as spinning reserve, generating capacity, POZs, and ramp rate into the 10-unit system with MFs and VPEs. Table 3 lists the obtained results for a 2700 MW load demand and reports Nfes and ic for better comparisons. The IALO method was better than RCGA, FOA, IFOA, and ALO methods because the best cost of the IALO method was the smallest. The highest and the lowest improvement of the suggested method over these methods was, respectively, 7.304% and 0.005%. The values of Nfes from all methods indicates that the proposed method was one of the fastest methods with 3000 fitness evaluations, whereas the slowest method used 6000 fitness evaluations. However, the best cost of the IALO is slightly higher than that of the NRCGA method with −0.001%. This number shows that the best performance was not achieved by the proposed method, but our method is still a very efficient one. In fact, NRCGA reached the lowest cost, but the application of that method was only for the study cases with multiple fuels and VPEs, whereas the proposed method was implemented for different constraint types, different fuel types, and very large scale systems with 80 units and 90 units.

5.2. Implementation of the Suggested Method on a 20-Unit System Considering Transmission Loss

This section presents the comparison of the best cost, CPU, and Nfes from the proposed IALO and other methods with a load power of 2500 MW. Data of this system was taken from [39]. The obtained results for this study are given in Table 4. When compared to IA [39], the suggested method was more powerful for all criteria, such as the best cost with an ic % of 0.016%, CPU, and Nfes. The suggested method was much faster when comparing 4500 and 20,000 fitness evaluations. The outstanding performance cannot be seen when the proposed method was compared to the other remaining methods, but the proposed method was still evaluated to be more powerful. In fact, the best costs of RCSA [29], CBOA [41], and ED-SHO [45] were equal to that of the suggested method, but RCSA, CBOA, and ED-SHO methods used higher values for Nfes equaling 10,000, 12,000, and 100,000, respectively. These values were much higher than the 4500 of the IALO. Other values such as the mean cost and the standard deviation reveal the stable search ability of the proposed method since the mean cost and the best cost of the proposed method are approximately the same as those of the other methods, and the standard deviation is nearly zero. The proposed method used the lowest number of fitness evaluations, but it reached the same best cost and the most stable ability. As a result, it can be concluded that the IALO is a potential method for the system with 20 units considering quadratic fuel cost function and power loss constraint.

5.3. The Implementation of the Suggested Method on an 80-Unit System

In order to demonstrate the efficiency of the suggested method, a larger system with 80 thermal generating units with multi-fuel options and vale point loading effects was considered [11]. The load demand of the system was 21,600 MW. The study case was an expanded case of the 10-unit system with MFs and VPEs in Section 5.1.2 above. Compared methods had the same challenge of a discontinuous objective function and a high number of control variables. The comparisons with CSA, RCSA, and ALO are shown in Table 5. Because it is a complicated study case, the improvement of the proposed method over its conventional method can be seen clearly. The ic over ALO was 0.194%, but this value is much smaller compared to those of CSA and RCSA, where the values of ic were only 0.01% and 0.005, respectively. The insignificant improvement can be understood because the two methods were run by using 132,000 fitness evaluations while the proposed method was run by using only 80,000 evaluations. For this case, the proposed method was the fastest method and reached the best solution. So, it is a very efficient method for a large-scale, 80-unit system considering MFs and VPEs.

5.4. The Implementation of the Suggested Method on 15, 30, 60, and 90-Unit Systems with POZ Constraints

This section investigates the achievement of the suggested method on four cases of 15, 30, 60, and 90 units. Data of the study cases were taken from [6]. SR of the system was 200 MW for the case with 15 units and its increase was directly proportional to the number of units for the other remaining systems. Control parameters selection for ALO, the proposed method, and other compared methods are given in Table 6. Obtained results are reported in Table 7. Table 7 indicates that the IALO was highly superior to ALO method in terms of the best cost with very high improvement levels, such as 0.43% for a 15-unit system, 0.19% for a 30-unit system, 0.11% for a 60-unit system, and 0.15% for a 90-unit system. The saving cost percentage was significant for the systems because the two methods had the same control parameters selection, as shown in Table 6. The comparisons with CSA and RCSA do not show a benefit of the proposed method, since IALO was only slightly better than these methods for the case of a 90-unit system, whereas the other cases were similar, excluding the comparison with RCSA for a 15-unit system. The RCSA showed effective cost but did not show optimal generation for verification. The Np, Gmax, and Nfes in Table 6 indicate that the proposed method is much faster than CSA and RCSA for the 15- and 30-unit systems. The proposed method used 2000 and 20,000 fitness evaluations for the 15- and 30-unit systems, respectively, but CSA and RCSA used 12,000 and 48,000 fitness evaluations, respectively. However, for the two large-scale systems with 60 units and 90 units, the proposed method was slower because it used 80,000 and 160,000 fitness evaluations, respectively, whereas CSA and RCSA used 60,000 and 72,000 fitness evaluations, respectively. The Nfes and the best cost reveal that the proposed method was very effective for small-scale systems with 15 TGUs and 30 TGUs, but was less effective for large-scale systems with 60 and 90 TGUs.

5.5. Investigation of the Real Performance of IALO and ALO

The results from the suggested method and ALO method are summarized in Table 8. In all the cases of Table 8, the best cost of the IALO was always smaller than that of the ALO. Moreover, the time to run the program of the IALO method was always lower than that of the ALO method for all cases. The ic of 0.43% was the highest improvement of IALO over ALO, corresponding to the case of 15-units with POZ for a 2650 MW load demand. In contrast, 0.0001% was the smallest improvement of the suggested IALO over the ALO, corresponding to the case of a 20-unit system considering transmission loses for a 2500 MW load demand. However, in this case, ALO used Nfes = 9000 while IALO used only half of that quantity, i.e., 4500. To demonstrate the superiority of the IALO more persuasively, the convergence characteristics of the IALO and ALO are plotted in Figure 2, Figure 3, Figure 4, Figure 5 and 
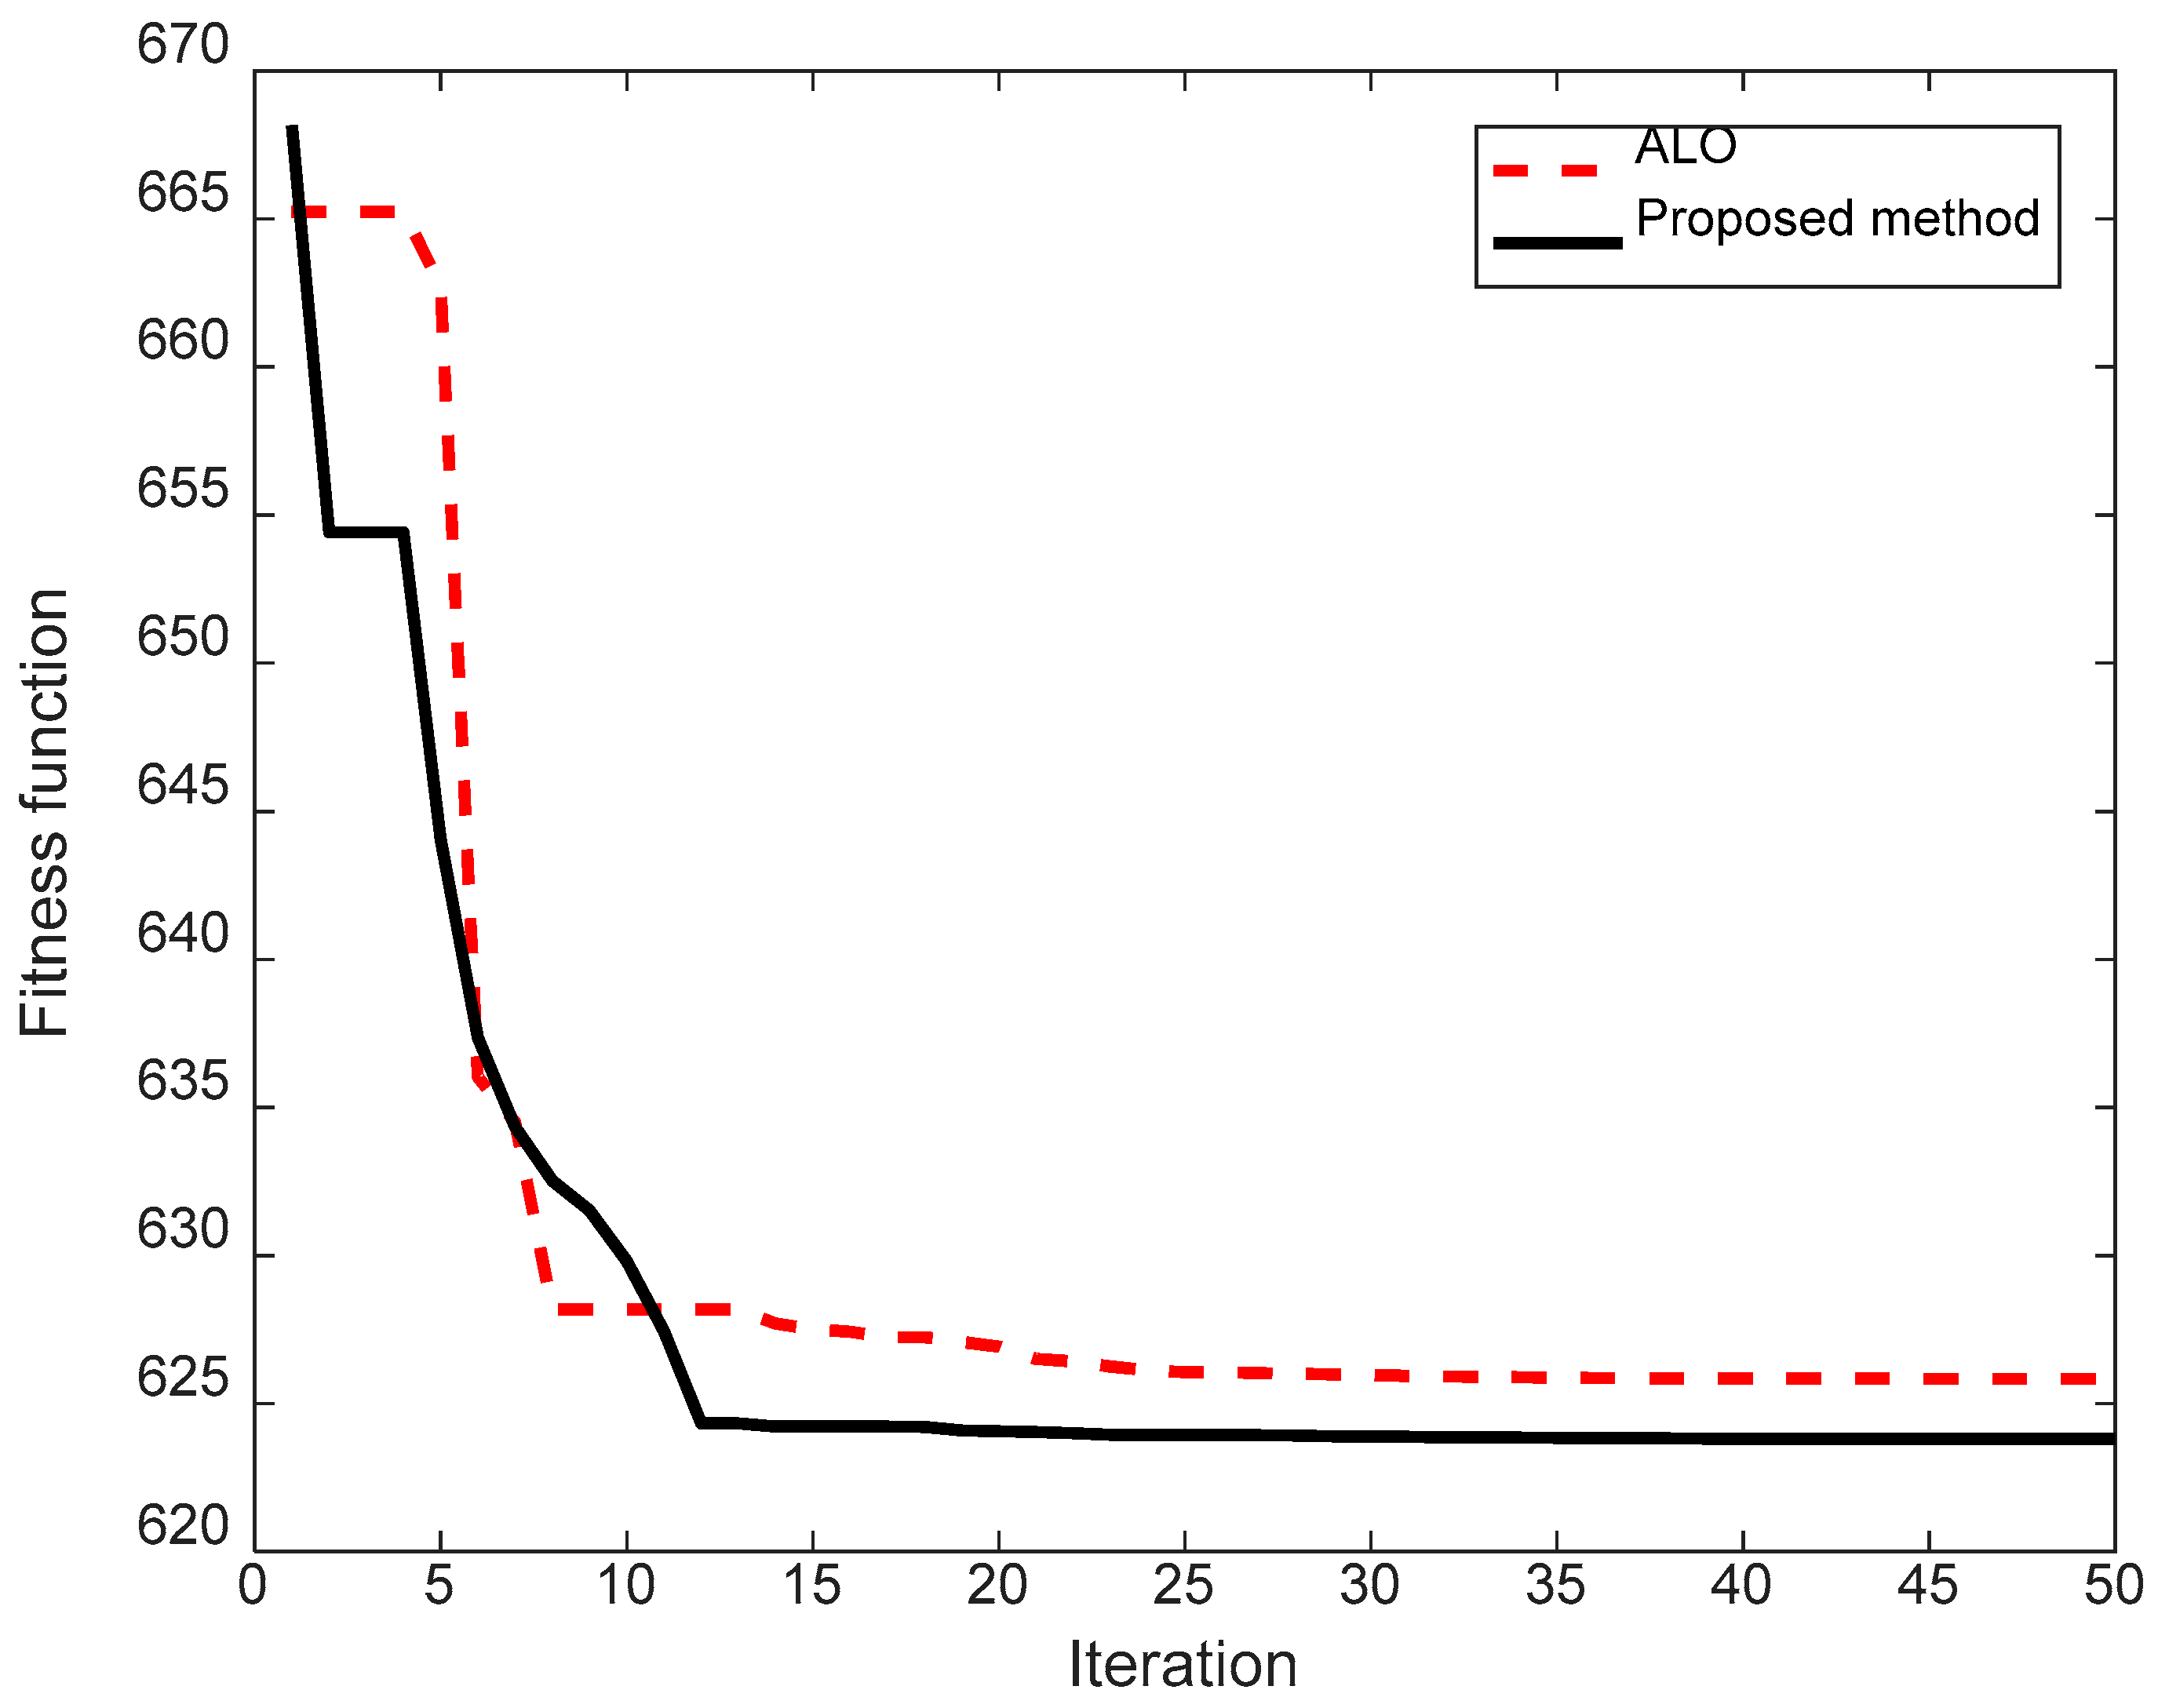
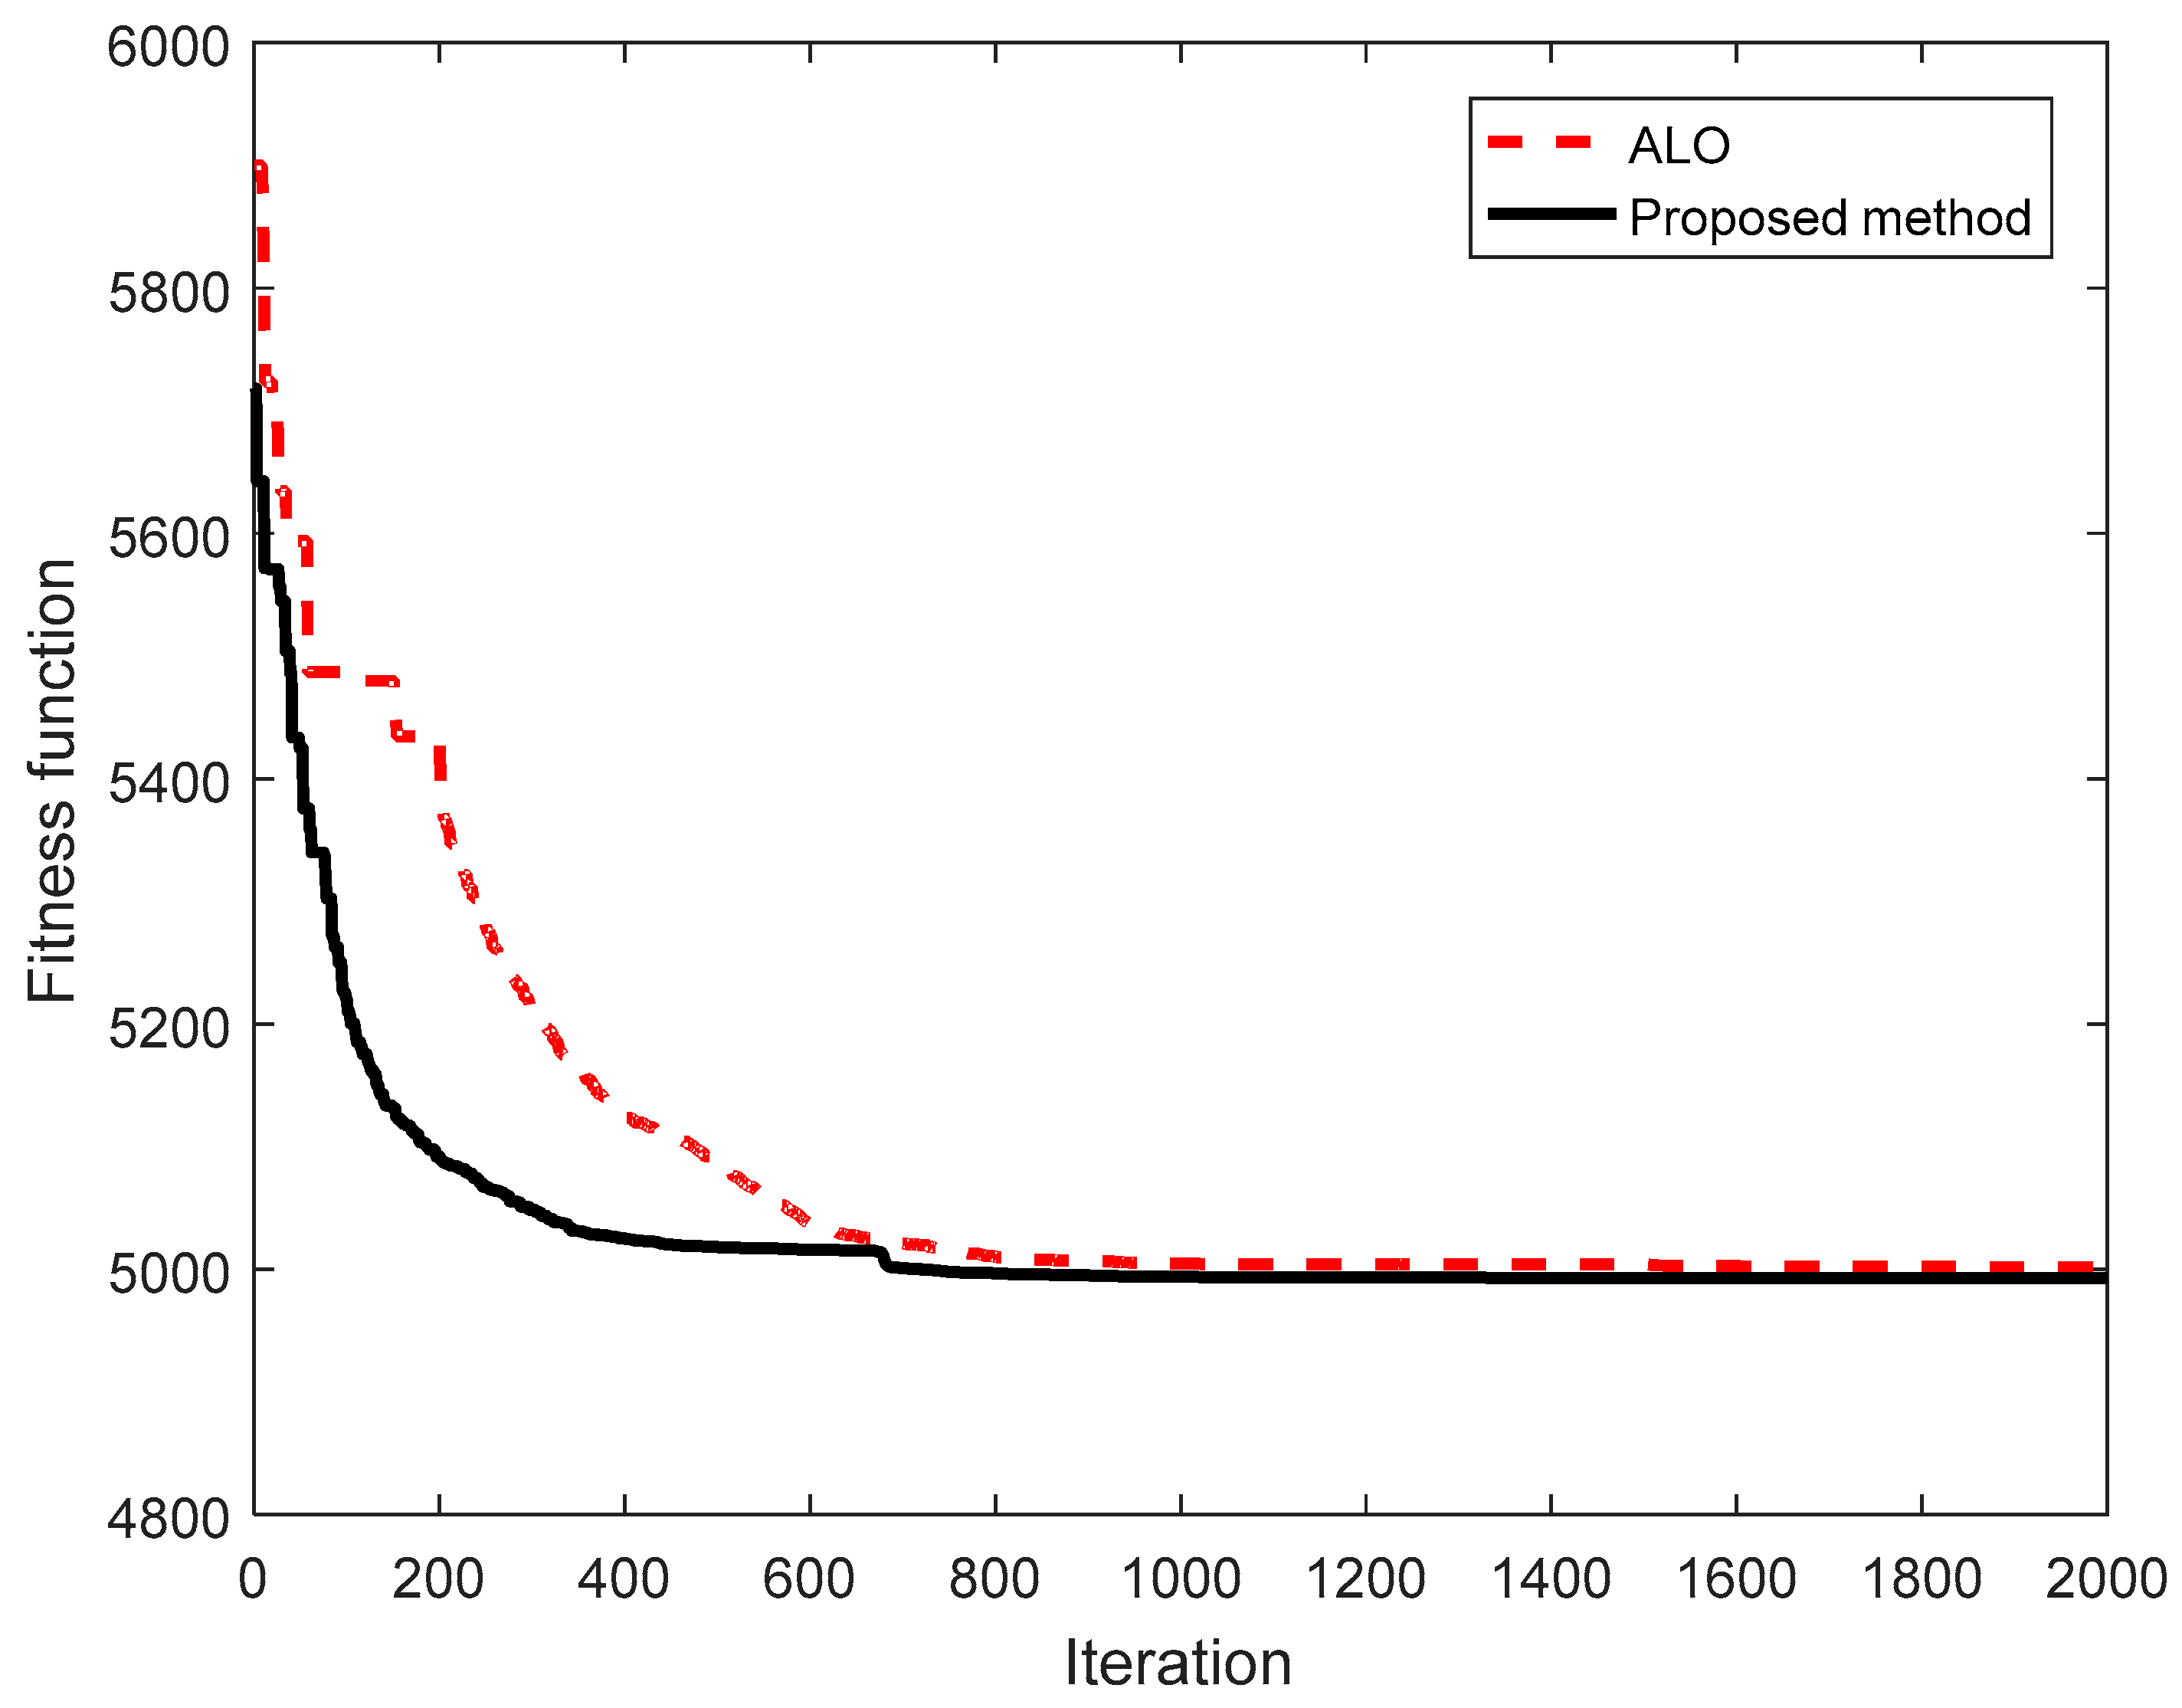
Figure 6 for different cases from the sections above. Through the figures, it can be seen that the IALO converged faster than the ALO after half of the number of iterations, or even fewer than half. For instance, Figure 2 shows the IALO reached a solution close to the best solution at the fifteenth iteration, whereas the solution of the ALO at the fiftieth iteration was far from the obtained solution of the IALO. In 
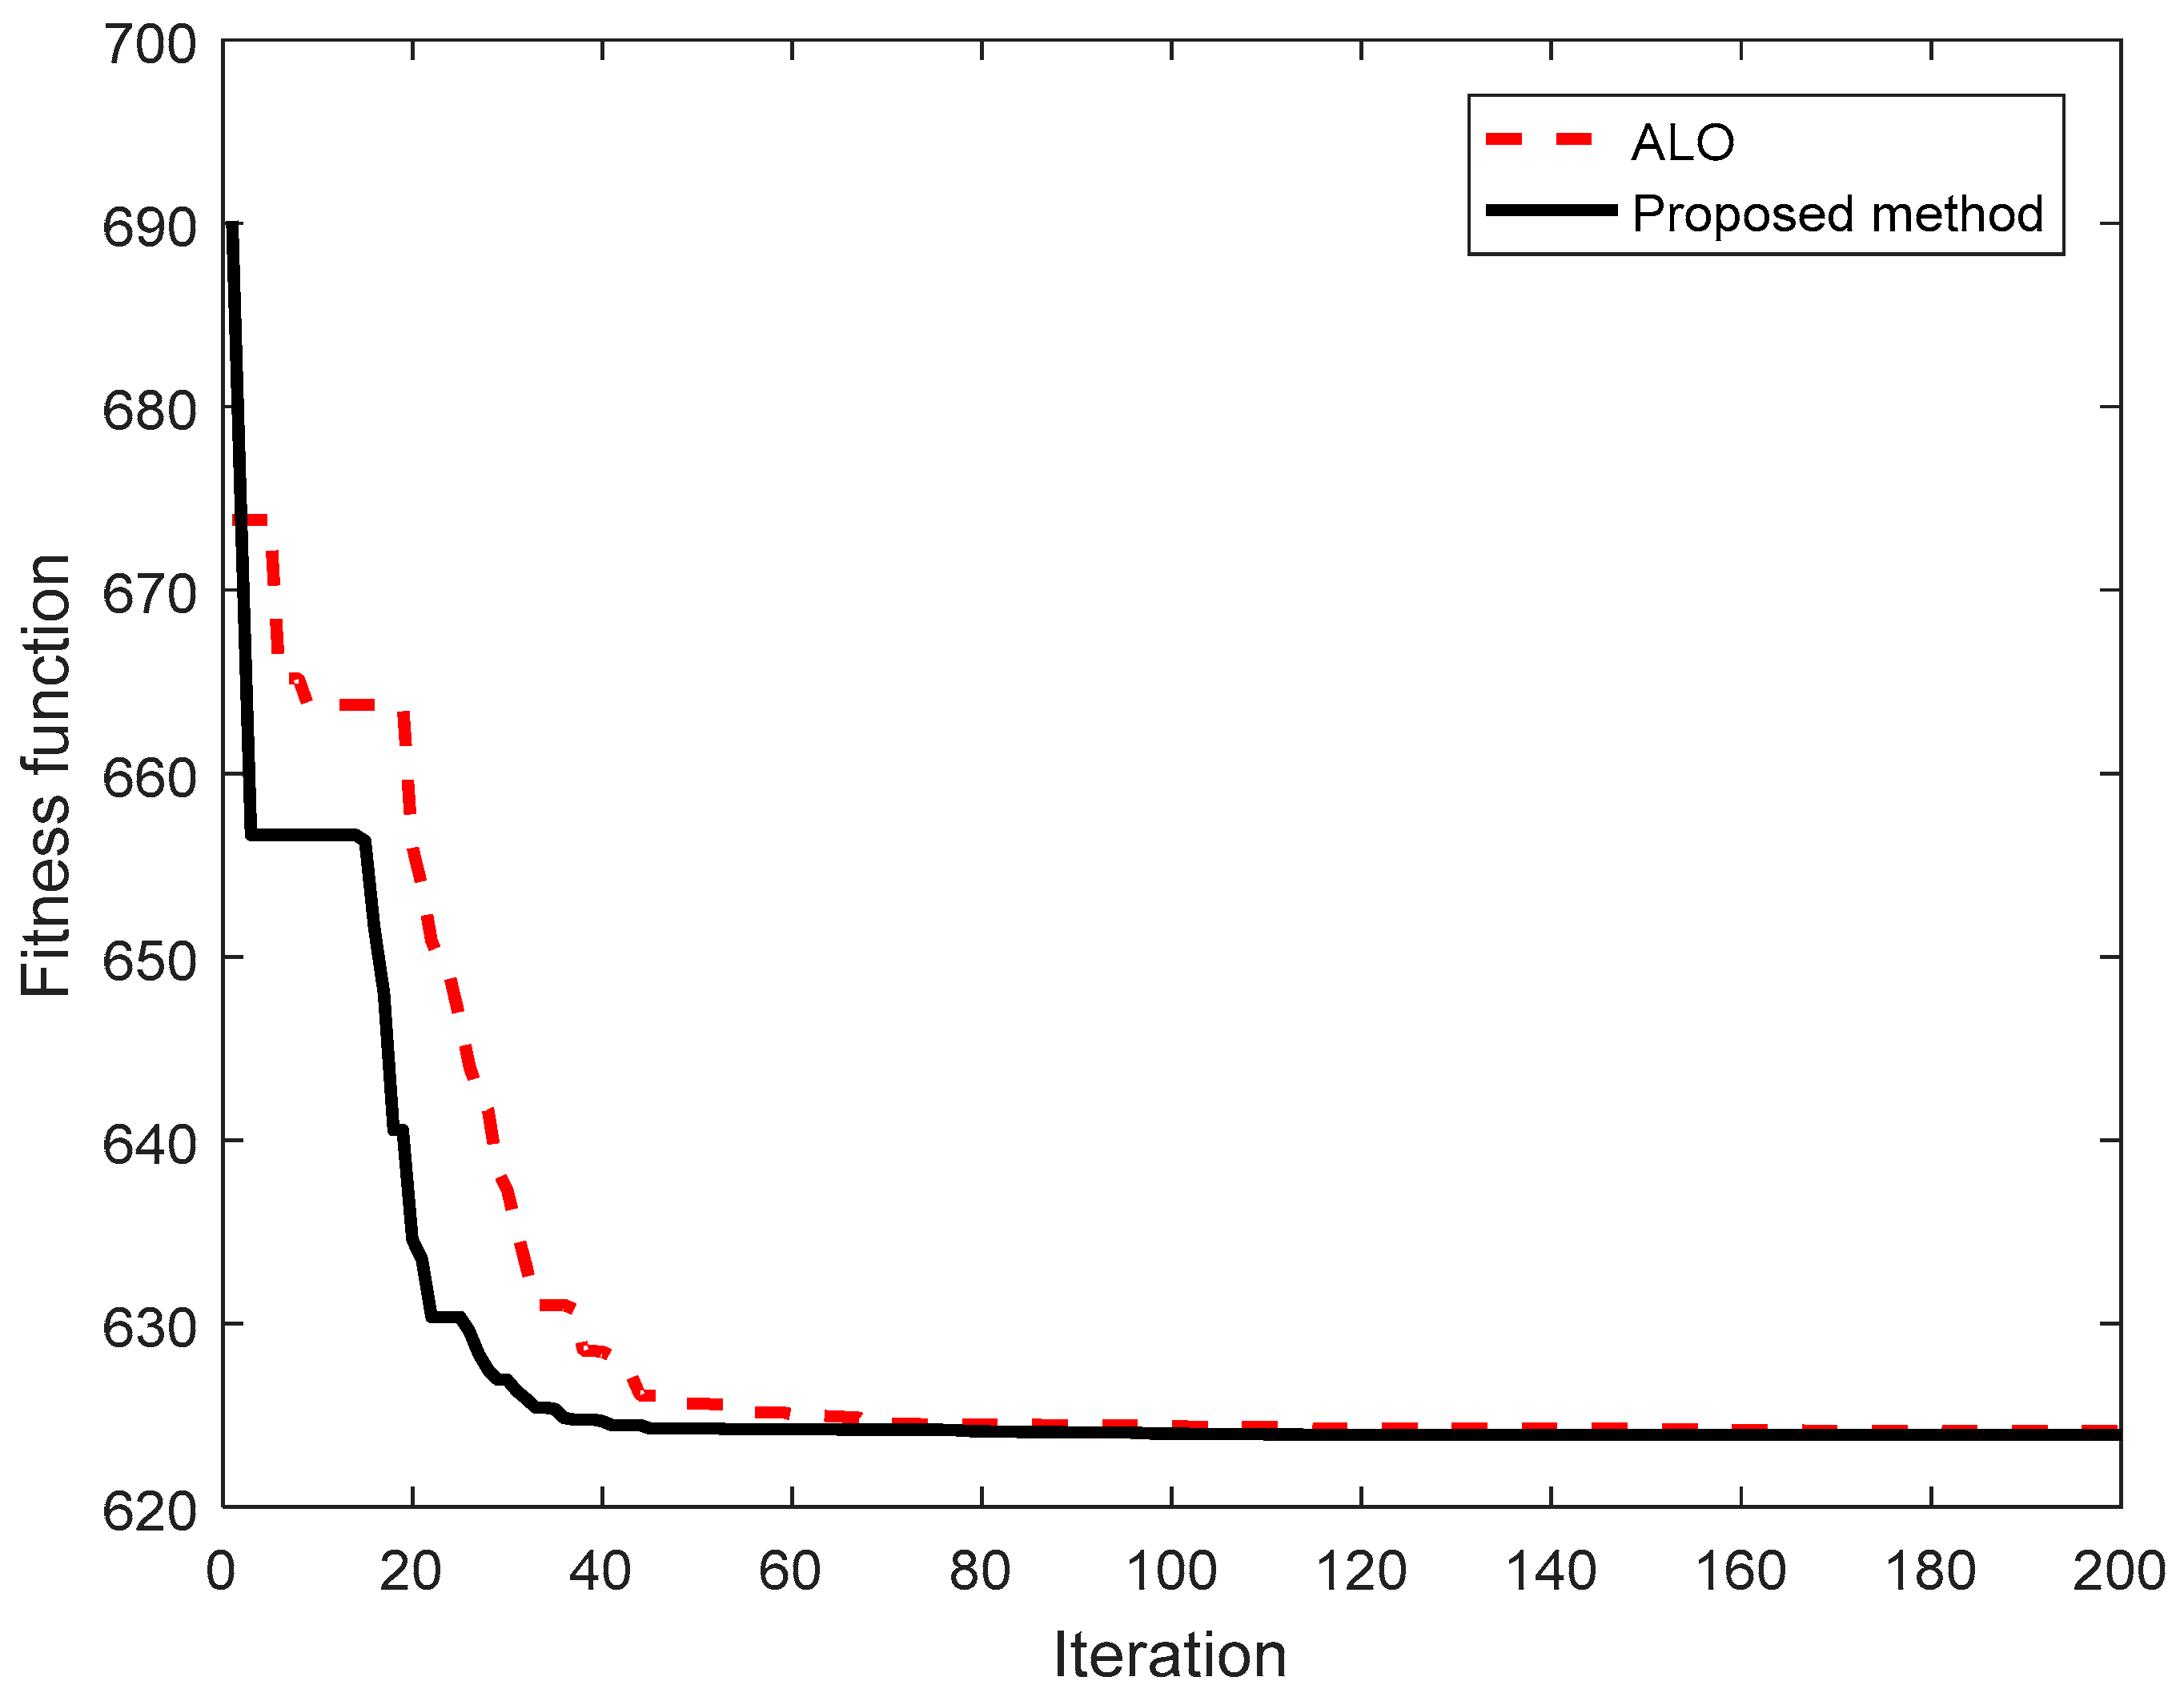
Figure 3, the solution of the IALO at the sixtieth iteration was much more effective than the solution of the ALO at the 200th iteration. Furthermore,
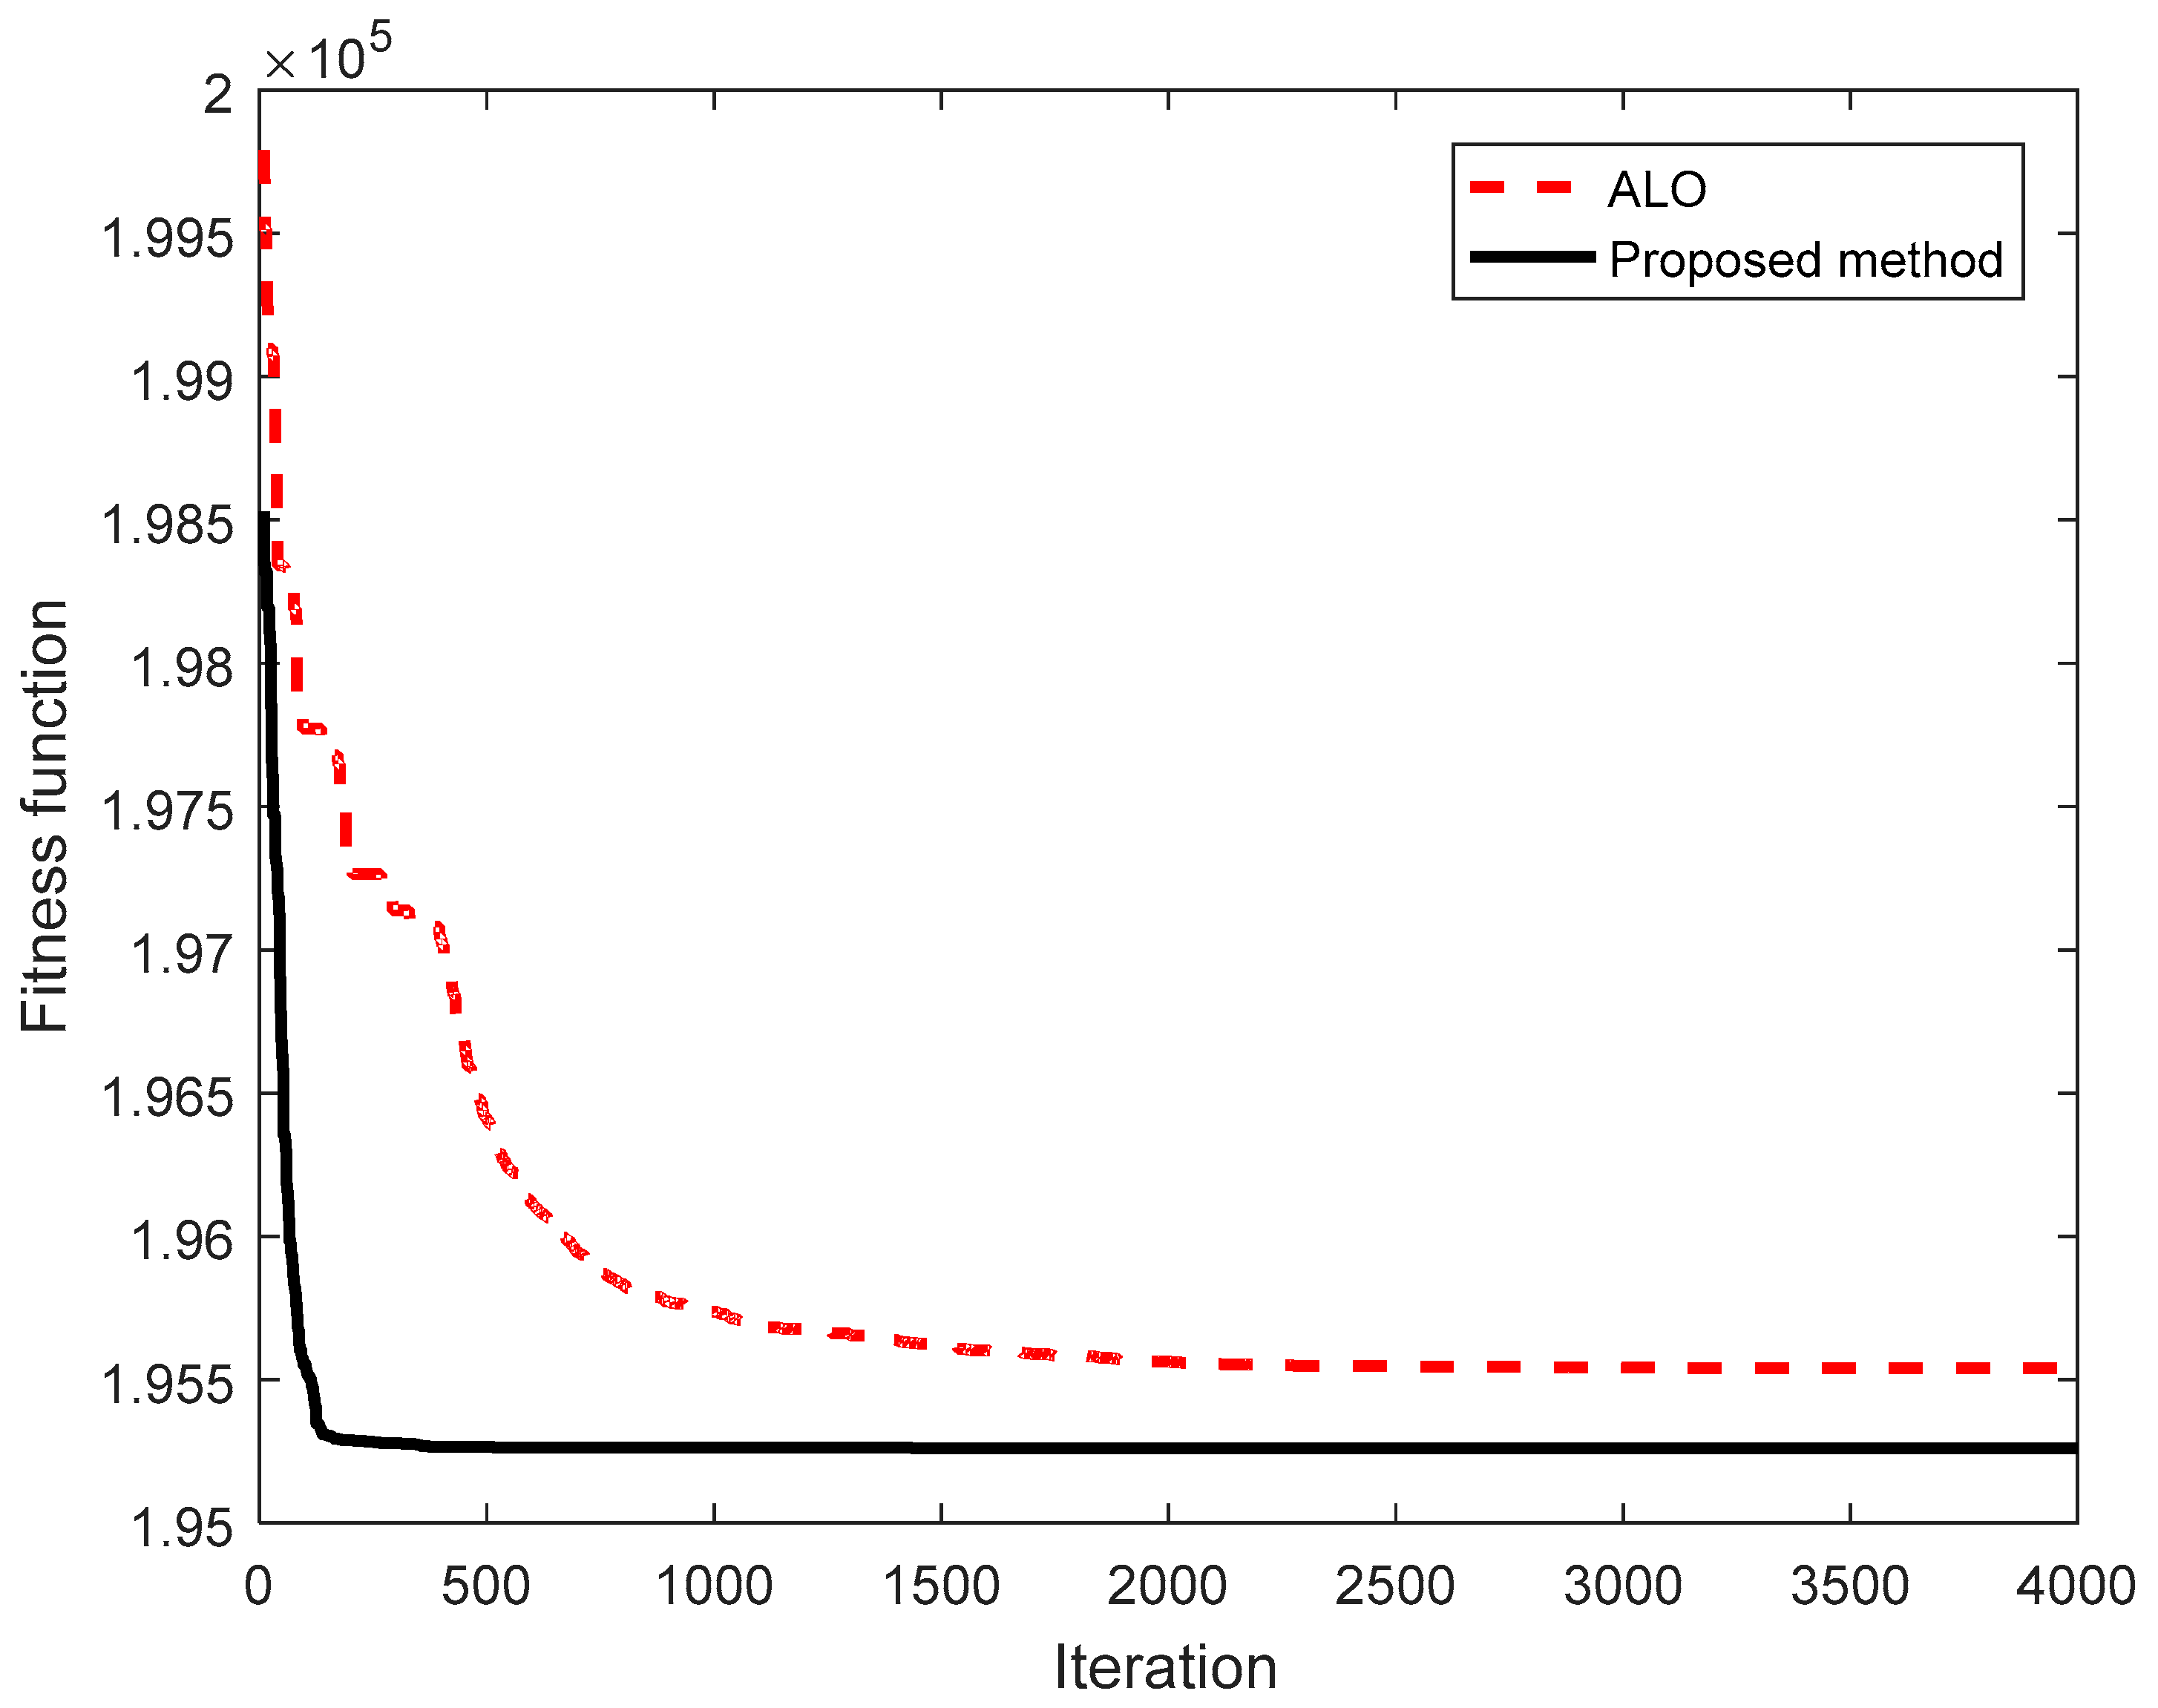
 Figure 4, Figure 5 and Figure 6 indicate that the IALO was at least three times faster than the ALO, and the best solution of the ALO was much worse that the solution of the IALO at one third the number of iterations.
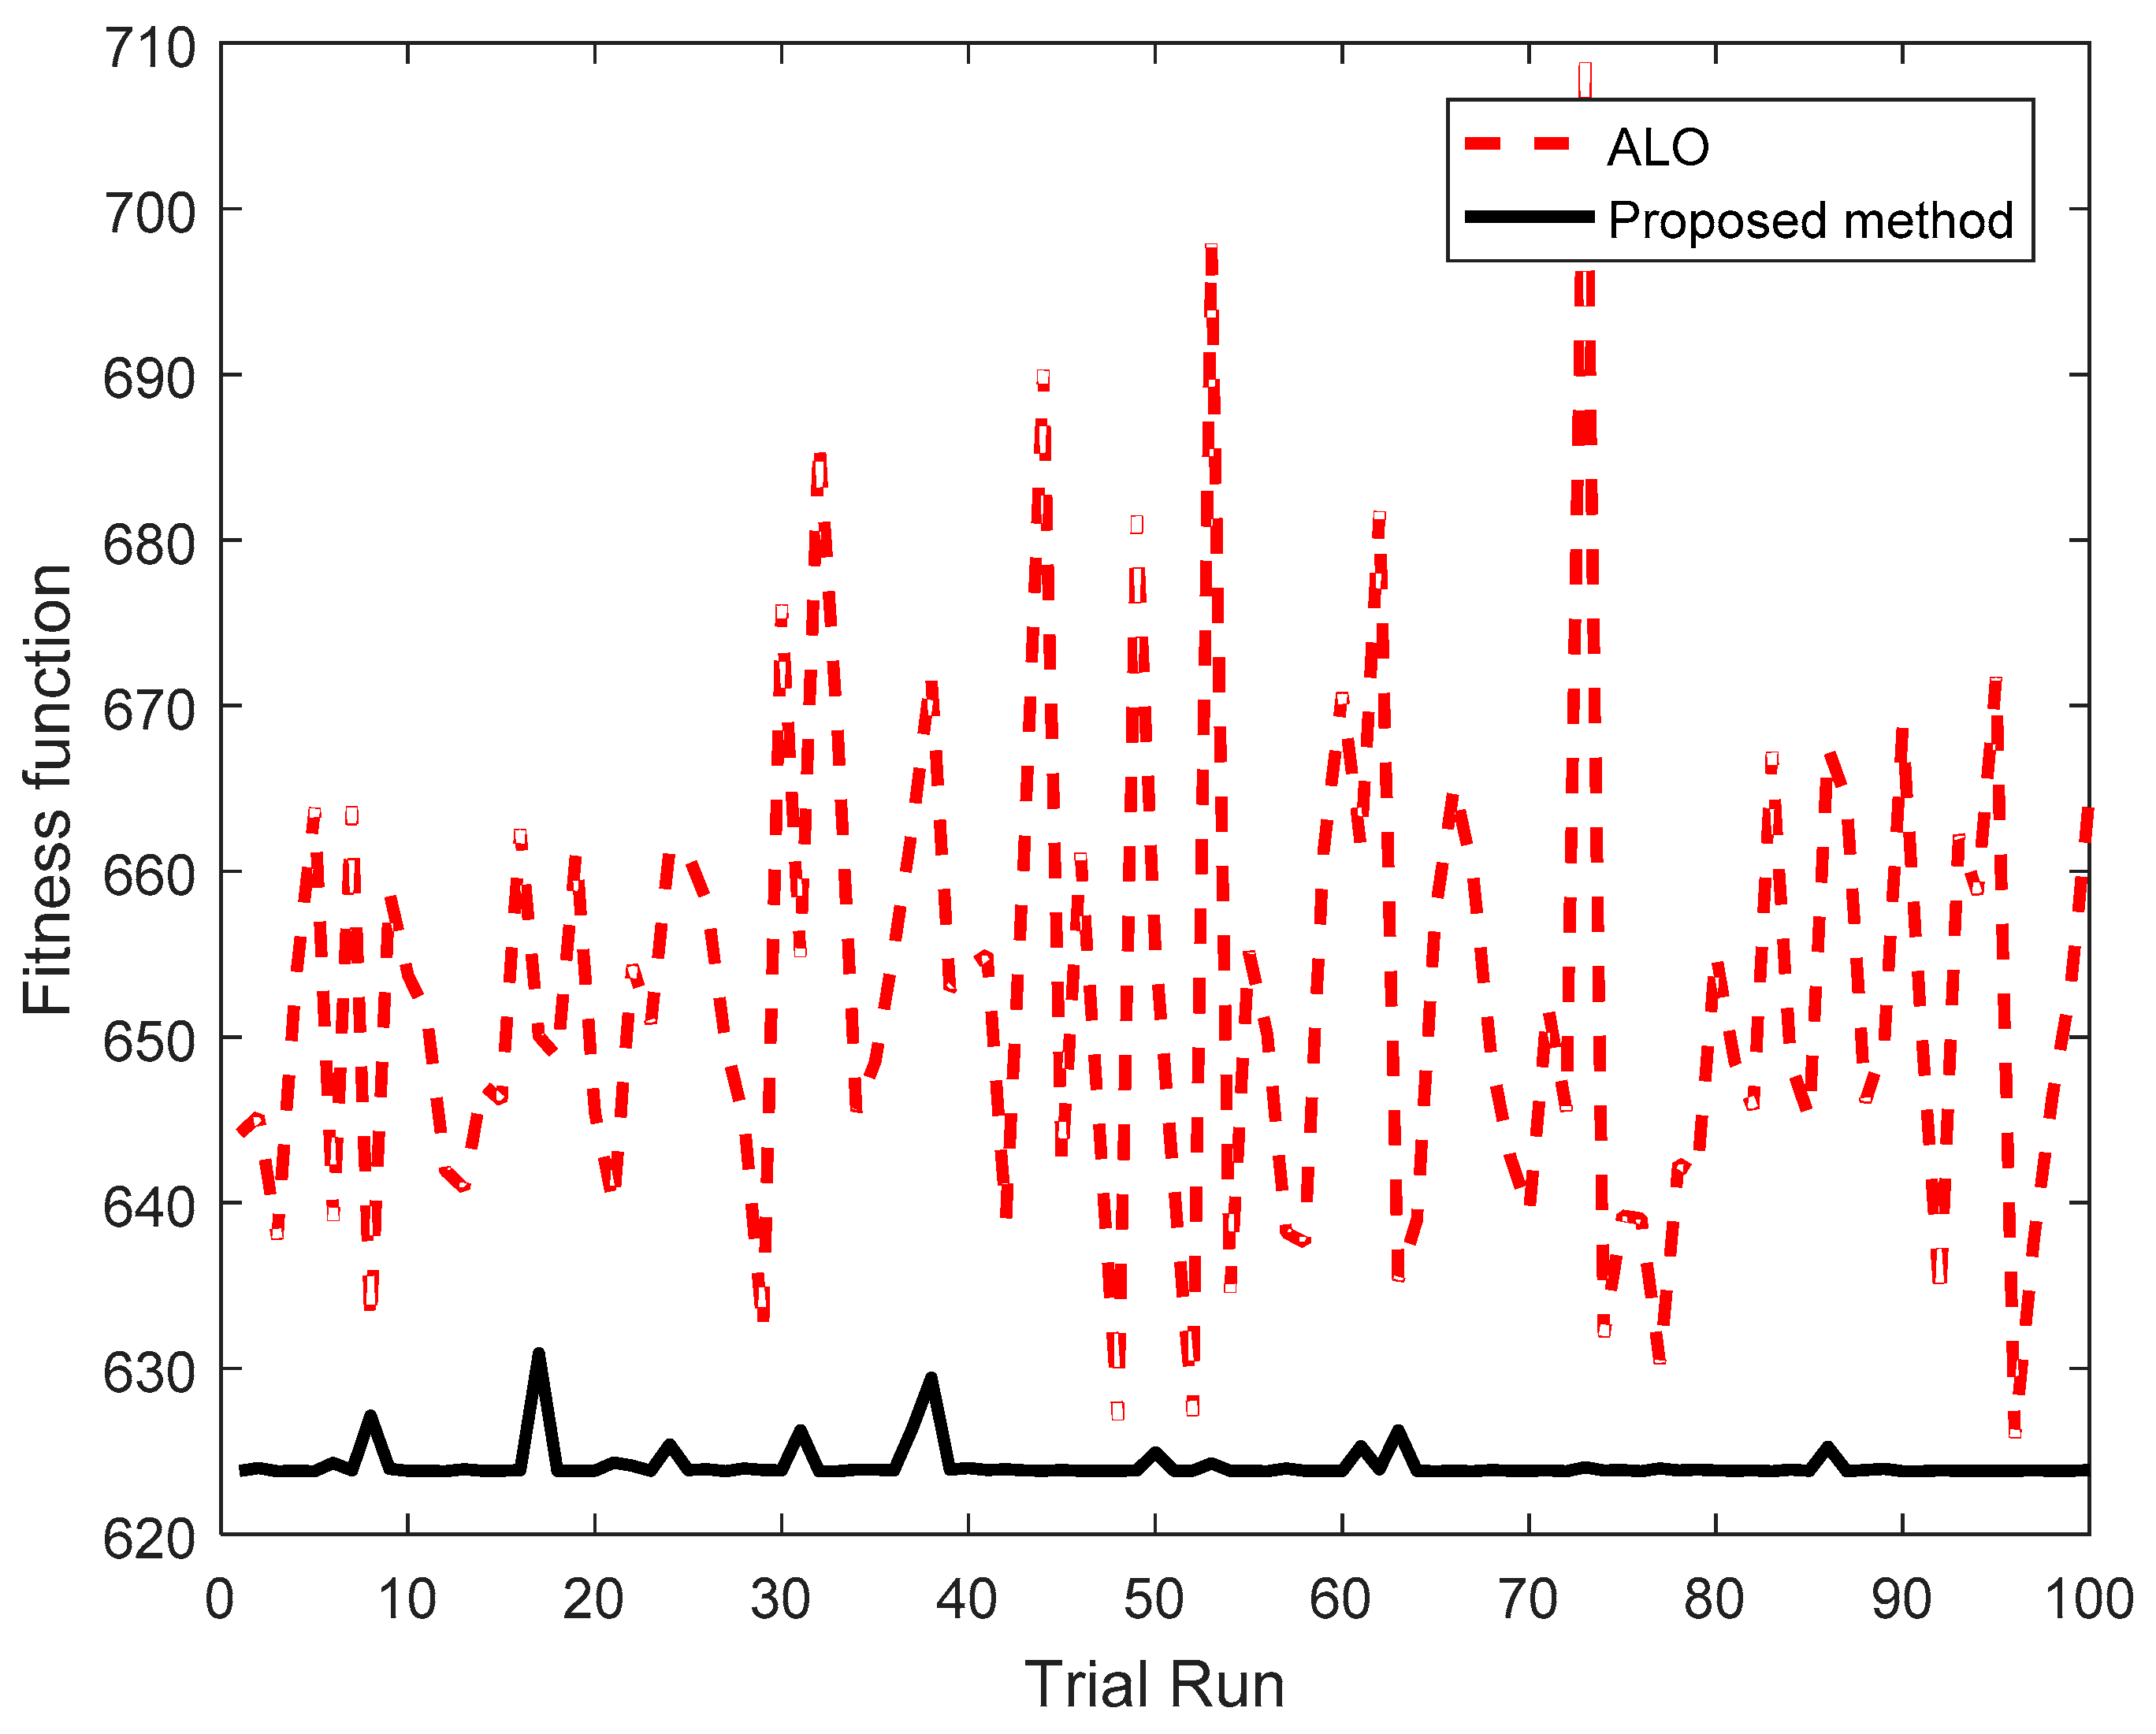
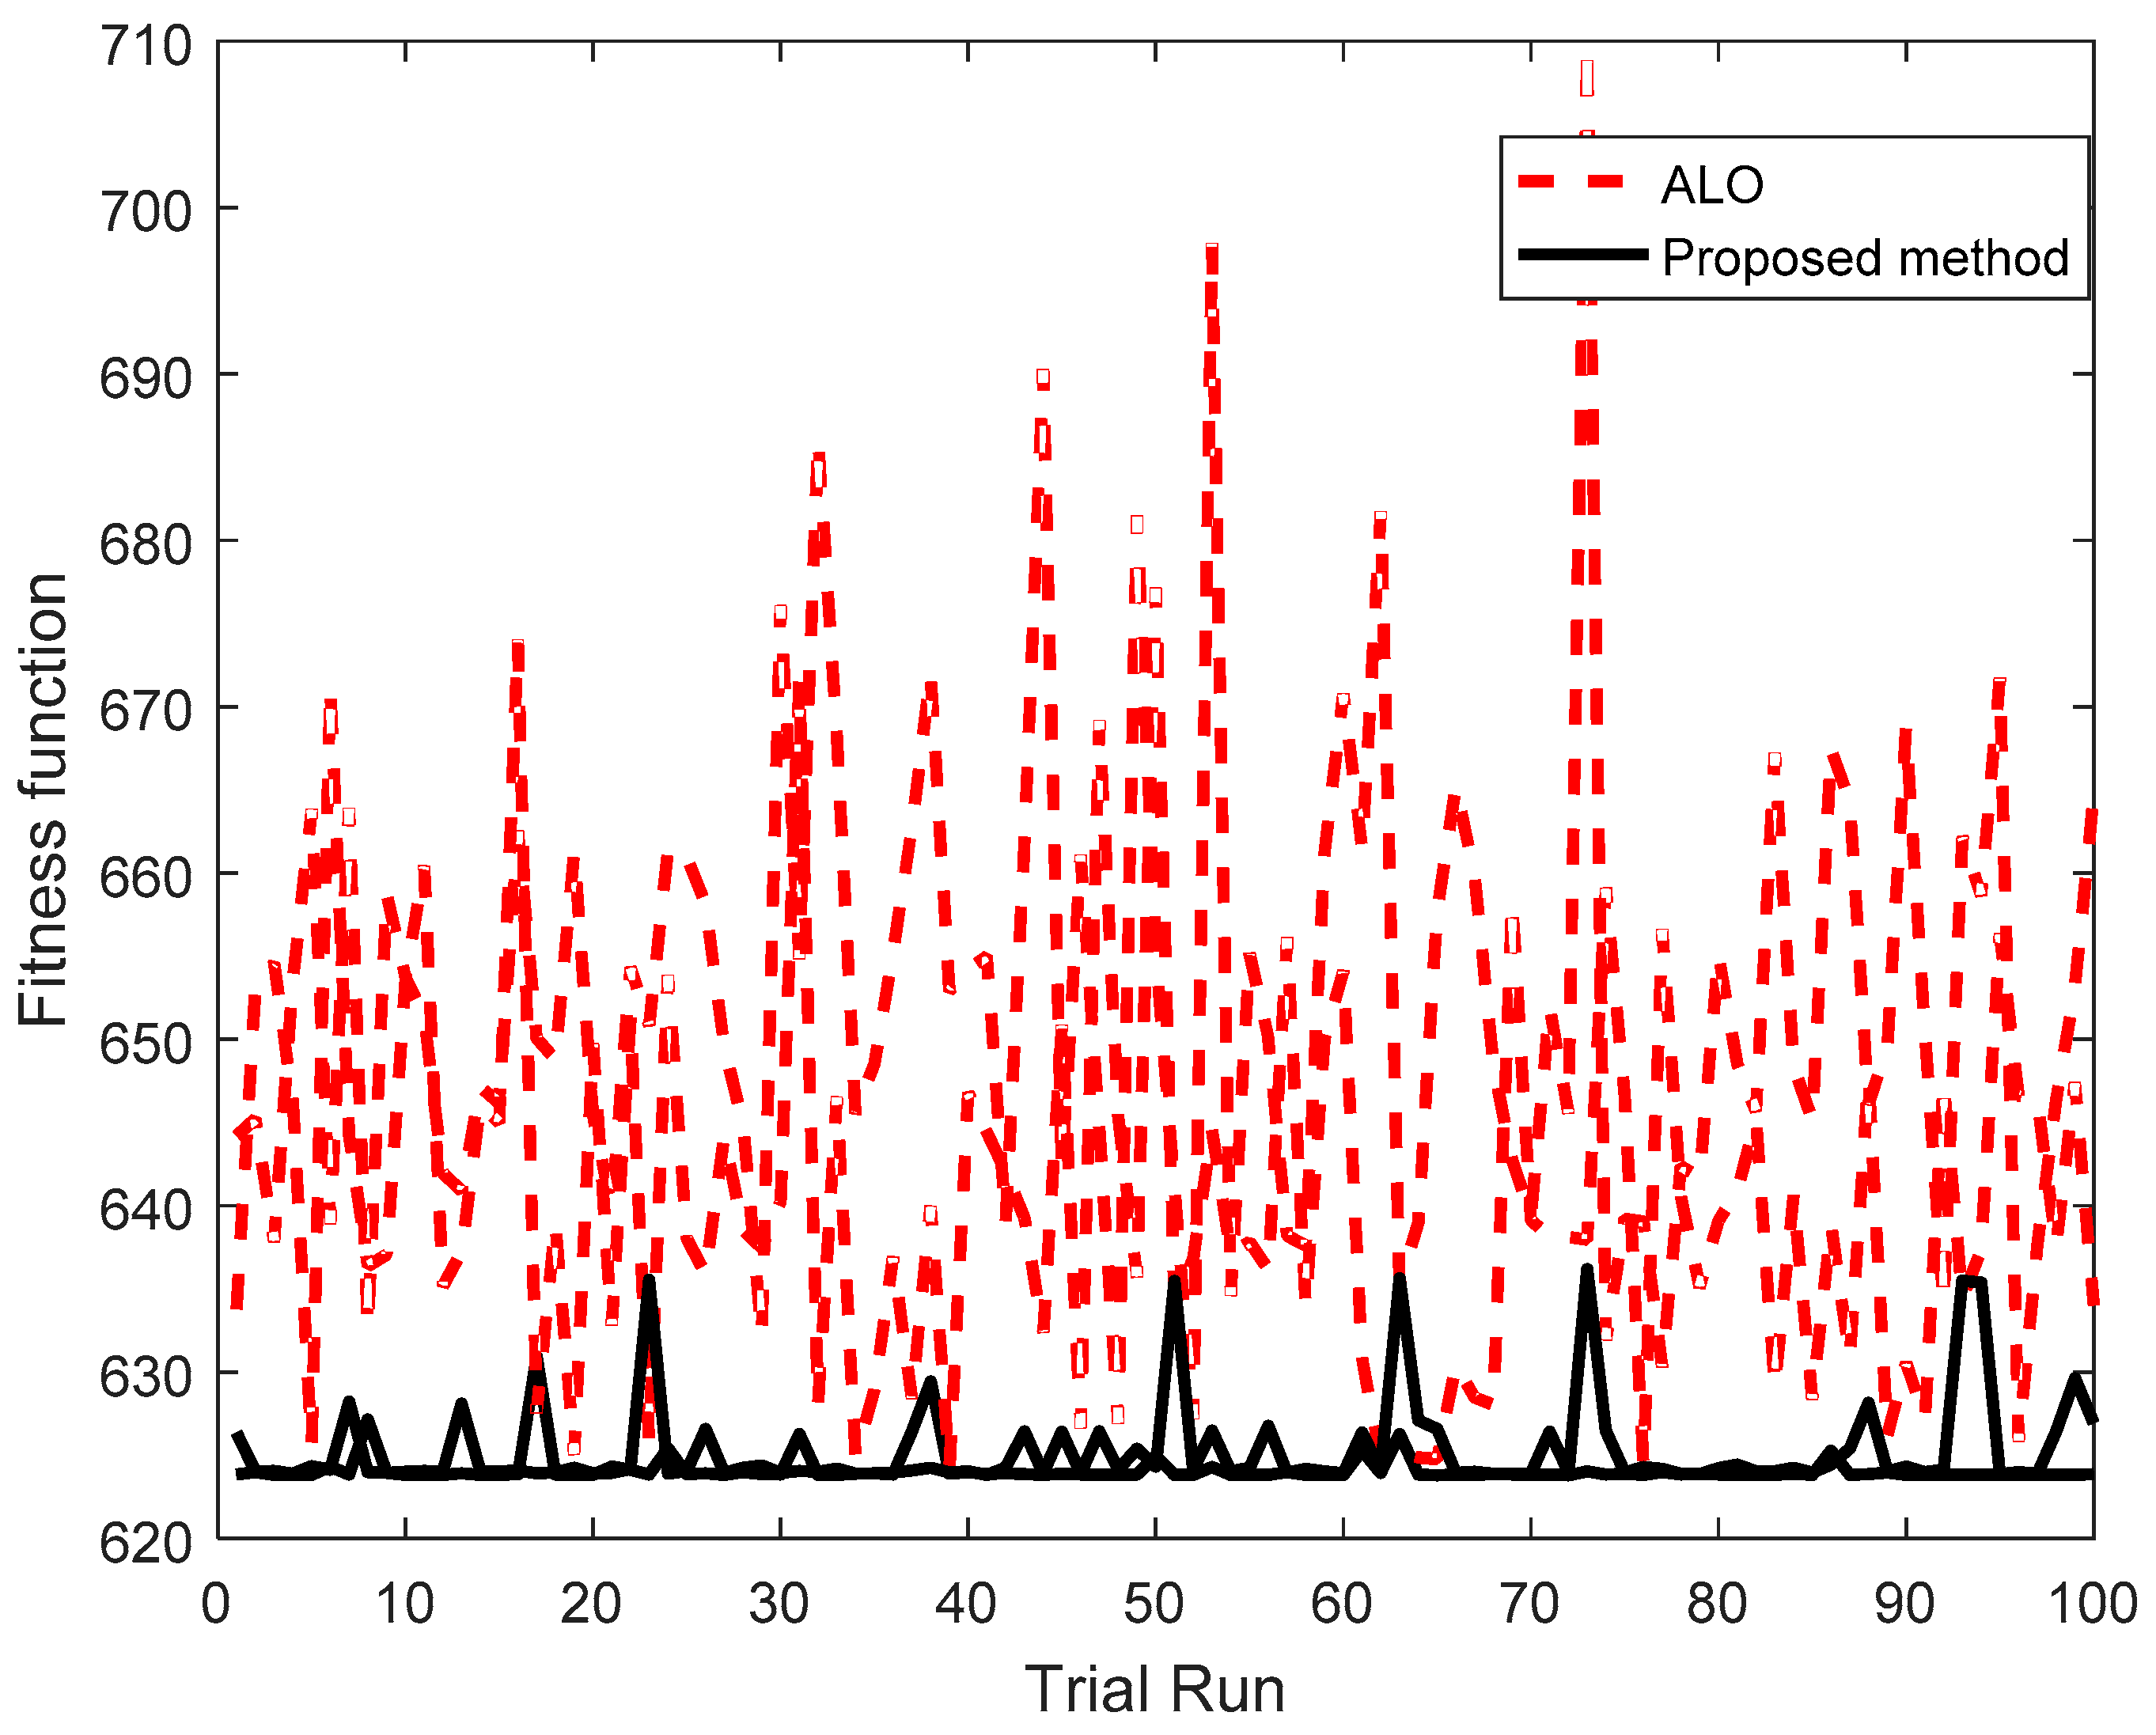
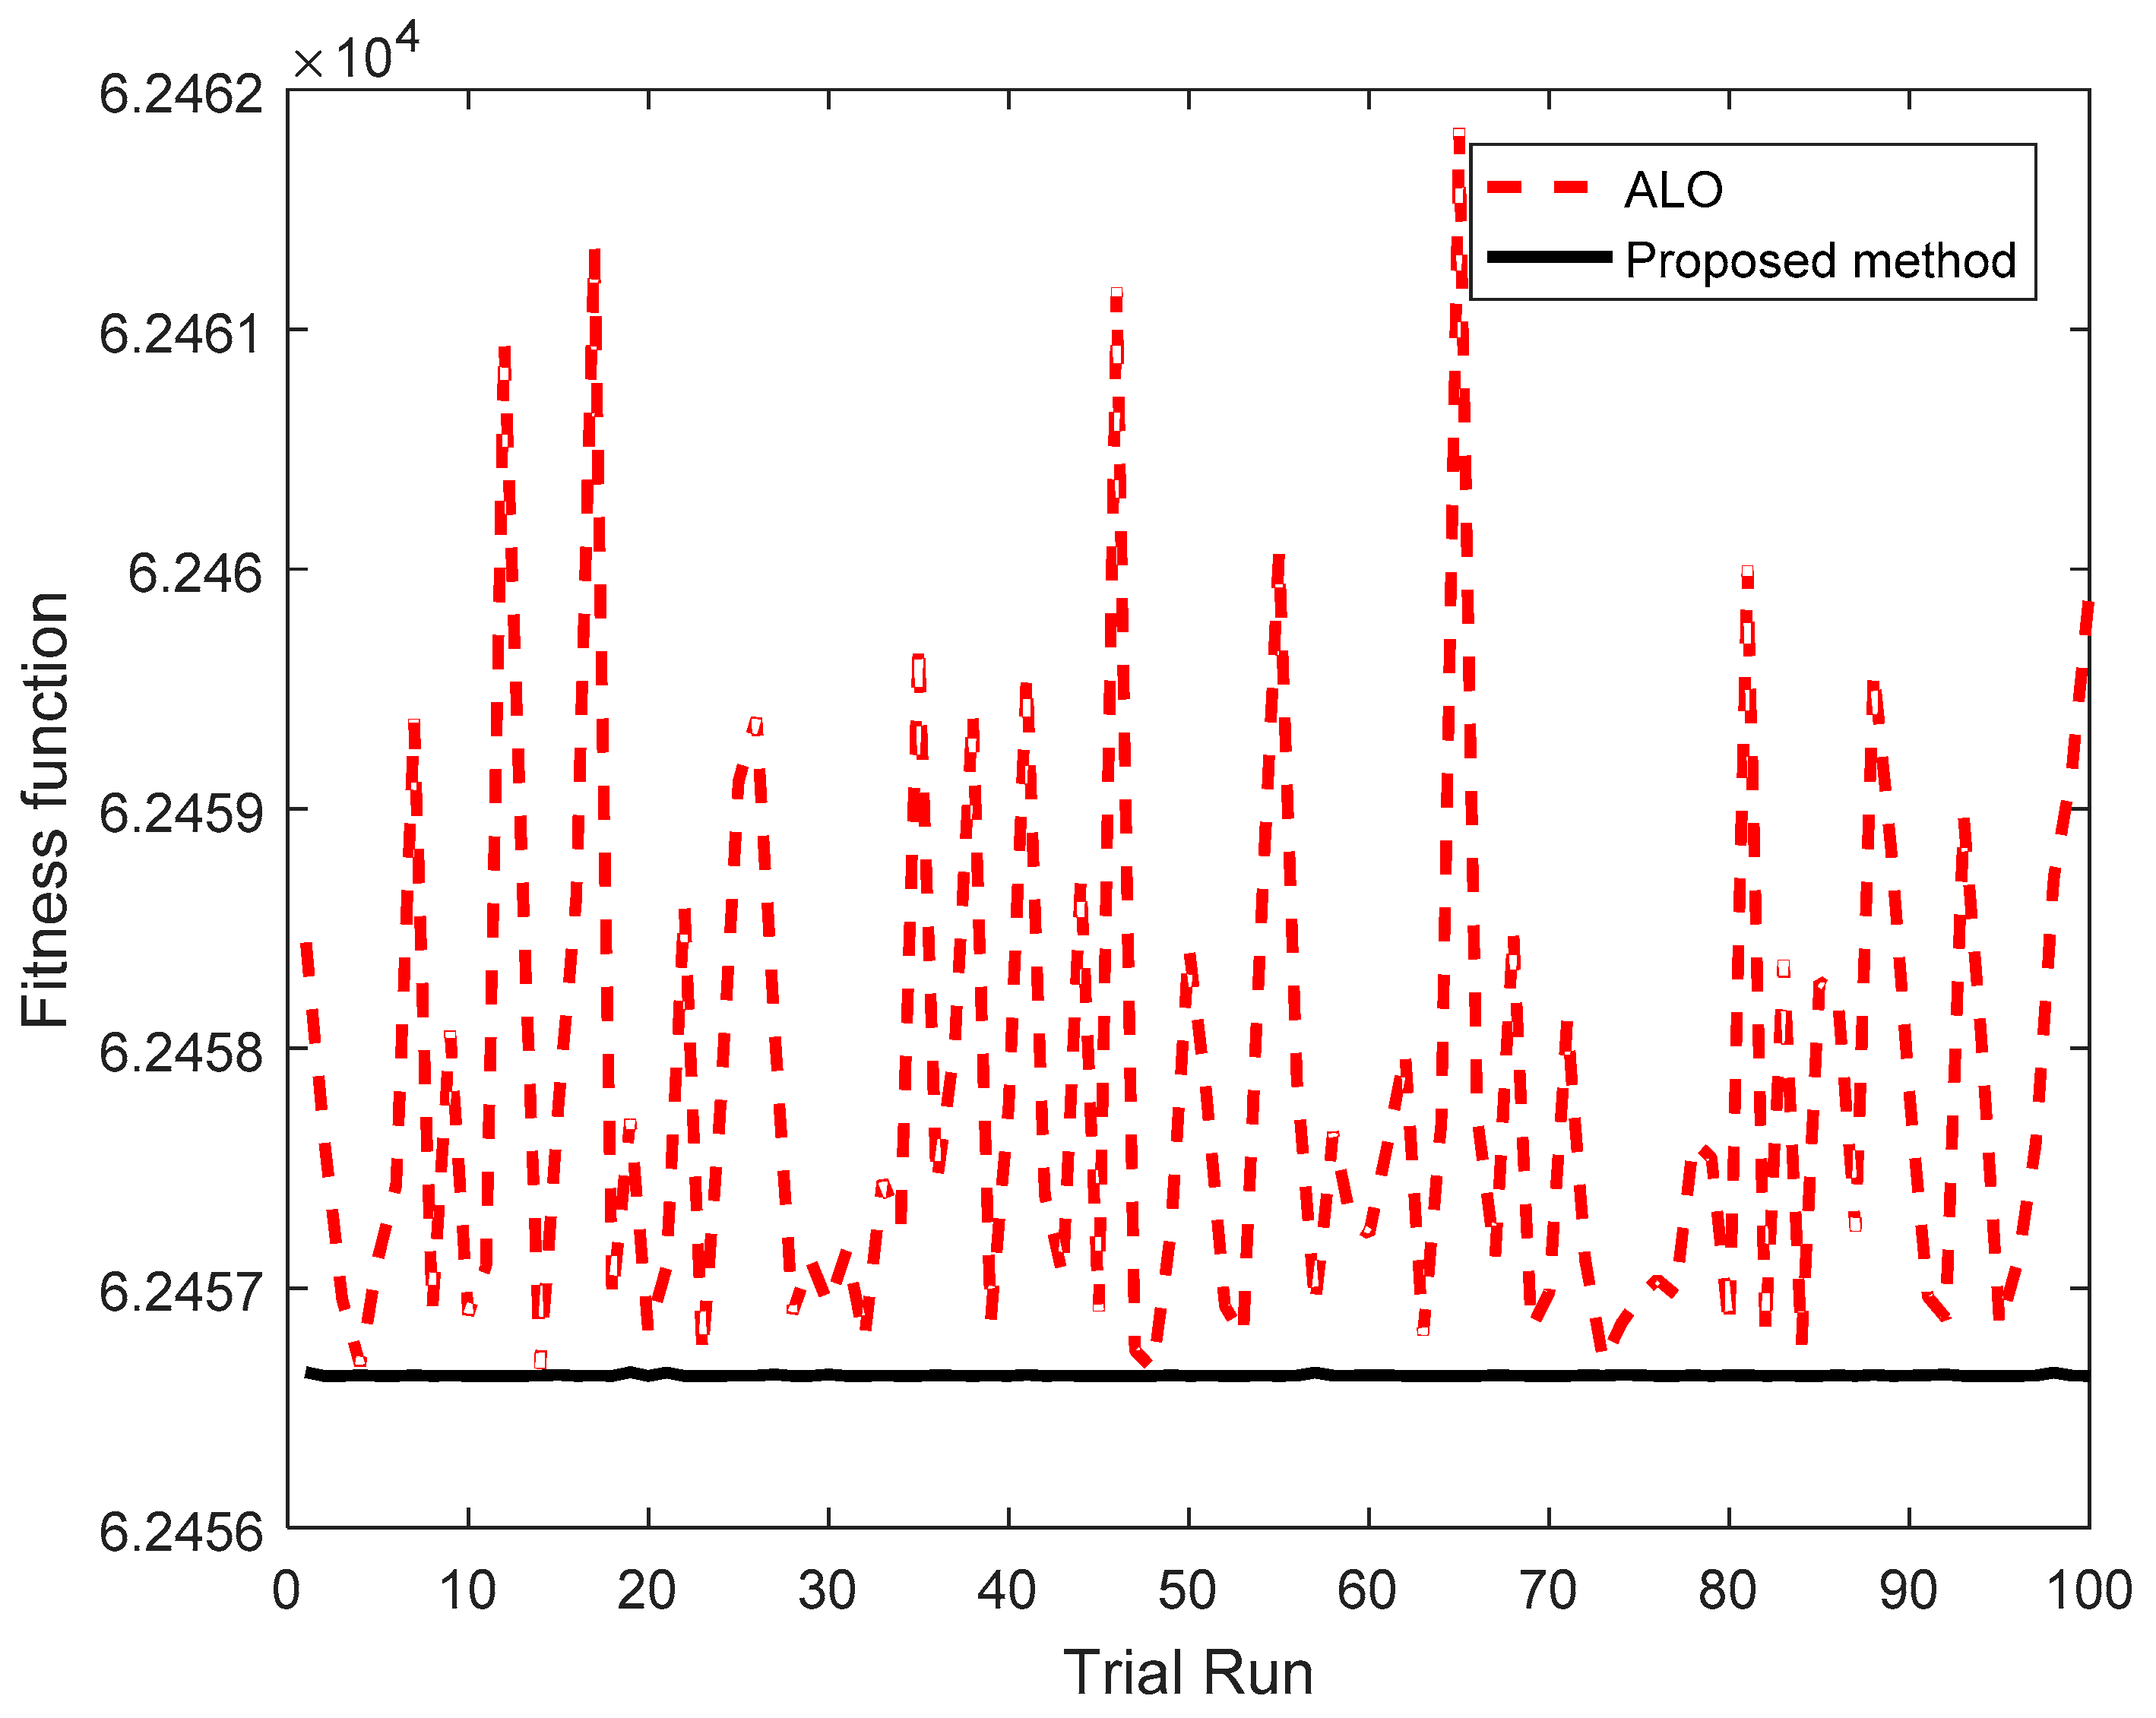
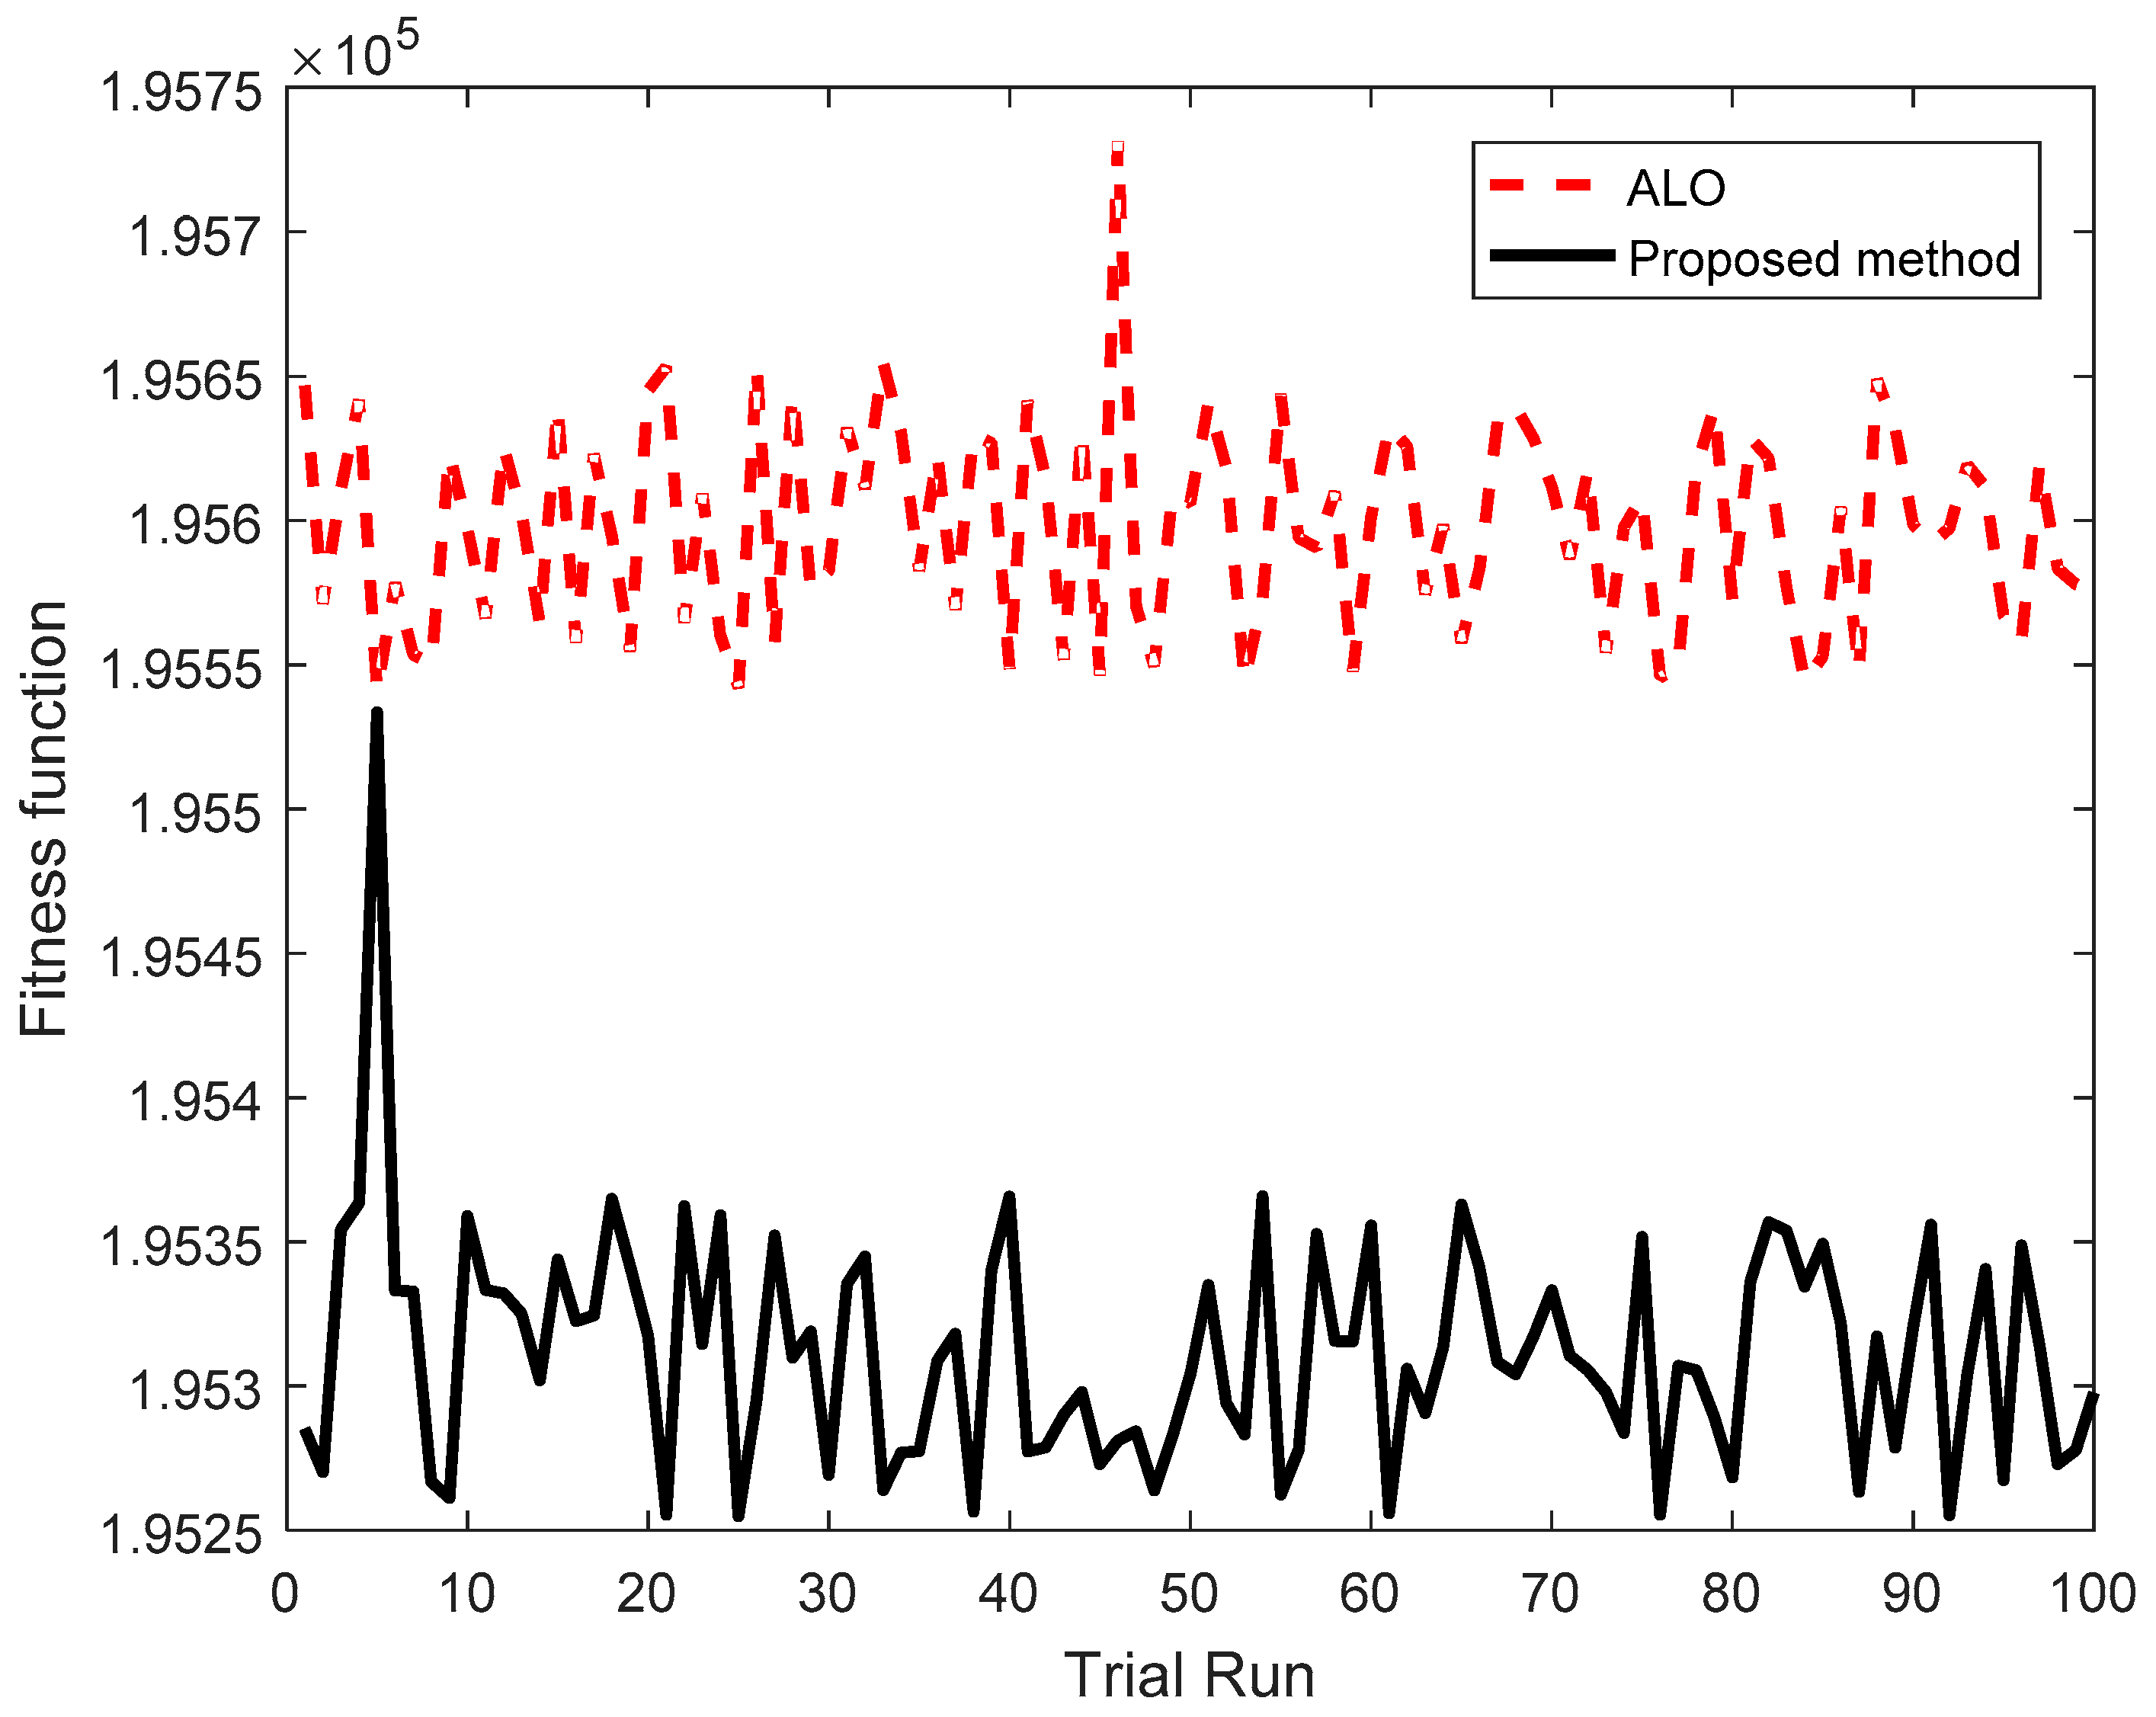
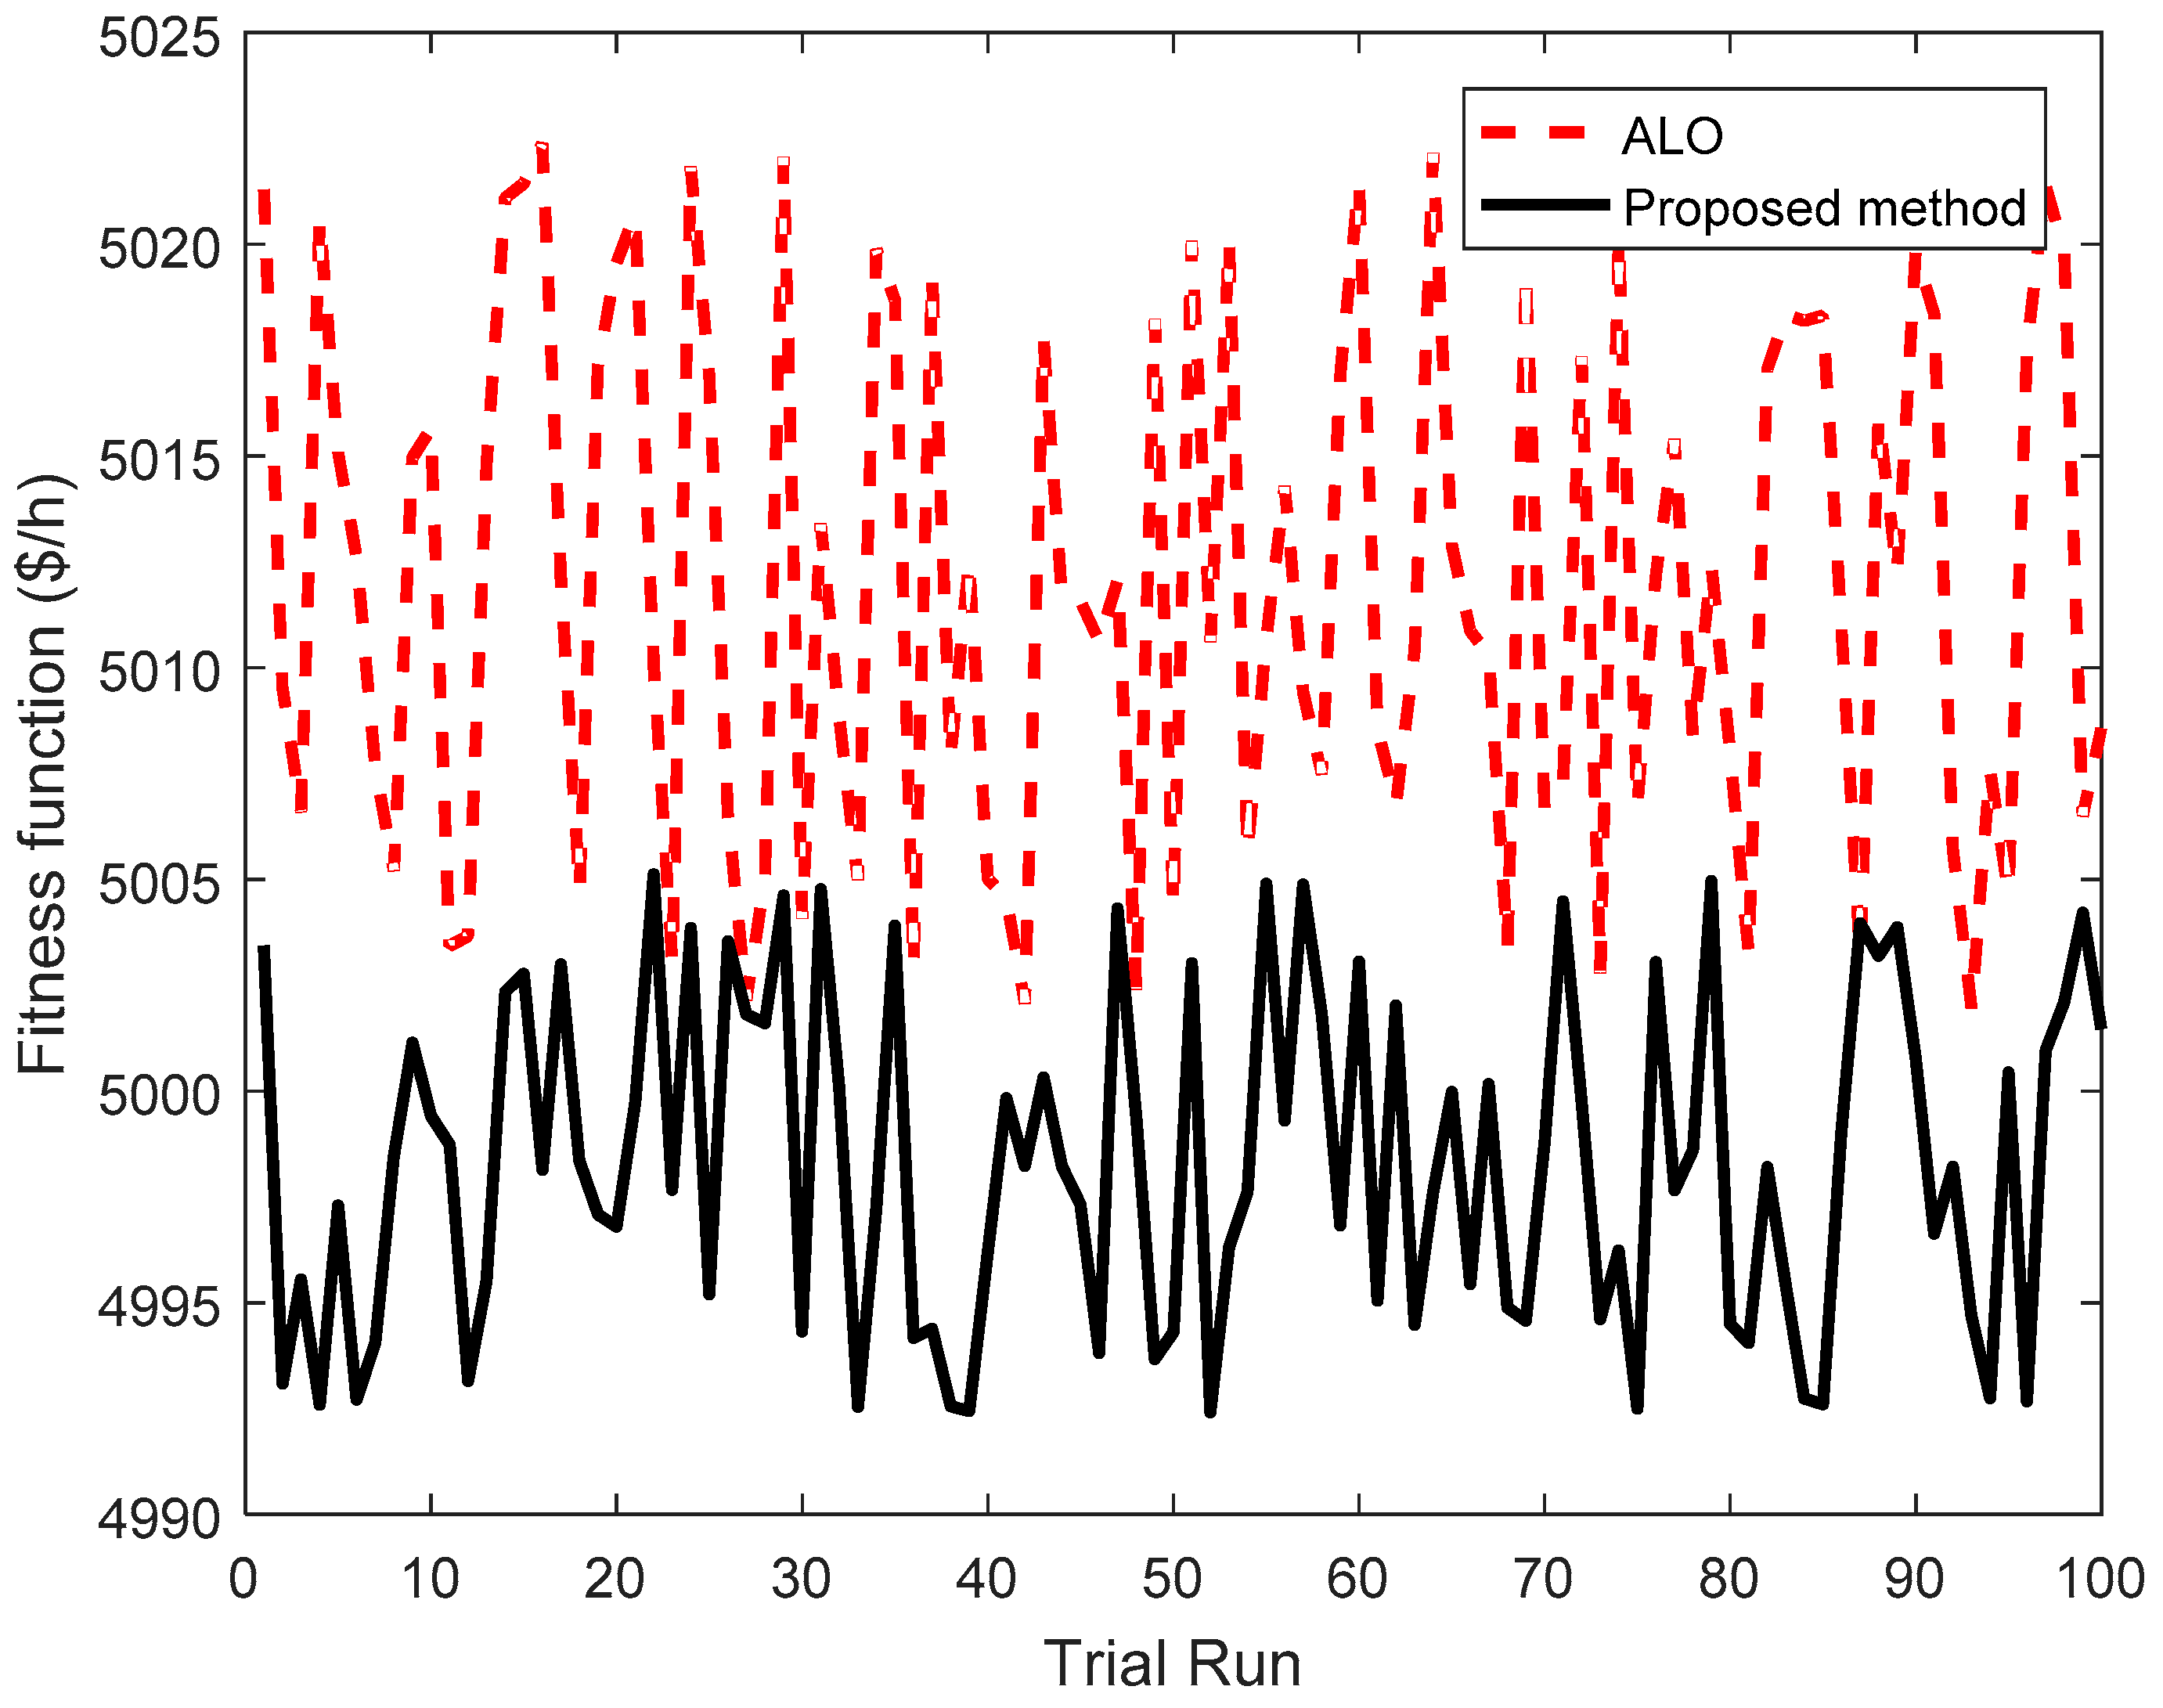
In order to investigate the efficiency of finding optimal solutions, the fitness of the best solution of successful runs was also plotted in Figure 7, Figure 8, Figure 9, Figure 10 and Figure 11 for comparison. Fitness values of the IALO are black points while those of the ALO are red points. All the figures have the same characteristic that red points have very large fluctuations, but black points have very tiny deviations, even though they are on a line with the same fitness value. This manner implies that approximately all runs of the IALO are close to the best solution, but the ALO fails to reach the same achievement. Consequently, the performance improvement of the suggested IALO over the ALO is significant when dealing with these considered study cases.
Optimal generations of the studied cases found by the IALO are reported in Appendix A.

6. Conclusions

In this paper, the proposed IALO was applied to find the best generation of available units with an intent to reduce the total generation cost of the whole system. Different studied cases with different types of systems and constraints were implemented for investigating the outstanding efficiency of the IALO over its conventional form. Systems with 10, 15, 20, 30, 60, 80, and 90 units were considered. The used comparison criteria comprised the best solution, the search speed, the improvement percentage, and the number of fitness evaluations. After comparing the proposed method with its conventional method and other methods, the advantages and disadvantages of the proposed method can be summarized as follows:
(1)
The proposed method can reach better results with faster speed than all compared methods for small-scale and large-scale systems with convex fuel cost functions and not very complicated constraints. In fact, for the system with 10 units and multi fuels, the proposed method could reach the best cost very quickly. Similarly, for 15, 30, 60, and 90-unit systems with POZ constraints and a convex fuel cost function, the proposed method is also superior to other compared methods. However, the outstanding performance cannot be reached for the same 10-unit system but with many complicated constraints and a nonconvex fuel cost function.
(2)
The proposed method can reach highly stable search ability since most of runs have the same or approximately the same solutions with the best run. This enables the proposed method to reach a very small fluctuation and find a high-quality solution easily.
(3)
The selection of population size and the number of iterations is simple but the conditions to apply Equations (27)–(29) are not easily determined. We had to try different systems to determine the most appropriate conditions for using these equations. For other problems, the conditions may be different from the 15% and 30% values found in this problem.
(4)
The proposed method can reach much better results than the ALO even when other conditions, different from 15% and 30%, are executed. So, ALO should be replaced with the proposed method for the ELD problem.
IALO is suggested as a highly efficient method in power systems, and it can be used to address other problems in wind power plants, solar power plants, and conventional power plants.

Author Contributions

B.H.D. and T.V.P. simulated the results and wrote the paper. T.T.N. supported the proposed IALO method. G.N.S. and M.Q.D. were responsible for writing and editing. All authors have read and agreed to the published version of the manuscript.

Funding

This research is funded by Funds for Science and Technology Development of the University of Danang, under project B2019-DN01-19 and was supported by the Operational Programme Human Capital of the Ministry of European Funds through the financial agreement 51675/09.07.2019, SMIS code 125125.

Conflicts of Interest

The authors declare no conflicts of interest regarding the publication of this paper.

Abbreviations

ABCArtificial bee colony
AHNNAdaptive hopfield neural network
AISAArtificial immune system algorithm
ALHNAugmented lagrange–hopfield network
ALOAntlion optimization
BBOBiogeography-based optimization
CBOAChaotic bat optimization algorithm
CFOAChaotic firefly optimization algorithm
CSACuckoo search algorithm
CSOCat swarm optimization
CPUComputation time
DEDifferential evolution
DSPSO-TSAParticle swarm optimization and tabu search algorithm
EALHNEnhanced augmented lagrange–hopfield network
EMAExchange market algorithm
EMFAEffectively modified firefly algorithm
ESOEvolutionary strategy optimization
FCFFuel cost function
FNMFast newton–raphson method
FOAFirefly optimization algorithm
FSAPSOFuzzy and self-adaptive particle swarm optimization
GAGenetic algorithm
GMGradient method
GWOAGrey wolf optimization algorithm
HDE-DPHybrid integer coded differential evolution and dynamic programming
HMHierarchical method
HNNHopfield neural network
IAImmune algorithm
IALOImproved antlion optimization
IDEImproved differential evolution
IFOAImproved firefly optimization algorithm
IGAImproved genetic algorithm
KHAKrill herd algorithm
LIMLambda-iteration method
LPTLinear programming technique
LRLagrange relaxation
MCSAModified cuckoo search algorithm
MFsMulti fuels
MFOAModified firefly optimization algorithm
MFOMulti-fuel option
MKHAModified krill herd algorithm
MPSOModified particle swarm optimization
NHMNew Hopfield model
RCSAOne rank cuckoo search algorithm
POZProhibited operating zone
PSOParticle swarm optimization
QIPSOQuantum-inspired particle swarm optimization
RCGAReal-code genetic algorithm
RRLRamp rate limit
SDEStud differential evolution
SFSingle fuel
SHOSpotted hyena optimizer
SRSpinning reserve
TGUsThermal generation units
TMTaguchi method
VFOAVarying firefly optimization algorithm
VPEsValve point effects
θ-PSOTheta particle swarm optimization

Appendix A

Table A1. Optimal generation of a 20-unit system.
iPi (MW)iPi (MW)iPi (MW)
1512.77749100.40911766.8624
2169.060710106.02361887.9976
3126.913111150.265219100.7907
4102.812712292.76262054.3010
5113.723213119.1171
673.56911430.8415
7115.273315115.7960
8116.41151636.2578
Table A2. Optimal generation for the system with 10 units and multi fuels.
Variablespd (MW)
2400250026002700
P1 (MW)189.6646206.6213216.6647218.3062
P2 (MW)202.3219206.5538211.0259211.6721
P3 (MW)254.0950265.6818279.1049280.8697
P4 (MW)232.9987236.0725239.1398239.6865
P5 (MW)241.9741257.9536274.7016278.9789
P6 (MW)233.0834236.0159239.1613239.6547
P7 (MW)253.1122268.9897285.2955288.2317
P8 (MW)233.0613235.6660238.9353239.5904
P9 (MW)320.1065331.1658343.5252428.3785
P10 (MW)239.5823255.2796272.4458274.6313
Cost ($/h)481.723526.239574.381623.809
Table A3. Optimal generation for the system with 10 units, MFs, VPEs, and a 2700 MW load.
iPi (MW)iPi (MW)
1217.07796239.6610
2210.91697290.0979
3280.65718239.5520
4240.22399426.0466
5279.907710275.8590
Table A4. Optimal generation for the system with 10 units, POZ, RRL, MFs, VPEs, and spinning reserve (SR).
iPi (MW)iPi (MW)
1217.07796239.6610
2210.91697290.0979
3280.65718239.5520
4240.22399426.0466
5279.907710275.8590
Table A5. Optimal generation for the system with 15 units, POZ, and SR.
iPi (MW)iPi (MW)iPi (MW)
145064551120
245074651255
31308601325
41309251415
533510201515
Table A6. Optimal generation for the system with 30 units, POZ, and SR.
iPi (MW)iPi (MW)iPi (MW)
1454.9985112021459.9999
24551255.906722465
313013252360
413014152425
5335.00381515.00012520.0002
6460164552620
746517454.99962757.2505
860181302825
925191302915.0001
1020.000120301.84053015
Table A7. Optimal generation for the system with 60 units, POZ, and SR.
iPi (MW)iPi (MW)iPi (MW)iPi (MW)
1455164553145546455
2455174553245547455
3130181303313048130
4130191303413049130
533520309.625235315.645750313.4956
6460214603646051459.9994
7465224653746552465
860236038605360
925242539255425
1020252040205520
1120262041205620
12552757.06824257.08545757.0805
1325282543255825
1415291544155915
1515301545156015
Table A8. Optimal generation for the system with 90 units, POZ, and SR.
iPi (MW)iPi (MW)iPi (MW)iPi (MW)iPi (MW)iPi (MW)
1454.99981645531455464556145576455
24551745532455474556245577455
31301813033130481306313078130
41301913034129.999491306413079130
5335.00020311.43635316.07350324.710665299.266780321.7643
64602146036460514606646081460
74652246537465524656746582465
86023603860536068608360
92524253925542569258425
102025204020552070208520
112026204120562071208620
12552758.034257.77385756.27927258.10478756.5624
132528254325582573258825
141529154415591574158915
151530154515601575159015
Table A9. Optimal generation for the system with 80 units, MFs, and VPEs.
iPi (MW)iPi (MW)iPi (MW)iPi (MW)
1219.13221216.051141216.051161219.132
2217.10622213.14542209.431562212.4023
3281.665323277.632443277.632563278.6406
4244.120624234.445944234.311564242.6425
5279.936125279.915345279.939365279.9565
6239.526626241.407846241.273466239.2578
7287.728527290.098347287.726867285.3564
8239.955128239.014548241.970768234.7147
9430.693729431.962849430.537669436.1419
10275.871930272.709450273.135470279.0299
11221.185931220.15951213.99771219.132
12213.14532213.887652209.431572209.1839
13279.648833275.61653277.632473281.6653
14240.761334238.745854239.014574241.2988
15279.93735279.934455276.345375276.412
16241.273436240.064156239.929776233.7486
17287.727437290.096857290.098677290.0987
18240.358238236.192758240.492678240.3582
19425.698539424.86859427.748279432.3512
20275.869840272.750560275.869780275.8687

References

  1. Wood, A.; Wollenberg, B. Power generation operation and control—2nd edition. Fuel Energy Abstr. 1996, 37, 195. [Google Scholar] [CrossRef]
  2. Lin, C.; Viviani, G. Hierarchical Economic Dispatch for Piecewise Quadratic Cost Functions. IEEE Trans. Power Appar. Syst. 1984, 1, 1170–1175. [Google Scholar] [CrossRef]
  3. Bard, J.F. Short-Term Scheduling of Thermal-Electric Generators Using Lagrangian Relaxation. Oper. Res. 1988, 36, 756–766. [Google Scholar] [CrossRef]
  4. Farag, A.; Al-Baiyat, S.; Cheng, T. Economic load dispatch multiobjective optimization procedures using linear programming techniques. IEEE Trans. Power Syst. 1995, 10, 731–738. [Google Scholar] [CrossRef]
  5. Chen, J.-F.; Chen, S.-D. Multiobjective power dispatch with line flow constraints using the fast Newton-Raphson method. IEEE Trans. Energy Convers. 1997, 12, 86–93. [Google Scholar] [CrossRef]
  6. Park, J.; Kim, Y.; Eom, I.; Lee, K. Economic load dispatch for piecewise quadratic cost function using Hopfield neural network. IEEE Trans. Power Syst. 1993, 8, 1030–1038. [Google Scholar] [CrossRef] [Green Version]
  7. Lee, K.; Sode-Yome, A.; Park, J.H. Adaptive Hopfield neural networks for economic load dispatch. IEEE Trans. Power Syst. 1998, 13, 519–526. [Google Scholar] [CrossRef]
  8. Su, C.-T.; Lin, C.-T. New approach with a Hopfield modeling framework to economic dispatch. IEEE Trans. Power Syst. 2000, 15, 541–545. [Google Scholar]
  9. Vo, D.N.; Ongsakul, W. Economic dispatch with multiple fuel types by enhanced augmented Lagrange Hopfield network. Appl. Energy 2012, 91, 281–289. [Google Scholar] [CrossRef]
  10. Dieu, V.N.; Ongsakul, W.; Polprasert, J. The augmented Lagrange Hopfield network for economic dispatch with multiple fuel options. Math. Comput. Model. 2013, 57, 30–39. [Google Scholar] [CrossRef]
  11. Chiang, C.L. Improved genetic algorithm for power economic dispatch of units with valve-point effects and multiple fuels. IEEE Trans. Power Syst. 2005, 20, 1690–1699. [Google Scholar] [CrossRef]
  12. Amjady, N.; Nasiri-Rad, H. Economic dispatch using an efficient real-coded genetic algorithm. IET Gener. Transm. Distrib. 2009, 3, 266–278. [Google Scholar] [CrossRef]
  13. Pereira-Neto, A.; Unsihuay, C.; Saavedra, O.R. Efficient evolutionary strategy optimisation procedure to solve the nonconvex economic dispatch problem with generator constraints. IEE Proc. Gener. Transm. Distrib. 2005, 152, 653. [Google Scholar] [CrossRef]
  14. dos Santos Coelho, L.; Mariani, V.C. Improved differential evolution algorithms for handling economic dispatch optimization with generator constraints. Energy Convers. Manag. 2007, 48, 1631–1639. [Google Scholar] [CrossRef]
  15. Noman, N.; Iba, H. Differential evolution for economic load dispatch problems. Electr. Power Syst. Res. 2008, 78, 1322–1331. [Google Scholar] [CrossRef]
  16. Balamurugan, R.; Subramanian, S. Hybrid integer coded differential evolution–dynamic programming approach for economic load dispatch with multiple fuel options. Electr. Power Syst. Res. 2008, 78, 1322–1331. [Google Scholar] [CrossRef]
  17. Haroon, S.S.; Hassan, S.; Amin, S.; Sajjad, I.A.; Waqar, A.; Aamir, M.; Alam, I. Multiple fuel machines power economic dispatch using stud differential evolution. Energies 2018, 11, 1393. [Google Scholar]
  18. Park, J.B.; Lee, K.S.; Shin, J.R.; Lee, K.Y. A particle swarm optimization for economic dispatch with nonsmooth cost functions. IEEE Trans. Power Syst. 2005, 20, 34–42. [Google Scholar] [CrossRef]
  19. Meng, K.; Wang, H.G.; Dong, Z.; Wong, K.P. Quantum-inspired particle swarm optimization for valve-point economic load dispatch. IEEE Trans. Power Syst. 2009, 25, 215–222. [Google Scholar] [CrossRef]
  20. Khamsawang, S.; Jiriwibhakorn, S. DSPSO–TSA for economic dispatch problem with nonsmooth and noncontinuous cost functions. Energy Convers. Manag. 2010, 51, 365–375. [Google Scholar] [CrossRef]
  21. Niknam, T.; Mojarrad, H.D.; Meymand, H.Z. Non-smooth economic dispatch computation by fuzzy and self adaptive particle swarm optimization. Appl. Soft Comput. 2011, 11, 2805–2817. [Google Scholar] [CrossRef]
  22. Hosseinnezhad, V.; Babaei, E. Economic load dispatch using θ-PSO. Int. J. Electr. Power Energy Syst. 2013, 49, 160–169. [Google Scholar] [CrossRef]
  23. Basu, M. Modified particle swarm optimization for nonconvex economic dispatch problems. Int. J. Electr. Power Energy Syst. 2015, 69, 304–312. [Google Scholar] [CrossRef]
  24. Panigrahi, B.K.; Yadav, S.R.; Agrawal, S.; Tiwari, M.K. A clonal algorithm to solve economic load dispatch. Electr. Power Syst. Res. 2007, 77, 1381–1389. [Google Scholar] [CrossRef]
  25. Bhattacharya, A.; Chattopadhyay, P.K. Biogeography-based optimization for different economic load dispatch problems. IEEE Trans. Power Syst. 2009, 25, 1064–1077. [Google Scholar] [CrossRef]
  26. Arul, R.; Velusami, S.; Ravi, G. Chaotic firefly algorithm to solve economic load dispatch problems. In Proceedings of the 2013 International Conference on Green Computing, Communication and Conservation of Energy (ICGCE), Chennai, India, 12–14 December 2013; pp. 458–464. [Google Scholar]
  27. Vo, D.N.; Schegner, P.; Ongsakul, W. Cuckoo search algorithm for non-convex economic dispatch. IET Gener. Transm. Distrib. 2013, 7, 645–654. [Google Scholar] [CrossRef]
  28. Nguyen, T.T.; Vo, D.N. Modified cuckoo search algorithm for short-term hydrothermal scheduling. Int. J. Electr. Power Energy Syst. 2015, 65, 271–281. [Google Scholar] [CrossRef]
  29. Nguyen, T.T.; Vo, D.N. The application of one rank cuckoo search algorithm for solving economic load dispatch problems. Appl. Soft Comput. 2015, 37, 763–773. [Google Scholar] [CrossRef]
  30. Chellappan, R.; Kavitha, D. Economic and emission load dispatch using Cuckoo search algorithm. In Proceedings of the 2017 Innovations in Power and Advanced Computing Technologies (i-PACT), Vellore, India, 21–22 April 2017; pp. 1–7. [Google Scholar]
  31. Nguyen, T.T.; Vo, D.N.; Vu Quynh, N.; Van Dai, L. Modified cuckoo search algorithm: A novel method to minimize the fuel cost. Energies 2018, 11, 1328. [Google Scholar] [CrossRef] [Green Version]
  32. Mandal, B.; Roy, P.; Mandal, S. Economic load dispatch using krill herd algorithm. Int. J. Electr. Power Energy Syst. 2014, 57, 1–10. [Google Scholar] [CrossRef]
  33. Bulbul, S.M.A.; Pradhan, M.; Roy, P.; Pal, T. Opposition-based krill herd algorithm applied to economic load dispatch problem. Ain Shams Eng. J. 2018, 9, 423–440. [Google Scholar] [CrossRef] [Green Version]
  34. Fard, A.K.; Zadeh, M.R.A.; Dehghan, B.; Fard, F.K. A novel sufficient bio-inspired optimisation method based on modified krill herd algorithm to solve the economic load dispatch. Int. J. Bio-Inspired Comput. 2014, 6, 416. [Google Scholar] [CrossRef]
  35. Subramanian, R.; Thanushkodi, K.; Prakash, A. An efficient meta heuristic algorithm to solve economic load dispatch problems. Iran. J. Electr. Electron. Eng. 2013, 9, 246–252. [Google Scholar]
  36. Moustafa, F.S.; El-Rafei, A.; Badra, N.M.; Abdelaziz, A.Y. Application and performance comparison of variants of the firefly algorithm to the economic load dispatch problem. In Proceedings of the 2017 Third International Conference on Advances in Electrical, Electronics, Information, Communication and Bio-Informatics (AEEICB), Chawla, NV, USA, 27 February 2017; pp. 147–151. [Google Scholar]
  37. Nguyen, T.T.; Quynh, N.V.; Van Dai, L. Improved firefly algorithm: A novel method for optimal operation of thermal generating units. Complexity 2018, 2018. [Google Scholar] [CrossRef] [Green Version]
  38. Thang, N.T.; Phuong, N.D.; Thanh, V.P.; Hien, C.T. An Effectively Modified Firefly Algorithm for Economic Load Dispatch Problem. TELKOMNIKA 2018, 16, 2436–2443. [Google Scholar] [CrossRef]
  39. Aragón, V.S.; Esquivel, S.C.; Coello, C.C. An immune algorithm with power redistribution for solving economic dispatch problems. Inf. Sci. 2015, 295, 609–632. [Google Scholar] [CrossRef]
  40. Kamboj, V.K.; Bath, S.K.; Dhillon, J.S. Solution of non-convex economic load dispatch problem using Grey Wolf Optimizer. Neural Comput. Appl. 2016, 27, 1301–1316. [Google Scholar] [CrossRef]
  41. Adarsh, B.R.; Raghunathan, T.; Jayabarathi, T.; Yang, X.S. Economic dispatch using chaotic bat algorithm. Energy 2016, 96, 666–675. [Google Scholar] [CrossRef]
  42. Ghorbani, N.; Babaei, E. Exchange market algorithm for economic load dispatch. Int. J. Electr. Power Energy Syst. 2016, 75, 19–27. [Google Scholar] [CrossRef]
  43. Nischal, M.M.; Mehta, S. Optimal load dispatch using ant lion optimization. Int. J. Eng. Res. Appl. 2015, 5, 10–19. [Google Scholar]
  44. Kamboj, V.K.; Bhadoria, A.; Bath, S.K. Solution of non-convex economic load dispatch problem for small-scale power systems using ant lion optimizer. Neural Comput. Appl. 2016, 28, 2181–2192. [Google Scholar] [CrossRef]
  45. Dhiman, G.; Guo, S.; Kaur, S. ED-SHO: A framework for solving nonlinear economic load power dispatch problem using spotted hyena optimizer. Mod. Phys. Lett. A 2018, 33, 1850239. [Google Scholar] [CrossRef]
  46. Subhashini, K.; Satapathy, J. Development of an Enhanced Ant Lion Optimization Algorithm and its Application in Antenna Array Synthesis. Appl. Soft Comput. 2017, 59, 153–173. [Google Scholar] [CrossRef]
  47. Rajan, A.; Jeevan, K.; Malakar, T. Weighted elitism based Ant Lion Optimizer to solve optimum VAr planning problem. Appl. Soft Comput. 2017, 55, 352–370. [Google Scholar] [CrossRef]
  48. Dinkar, S.K.; Deep, K. An efficient opposition based Lévy Flight Antlion optimizer for optimization problems. J. Comput. Sci. 2018, 29, 119–141. [Google Scholar] [CrossRef]
  49. Kılıç, H.; Yuzgec, U. Tournament selection based antlion optimization algorithm for solving quadratic assignment problem. Eng. Sci. Technol. Int. J. 2019, 22, 673–691. [Google Scholar] [CrossRef]
  50. Kilic, H.; Yuzgec, U.; Karakuzu, C. A novel improved antlion optimizer algorithm and its comparative performance. Neural Comput. Appl. 2018, 32, 3803–3824. [Google Scholar] [CrossRef]
  51. Nguyen, T.T.; Vo, D.N.; Truong, A.V.; Dieu, V.N. Cuckoo search algorithm for short-term hydrothermal scheduling. Appl. Energy 2014, 132, 276–287. [Google Scholar] [CrossRef]
Figure 1. Antlion optimization (ALO) algorithm for solving a general optimization problem.
Applsci 10 03507 g001
Figure 2. The search process of the best run of the ALO and improved antlion optimization algorithm (IALO) for the system with 10 units, multi fuels, and a 2700 MW load.
Applsci 10 03507 g002
Figure 3. The search process of the best run of the ALO and IALO for the system with 10 units, multi fuels (MFs), valve point effects (VPEs), and a 2700 MW load.
Applsci 10 03507 g003
Figure 4. The search process of the best run of the ALO and IALO for the system with 20 units, single fuel, power loss, and a 2500 MW load.
Applsci 10 03507 g004
Figure 5. The search process of the best run of the ALO and IALO for the system with 90 units, POZ, and a 15,900 MW load.
Applsci 10 03507 g005
Figure 6. The search process of the best run of the ALO and IALO for the system with 80 units, MFs, VPEs, and a 21,600 MW load.
Applsci 10 03507 g006
Figure 7. Fitness of 100 runs from the ALO and IALO for the system with 10 units, multi fuels, and a 2700 MW load.
Applsci 10 03507 g007
Figure 8. Fitness of 100 runs from the ALO and IALO for the system with 10 units, MFs, VPEs, and a 2700 MW load.
Applsci 10 03507 g008
Figure 9. Fitness of 100 runs from the ALO and IALO for the system with 20 units, single fuel, power loss, and a 2500 MW load.
Applsci 10 03507 g009
Figure 10. Fitness of 100 runs from the ALO and IALO for the system with 90 units, POZ, and a 15,900 MW load.
Applsci 10 03507 g010
Figure 11. Fitness of 100 runs from the ALO and IALO for the system with 80 units, multi fuels, vale effects, and a 21,600 MW load.
Applsci 10 03507 g011
Table 1. Comparison of the best fuel cost ($/h) of case 1 of the 10-unit system.
MethodBest Cost ($/h)/Power Load (MW)NpGmaxNfes
2400 (MW)2500 (MW)2600 (MW)2700 (MW)
HDE-DP [16]481.7226526.2388574.3808623.8092202004000
AISA [24]481.7230526.2004574.381623.8090--3000
CSA [27]481.7270526.2522574.4100623.8343102002000
RCSA [29]481.7227526.2392574.3813623.8096102002000
SDE [17]481.7226526.2388574.3808623.809210020020,000
EALHN [9]481.7230526.2390574.3810623.8090---
ALO485.0665528.0273579.7788625.87321550750
IALO481.7230526.2391574.3814623.80921550750
Table 2. The comparison of results for case 2 of the 10-unit system.
MethodBest Cost ($/h)Mean Cost ($/h)Worst Cost ($/h)StdCPU (s)NpGmaxNfesic (%)
PSO [18]624.3045624.5054625.9252----30000.075
FOA [37]664.5306675.5344679.4260----20006.124
IFOA [37]623.8768625.2704629.2765----10000.007
CSA [27]623.8684623.9495626.36660.24381.581050010,0000.005
RCSA [29]623.8608623.8963623.93530.01541.541210024000.004
ALO623.9214626.0822643.82313.87312.83314020080000.014
IALO623.8347623.9930626.44340.42320.8992402008000
Table 3. The comparison of results for case 3 of the 10-unit system.
MethodBest Cost ($/h)Mean Cost ($/h)Worst Cost ($/h)Nfesic (%)
RCGA [12]624.6605625.9201628.925330000.0481
NRCGA [12]624.3550624.5792624.75413000−0.001
FOA [37]673.5544685.2872699.285560007.304
IFOA [37]624.4951625.2647629.395130000.022
ALO624.3891624.3894624.389430000.005
IALO624.3735626.0487630.51043000
Table 4. The comparison of results for a 20-unit system.
MethodBest Cost ($/h)Mean Cost ($/h)Worst Cost ($/h)StdCPU (s)NpGmaxNfesic (%)
IA [39]62,466.804462,528.987062,487.510912.0381.935-20,0000.016
RCSA [29]62,456.633162,456.633162,456.633200.311050010,0000.000
CBOA [41]62,456.6328----4030012,0000.000
SHO [45]62,456.6331----1001000100,0000.000
ALO62,456.664762,457.834562,461.83821.14327.403030090000.000
IALO62,456.633162,456.634162,456.64420.00190.30301504500
Table 5. The comparison of results for an 80-unit system.
MethodBest Cost ($/h)Mean Cost ($/h)Worst Cost ($/h)StdCPU (s)NpGmaxNfesic (%)
CSA [29]4992.68534993.73075003.42941.093118.2500125500132,0000.010
RCSA [29]4992.42154994.49874995.67170.493915.2400125500132,0000.005
ALO5001.88715028.81845053.124211.96682407.3740200080,0000.194
IALO4992.17125004.86515018.60198.3978614.462540200080,000
Table 6. The selected control parameters for methods solving systems with prohibited operating zone (POZ) constraints.
MethodUnitNpGmaxNfes
ALO and IALO1540502000
304050020,000
6040200080,000
90404000160,000
CSA and RCSA151250012,000
3012200048,000
6012250060,000
9012300072,000
Table 7. The comparison of results for systems with POZ constraints.
MethodBest Cost ($/h)
15306090
CSA [29]32,544.970465,084.9949130,170.3949195,258.7847
RCSA [29]32,542.559365,084.9161130,169.9367195,255.9077
ALO32,684.005865,209.0115130,316.2964195,540.6541
IALO32,544.970465,084.9977130,169.8555195,254.8220
Table 8. The comparison of the suggested method and the ALO method.
Studied CasesMethodBest Cost ($/h)Nfesic (%)
10-unit system with multi-fuel options for a 2400 MW loadALO482.289210000.117
IALO481.72291000
10-unit system with multi-fuel options for a 2500 MW loadALO526.913010000.128
IALO526.23901000
10-unit system with multi-fuel options for a 2600 MW loadALO574.578210000.032
IALO574.39171000
10-unit system with multi-fuel options for a 2700 MW loadALO625.837310000.324
IALO623.80961000
10-unit system with multi-fuel options and vale point loading effects
for a 2700 MW load
ALO623.907980000.012
SIALO623.83478000
10-unit system with multi fuels, vale effects, and complexity constraints
for a 2700 MW load
ALO624.617030000.039
IALO624.37473000
20-unit system considering transmission loses for a 2500 MW loadALO62,456.664790000.0001
IALO62,456.63314500
15-units with POZ for a 2650 MW loadALO32,684.005720000.425
IALO32,544.97042000
30-units with POZ for a 5300 MW loadALO65,209.011420,0000.190
IALO65,084.997620,000
60-units with POZ for a 10,600 MW loadALO130,316.296480,0000.112
IALO130,169.855580,000
90-units with POZ for a 15,900 MW loadALO195,540.6541160,0000.146
IALO195,254.8220160,000
80-unit system with multi fuels and vale effects for a 21,600 MW loadALO5001.887180,0000.194
IALO4992.171280,000

