Article

Reliability Analysis of an Air Traffic Network: From Network Structure to Transport Function

1
College of Air Traffic Management, Civil Aviation University of China, Tianjin 300300, China
2
School of Aeronautics, Northwestern Polytechnical University, Xi’an 710072, China
3
Department of Computer Science, Middlesex University, London NW4 4BE, UK
*
Author to whom correspondence should be addressed.
Appl. Sci. 2020, 10(9), 3168; https://doi.org/10.3390/app10093168
Submission received: 27 March 2020 / Revised: 20 April 2020 / Accepted: 29 April 2020 / Published: 1 May 2020
(This article belongs to the Special Issue Soft Computing in Applied Sciences and Industrial Applications)

Abstract

:
To scientifically evaluate the reliability of air traffic networks, a definition of air traffic network reliability is proposed in this paper. Calculation models of the connectivity reliability, travel-time reliability, and capacity reliability of the air traffic network are constructed based on collected historical data, considering the current status and the predicted future evolution trends. Considering the randomness and fuzziness of factors affecting reliability, a comprehensive evaluation model of air traffic networks based on the uncertainty transformation model is established. Finally, the reliability of the US air traffic network is analyzed based on data published by the Transportation Statistics Bureau of the US Department of Transportation. The results show that the connectivity reliability is 0.4073, the capacity reliability is 0.8300, the travel-time reliability is 0.9180, and the overall reliability evaluated is “relatively reliable”. This indicates that although the US structural reliability is relatively low, the US air traffic management is very efficient, and the overall reliability is strong. The reliability in nonpeak hours is much higher than that in peak hours. The method can identify air traffic network reliability efficiently. The main factors affecting reliability can be found in the calculation process, and are beneficial for air traffic planning and management. The empirical analysis also reflects that the evaluation model based on the uncertainty transformation model can transform the quantitative data of network structure and traffic function into the qualitative language of reliability.

1. Introduction

Reliability is an important feature of complex systems. Many scholars have studied the reliability of different systems [1,2,3,4,5,6,7,8,9], such as composite materials [10], communication systems [11], and power systems [12]. In the field of civil aviation, there are a few studies on reliability, mainly focusing on controllers’ reliability and equipment reliability. Wang S J et al. propose an improved triangle whitening weight function and use it to measure the reliability of air traffic controllers [13]. Liu J X synthesizes the Delphi and success likelihood index methods to analyze the human error probability in flight conflict resolution [14]. Yuan L P and Zhang X J propose a method of determining the maximum influence value of the controller’s error based on Delphi and Bayesian networks and calculate the human error probability of flight conflict resolution [15]. Kirwan B et al. determine human error probabilities by analyzing the results of a real-time simulation involving air traffic controllers (ATCOs) and pilots, with a focus on communication errors [16]. They also analyze air traffic safety from the aspect of air traffic controller behavior and develop a human reliability assessment tool for air traffic safety management [17]. Xu X H et al. apply a Markov chain model to predict and verify different states of ATC automation software [18]. Zhang Y W studies the influence of the equipment operation environment and internal and external risk factors on the reliability of air traffic control equipment based on a Bayesian network [19]. To date, the study of the reliability of transport networks has focused on road transport networks [20,21,22,23,24,25]. Such studies mainly evaluate the reliability of the networks from the perspectives of connectivity reliability, travel-time reliability, and capacity reliability. By contrast, little research has been conducted on the reliability of air traffic networks.
With the rapid development of the aviation industry, air traffic is becoming increasingly complex, resulting in a significant decline in system stability. Low reliability seriously threatens operational safety and transportation efficiency. At present, most research on air traffic planning and management assumes that the flight time of a route is a fixed value without considering the influence of stochastic factors on the air traffic system [26]. In fact, due to the high uncertainty of the air traffic system, flight time and other air traffic indicators are continuously changing, seriously affecting the reliability of air traffic operation and transportation efficiency. Therefore, the reliability analysis of air traffic systems is a key problem to be solved. It is meaningful to apply the general research idea of the reliability of road transport networks to the reliability of air transport networks. Because of the differences between air traffic operation and road traffic operation, it is not reasonable to calculate the connectivity reliability, the travel-time reliability, and the capacity reliability using the calculation methods proposed in the available literature. For example, an aircraft seldom changes its flight path randomly. If there is a traffic jam in a flight segment, the flights generally implement a ground delay program or air-holding policy. Thus, we cannot calculate the capacity reliability based on dynamic traffic assignment.
There are two main tasks in our study. The first task is to calculate reliability indexes. From the perspective of a complex system, the structure is the internal composition of the system, reflecting the integrity of the system from the inside; the function is the external behavior of the system, reflecting the integrity of the system from the outside. Thus, it is reasonable to establish reliability indexes based on the structure and function of the air traffic network. In this work, we propose three indexes, i.e., connectivity reliability, travel-time reliability, and capacity reliability. To the best of our knowledge, they are first proposed for the air traffic field.
The second task is to comprehensively evaluate the reliability of the air traffic network based on the reliability indexes. Considering that human thinking is characterized by fuzziness, air traffic managers are primarily concerned about whether reliability is high. When the network reliability is evaluated comprehensively, it is necessary to convert quantitative reliability into qualitative reliability. Thus, the reliability evaluation of the air traffic network is fuzzy. Because of the complexity and uncertainty of air traffic operation, the reliability evaluation is also stochastic. There are many comprehensive evaluation methods, such as neural networks and fuzzy comprehensive methods. Although these measure fuzziness, they do not take randomness into account, and the determination of index weights is subjective. The reliability of the air traffic network is a combination of fuzziness and randomness. The uncertainty transformation model was presented by Prof Deyi Li based on traditional fuzzy set theory and probability statistics [27]. The fuzzy set and uncertainty transformation model have been widely used in data mining and evaluation of the effectiveness of complicated systems [28,29,30,31,32,33,34]. We introduce the uncertainty transformation model into the reliability evaluation method to achieve a balance between quality and quantity.
The remainder of this paper is organized as follows: Section 2 presents the definition of the reliability of the air traffic network. In Section 3, the reliability measurement of the air traffic network is presented, including the modeling of the air traffic network, the measurement of connection reliability, travel-time reliability, and capacity reliability, and the comprehensive evaluation of the reliability of the air traffic network based on the uncertainty transformation model. The empirical analysis of the reliability of the US air traffic network is given in Section 4. Finally, conclusions are presented in Section 5.

2. Definition of Reliability of the Air Traffic Network

Currently, there is no general definition of air traffic reliability [35,36,37,38]. Based on the characteristic analysis of air traffic, we propose a definition of air traffic reliability, that is, the ability of the air traffic network to continuously satisfy the air traffic demand under the influence of random factors on air traffic operation within a certain period of time [37]. This ability is derived from structural reliability and functional reliability. The structural reliability can be measured by the network connectivity. The functional reliability can be characterized by the balance of air traffic capacity and demand and flight punctuality. Therefore, the reliability of the air traffic network includes connectivity reliability, travel-time reliability, and capacity reliability.
The connectivity reliability of the air traffic network (CORN) reflects the interconnection of airports from the perspective of complex networks. In complex network theory, the distance between two points is the number of edges passing from one point to the other point. A short distance between two airports means less flight transfer times and strong connectivity reliability. If airport A is isolated in the airport network, the distance between airport A and any other airport is infinite. Thus, the connectivity reliability of airport A is low.
The travel-time reliability of the air traffic network (TTRN) is used to describe the time-varying characteristics of flight time. The larger the number of punctual flights, the more reliable the air traffic network. The TTRN is useful for formulating flight schedules.
The capacity reliability of the air traffic network (CARN) describes the ability of the air traffic network to accommodate a certain traffic demand at a certain service level. Under different service levels, the capacity reliability of the network is different. The CARN is the basis of forming air traffic congestion management strategies.

3. Reliability Measurement of the Air Traffic Network

An air traffic system is a complex system. Influenced by human, equipment, and environmental factors, the reliability of air traffic networks is constantly changing. This requires us to evaluate the reliability from a dynamic perspective. As far as we know, to date, research on traffic reliability has been carried out only from a static perspective. This work is the first to evaluate traffic reliability from a dynamic perspective. Thus, we have to study air traffic reliability not only from the perspective of the current static reliability but also from the perspective of future dynamic reliability. We construct the calculation models of the CORN, TTRN, and CARN considering both the current reliability and its future evolution trends.

3.1. Modeling of the Air Traffic Network

An air traffic network consists of airports as nodes and air routes as edges. The network structure is shown in Figure 1. Airports A and B are directly connected by route AB, indicating that there are direct flights between airports A and B. Airports B and C can be directly connected by route BC or indirectly connected by BE and EC. There are no direct routes between A and D.
The topological structure of the air traffic network can be expressed as G = ( V G , E G , ϕ G ) , where the airport set is V G = { v 1 , v 2 , , v i , , v n } , the air route set is E G = { e 1 , e 2 , , e i , , e n } , and ϕ G represents the association functions of node sets and edge sets.

3.2. Measurement of the CORN, TTRN, and CARN

(1) Modeling of the CORN
In this paper, network efficiency is introduced to measure the CORN of an air traffic network. The network efficiency is the average value of the connectivity efficiency between all pairs of airports, which is expressed as Equation (1):
E = 1 N ( N 1 ) i j G ε i j
where N represents the total number of airports. The network is completely connected when E = 1 , and the connectivity of the network is the worst when E = 0 . Therefore, the value of E is 0 E 1 . ε i j is the connectivity efficiency between airports i and j . It can be calculated by the shortest path d i j between i and j . d i j can be calculated by the Floyd algorithm [39]. The algorithm starts from any one-sided path. The distance between any two points is the weight of the edge. When i and j are disconnected, d i j tends toward infinity and ε i j = 0 .
ε i j = 1 d i j
Though the network efficiency represents the network connectivity, it does not include the impact of connectivity differences on the CORN evolution. To characterize the influences of connectivity difference on the CORN in the future, we introduce a correction coefficient δ c o n :
δ c o n = 1 σ c o n μ c o n
where σ c o n and μ c o n represent the standard deviation and the mean value of ε i j , respectively. σ c o n / μ c o n denotes the degree of discreteness of connectivity reliability. When the connectivity difference is very large, there are some routes with much higher connectivity efficiency than other routes, and airlines will like to put more flights on these routes. Air traffic congestion may easily occur on the routes, and the network reliability will be reduced quickly.
Thus, the CORN of the air traffic network can be calculated as follows:
R c o n = δ c o n E = ( 1 σ c o n μ c o n ) × μ c o n = μ c o n σ c o n = E σ c o n
(2) Modeling of the TTRN
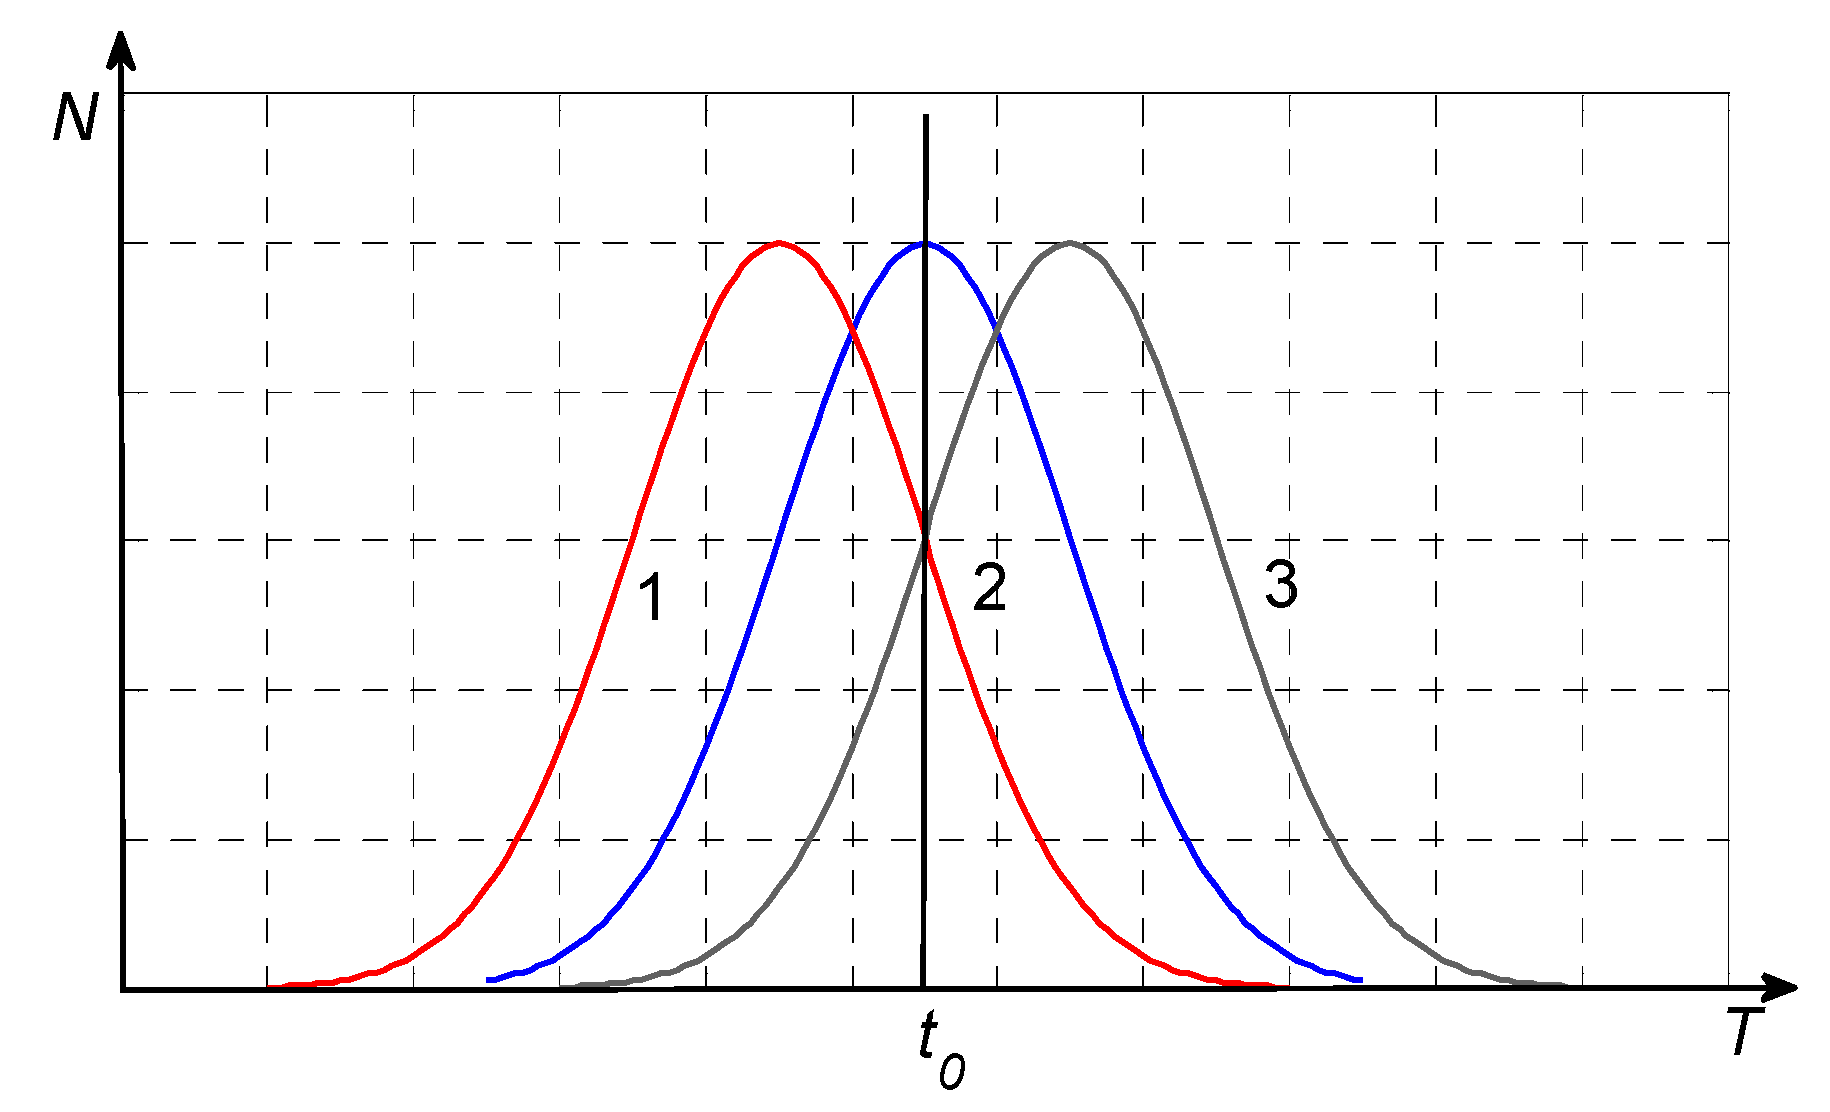
In air traffic operation, the flight time T of an individual route always changes in the external environment. The less the flight delay, the higher the travel-time reliability. A large number of historical data show that flight time obeys a normal distribution, as shown in Figure 2.
t 0 represents the expected flight time. The average flight time of curve 1 is less than t 0 , indicating that the flight time reliability is higher than the expected level. In contrast, the flight time reliability of curve 3 is lower than the expected level. The travel-time reliability V of an air route can be measured by the flight delay, as follows:
V = 1 n i N c i , c i = { 1 ( T i t i ) 1 k T i t i t i ( t i < T i 1 + k k t i ) 0 ( T i > 1 + k k t i )
where n represents the flight volume, c i is the non-delay rate of flight i , T i is the average actual flight time of flight i ( i [ 0 , N ] ) , t i is the estimated flight time of flight i ( i [ 0 , N ] ) , and k is the correction coefficient, which is used to ensure that the reliability is in [0, 1]. When flight i is not delayed, c i equals 1. Generally, when the actual flight delay is greater than half of the estimated flight time, the actual flight delay is not acceptable to potential passengers. Thus, the value of k in this paper is 2; that is, when T i > k + 1 k t i = 3 2 t i , the value of c i is 0.
To characterize the influence of the travel-time reliability difference on the TTRN in the future, a correction coefficient δ t r a is introduced:
δ t r a = 1 σ t r a μ t r a
where σ t r a and μ t r a represent the standard deviation and the mean value of V for all of the routes. σ t r a / μ t r a denotes the degree of discreteness of non-delay rate. When there are large gaps between the non-delay rate of different air routes, airlines would like to put more flights on the routes with a higher non-delay rate. Air traffic congestion may easily occur on these routes, and the overall reliability of the network will be reduced.
Thus, the TTRN of the air traffic network can be calculated as follows:
R t r a = δ t r a 1 l l L V l = ( 1 σ t r a μ t r a ) × μ t r a = μ t r a σ t r a
where L represents the number of routes.
(3) Modeling of the CARN
The CARN can be described by the probability that the air traffic capacity is greater than demand at a certain service level. We quantify the unreliability of any airport by the following formula:
f = i N A i i N c i ,   A i = { 0 ( q i c i ) q i c i ( q i > c i )
where f represents the capacity unreliability of one airport; A i is the residual value of demand minus capacity at the ith time interval; and q i and c i are the airport demand and capacity at the ith time interval, respectively.
There is no consideration of service level in the calculation of f . The airport service level can be measured by the delay of departing flights. Departing flights with delays of more than 15 minutes are considered delayed flights. The capacity reliability of one airport at a certain service level can be calculated as follows:
P = ( 1 f ) ( 1 i N d i q i N )
where d i and q i are the number of delayed flights and air traffic demand at the ith time interval, respectively.
To characterize the influence of the airport capacity reliability difference on the CARN in the future, a correction coefficient δ c a p is introduced:
δ c a p = 1 σ c a p μ c a p
where σ c a p and μ c a p represent the standard deviation and the mean value of P , respectively. σ c a p / μ c a p denotes the dispersion degree of P . When there are large gaps between the capacity reliability of different airports, more flights will be distributed to the airports with higher capacity reliability. Air traffic congestion may occur in those airports and the CARN of the air traffic network will be reduced.
Thus, the network CARN for a certain service level can be calculated as follows:
R c a p = δ c a p 1 m j M P j = ( 1 σ c a p μ c a p ) × μ c a p = μ c a p σ c a p
where m is the number of airports and P j is the capacity reliability of airport j .

3.3. Comprehensive Evaluation of Air Traffic Network Reliability Based on the Uncertainty Transformation Model

Transform the quantitative data of CORN, TTRN, and CARN into the qualitative language of network reliability is an important problem. The uncertainty transformation model is an effective tool in uncertainty transformation between qualitative concepts and quantitative expression. It reflects both uncertainty and fuzziness of human thinking.

3.3.1. Description of Uncertainty Transformation Model

a. Concept of an uncertainty transformation model
The uncertainty transformation model can realize the transformation between qualitative and quantitative values [40].
Suppose U is a quantitative numerical universe of discourse, and T is a linguistic term associated with U . If x U is a random implementation of concept T and μ ( x ) [ 0 , 1 ] stands for the certainty degree of x belonging to T , then the distribution of x in the universe of discourse U is called a fuzzy set, and each x is called a fuzzy set drop.
μ : U [ 0 , 1 ] x U x μ ( x )
According to the above descriptions, the random implementation is in terms of probability. The certainty degree is the degree of membership in a fuzzy set according to the probability distribution. Therefore, the uncertainty transformation model shows the correlation of randomness and fuzziness.
b. Characteristics of the uncertainty transformation model
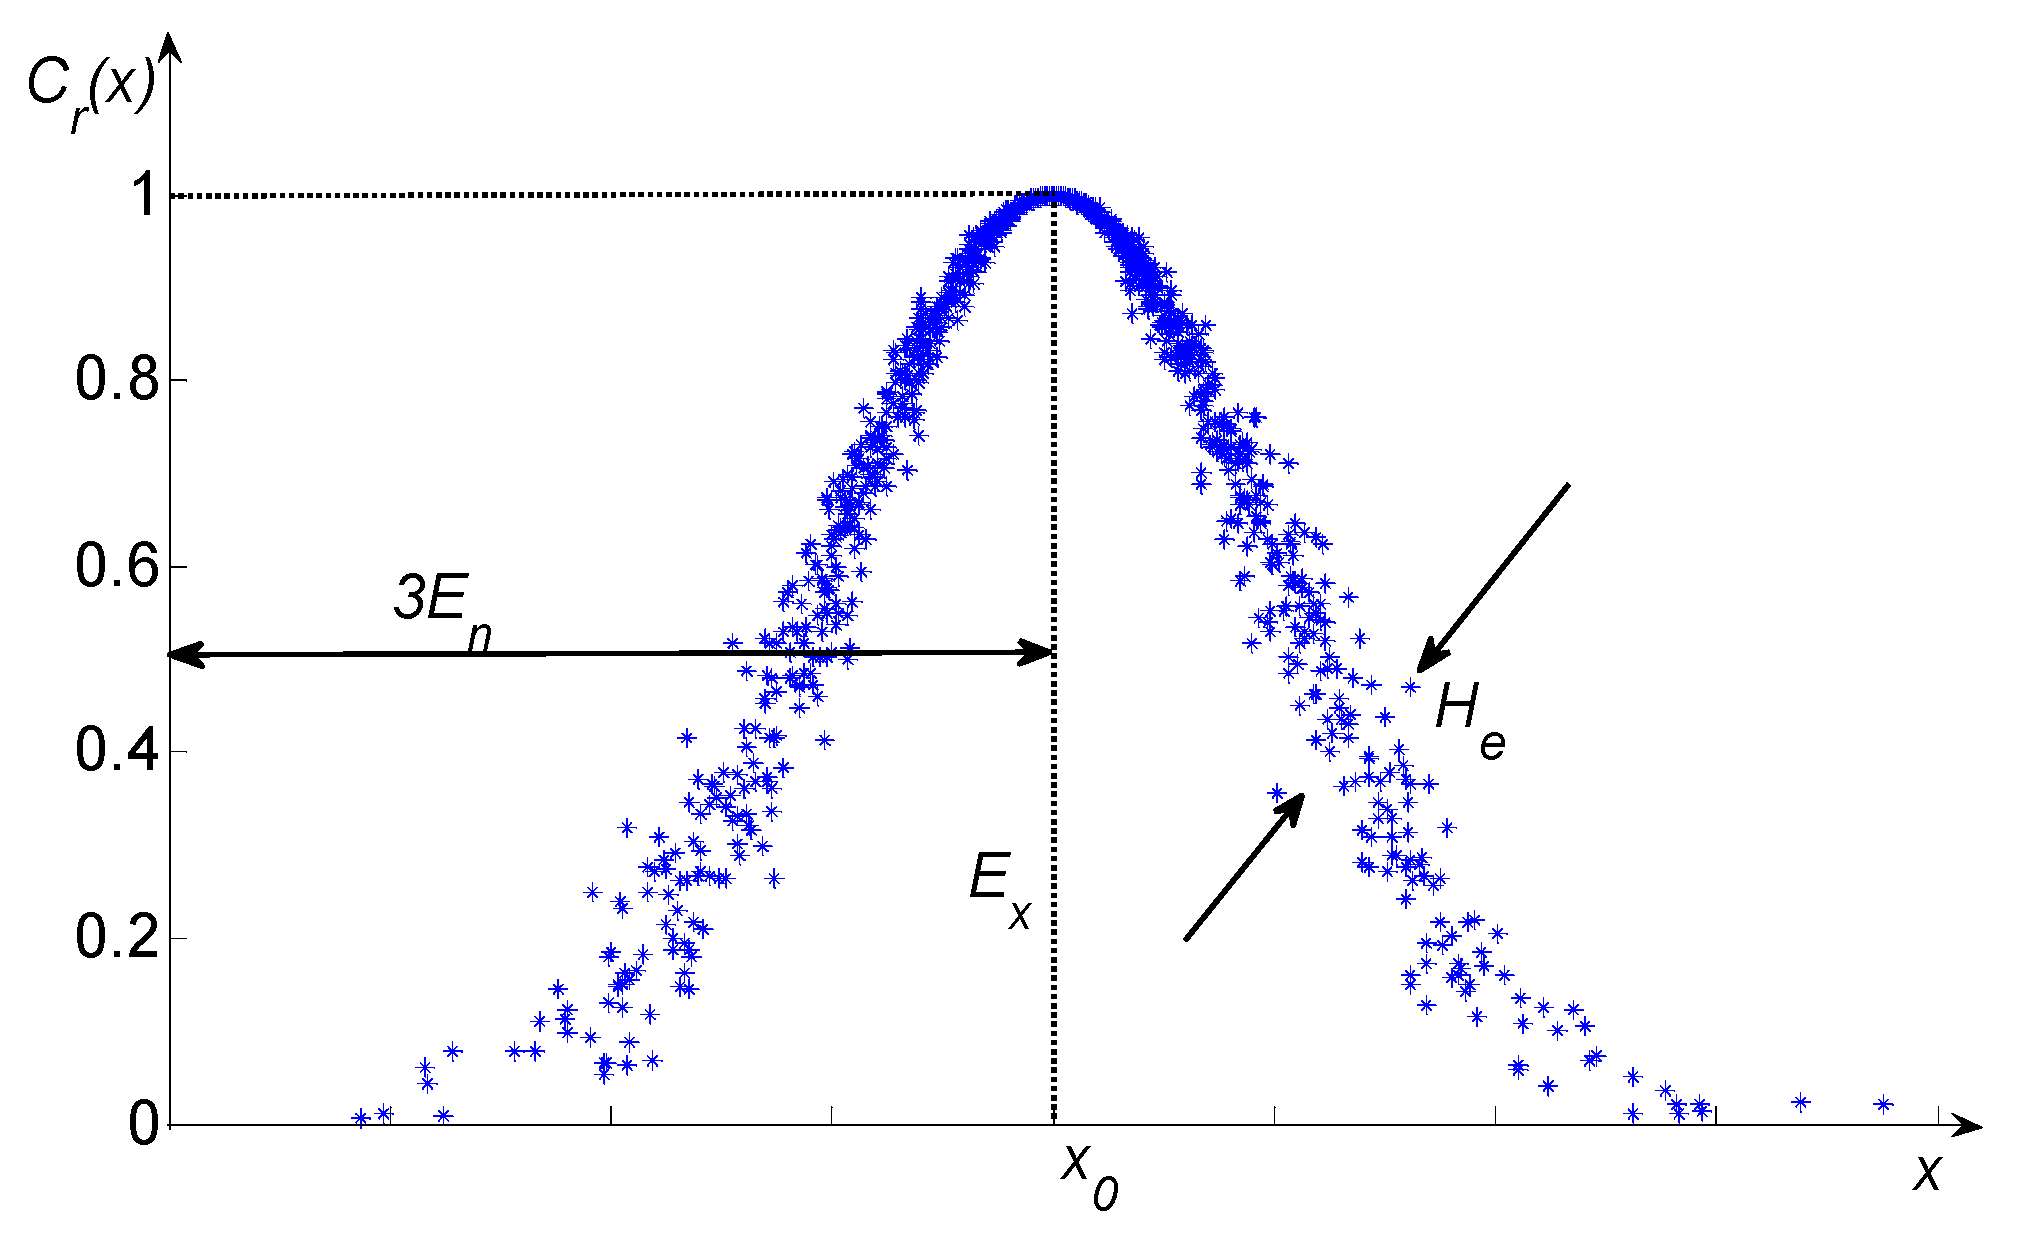
Expectation E x , entropy E n , and super-entropy H e are the three digital characteristics describing fuzzy sets, as shown in Figure 3. C r ( x ) is the membership degree. The three characteristics express the quantity feature of a qualitative concept. E x is the center value of the concept in the theory field, and it is the most representative of the qualitative concept. E n is the uncertainty measurement of the qualitative concept, which is determined by both the randomness and fuzziness of the concept. H e is the uncertainty measurement of E n , which is determined by both the randomness and fuzziness of E n . Therefore, the fuzziness and randomness are completely combined by the three characteristics of the uncertainty transformation models, which constitute the mapping between quality and quantity as the foundation of knowledge expression.
c. Algorithms in uncertainty transformation model
The normal and converse generators are the most important algorithms in the uncertainty transformation model. The normal generator is used to convert qualitative language to a quantitative value, while the converse generator does the opposite [41]. Next, we will introduce the two algorithms.
(1) The normal generator
The fuzzy set can be generated by the set’s digital characters ( E x , E n , H e ), and its mathematic expectation curve (MEC) is:
M E C A ( x ) = exp [ ( x E x ) 2 / ( 2 E n ) 2 ]
The generating algorithm of the fuzzy set is as follows:
Input: digital character ( E x , E n , H e ), the number of samples n .
Output: d r o p ( x i , μ i ) , i = 1 , 2 , , n .
(1)
Generate a normal random number E n i = N O R M ( E n , H e 2 ) with expected value E n and variance H e 2 .
(2)
Generate a normal random number E n i = N O R M ( E x , E n i 2 ) with expected value E x and variance E n i 2 .
(3)
Compute μ i = e ( x i E x ) 2 2 E n i 2 , where ( x i , μ i ) is a sample.
(4)
Repeat steps (1) to (3) until enough sample drops are generated.
(2) The converse generator
Input: sample points x i , i = 1 , 2 , , n
Output: set characteristics E x , E n , H e
(1)
Calculate the expectation of the samples, x ¯ = 1 N i = 1 N x i , center distance of the samples, B = 1 N i = 1 N | x i x ¯ | , and sample variance, S 2 = 1 N 1 i = 1 N ( x i x ¯ ) 2 .
(2)
Let E x = x ¯
(3)
Let E n = ( π 2 ) 1 2 × B
(4)
Let H e = ( S 2 E n 2 ) 1 2 .
Suppose there are two sets C 1 ( E x 1 , E n 1 , H e 1 ) and C 2 ( E x 2 , E n 2 , H e 2 ) ; the rules used by the algorithm for these sets is shown in Table 1.

3.3.2. Reliability Evaluation of the Air Traffic Network Based on the Uncertainty Transformation Model

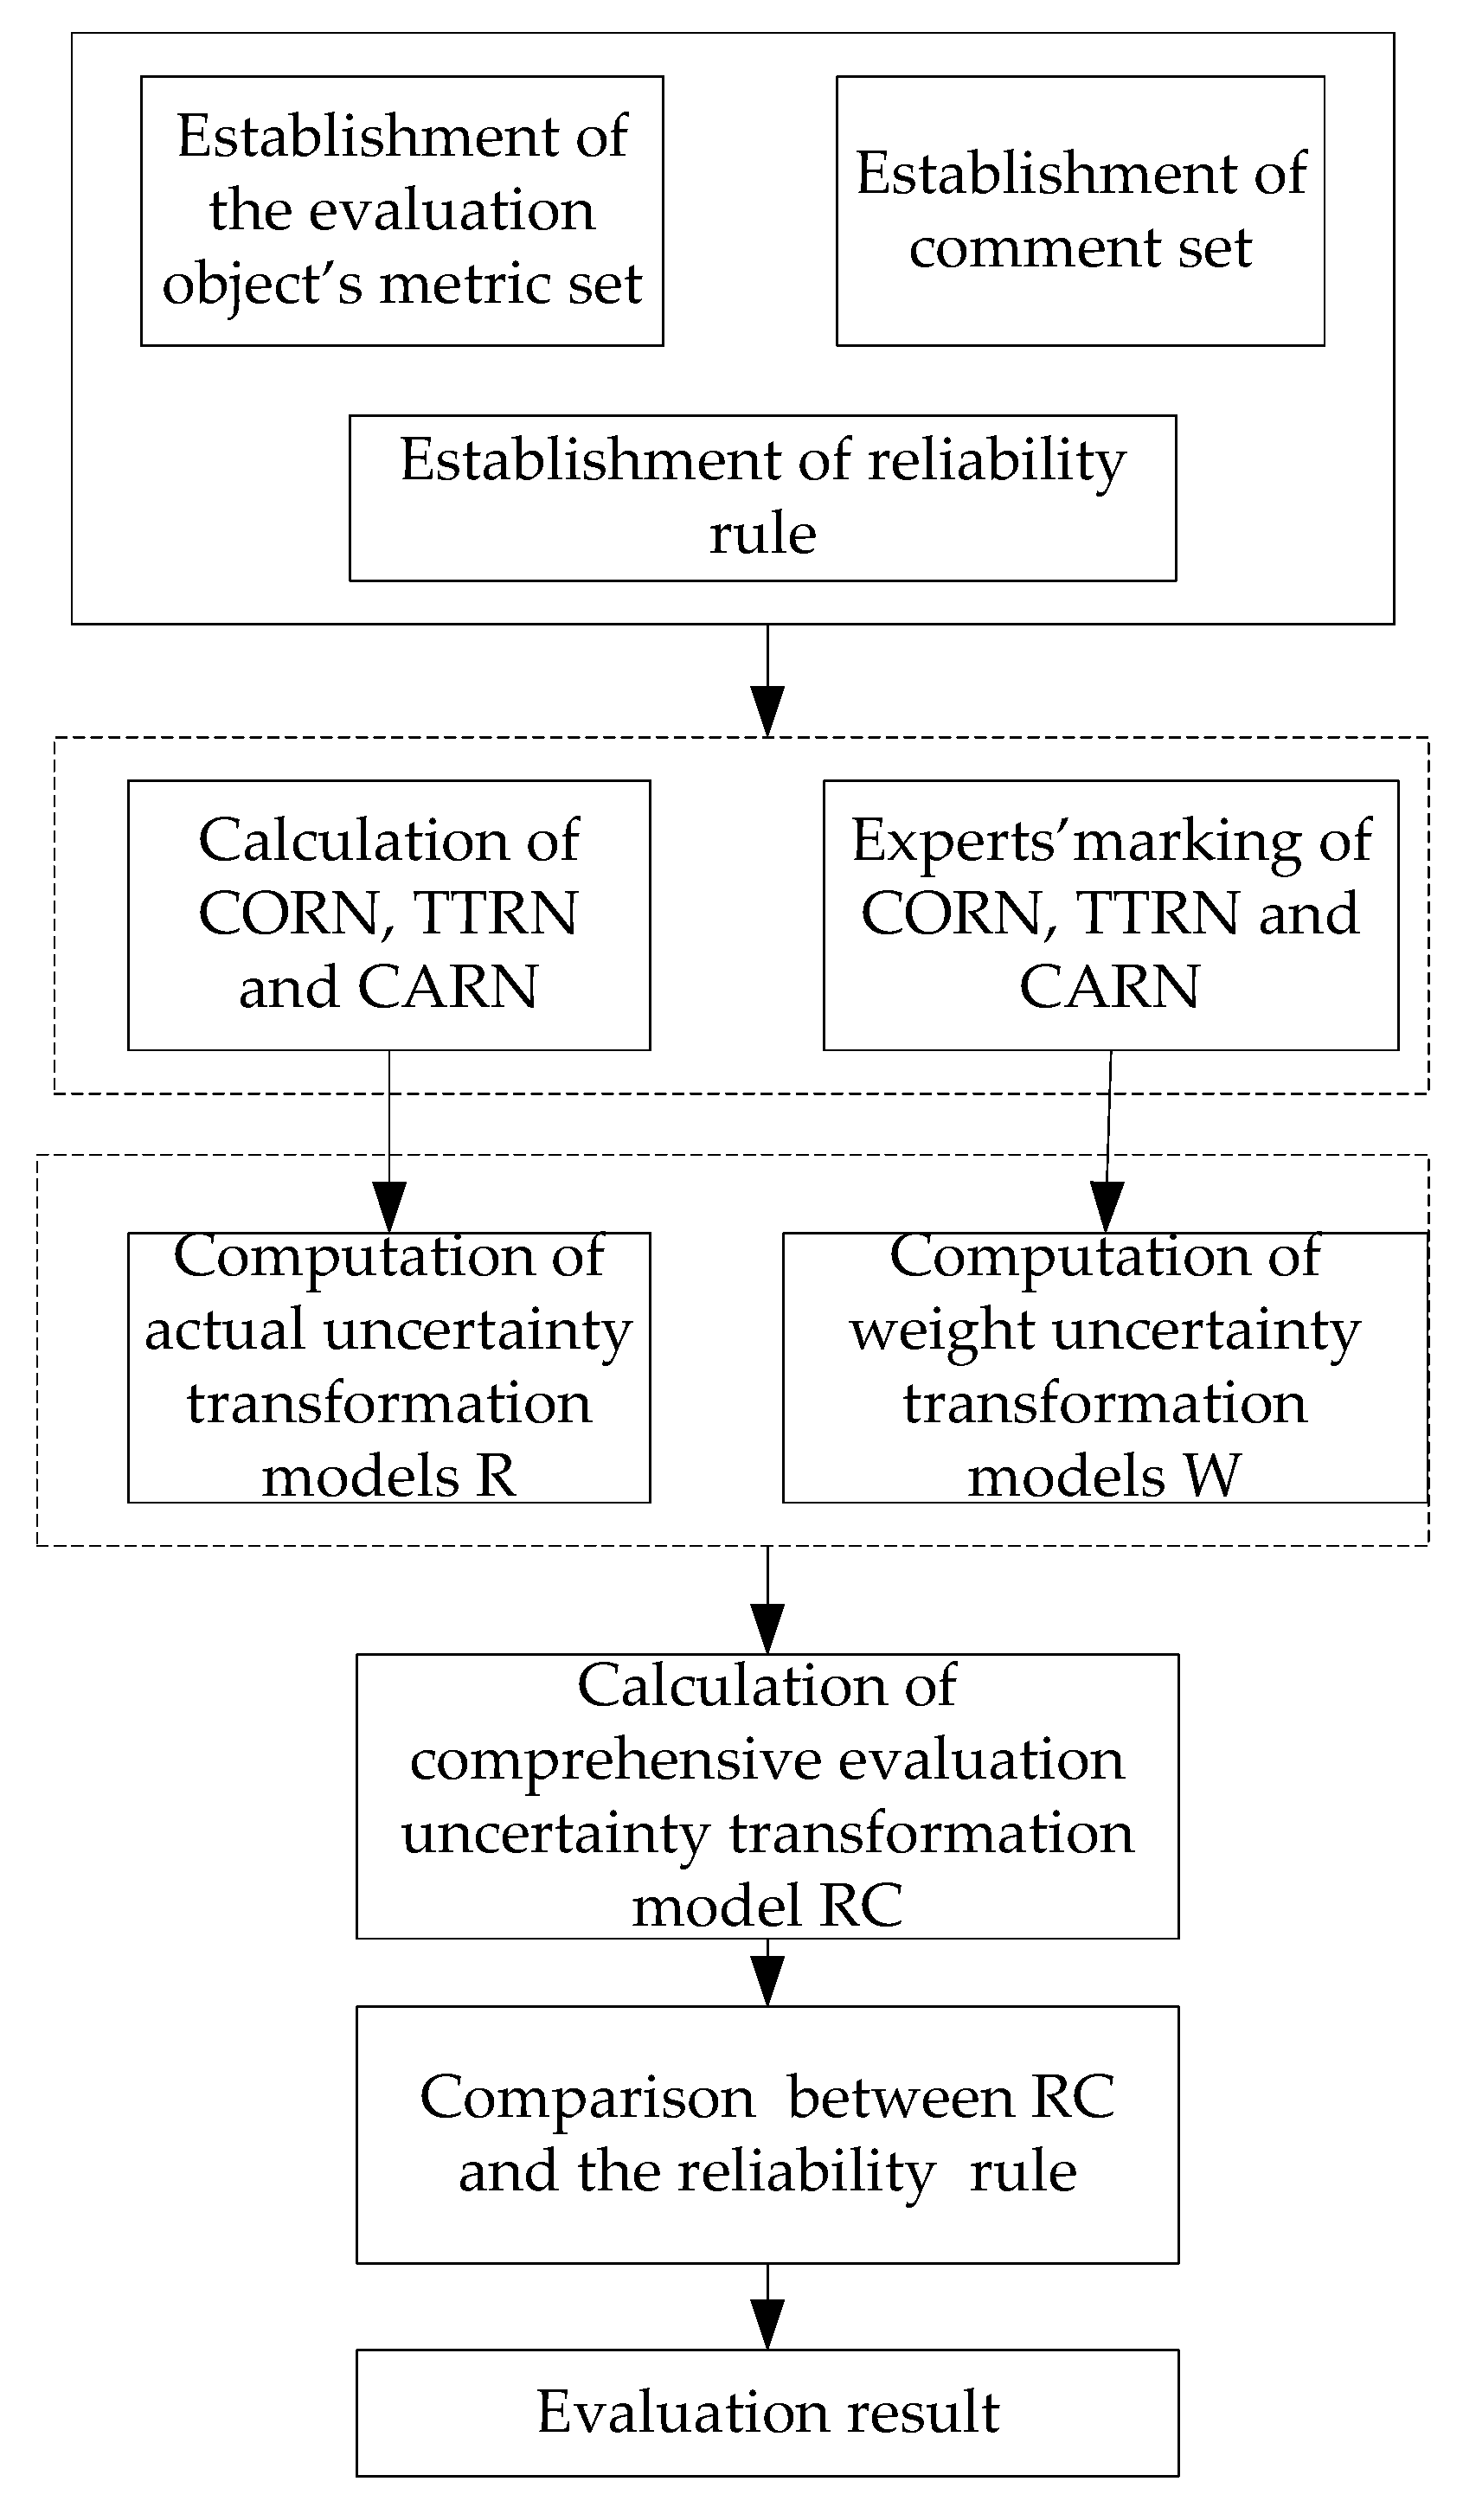
The architecture of the reliability evaluation framework is illustrated in Figure 4.
The specific description of the evaluation algorithm is as follows:
a. Establish the evaluation object’s metric set and comment set. Establish the metric set U = { C O R N , T T R N , C A R N } and comment set V = { v e r y   u n r e l i a b l e , u n r e l i a b l e , l e s s   r e l i a b l e , r e l a t i v e l y   r e l i a b l e , v e r y   r e l i a b l e } . The evaluation rule is shown in Table 2.
b. Compute the reliability indexes. Calculate the CORN, TTRN, and CARN of the air traffic network based on the methods in Section 3.2.
c. Compute the weight uncertainty transformation models W = { W 1 , W 2 , W 3 } . W 1 represents the weight uncertainty transformation model of the CORN, W 2 represents the weight uncertainty transformation model of the TTRN, and W 3 represents the weight uncertainty transformation model of the CARN. Use the Delphi method to score the weights of the CORN, TTRN, and CARN. The score given by experts is a numerical range because of the fuzziness of reliability; Table 3 shows an example.
Then, the uncertainty transformation models for each index are calculated based on the converse fuzzy set generator. There are two fuzzy sets for each index, C max ( E x max , E n max , H e max ) and C min ( E x min , E n min , H e min ) . The weight uncertainty transformation model W i ( E x i , E n i , H e i ) can be calculated using the following formulas [34]:
E x i = C min , i + C max , i 2
E n i = C min , i C max , i 6
H e i = k i
where k i is a constant and can be adjusted according to the fuzziness of the comments.
d. Compute the actual uncertainty transformation models. Calculate the uncertainty transformation models R = { R 1 , R 2 R 3 } using the converse fuzzy set generator based on the values of the CORN, TTRN, and CARN calculated in step b. R 1 represents the actual uncertainty transformation model of the CORN, R 2 represents the actual uncertainty transformation model of the TTRN, and R 3 represents the actual uncertainty transformation model of the CARN.
e. Calculate the comprehensive evaluation uncertainty transformation model R C based on the following formula:
R C = i = 1 n R i × W i
f. Compare the similarity between R C and the reliability rule, determine the most similar fuzzy set, and determine the evaluation results.

4. Empirical Analysis

4.1. Construction of the US Air Traffic Network

As the flight data of China is not open to the public, it is difficult to obtain flight data for the whole of China. The flight data used in this work were obtained from the Transportation Statistics Bureau of the US Department of Transportation [42]. The information of the historical flight data consists of detailed data for individual flights by aircraft and airline identification code (tail number and airline ID, respectively), date of flight, real and scheduled departure (arrival) times, origin and destination, flight time, and whether the flight was canceled or diverted.
We took the departure and arrival flight data from 100 major airports in the United States from September 2015 to February 2016 as an example for empirical analysis. The US flight network we established contains 100 nodes and 14,621 directed lines that connect most major cities in the US.

4.2. Calculation of the CORN, TTRN and CARN

(1) Calculation of the CORN
We calculated the CORN of the US air traffic network based on the method mentioned in Section 3.2. There are 2924 direct routes, 6610 routes with the shortest distance of 2, and 366 routes with the shortest distance of 3. The direct rate of the network (the ratio of the number of direct routes to the number of routes) is 29.5%. More than 96% of the routes can connect any two airports by no more than one transfer. Therefore, the accessibility of the air traffic network under direct requirements is lower, while the accessibility of the air traffic network under fewer than one transit requirement is higher.
In the calculation of the connectivity efficiency of any two airports, the connectivity rate of a single airport can be obtained, which reflects the hub function of the airport and the connectivity capability with other airports, and also reflects the importance of the airport in the air traffic network to a certain extent. The top 10 airports in terms of high connectivity are shown in Table 4, most of which are hub airports.
From Table 3, we find that the airports with the highest connectivity rate are the airports with the highest domestic passenger volume ranking in the United States, which reflects the positive relationship between the connectivity rate and hub airport circulation capacity. To some extent, the connectivity rate reflects the capacity of the airport and the level of openness to the outside world.
Then, we calculate the value of the CORN as follows:
R c o n = δ c o n E = ( 1 σ c o n μ c o n ) × μ c o n = μ c o n σ c o n = E σ c o n 0.6415 0.2342 = 0.4073
where the value of 0.2342 is the standard deviation of connectivity efficiency ε i j ; the value of 0.6415 is the mean of ε i j , which can be found in the Equations (2) and Equations (3).
The CORN is 0.4073, indicating that the US air traffic network has low connectivity reliability. This is consistent with the hub radiation structure of the US airline network. The connectivity reliability of the US air traffic network can be improved by increasing the number of direct routes.
(2) Calculation of the TTRN
The TTRN of the US air traffic network is determined based on the method in Section 3.2. Taking January 2016 as an example, there are 2921 routes, 93.46% of which are routes with travel-time reliability above 0.9 and 72.71% of which are routes with travel-time reliability above 0.95. Then, we calculate the value of the TTRN as follows:
R t r a = δ t r a 1 l l L V l = ( 1 σ t r a μ t r a ) × μ t r a = μ t r a σ t r a 0.9602 0.0422 = 0.9180
where the value of 0.0422 is the standard deviation of travel-time reliability V ; the value of 0.9602 is the mean of V .
The top 10 airports in terms of high travel-time reliability are shown in Table 5.
Comparing Table 3 and Table 4, the travel-time reliability of some airports is not as high as their connectivity, which shows the disadvantage of airports with high traffic volume in terms of travel-time reliability.
Then, we obtain the TTRN of every month from September 2015 to February 2016, and the results are shown in Table 6.
As seen from Table 5, the average TTRN is very high, and the monthly variation of the TTRN is very small, which reflects the stable travel-time reliability of the US air traffic network. The travel-time reliability of November is the highest and the travel-time reliability of September is the lowest. This may because there are many thundershowers in September and it is often sunny in November. In stormy weather, flights must fly around the thunderstorm area, which increase the flight distance and travel time.
(3) Calculation of the CARN
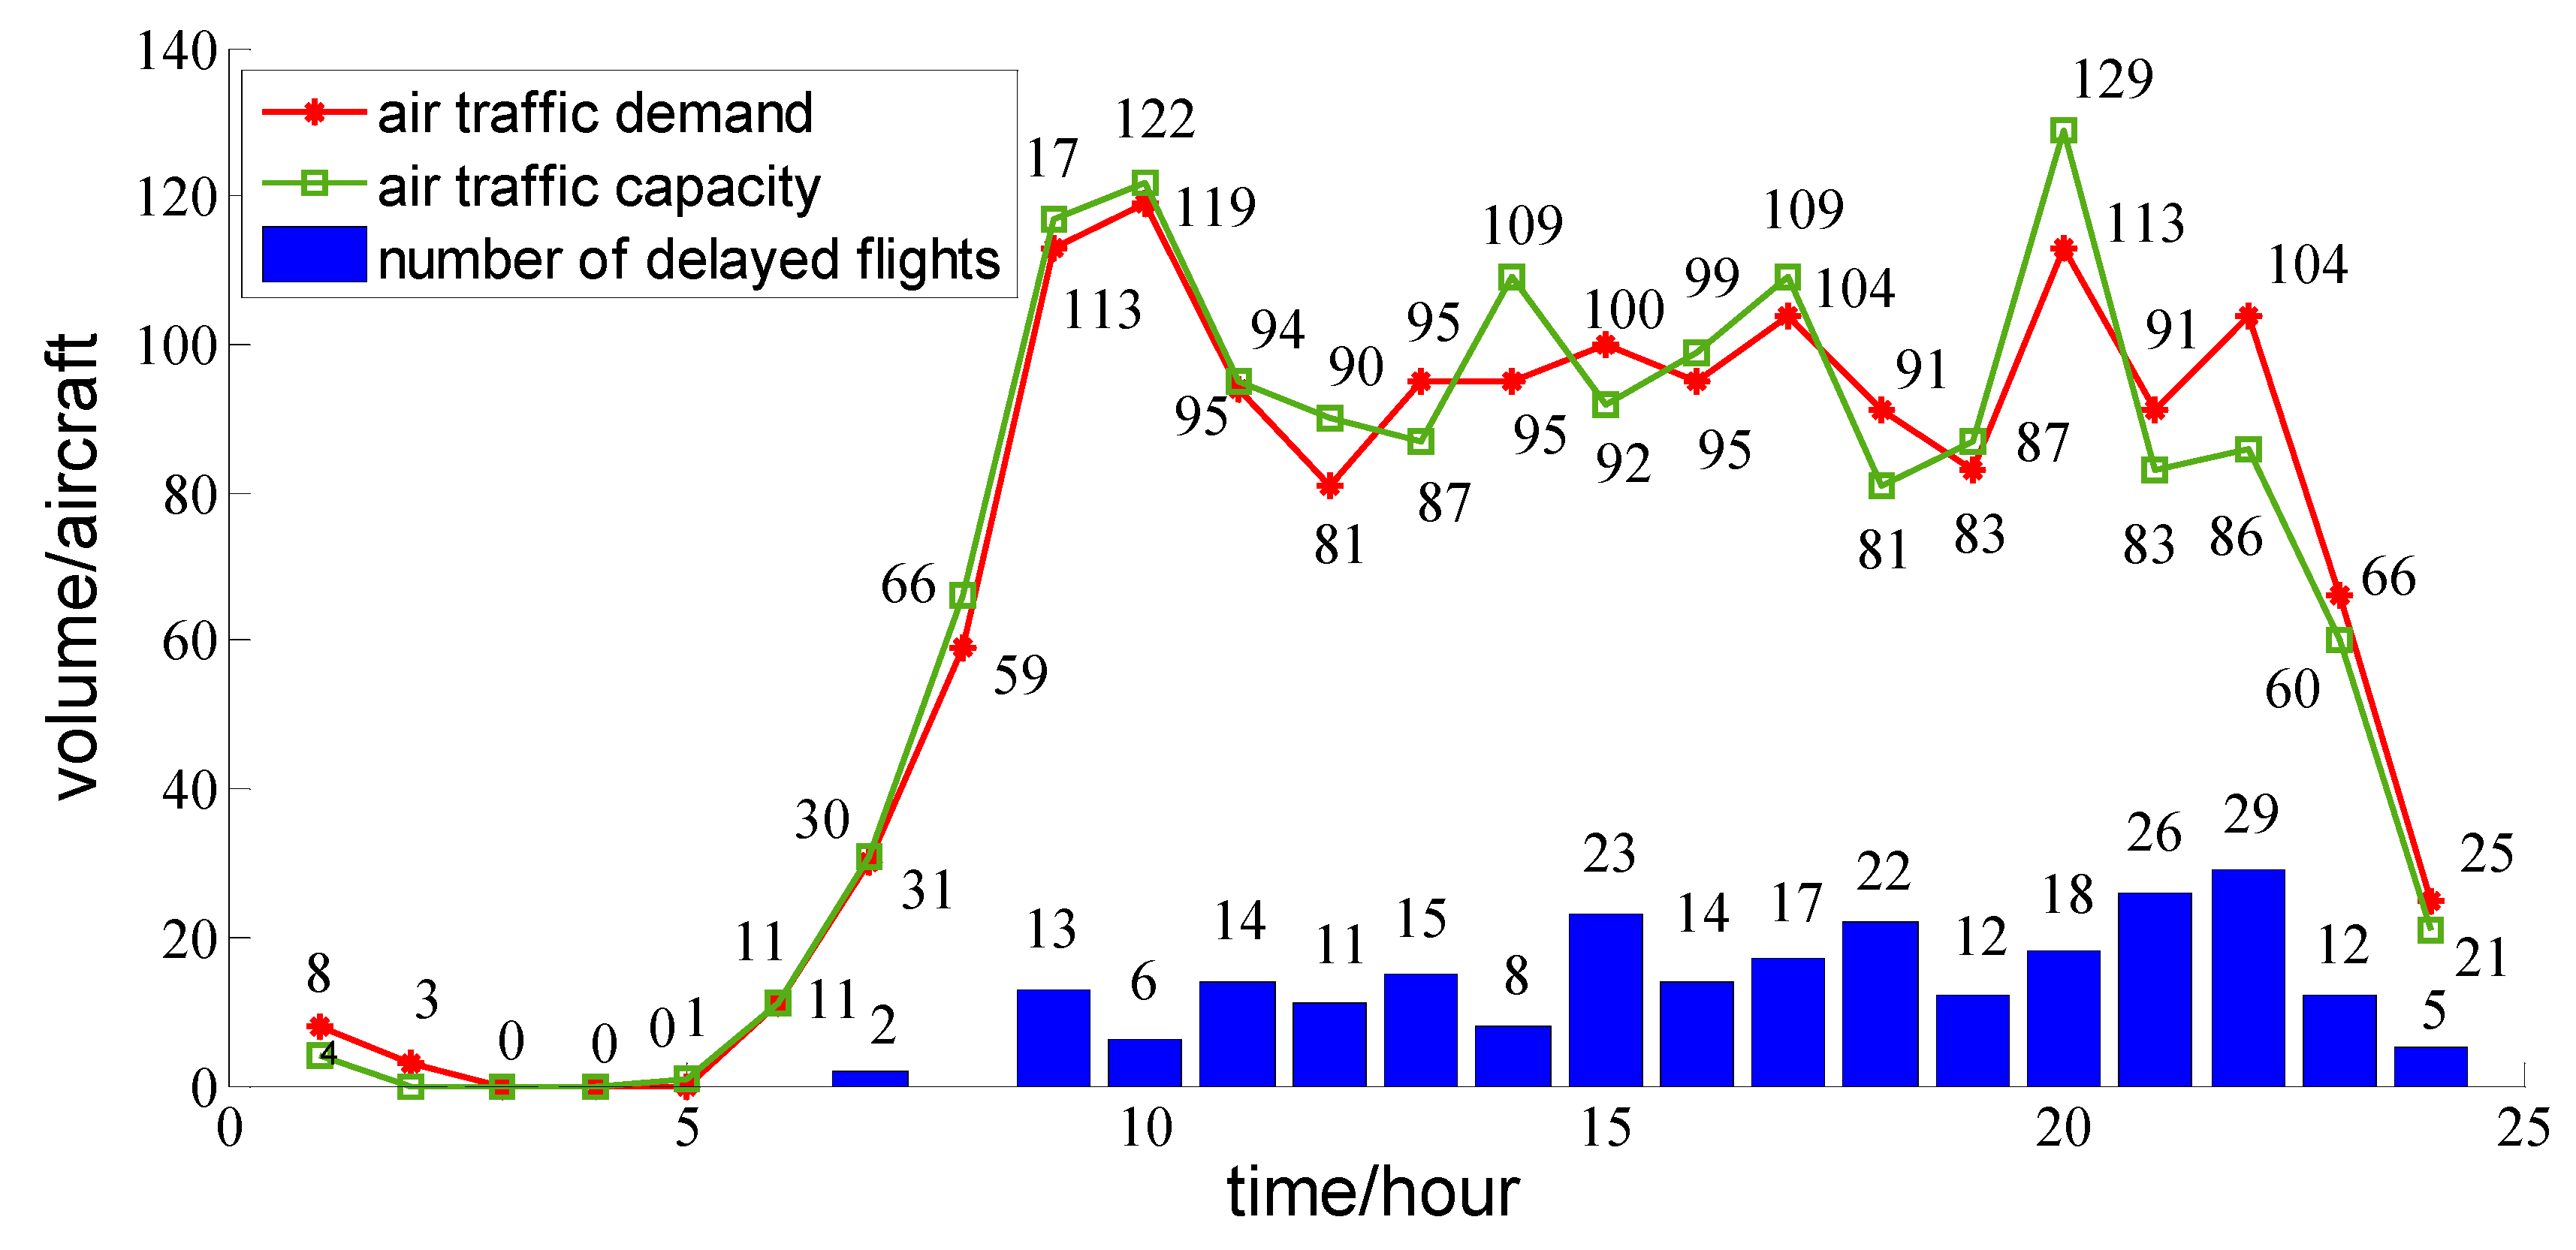
First, the capacity reliability of Atlanta Airport (ATL) is calculated based on the method in Section 3.3. The flight operation at ATL on 15 January is shown in Figure 5. The capacity reliability of ATL is 0.8068, which is relatively high. Then, we calculate the capacity reliability of other airports. We find that the capacity reliability of the top 28 large-flow airports is above 0.8, and the airport connectivity, with relatively high capacity reliability, is generally high.
Then, we calculate the monthly CARN of the US air traffic network, as shown in Table 6. From Table 7, we find that the CARN of the US air traffic network is much higher and the monthly variation of the CARN is much smaller. The capacity reliability of December is the lowest, which may be due to snowy weather; snowy weather will cause airport lanes to close, route capacity to drop, etc.

4.3. Comprehensive Evaluation of US Air Traffic Network Reliability

The fuzzy set weights of the CORN, TTRN, and CARN are calculated based on the Delphi method and converse generator. The results are shown in Table 8.
Then, the actual uncertainty transformation models of the CORN, TTRN and CARN can be obtained based on the converse generator, seen in Table 9.
The comprehensive evaluation uncertainty transformation model R C is calculated based on Equation (16):
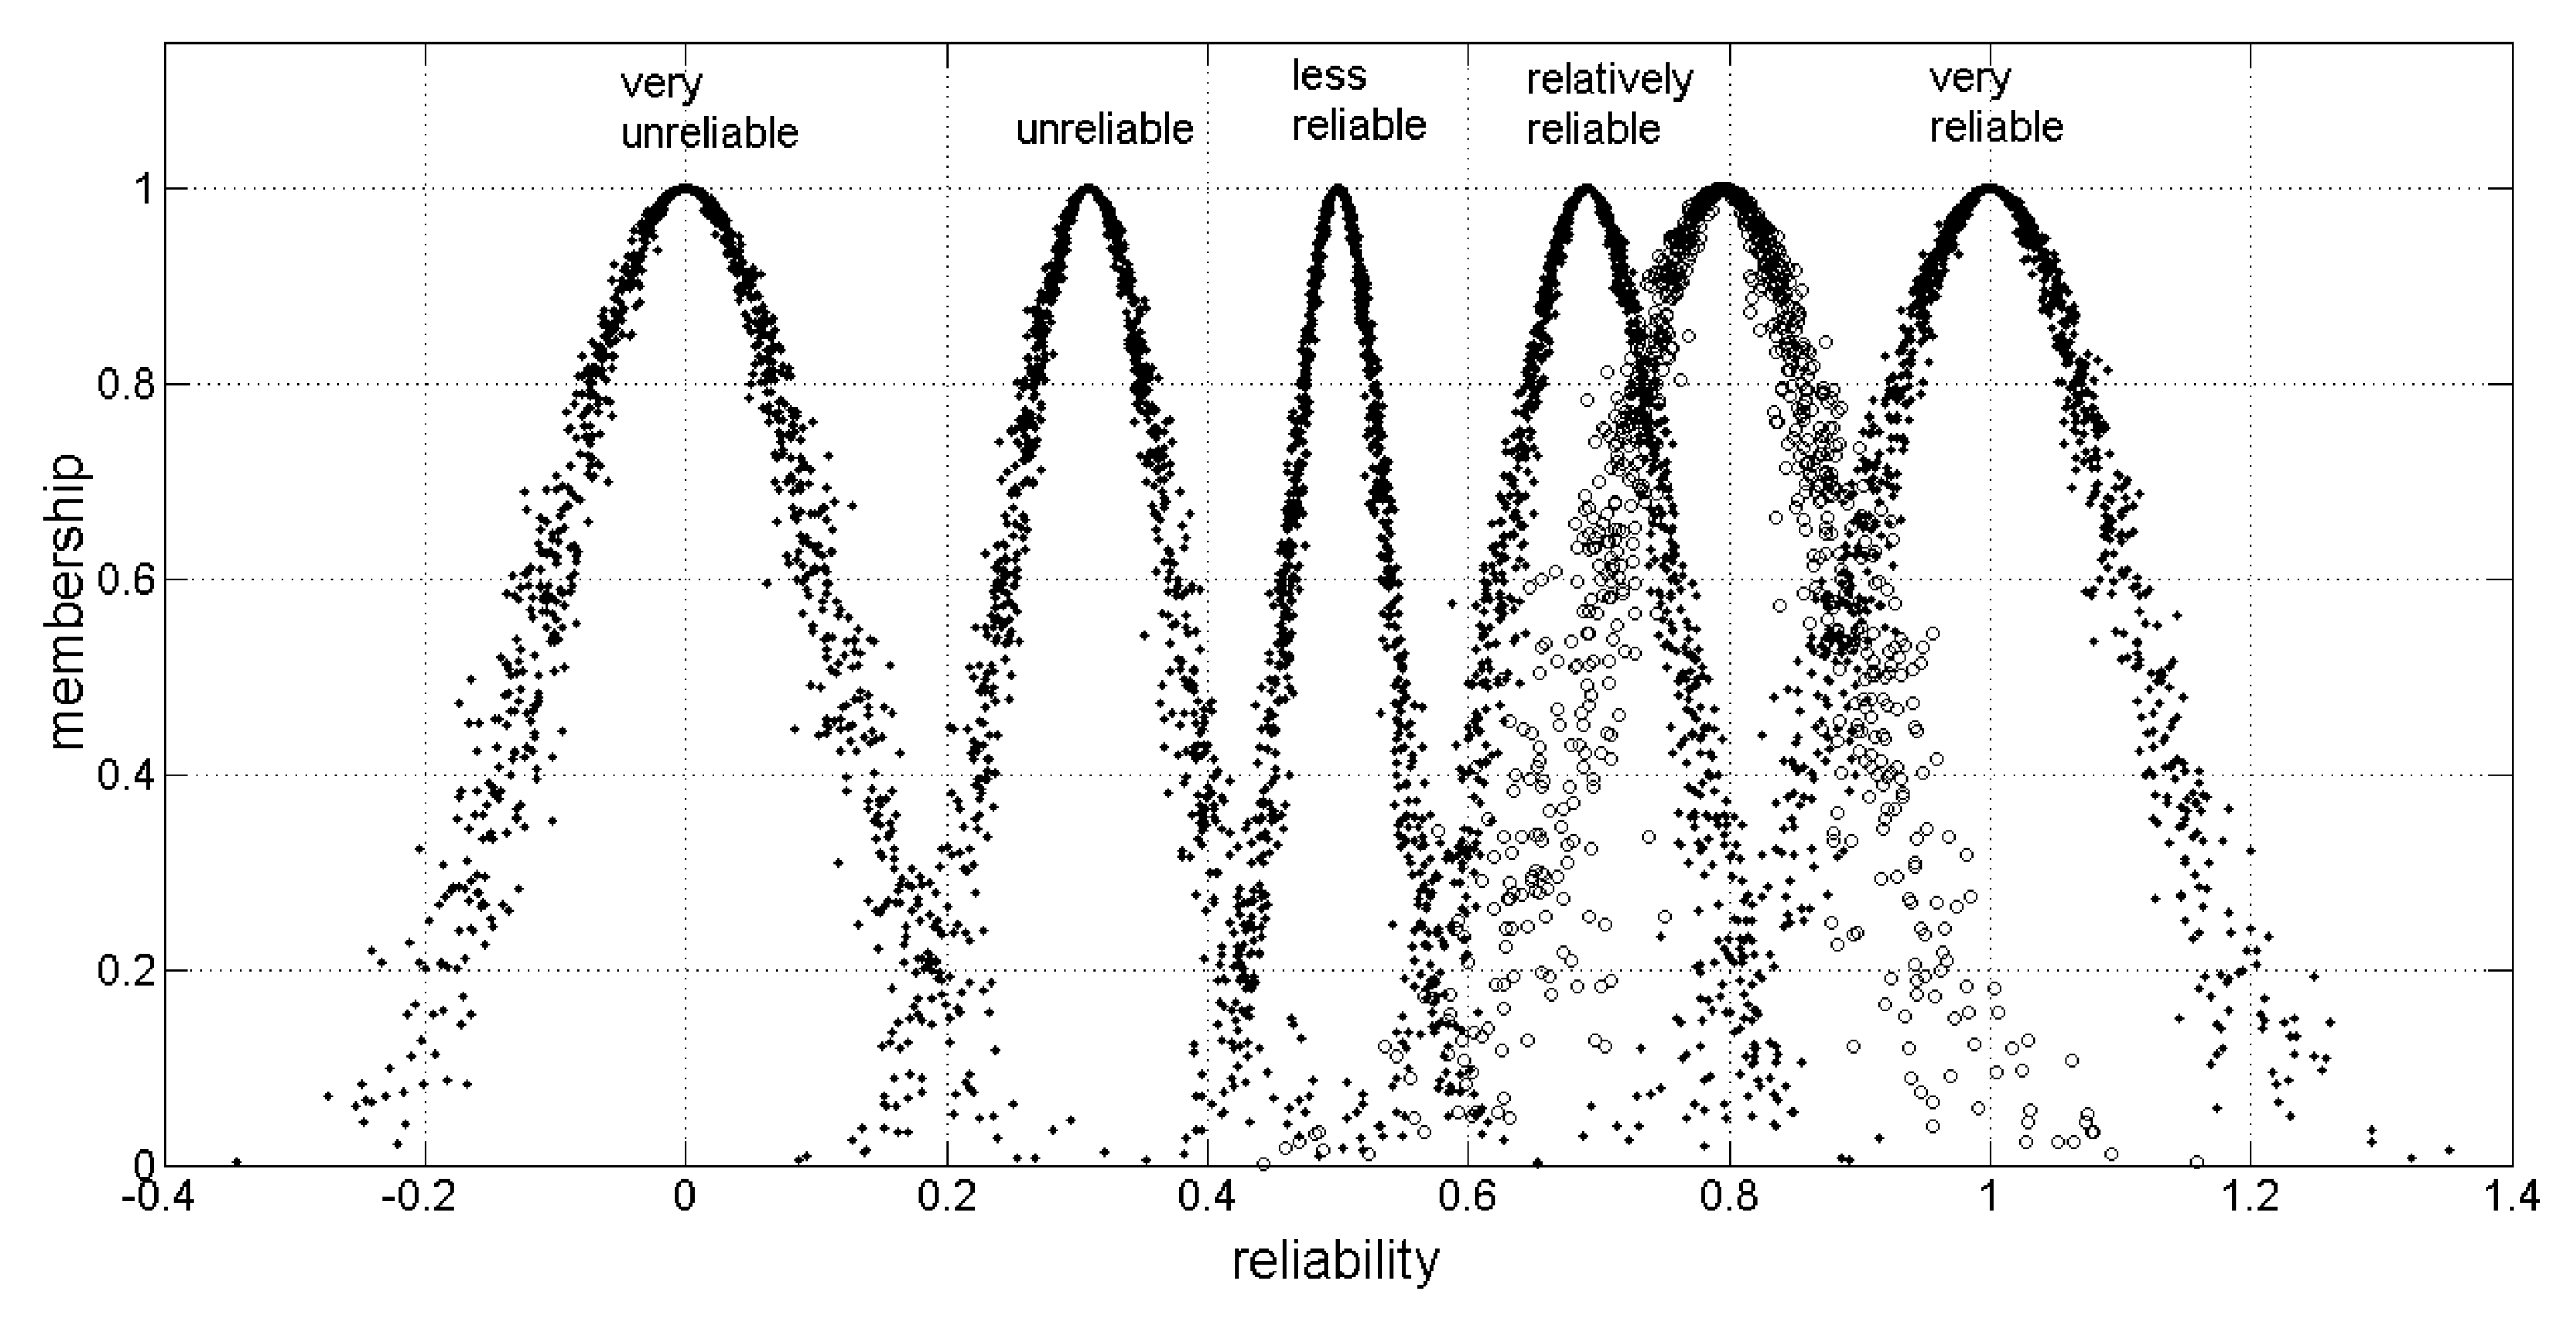
R C = i = 1 3 R i × W i = ( 0.7955 , 0.0920 , 0.0190 )
The membership fuzzy sets are shown in Figure 6. Fuzzy sets with “.” correspond to five rules, and fuzzy sets with “o” correspond to the reliability of the US air traffic network.
By comparing the fuzzy sets, we find that the most similar fuzzy set to the reliability fuzzy set of the US air traffic network is the relatively reliable fuzzy set, indicating that the reliability of the US network is relatively high. Although the CORN of the US air traffic network is low, the total reliability of the US air traffic network is high. Thus, we can conclude that the air traffic organization and management in the United States is efficient.
We also evaluate the reliability of the US air traffic network during peak hours (10:00–14:00) and nonpeak hours (19:00–23:00). The comprehensive evaluation uncertainty transformation model of peak hours is (0.7335, 0.1041, 0.0082), and the uncertainty transformation model of nonpeak hours is (0.8376, 0.0832, 0.0096). It can be seen that the reliability of the network in non-peak hours is higher than that in peak hours. This is because the air traffic demand is much higher and the flight delay is much larger during peak hours. The disorder of air traffic in peak hours is much larger than that in nonpeak hours.

5. Conclusions

Although some evaluation studies of controllers’ reliability and equipment reliability have been conducted, there is little research on the reliability of the air traffic network. The reliability of the air traffic network is the basis of air traffic management. We propose a novel method of evaluating the reliability of air traffic networks from both network structure and traffic function perspectives.
In this paper, we establish models of the CORN, TTRN, and CARN on the basis of the network structure, flight time, and air traffic capacity, respectively. Fuzzy set theory can be used to solve problems involving fuzziness and randomness. A comprehensive evaluation model based on the uncertainty transformation model is constructed. The uncertainty transformation model can transform the quantitative data into qualitative language considering both the fuzziness and uncertainty of human thinking. The comprehensive evaluation model can be used to guide the formulation of flight plans, adjustment of route network structures, and implementation of traffic management strategies. We take the US air traffic network as an example and evaluate its reliability. The following conclusions can be drawn: (1) The CORN of the US air traffic network is low, with indirect routes accounting for approximately 70% of the routes. In contrast, the TTRN and CARN are much higher. The TTRN of US airports with a high CORN is much lower than that of airports with a low CORN because of their large traffic volume. The TTRN is the largest, indicating that the efficiency of US air traffic management is much higher than the connectivity. (2) The US air traffic network is generally reliable. The reliability of the US air traffic network can be further improved by optimizing the network structure, optimizing the route layout, and improving the service level of the airports. (3) The reliability of the US air traffic network in nonpeak hours is much higher than that in peak hours. The empirical analysis also reflects the validity of our calculation method based on the uncertainty transformation model.
Based on this method, suggestions are made for optimizing the aviation network based on the analysis of the network reliability. The applications of the methodology (airport planning, fleet sizing, route planning, etc.) are not mentioned in this paper. These will be studied later.

Author Contributions

S.L. performed the research, analyzed the data and wrote the paper. Z.Z. co-designed the process of comprehensive evaluation. X.C. co-designed the research, and extensively updated the paper. All authors read and approved the final manuscript.

Funding

This work was funded by the National Nature Science Foundation of China [Grant Number 71801215, U1833103] and the Fundamental Research Funds for the Central Universities [Grant Number 3122016C009].

Conflicts of Interest

The authors declare no conflict of interest.

References

  1. Srivastava, G.; Fisher, A.; Bryce, R.; Crichigno, J. Green Communication with Geolocation. In Proceedings of the IEEE 89th Vehicular Technology Conference, Kuala Lumpur, Malaysia, 28 April–1 May 2019. [Google Scholar]
  2. Srivastava, G.; Dwivedi, A.D.; Singh, R. PHANTOM protocol as the new crypto-democracy. In Computer Information Systems and Industrial Management, Proceedings of the 17th International Conference, Olomouc, Czech Republic, 27–29 September 2018; Springer: Berlin/Heidelberg, Germany, 2018; Volume 11127, pp. 499–509. [Google Scholar]
  3. Tariq, M.; Adnan, M.; Srivastava, G. Instability detection and prevention in smart grids under asymmetric faults. IEEE Transp. Ind. Appl. 2020, 1–9. [Google Scholar] [CrossRef]
  4. Aloqaily, M.; Kantarci, B.; Mouftah, H.T. Multiagent/Multiobjective Interaction Game System for Service Provisioning in Vehicular Cloud. IEEE Access 2016, 4, 3153–3168. [Google Scholar] [CrossRef]
  5. Aloqaily, M.; Kantarci, M.; Mouftah, H.T. Trusted Third Party for service management in vehicular clouds. In Proceedings of the IEEE 13th International Wireless Communications and Mobile Computing Conference (IWCMC), Valencia, Spain, 26–30 June 2017. [Google Scholar]
  6. Tseng, R.; Wu, Y.J.; Pan, H.C.; Aloqaily, M.; Boukerche, A. Reliable Broadcast in Networks with Trusted Nodes. In Proceedings of the IEEE Global Communications Conference (GLOBECOM), Waikoloa, HI, USA, 9–13 December 2019. [Google Scholar]
  7. Yao, W.; Yahya, A.; Khan, F.; Tan, Z.Y. A Secured and Efficient Communication Scheme for Decentralized Cognitive Radio-based Internet of Vehicles. IEEE Access 2019, 7, 160889–160900. [Google Scholar] [CrossRef]
  8. Khan, F.; Rehman, A.; Usman, M.; Tan, Z.Y.; Puthal, D. Performance of Cognitive Radio Sensor Networks Using Hybrid Automatic Repeat ReQuest: Stop-and-Wait. Mob. Netw. Appl. 2019, 23, 3479–3488. [Google Scholar] [CrossRef] [Green Version]
  9. Zhu, R.; Yu, T.T.; Tan, Z.Y. PTAOD: A Novel Framework for Supporting Approximate Outlier Detection Over Streaming Data for Edge Computing. IEEE Access 2020, 8, 1475–1480. [Google Scholar] [CrossRef]
  10. Sun, Y.; Yan, T.; Wu, C.; Sun, X.; Wang, J.; Yuan, X. Analysis of the Fatigue Crack Propagation Process of the Stress-Absorption Layer of Composite Pavement Based on Reliability. Appl. Sci. 2018, 8, 2093. [Google Scholar] [CrossRef] [Green Version]
  11. Koo, D.; Shin, Y.; Yun, J.; Hur, J. Improving Security and Reliability in Merkle Tree-Based Online Data Authentication with Leakage Resilience. Appl. Sci. 2018, 8, 2532. [Google Scholar] [CrossRef] [Green Version]
  12. Bermejo, J.F.; Fernandez, J.F.G.; Polo, F.O.; Marquez, A.C. A Review of the Use of Artificial Neural Network Models for Energy and Reliability Prediction. A Study of the Solar PV, Hydraulic and Wind Energy Sources. Appl. Sci. 2019, 9, 1844. [Google Scholar] [CrossRef] [Green Version]
  13. Wang, S.J.; Sui, D. Quantitative analysis of human reliability of air traffic controllers. Chin. J. Ergon. 2009, 15, 46–50. [Google Scholar]
  14. Liu, J.X. Research on human error probability of controllers’ resolution of flight conflict based on improved success probability index method. Chin. J. Ergon. 2018, 24, 68–72. [Google Scholar]
  15. Yuan, L.P.; Zhang, X.J. Study on technique for human reliability analysis of air traffic controllers. Chin. Saf. Sci. J. 2017, 9, 102–107. [Google Scholar]
  16. Kirwan, B.; Gibson, W.H.; Hickling, B. Human error data collection as a precursor to the development of a human reliability assessment capability in air traffic management. Reliab. Eng. Syst. Saf. 2008, 93, 217–233. [Google Scholar] [CrossRef]
  17. Kirwan, B.; Gibson, H. CARA: A Human Reliability Assessment Tool for Air Traffic Safety. Management—Technical Basis and Preliminary Architecture. In The Safety of Systems; Redmill, F., Anderson, T., Eds.; Springer: Berlin/Heidelberg, Germany, 2007. [Google Scholar]
  18. Xu, X.H.; Liu, W.X.; Wang, X.L. Markov chain apply in air traffic control automatic system software reliability analysis. Aeronaut. Comp. Tech. 2009, 39, 15–17. [Google Scholar]
  19. Zhang, Y.W. Research on Emergency Capability Assessment of Atc Devices And Emergency Support Planning. Master’s Thesis, Nanjing University of Aeronautics and Astronautics, Nanjing, China, 2012. [Google Scholar]
  20. Jiang, C.; Wu, L.; Xu, F.; Jixue, Y. Characteristics and reliability analysis of the complex network in Guangzhou rail transit. Intell. Autom. Soft Comput. 2013, 19, 217–225. [Google Scholar] [CrossRef]
  21. Silva, M.; Daniels, M.; Lleras, G.; Patino, D. A transport network reliability model for the efficient assignment of resources. Transp. Res. Part B 2005, 39, 47–63. [Google Scholar] [CrossRef]
  22. Iida, Y. Basic Concepts and Future Directions of Road Network Reliability Analysis. J. Adv. Trans. 1999, 33, 125–134. [Google Scholar] [CrossRef]
  23. Bell, M.G.H.; Iida, Y. Transportation Network Analysis; John Wiley & Sons Ltd.: Chichester, UK, 1997; pp. 179–181. [Google Scholar]
  24. Chen, A.; Yang, H.; Lo, H.K.; Tang, W.H. Capacity reliability of a road network: An assessment methodology and numerical results. Transp. Res. Part B 2002, 36, 225–252. [Google Scholar] [CrossRef]
  25. Lo, H.K.; Tung, Y.-K. Network with degradable links: Capacity analysis and design. Transp. Res. Part B Methodol. 2003, 37, 345–363. [Google Scholar] [CrossRef]
  26. Jie, Y.; Songchen, H. Taxi route optimization algorithm of airport surface based on multi-agent. J. Traff. Transp. Eng. 2009, 1, 109–112. [Google Scholar]
  27. Deyi, L.; Changyu, L.; Yi, D.; Han, X. Artificial Intelligence with Uncertainty. J. Softw. 2004, 15, 24–25. [Google Scholar]
  28. Shi, Y.B.; Zhang, A.; Gao, X.; Tan, Z.J. Cloud model and its application in effectiveness evaluation. In Proceedings of the Management Science and Engineering, Long Beach, CA, USA, 10–12 September 2008; pp. 250–255. [Google Scholar]
  29. Cui, Y.Y.; Zeng, Z.Y.; Liu, L. An object detection algorithm based on the cloud model. In Proceedings of the International Joint Conference on Computational Sciences and Optimization, Hainan, China, 24–26 April 2009; pp. 910–912. [Google Scholar]
  30. Wang, H.L.; Meng, L.; Cao, M.K.; Li, Y. Data Mining Application Based on Cloud Model in Spatial Decision Support System. In Proceedings of the International Colloquium on Computing, Communication, Control, and Management, Guangzhou, China, 3–4 August 2008; pp. 547–551. [Google Scholar]
  31. Wu, T.; Qin, K. Cloud model method in disaster loss assessment. In Proceedings of the International Forum on Information Technology and Applications, Chengdu, China, 15–17 May 2009; pp. 673–676. [Google Scholar]
  32. Wang, F.; Li, Y.P.; Li, X. Performance evaluation method for automatic target recognition system based on forward cloud. J. Syst. Simul. 2008, 20, 1673–1676. [Google Scholar]
  33. Liu, X.R. New network attack classification architecture. J. Commun. 2006, 27, 160–167. [Google Scholar]
  34. Guo, Q.; Bi, Y.M. Effectiveness evaluation of command of missile information war based on cloud model. Command Control Simul. 2008, 30, 61–64. [Google Scholar]
  35. Babaei, M.; Rajabi-Bahaabadi, M.; Shariat-Mohaymany, A. Estimation of travel time reliability in large-scale networks. Transp. Lett. 2016, 8, 229–240. [Google Scholar] [CrossRef]
  36. Gong, L.F.; Fan, W. Applying travel-time reliability measures in identifying and ranking recurrent freeway bottlenecks at the network level. J. Transp. Eng. Part A Syst. 2017, 143, 04017042. [Google Scholar] [CrossRef]
  37. Xiao, Y.; Coulombel, N.; de Palma, A. The valuation of travel time reliability: Does congestion matter? Transp. Res. Part B Methodol. 2017, 97, 113–141. [Google Scholar] [CrossRef]
  38. Zheng, F.F.; Li, J.; Van Zuylen, H.; Xiaobo, L.; Hongtai, Y. Urban travel time reliability at different traffic conditions. J. Intell. Transp. Syst. 2017, 22, 106–120. [Google Scholar] [CrossRef] [Green Version]
  39. Jackson, D.L.; Shaw, T.L. The Florida Reliability Method in Florida’s Mobility Performance Measures Program; Florida Department of Transportation: Tallahassee, FL, USA, 2000. [Google Scholar]
  40. Wu, L.; Zhengmin, Z.; Xiangchun, M.; Yue, L.I. Application of cloud theory in reliability assessment of combat aircraft. Comput. Simul. 2005, 22, 235–238. [Google Scholar]
  41. Bo, W.; Liangjie, X.; Wenbin, Z. Cloud theory based traffic state identification for urban road network. In Proceedings of the IEEE International Conference on Intelligent Computation Technology & Automation, Changsha, China, 11–12 May 2010. [Google Scholar]
  42. Bureau of transportation statistics, US Department of transportation. Available online: https://www.transtats.bts.gov/ (accessed on 20 April 2020).
Figure 1. Sketch of a map of an air traffic network.
Applsci 10 03168 g001
Figure 2. Morphology map of the travel-time distribution.
Applsci 10 03168 g002
Figure 3. Three digital characteristics of a fuzzy set.
Applsci 10 03168 g003
Figure 4. The architecture of reliability evaluation based on the uncertainty transformation model.
Applsci 10 03168 g004
Figure 5. Flight schedule on 15 January of ATL airport.
Applsci 10 03168 g005
Figure 6. Member fuzzy set map for reliability evaluation of the US air traffic network.
Applsci 10 03168 g006
Table 1. Computing rules of the uncertainty transformation model.
ExEnHe
+ E x 1 + E x 2 E n 1 2 + E n 2 2 H e 1 2 + H e 2 2
E x 1 E x 2 E n 1 2 + E n 2 2 H e 1 2 + H e 2 2
× E x 1 × E x 2 | E x 1 E x 2 | × ( E n 1 E n 1 ) 2 + ( E n 1 E n 1 ) 2 | E x 1 E x 2 | × ( H e 1 E x 1 ) 2 + ( H e 2 E x 2 ) 2
÷ E x 1 ÷ E x 2 | E x 1 E x 2 | × ( E n 1 E x 1 ) 2 + ( E n 2 E x 2 ) 2 | E x 1 E x 2 | × ( H e 1 E x 1 ) 2 + ( H e 2 E x 2 ) 2
Table 2. Reliability rule of the air traffic network.
Reliability LevelUncertainty Transformation Model
Very reliableFuzzy set 1(1,0.1031,0.013)
Relatively reliableFuzzy set 2(0.691,0.064,0.008)
Less reliableFuzzy set 3(0.5,0.039,0.005)
UnreliableFuzzy set 4(0.309,0.064,0.008)
Very unreliableFuzzy set 5(0,0.1031,0.013)
Note: The reliability rule is adopted from “Uncertainty Artificial Intelligence” written by Li Deyi [21].
Table 3. Marking of experts.
Index 1Index 2
expertsmaxminmaxmin
10.320.20.550.31
20.290.140.530.35
Table 4. Top 10 airports for connectivity.
RankingAirportsConnectivity
1ATL92.00%
2ORD92.00%
3DEN90.00%
4DFW84.50%
5IAH84.50%
6MSP84.50%
7DTW83.50%
8EWR83.50%
9LAS83.30%
10PHX82.50%
Table 5. The top 10 Airports for travel-time reliability.
RankingAirportsTTR
1GUM0.998
2EYW0.991
3RSW0.969
4MHT0.963
5HNL0.962
6DAL0.959
7MSY0.958
8ELP0.957
9CHS0.957
10DFW0.956
Table 6. The travel-time reliability of the air traffic network (TTRN) of the US air traffic network.
Index\
Month
SeptemberOctoberNovember
μ t r a 0.96150.96100.9647
σ t r a 0.04680.03570.0367
R t r a 0.91470.92530.9280
Index\
Month
DecemberJanuaryFebruary
μ t r a 0.95470.96010.9601
σ t r a 0.03930.04220.0420
R t r a 0.91540.91790.9181
R t r a ¯ 0.9199
Table 7. The capacity reliability of the air traffic network (CARN) of the US air traffic network.
Index\
Month
SeptemberOctoberNovember
μ c a p 0.86840.86740.8627
σ c a p 0.02440.02380.0275
R c a p 0.84400.84360.8352
Index\
Month
DecemberJanuaryFebruary
μ c a p 0.83420.84990.8549
σ c a p 0.02510.02690.0297
R c a p 0.80910.82300.8252
R c a p ¯ 0.8300
Table 8. Fuzzy set weights of the connectivity reliability of the air traffic network (CORN), TTRN, and CARN.
IndexFuzzy Set Weights
CORN(0.155, 0.046, 0.0179)
TTRN(0.345, 0.034, 0.0147)
CARN(0.500, 0.050, 0.0003)
Table 9. Uncertainty transformation models of the CORN, TTRN, and CARN.
IndexUncertainty Transformation Models
CORNFuzzy set 1(0.4073,0,0)
TTRNFuzzy set 2(0.9199,0.0109,0.0049)
CARNFuzzy set 3(0.8300,0.0088,0.0103)