1. Introduction
The rapid industrialization of South Korea has three characteristics: authoritarian state control over the industrial sphere, high economic growth rates due to export heavy industry, and rapid capital accumulation [
1,
2]. In particular, heavy industry has had a significant impact on the environment. The problems of forming sustainable systems for controlling the disposal of industrial wastes are become more and more apparent in South Korea. Business and government organizations discuss the practical application of environmental policies and modern technologies of Korean companies in the field of industrial waste processing. That is why it is necessary to discover all of the industrial factors which have a strong impact on the environment, and to develop effective models of waste treatment processing. Large industrial complexes involved in heavy industry have strongly polluted the earth, water and air [
3]. In the areas that neighbor industrial complexes, sulfur was found on rice leaves, and some elementary school students fainted on the way to school due to toxic gas emitted from factory stacks. The economic development of South Korea was achieved at the expense of the environment. The same process has been followed by most European countries [
4].
Solid waste was not considered an environmental issue in Korea for a long time. Bekun et al. in 2019, and Paramati in 2018 [
5,
6,
7], discuss that there was no concern about how much solid waste was generated, and any waste collected from households was dumped in open landfills without regard for environmental hazards. At the same time, the government charged only a fixed amount for household waste disposal services, regardless of how much waste was disposed of. The Korean economic boom over the past few decades has led to a significant increase in solid waste generation. The Korea Institute of Environmental Technology Development in 1996 announced that, in just 20 years, the total amount of municipal solid waste generated per day increased from about 12,000 tons in 1970 to 84,000 tons in 1990 [
8]. As the amount of waste increased rapidly, several problems related to waste disposal developed in Korea.
The Republic of Korea officially recycles more than 85 percent of all waste, as stated in a 2017 government study [
8]. On the other hand, illegally dumped waste can be found in rural areas of the country. Despite this criticism, the Korean waste management system is quite effective.
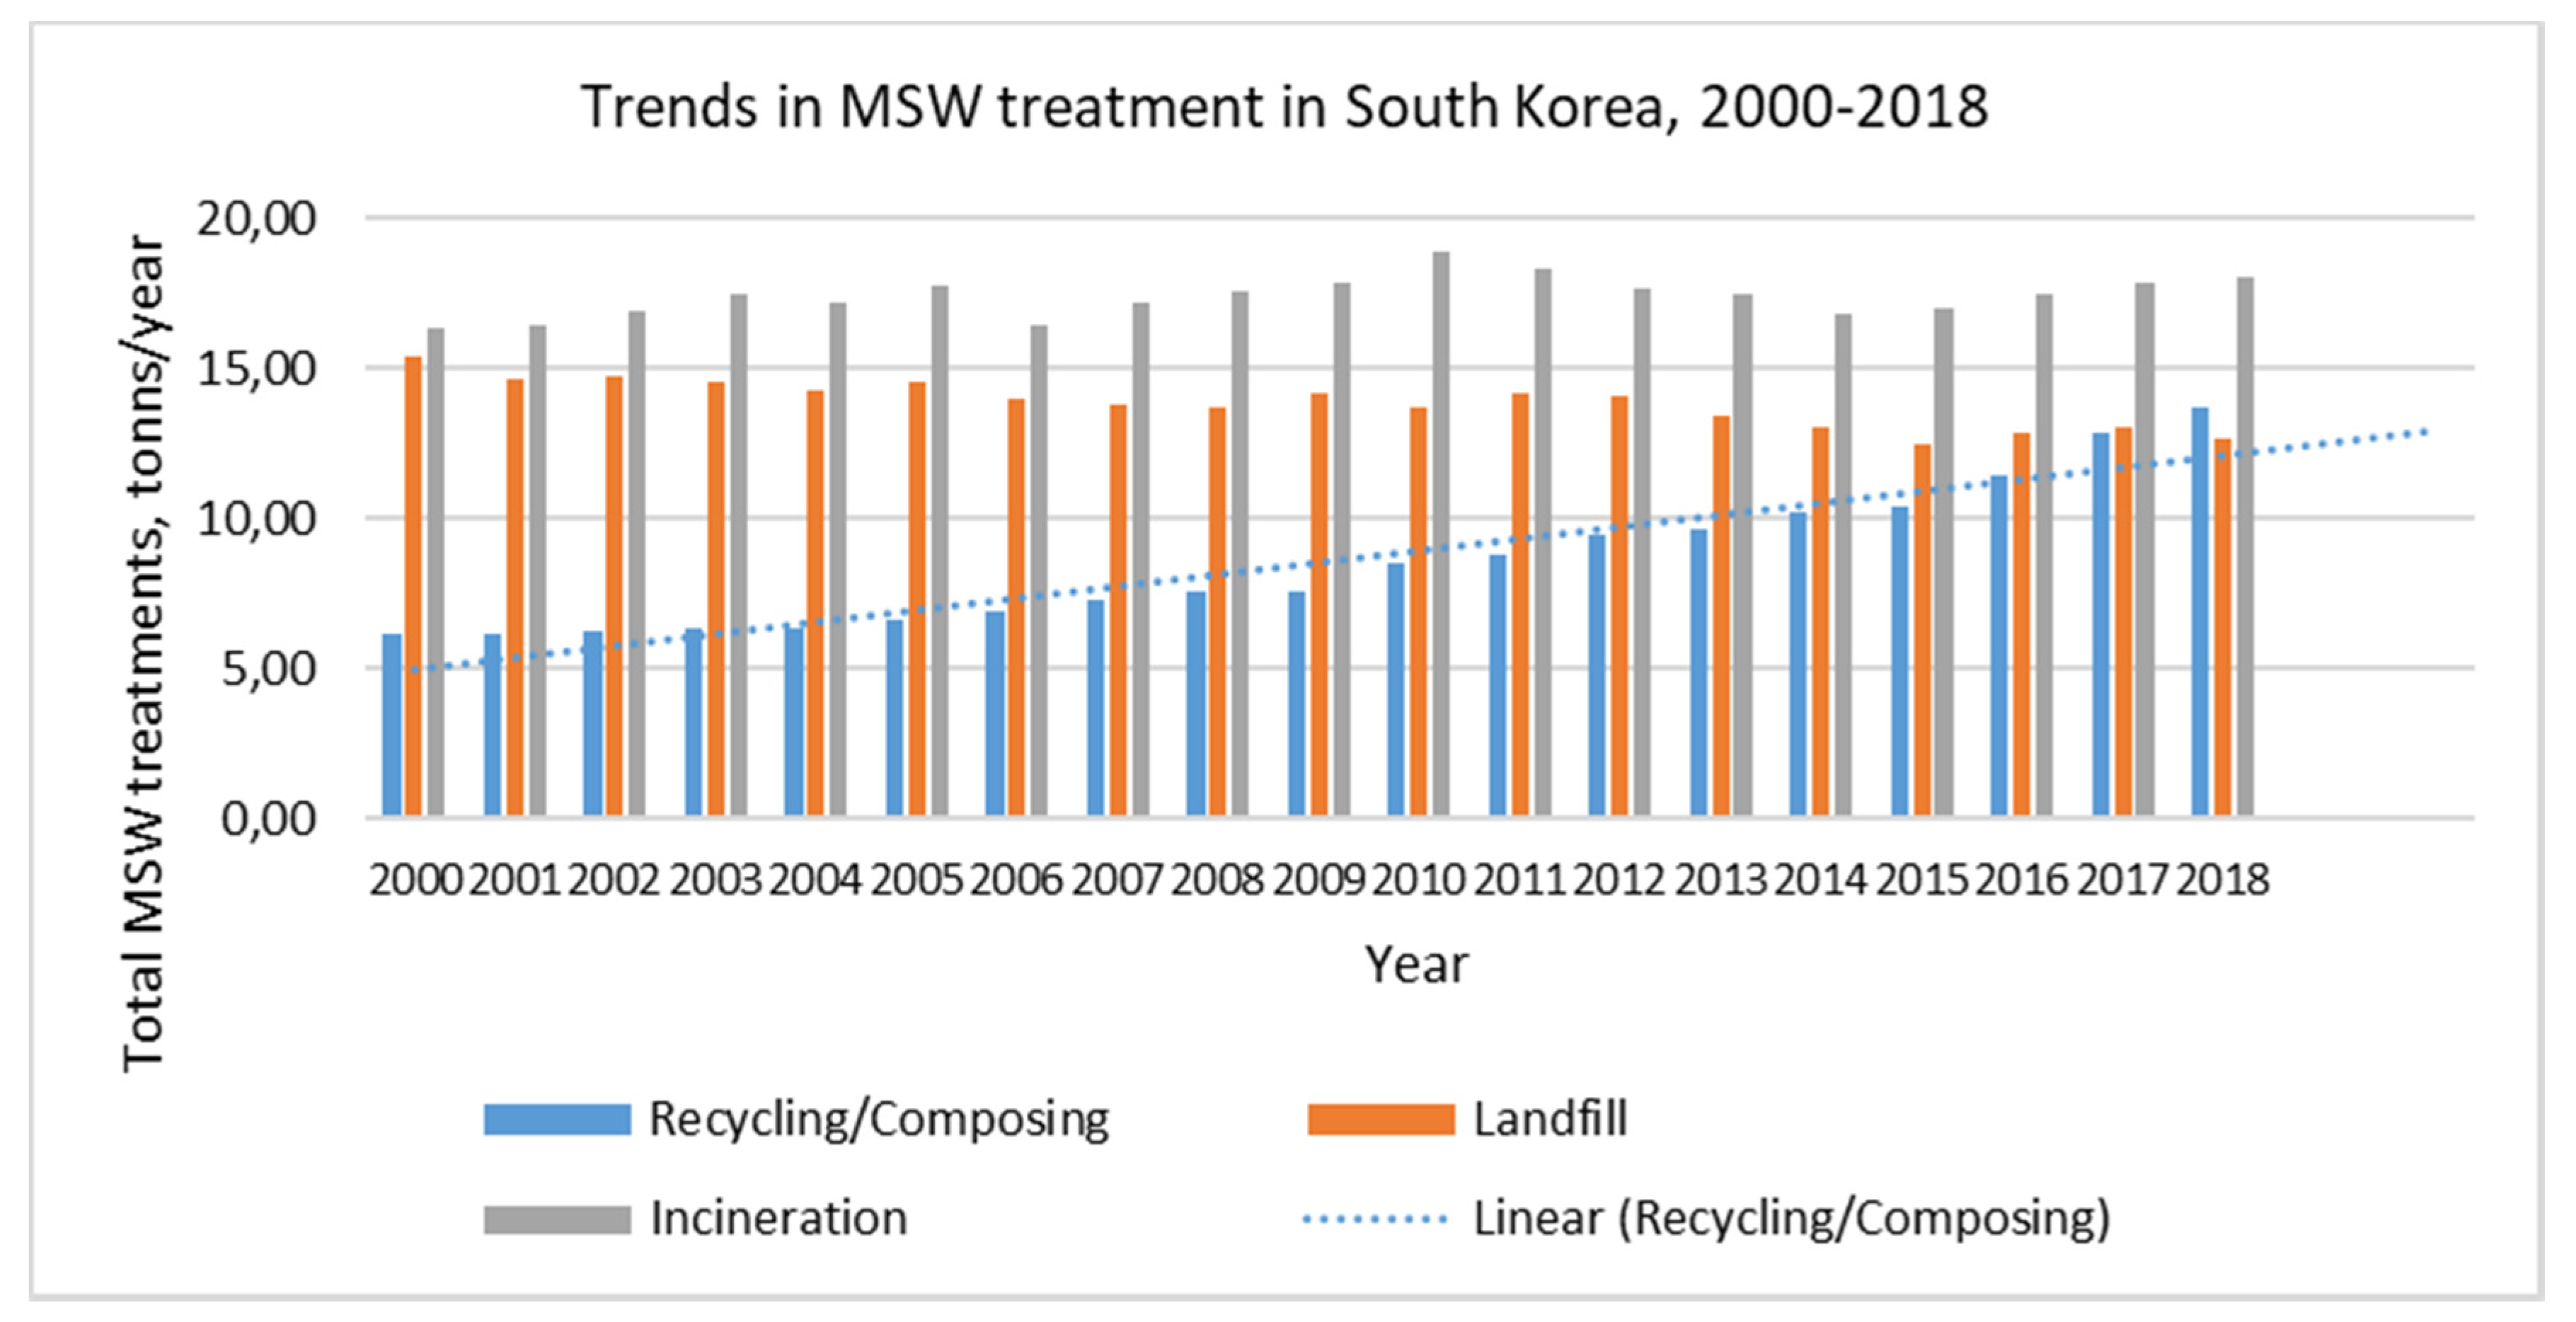
According to the 2018 Korea Environmental Review (ECOREA), 10.3 percent of the country’s waste (including household and business waste) was disposed of, 6.3 percent was burnt, 82.4 percent was recycled, and 1.0 percent was dumped into the sea. As of 2012, 97.3 percent of construction waste and 76.5 percent of commercial waste was recycled, 14.9 percent of them was buried in landfills, 6.5 percent was burnt, and 2.1 percent dumped into the sea. Moreover, 54.4 percent of designated waste (the term refers to industrial waste) was processed, 16.4 percent was burnt, 23.0 percent was buried and 6.2 percent was treated with other measures (storage) [
9]. Even though the percentage of waste processed during incineration or processing is increasing annually, the rate of processing waste generated in landfills and discharges into the ocean is reduced. The reduction in waste discharged into the sea is the result of a ban on the discharge of wastewater, wastewater from food waste, and cattle wastewater into the ocean in 2012–2013; treatment methods for these types of waste have been replaced by incineration or recycling (
Figure 1).
Korea has been one of the fastest growing OECD economies over the past decades, driven by a large export-oriented manufacturing sector [
10]. However, growth has come with high pollution and resource consumption. With increasing energy demand, greenhouse gas (GHG) emissions have risen significantly and air pollution remains a major health concern. Despite significant improvements in wastewater treatment, diffuse pollution increasingly affects scarce water resources. Urbanization and industrialization also put considerable pressure on biodiversity. The environmental challenges are exacerbated by Korea’s population density—the highest in the OECD [
11]. Access to environmental goods and services, and exposure to environmental risk vary significantly by region.
To tackle these challenges, Korea has invested considerable effort into improving environmental management, for example, by introducing strategic environmental assessment, reforming the environmental permitting system and strengthening air and water quality standards. Korea introduced the world’s second largest emission trading scheme, and remains one of the most innovative countries in terms of climate change mitigation technology. However, coal is set to remain integral to energy production, and road transport continues to be supported as the dominant form of mobility. Current energy prices and taxes do not reflect the environmental costs of energy production and use. The OECD Review Report in 2017 emphasizes that Korea needs to align its energy and climate policies to reduce GHG emissions to 37% below business-as-usual levels by 2030 [
12].
There are many investment projects currently being supported in Korea. Korea’s transition to a low-carbon economy is vital for its future prosperity. This is a core message of the OECD report in 2018, which provides 45 recommendations to help Korea pursue the implementation of green growth and strengthen environmental performance [
13]. To attain this end, the Korean Government incorporates foreign investment projects in its development of a National Green Strategy. The problem refers to considerations about risk identification for such investment projects, and the further development of waste treatment technologies and methods.
2. Environmental Policies and Waste Management Methods: Case Study of South Korea
Starting from 1978, the Korean Government actively enacted comprehensive environmental protection legislation and policies. Since that time, approximately every 10 years, the Korean Environmental Ministry and other government institutions—together with companies—work together to improve environmental policies and develop new technologies for waste treatment. In this section, we discuss the successful waste management methods and regulations in Korea.
2.1. Waste Management Methods and Environmental Policy in Industrial Production
Industrialized countries face the challenge of quickly and safely disposing of waste. Non-biodegradable and toxic wastes, such as radioactive residues, can cause irreparable damage to the environment and human health if they are not disposed of strategically.
Although waste management has been a concern for several decades, the main problem has been the enormous proportions of generated waste due to population growth and industrialization—the two main factors contributing to waste generation. Although some successes have been achieved in waste disposal methods, they are still insufficient. The challenge is to discover new and dangerous methods of waste disposal and use them.
Several global companies and local Korean companies (Samsung, CMG, Ovarro, Presona AB, Amandus Kahl GmbH & Co, Ion Science Ltd., Tana Oy, AMETEK Brookfield and others)—together with leading scientists—have developed a unique technology for processing solid waste [
14,
15]. The latest international developments in the field were combined into a single complex, including the unique technology of catalytic pyrolysis. The uniqueness of this technology is that the garbage is not burned whatsoever. Newly patented in 2013, catalytic pyrolysis makes it possible to completely recycle solid waste without careful sorting measures. It turns waste into valuable commercial products of a high quality and secondary raw materials. Based around the method, a recycling complex of a new type was created. However, the problems of risk-management and cost-analysis of these methods’ implementation and operation quickly arose. Nowadays, these companies try to invent new risk-analysis methods within the waste management process to reduce operational costs. The managers understand that project-management concepts help them understand certain basic requirements and cooperative management strategies.
Innovative technology deserves attention. The complex processing of solid industrial waste in a vortex air-mineral flow—which is based on in-depth study of the chemical, mineral composition and technological properties of the secondary raw materials, and is an individual solution for each type of industrial solid waste with maximum processing efficiency—eliminates the use of water and chemical reagents.
Industrial waste, as it turned out, can be used as a secondary resource in various industries, especially in the production of building materials, products and structures. The main tasks in the field of processing industrial waste should be aimed at improving existing processes, creating and implementing the latest technology. It is necessary to develop and implement measures aimed at implementing waste directly in the manufacturing process.
There are six effective waste disposal methods in South Korea which foreign and domestic companies prefer to venture into:
The prevention or reduction of waste: the widespread use of new or unnecessary products is the main reason for the generation of unverified waste. Rapid population growth necessitates reusing products or the judicious use of existing products, as, otherwise, there is a potential risk that people may suffer from the harmful effects of toxic waste. Waste disposal should also take a formidable form. On a personal and professional level, a conscious decision must be made to curb the dangerous increase in waste.
Recycling: serves to turn waste into products of its genre through industrial processing. Paper, glass, aluminum and plastic are typically recycled. The environmentally friendly reuse of waste instead of adding it to nature. However, the processing technology is quite expensive.
Incineration: incineration involves the incineration of waste, turning it into basic components, and the heat generated is then used to generate energy. Various gases and inert ash are common byproducts. Pollution is caused in varying degrees, dependent on the nature of the waste burned and the design of the incinerator. In 2019, Claborn said that using filters can check for pollution. Waste incineration is relatively inexpensive, and waste is reduced by about 90% [
16]. Nutrient-rich ash obtained from burning organic waste can contribute to hydroponic solutions. Using this method, you can easily get rid of hazardous and toxic waste. The extracted energy can be used for cooking, heating and supplying energy to the turbines. However, strict vigilance and due diligence should be observed to check for the accidental leakage of micro-level contaminants—such as dioxins—from waste incineration lines.
Composting: involves the decomposition of organic waste by microbes, allowing waste to accumulate in the pit for a long period of time. In 2018, Freeman suggested that nutrient-rich compost can be used as plant manure [
17]. However, the process is slow and takes up a significant amount of land. Biological processing significantly improves soil fertility.
Sanitary landfill: This is a landfill for waste. The base is made of a protective lining, which serves as a barrier between the waste and groundwater, and prevents the leaking of toxic chemicals into the water zone. The layers of waste are compacted and then covered with a layer of earth. Non-porous soil is preferred to reduce vulnerability to the accidental leakage of toxic chemicals. In 2017, Wackernagel M. et al. said that landfills should be established in areas with low groundwater levels and away from flood sources. However, a sufficient amount of skilled labor is required to maintain sanitary landfills [
18].
Disposal in the ocean/sea: waste, usually of a radioactive nature, is discharged into the oceans away from the active human habitat. Nevertheless, environmentalists dispute this method, since it is believed that such an action means death for aquatic life, depriving ocean waters of its natural nutrients.
There is a three-tier approach to assessing the risk associated with air and water emissions from waste management facilities. With this approach, an acceptable level of protection is provided at all levels, but with each progressive level, the level of uncertainty in the risk analysis decreases [
19,
20,
21,
22]. Reducing the level of uncertainty in risk analysis can reduce the level of control required by the waste management unit (if necessary for the site), while maintaining an acceptable level of protection. An enterprise performing a risk assessment incurs higher costs associated with a more complex risk assessment in exchange for greater confidence and potentially lower construction and operating costs. The advantages and relative costs of each tier are outlined below in
Table 1.
We try to solve these practical problems associated with conducting an assessment of the risk of waste management in an organization, and offer a multi-level structure that supports the training path necessary for adaptation, allowing organizations to optimize their resources for adaptation, systematically increase the knowledge base on waste management, and develop targeted interaction strategies.
2.2. Waste Management Regulations and Environmental Policies in South Korea
Currently, the regulatory regime for environmental protection in South Korea consists of legislative acts, executive decrees, ministerial decrees and regulatory acts related to the general environment, including:
Nature conservation.
Preservation of air quality.
Preservation of water quality.
Water supply/Sewer management system.
Recycling/Waste recycling.
Green growth.
The basic framework is laid in the Framework Act on Environmental Policy (FAEP), which contains the main objectives of environmental policy, including pollution prevention and natural resource management for sustainable use. To create such a sustainable waste management system, Korea went through many regulatory improvements and discoveries, which are presented below [
23,
24,
25,
26,
27].
In 1995, a volume-based waste disposal system was introduced, which is a waste containment system that uses the principle of payment for emissions. This system, which is representative of market incentives in Korea, represents a shift from the old system in which a fixed fee was charged regardless of the volume of waste disposed, to a system in which a proportional charge is applied to the volume discharged. As reported, this provides an incentive to reduce discharge and increase processing. In addition, a Promotion of Installation of Waste Facilities and Assistance Law was issued in 1995 to related areas in order to prevent the NIMBY phenomenon (not in my backyard) due to the installation of incinerators, and also to help resolve social conflicts through means such as relief projects for affected communities [
28].
In the 2000s, the foundation was created for a society of resource recycling. According to this master plan, the waste was not just recycled, but recycled as a resource. Korea is currently pursuing a “Zero Waste” policy that seeks to use waste as a source of resource, in addition to minimizing waste generation, which was emphasized by the authors of [
29].
Since the late 2000s, a reduction in greenhouse gases has been necessary due to the rapid increase in prices for resources and energy, as well as global warming. Therefore, the government emphasized the need to restore resources and energy from waste. In September 2011, the Korean Ministry of the Environment developed the First Framework Plan (2011–2015) for the management of resources, to form the basis for waste management and thereby promote green growth aimed to at encouraging the effective societal dealing with resources (without waste) [
30]. In addition, the measure to facilitate the transition to a resource circulation society (2013) facilitates the collection and transportation of recyclable resources through the free collection of large household electronic waste, the consolidation of the sorting system, and the expansion of equipment installation. Waste energy utilization facilities and other similar complexes are the foundations of a waste recycling society [
31]. The creation of a market for processed products and support for their industries was also announced.
Currently, intensive advertising and educational programs are beginning to educate the population on how to classify recyclables and use designated garbage bags, and, more importantly, to educate the public on the purpose and significance of waste reduction [
31,
32,
33]. Due to difficulties in monitoring the levels of flies in rural areas, residents are not required to take out the trash in specially designed trash bags. Instead, public trash and recycle bins were installed in rural areas, and the fees are shared among all residents of the community. Local officials noted that low-income people were offered appropriate assistance to alleviate the burden of paying for MSW. It is interesting to compare waste quantities in different Asian countries; many of these countries employ similar approaches to waste treatment (
Table 2).
The Framework Act on Resource Circulation (FARC) was adopted in 2016 to form the basis for implementing this policy; the Korean government has been applying it since 2018 [
33]. The country intends to transform the economic structure, focused on mass production and mass waste, into a much more stable and efficient, resource-oriented structure at a fundamental level. The provisions of this framework can be divided into three categories, each of which creates a framework for the circulation of resources, stimulates the circulation of resources and supports the processing industry. It introduces new waste management related programs such as the Recyclable Resource Recognition Program (RRRP), Resource Circulation Performance Management Program (RCPMP), Waste Disposal Tariffs, etc. [
33,
34]. The government expects to obtain economic, environmental and social benefits by preventing environmental pollution, but is also aware of the fact that the country needs to make further efforts to change the paradigm of its waste management policy.
2.3. Waste Management System in Samsung Electronics Corporation
To protect the environment in times of crisis and make more efficient use of resources, Samsung Electronics is working to focus on a circular economy. Going beyond the normal practice of single-use resources and throwing them away, the Samsung Corporation is working to ensure that resources are reused through recovery, reuse, and disposal at the end of the product’s life. By minimizing the type of materials used and optimizing the assembly method, the company has developed production methods that minimize the use of resources [
35]. By collecting products that have expired, they acquire valuable materials. Through this circular economy, the Samsung Corporation is reducing the amount of natural resources it requires, reducing greenhouse gas and pollutant emissions from waste incineration, and preventing soil and groundwater pollution from landfills.
Samsung responsibly has to collect and recycle old, unwanted or nonworking electronic products in the U.S.; therefore, the company has to develop new and adaptive programs to manage the recycling needs of its business partners. This is not always easy to manage—but the reasons behind it are twofold:
- −
Firstly, to provide a stable service for customers (no matter where they are located in the U.S.), so there is the task of using such a project to provide an easy way for customers to responsibly recycle their products.
- −
Secondly, to abide by the Samsung Corporation’s commitment to responsible recycling.
- −
The problem is that all these projects require critical analysis, risk-management efforts and cost-analysis. Unfortunately, these were not initially conducted, and the company now has severe restrictions to its waste-management strategies.
The best way to conserve resources is to make quality, durable products. The Samsung Corporation extends the life of products by making an additional contribution to the circular economy and resources by increasing the longevity of its products prior to release, carrying out a series of rigorous reliability tests, and providing convenient repair services through their global service centers, including ongoing software updates.
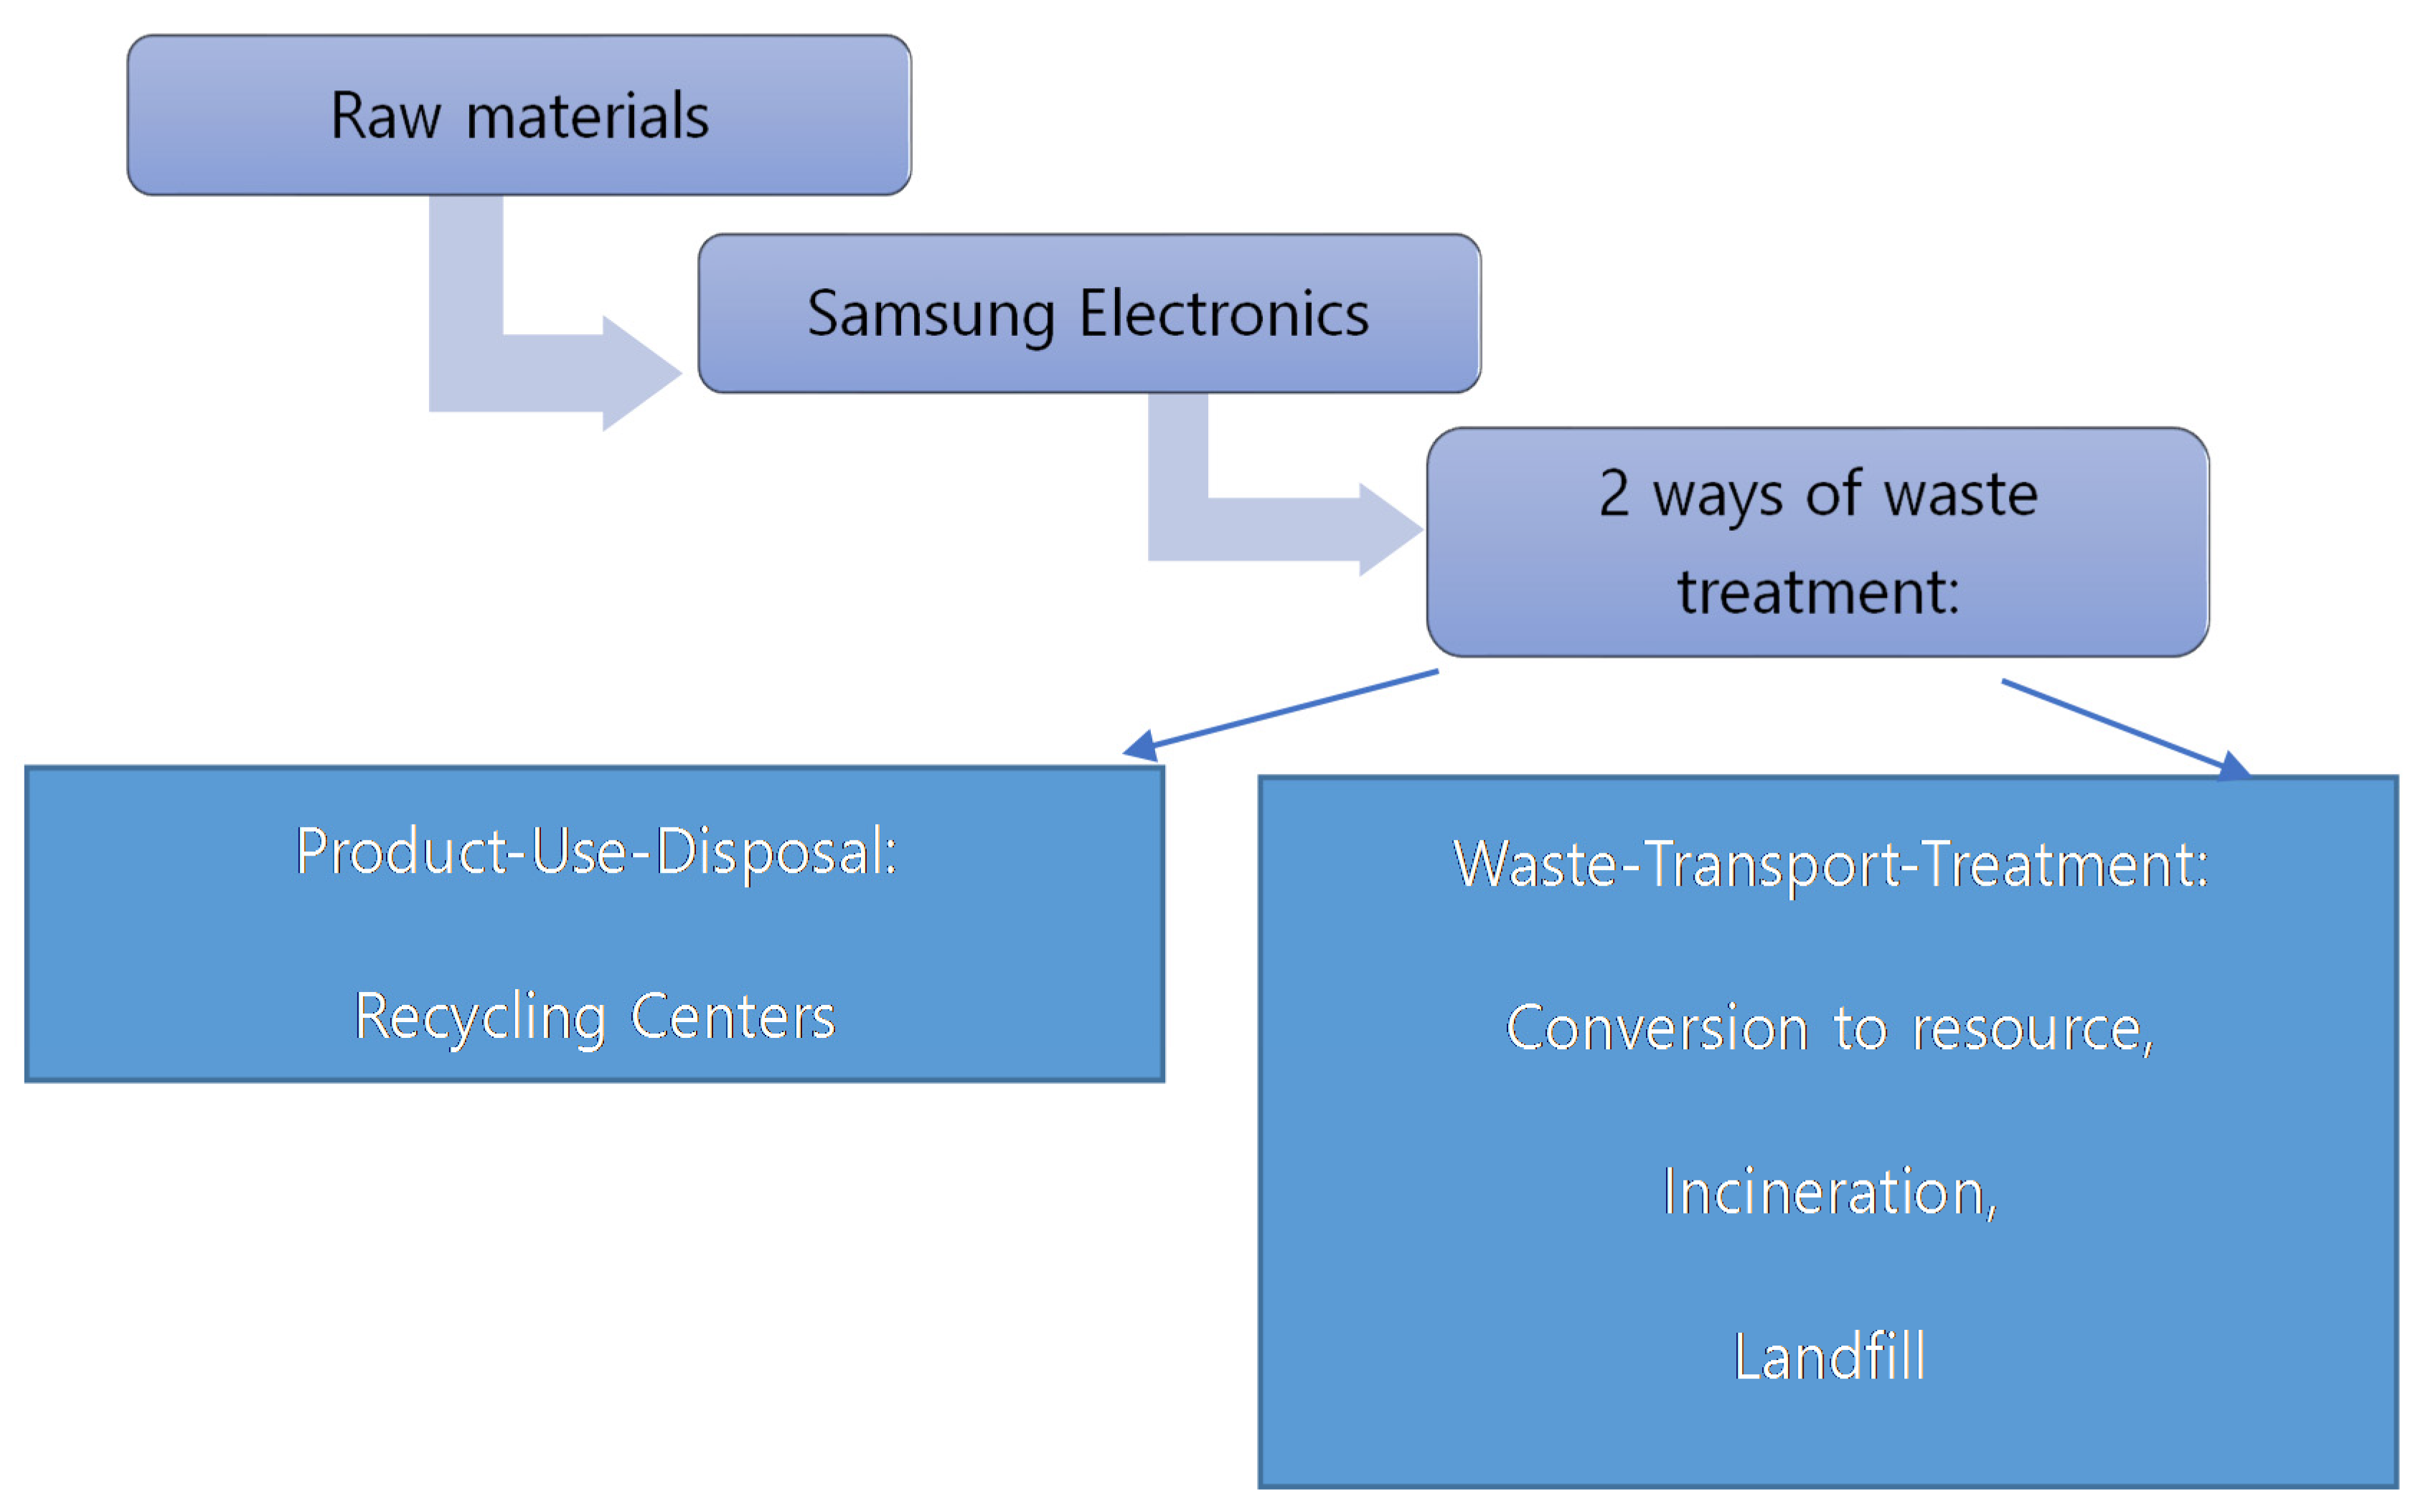
The amount of waste generated during the product development and manufacturing processes is significant. For complex electronic devices with numerous components, even the packaging is thrown away for every part. At the end of the project, many of the pilot products, which are used to improve the product, are lost. If all of them are burned or buried, the environment will be polluted and resources depleted. By processing waste through an environmentally responsible recycling company, the Samsung Corporation has increased the amount of recyclable materials it utilizes, and achieved its overall waste recycling goal of 95% in 2016—four years earlier than was planned (
Figure 2).
Since 2016, Samsung Electronics has been continuously implementing the Galaxy Upcycling Project, which turns old Galaxy smartphones that are no longer in use into new IoT devices. Using such IoT devices, for example, pet feeders and doorbells, etc., the company was able to improve the quality of life of its consumers and, at the same time, protect the environment.
In 2018, the company completed a project to develop a low-level ophthalmoscope using Galaxy Upcycling technology as an appropriate technology [
36]. In collaboration with the Yonsei University Health System Design Specification—which Samsung Electronics supports as part of Tomorrow’s Decision Program (based on competition events)—ophthalmoscopes have been developed that can be used in developing countries where people cannot receive proper medical treatment because of the difficulty in distributing expensive diagnostic devices. As a result, many people in developing countries are expected to develop blindness. In addition, the company has a plan to expand the use of technology for cervical diagnostic devices—among other things—and promote better health in developing countries. The Galaxy Upcycling plans offer a variety of concepts that go beyond the health sector to reduce resource waste in collaboration with institutions that seek to achieve sustainable development with limited resources.
So, the Samsung Corporation has put forward many proposals to invest in the Korean system of waste management. However, these proposals should have business planning directions and risk-management support. Even if Samsung Engineering offers a full range of EPC services for a variety of industries, from hydrocarbon offshore facilities to wastewater treatment, from initial financing through operation and management, many consulting companies will try to develop an effective financial and risk-preventive model for it. EPC stands for “Engineering, Procurement, Construction”, and is a prominent form of contracting agreement in the construction industry. In this case, we want to present the waste treatment investment project’s evaluation approach.
3. Methods
All national and foreign enterprises in Korea, to one degree or another, are engaged in investment activities in waste processing; in addition, the decision-making associated with such investment in waste processing involves various complex factors, including limited financial resources, the type of investment, and the possible losses that an enterprise may suffer if the project subsequently turns out to be less profitable or if it fails completely for unforeseen circumstances [
37,
38,
39,
40]. Thus, risk management allows us to confirm the viability of decisions for the project and reduce the likelihood of adopting an ineffective or unprofitable project.
In light of the discussions held so far, we consider the following research questions (RQ) in our study:
RQ1: What is the relevance of investment projects in South Korea for reducing the environmental impact of industrial production?
RQ2: What are the positive effects and shortcuts of the application of multi-criteria approaches for the evaluation of waste processing investment projects with uncertainty consideration?
RQ3: What are the risks and disadvantages of multi-criteria approaches for the assessment of waste treatment investment projects?
The remainder of this paper is organized as follows: The current trend of waste management in South Korea is discussed in Introduction
Section 1. Environmental policies and waste management methods are discussed in
Section 2.
Section 3 describes the method, within which we consider the analysis of the feasibility and management an optimal investment project in a risk environment based on the Pareto model.
Section 4 presents the results and discussion, which present various possible calculations within the framework of the discussed model. These calculations prove various possible situations for applying this method, as well as the possibility of using other performance indicators with our method. In addition, various approbations of this method in future research projects are discussed. In conclusion,
Section 5 presents the main results of testing the methodology for evaluating investment projects in the field of waste management, describes our findings and predicts possible future discussions in this area.
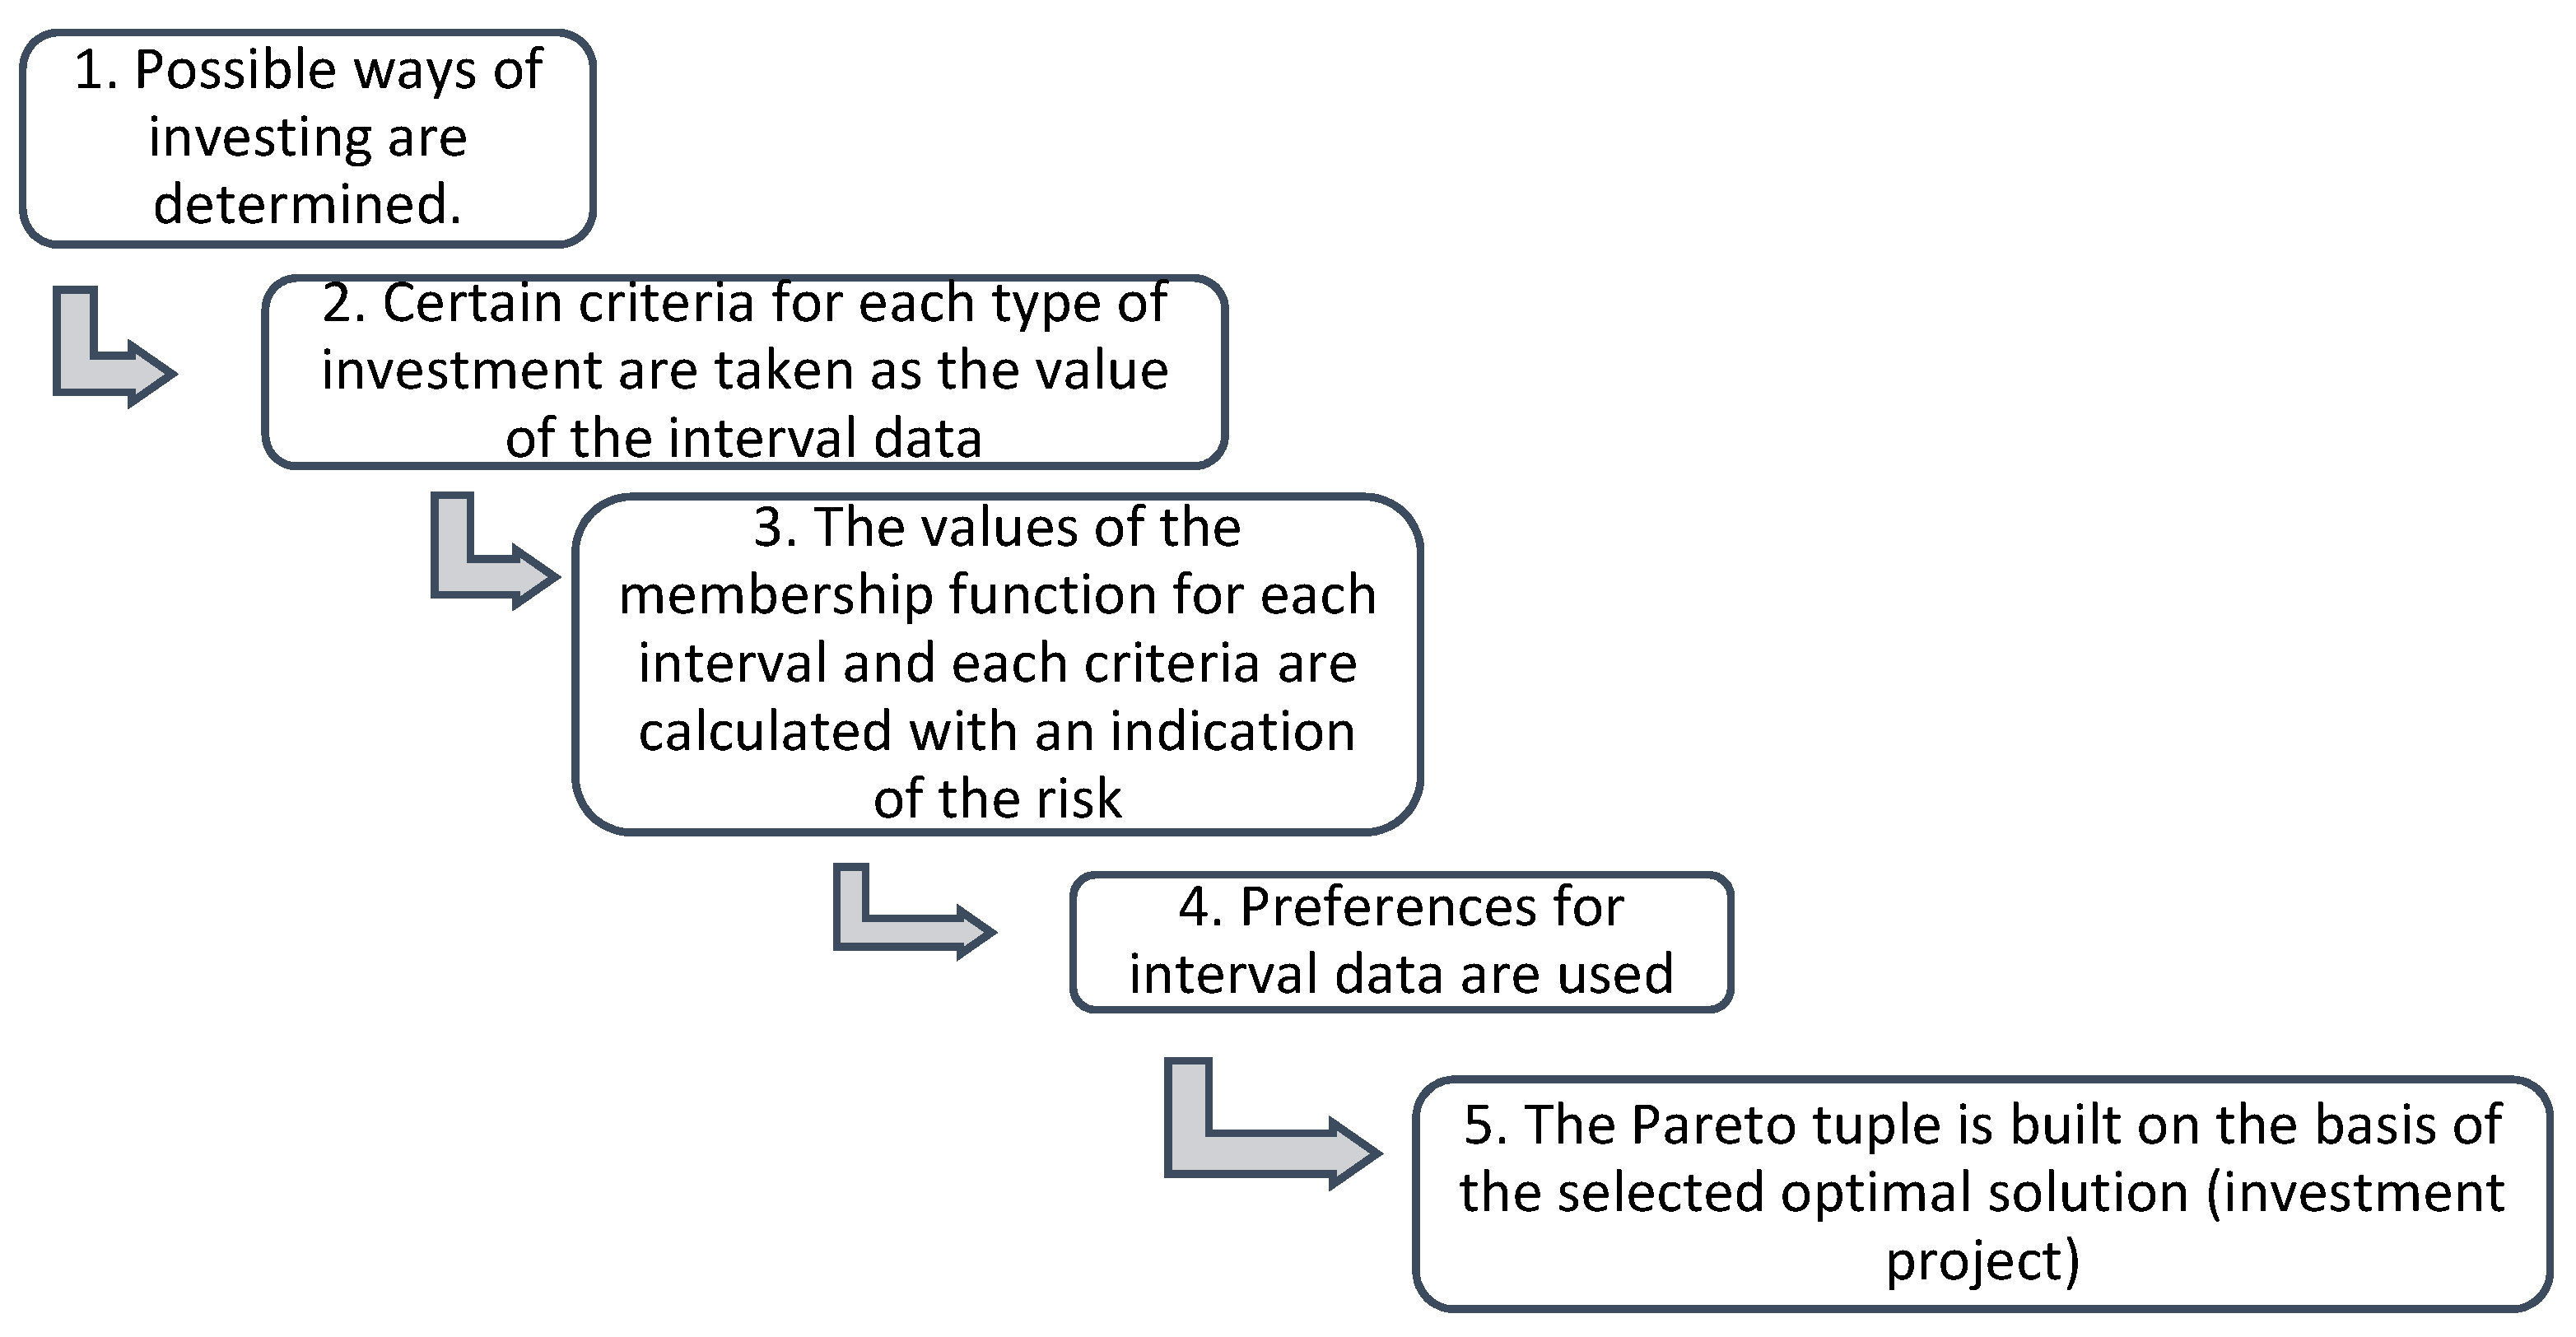
In this research, we continuously develop this approach and take into account the risk of multivariate estimation. Vedernikov and Mogilenko in 2011 [
41] suggest that uncertainty has a number of factors that affect the results of actions. Actions in this case cannot be clearly defined, and questions about how to determine the degree of possible influence of these factors on the results are accumulated. Therefore, when determining methods for industrial waste management, and methods of investing in the development of processing technologies are considered, it is important to identify the possible risks and damages from the effects of poorly predicted external factors in detail. In doing this, it is possible to carry out a scenario analysis of market risks, as well as assess the possible effects of new approaches in industrial waste management systems. This approach allows us to take the assessment of the aggregated scenario of factors into account, which enables us to represent various types of risks as components of the analysis [
42,
43,
44,
45]. This is shown in
Figure 3.
In 2013–2017, Rodionova et al. began to analyze an integrated approach to making investment decisions, including the calculation of NPV, DPP and IRR for each alternative [
42,
43,
44]. In addition, this approach is specific, since it takes the uncertainty of the external environment into account [
45,
46,
47,
48]. For this, expert assessments of the probability of damage from the implementation of the project and the intervals of fluctuations of the three criteria are used to assess the effectiveness of the investment project.
IRR measures the effectiveness of capital investments; thus, this indicator partially allows a comparison between investment projects with different capital investments and terms of implementation. The typical methodological recommendations for calculating the effectiveness of investment projects solve the problem of selecting from alternative projects by using the NPV indicator for risk evaluation. This method is useful for certain cases, such as efficiency comparison within existing external circumstances. This recommendation helps avoid conflict of interests in terms of which indicators to use. We suggest to include them all, as they each reflect different aspects (e.g., uncertainty, market situation, project capacity, etc.) of the economic system. Each of these aspects is important for the formation of criteria in the economic system.
There are four primary reasons that justify the use of multicriterial (MCA) methods; these are listed as follows:
- (i)
MCA methods allow the investigation and integration of the interests and objectives of multiple actors, because both quantitative and qualitative information from every actor is considered in forming the criteria and weight factors.
- (ii)
These methods address the complexity of a multi-actor setting by providing output information.
- (iii)
These are well-known and commonly used methods for the assessment of investment alternatives. Moreover, different versions of these methods are developed for specific contexts.
- (iv)
MCA methods allow for the objectivity and inclusiveness of the different perceptions and interests of actors.
Because Cost Benefit Analysis (CBA) is dependent on the time at which it is being performed, it is more appropriate as an ex-ante instrument; in contrast, the multi-criteria approach can be adopted for both ex-ante and ex-post assessments, which is an advantage of the MCA. Considering the dimensions of the project or the policy to be evaluated, the characteristics (evaluative standpoint, decision-relevance, comparability, verifiability, accountability, and scientific progression) of CBA and MCA render the dimensions of the project useful. In particular, on a large scale—i.e., when public and private costs are consistent—the CBA approach is necessary, whereas MCA appears to be useful on a small-scale, where all the stakeholders can be considered individually and can be consulted or express informed opinions on their priorities.
Based on the discussion thus far, it is necessary to use methods for the evaluation of the effectiveness of alternative investment projects that are based on multi-criteria selection. However, the known methods for multi-criteria selection are still not considered in the commonly used methods that can solve the problem of selecting the optimal investment solution (Roy, 1976). In particular, the selection of an effective investment project involves the best combination of values based on the analysis of disparate indicators characterizing the investment project.
We assess the variety of values for all components of the model, taking into account the risk associated with alternative waste treatment investment projects. Intervals are determined by both the absolute values of indicators and by estimates [
49,
50,
51,
52].
To evaluate the effectiveness of alternatives and to select the most preferable, our method is based on the built-in interval preference ratio (IPR).
Let us suggest that I = {Iα, α = 1…n} is a pool of types of waste treatment investment projects; Ki(Iα) = [Ai(Iα); Bi(Iα)] represents the standards for assessing the effectiveness of every investment project within the interval type; i = 1…r, r is the total range of evaluation criteria; Ai(Iα) and Bi(Iα) are the area units of the lower and higher bounds of the interval analysis; K (Iα) = {K1 (Iα), K2(Iα), …Kr (Iα)} = {[A1(Iα); B1(Iα)], and [A2(Iα); B2(Iα)], …[Ar (Iα); Br (Iα)]} are the direction indicators of every waste treatment investment project’s effective results. We tend to introduce the notation II for the set of Pareto-optimal information processing IP (II⊂I), with the amount of parts γ ≤ n meeting the main condition IIm1 > IIm2 > …IImy, mj = 1…y. Then, the matter may be developed as follows to construct the economic expert tuple of thought of the variants of waste treatment investment flows, the parts of which satisfy one in all the conditions: Ki(Iyj) = min[Ki(Iα)], Iyj ∈ II or Ki(Iyj) = max[Ki(Iα)], Iyj ∈ II.
We also consider that if the exponent is a scalar amount, it may be mentioned as a degenerate interval with coincident ends
Ai(
Iα) =
Bi(
Iα). This concept was presented by Orlovsky in 1981, Serguieva and Olson in 2014, and Stoyanova in 2006 [
53,
54,
55,
56].
There is an ambiguity in the choice of standards and the form of factors that the unit considers, due to the quality of the question of assessing the effectiveness of waste treatment investments. It must be assumed that the person responsible for making decisions (usually the project manager) does not have a transparent opinion about the preferences of the analyzed variants. Within the scope of the indicators of victimization, the values of the intervals and the qualitative difference of the measured values—which are expressed in the fact that the difference in the units of assessment—are built, it is convenient to check the options supported by the IPR. This concept was presented by Minakova L. V. and Anikanov P. V. in 2013 [
57].
Let
mi be the breadth of the estimates’ interval for the
i-th criterion. Consistent with fuzzy methods—which were discussed by Parrino et al. in 2014, Roy in 1976, and Saaty in 1990—the interval relation of preference
Rи on the set
Iα is the set of the Cartesian product
Ik × Il, (
k = 1,
…n,
l = 1,.
..n,
k ≠
l) [
58,
59,
60]. For the characteristic of the set of the Cartesian product, we should take the interval membership operation
μиKi (
Ik,
Il):
Ik × Il→[−1;1] into account.
Each valuable measure of the membership function μиKi (Ik,Il) estimates the degree of injury and gain in recognizing position of Ik as the dominant variant Il supported by the criteria Ki.
The degree of privilege of the choice
Ik over the choice
Il, supported by the interval criterion
Ki, is diagrammatically presented by the membership function
μDиKi (
Ik,
PI), which determines the quantitative relation of the strict interval preference.
For comparison, it is vital to establish that the alternative
Ik is not undermined compared with the
Il alternative, which would be a mistreatment of the membership operation.
In this case, for the criterion of the
i-th interval criteria, the approximation of the alternative
Ik to the Pareto optimal variant is determined by the index of the membership function for the set of non-privileged alternatives [
61,
62].
Wang et al. in 2009, and Zare et al. in 2016 [
63,
64] suggested that the indicator NPV is based on the quantity of cash flows at a certain time and the discount rate
r:
The discount rate usually uses the risk-free interest rate or interest rate for investment projects with a similar degree of risk, as well as the market and industry coefficient of efficiency for capital investments. This criterion underlies the choice of an environmental management project with a maximum value, or with the same value of r. It is known that NPV is entirely dependent on the discount rate; therefore, a poor-quality and unverified forecast of the discount rate definitely leads to risky management decisions. For example, a good project with high-quality technologies, but with high costs, can be rejected, and a project with lower costs but low-quality technologies can be accepted for discussion and subsequent implementation. The refinement of the values of the NPV interval allows us to determine that the maximum possible determining factor for the NPV criterion is the maximum value.
In addition, DPP is represented as a time interval; the optimal condition for this criterion should correspond to its minimum value. Furthermore, IRR is presented as a percentage and is defined as the value of the interval; in accordance with this criterion, the waste treatment investment project that matches the maximum value is selected.
4. Results
Risk assessment is predicated on the interval values in the estimates. The presumption is that the rate of interest r may be a variable, and for that the likelihood of a random event may be found, NPV (r, t) > 0, P (NPV (r, t) > 0) = P (r < IRR) = F (IRR). Here, F (x) = P (r < x) is the distribution operation of r; IRR is the internal rate of pay back, that is obtained as an answer of the equation NPV (t, r) = 0. For various r, it is possible to ascertain the likelihood that the waste treatment project will not pay off at time t; then the estimates of victimization are obtained in the analysis procedure. Here, we tend to conduct a risk assessment for the project supported by the explained methodology for three doable and inevitable market conditions; those conditions are then evaluated by consultants, and an evaluation of the probability of every of them is enforced. It ought to be noted that the chance assessment criterion for a waste processing investment project needs to select the most effective possibility, supported by the minimum worth of the standards.
Given the well-known theoretical ideas, the values of
mi are selected as the most allowable values for the considered option (standard). The initial knowledge necessary for the calculations and investment analysis are presented in
Table 3. Three different investment projects are presented (
I1—investment in landfill production;
I2—investment in industrial waste recycling R&D;
I3—investment in the implementation of green technologies).
The risk evaluation process is presented using interval values in grade system. Assuming that the rate of interest r could be a variable quantity for which the chance of a random event is found, NPV (r, t) > 0, P (NPV (r, t) > 0) = P (r < IRR) = F (IRR). Here, F (x) = P (r < x) is the disseminative operation of r, IRR is the internal rate of pay back, which is suggested as an explanation of the formula NPV (t, r) = 0. For variety of r, it is important to determine the likelihood that the investment project will not be profitable at time t. Then the results will be determined through the evaluation analysis procedure. This study assesses the risk of an industrial waste management project using the aforementioned methodology for three defined and predicted market conditions, and an expert assessment of the likelihood of each of market condition is introduced. It is important to indicate that the risk assessment criterion for a waste processing investment project requires the selection of the best option based on the minimum value of the criteria.
Based on known theoretical models,
mi values are defined as the maximum allowable indicators for the criteria under consideration. The initial data necessary for calculations on the analysis of investment projects are presented in
Table 3.
Taking in consideration Equation (1), we achieve the appraisal of the membership operation μиKi (Ik,Il) for each pair of variants for each criterion and calculate their estimated matrices. Thus, Equation (1) can be expanded as:
µuKi(Ik,Il) = ([min{Ai(Ik) − Ai(Il);Bi(Ik) − Bi(Il)};
max {Ai(Ik) − Ai(Il);Bi(Ik) − Bi(Il)}])/mi
and be denoted by
Cikl = min{Ai(Ik) − Ai(Il); Bi(Ik) − Bi(Il)}/mi,
Dikl = max{Ai(Ik) − Ai(Il);Bi(Ik) − Bi(Il)}/mi
Furthermore, the interval membership function for the
Il,
Ik takes the following form:
Hence, if the relation |Ckli| = Dkli is true, then the values μиKi (Il,Ik) μиKi (Ik,Il) coincide.
Based on Equation (2), we take into account the preference frequency for each pair of options for each indicator using the value of the membership operation μDиKi (Ik,Il), and place them in the evaluation matrices. Using Equations (6) and (7), we move the calculations into a simple method.
Thus,
μDuK1(
Iα) =
| - | −0.4 | −0.35 |
| 0.4 | - | 0.05 |
| 0.35 | −0.05 | - |
μDuK2(
Iα) =
| - | −0.1 | −0.3 |
| −0.1 | - | −0.4 |
| 0.3 | 0.4 | - |
μDuK3(
Iα) =
| - | 0.1 | 0.03 |
| −0.1 | - | −0.06 |
| −0.03 | −0.06 | - |
μDuK5(
Iα) =
| - | −0.2 | 0.05 |
| 0.2 | - | 0.25 |
| −0.05 | −0.25 | - |
μDuK6(
Iα) =
| - | −0.1 | 0.05 |
| 0.1 | - | 0.25 |
| −0.05 | −0.25 | - |
From Equations (3) and (4), we achieve the valuable measures of the membership function μNDиKi(Ik,Il) for each pair of options for each criterion, and assemble the membership function valuable measures for the set of non-privilege options μDKi(Ik):
μD*K1(Ik) = {0.6, 1, 0.95};
μD*K2(Ik) = {0.9, 1, 0.6};
μD*K3(Ik) = {1, 0.9, 0.93};
μD*K4(Ik) = {1, 0.8, 1};
μD*K5(Ik) = {0.9, 0.75, 1};
μD*K6(Ik) = {0.95, 0.75, 1}.
After analyzing the values of
μD*Ki(
Ik), we can conclude that the investment project
I2 is the best option based on the criteria
K1(
Iα) and
K2(
Iα), the investment project
I1 is the best option based on the criteria
K3(
Iα) while it is possible to perform risk management in a pessimistic scenario of market development, and investment project
I3 is optimal in terms of risk, based on the considered set of options for waste processing investment projects [
65,
66,
67].
Savchuk in 2007, and Syroezhin in 1980 [
68,
69] suggested that in order to determine the best preference in this set of waste management investment projects, it is necessary to determine the vector preference using some previous studies in this area (membership functions
μD*Ki(
Ik) determine the degree of proximity of variant
Ik to the Pareto-optimal variant of an investment project using the
Ki criterion; this justifies the use of special criteria instead of traditional factors, indicating the importance of the indicator. The next step is to compare the variants
Ik and
Il in pairs, calculate the values of
μD*Ki(
Ik), and introduce the subsets
Ikl+,
Ikl−, and
Ikl= for optimal, pessimistic and realistic values of
μD*Ki(
Ik) and
μD*Ki(
Ik), (where
i = 1...4;
k,
l = 1,... 3,
k ≠
l) of these variants, respectively. The next step determines the elements of the estimation matrix
C =
based on these conditions; this is shown in
Table 4.
The matrix is created considering the risk criteria; therefore, it is necessary to pay attention to the possibility of various risk conditions being weighted evaluated options of the matrix component.
Cklµ = (∑∗i = 1aiµD*ki(Ik))(∑*i = 1aiµD*ki(Ii))−1,
Then, we get the following matrix of preferences
C =
| - | 0.66 | 5.01 |
| 1.51 | - | 0.94 |
| 0.19 | 1.05 | - |
Using well-known theoretical methods and developing a methodology for evaluating investment projects, we introduce the indicators Gµl and Hµl, which denote the set of elements of the l-th column in C, the value of which is less than one, but greater than zero and more than one, respectively, and the exponent Cµkl max, which is equal to the indicator of the maximum value of the l-th column. It can be argued that Hµl represents the number of investment project options that dominate the l-th column. Furthermore, Gµl shows the number of investment project options that dominate the l-th column, and Cµkl max represents the maximum level of dominance of the k-th version of the investment project over the l-th column.
We include these indicators in the matrix, as shown in
Table 5.
According to the results of
Table 5, investment project
I2 turned out to be the best variable alternative with a minimum value of
Cµkl max. In this regard, the second version of investment design should be included in the Pareto tuple, but is excluded from the subsequent analysis. For this exception procedure, we delete the corresponding row and column in the preference matrix.
At the next stage, we analyze the other (above mentioned) options for investment design, and analyze them using the new matrix of indicators in a similar way.
As a result, the Pareto preference tuple can be denoted as II = {I2, I1, I3}. In this regard, the best alternative for the vector of the heterogeneous performance index is K (Iα) = {K1 (Iα), K2 (Iα), K3 (Iα), K4 (Iα), K5 (Iα), K6 (Iα)}. In the Pareto tuple of the three options considered, those criteria that characterize NPV—discounting for calculating DPP in the vector efficiency index—became preferable.
Based on
Table 5, the best alternative to an investment project with a minimum value
max is option
I2. Therefore, the second version of the investment project is included in the Pareto tuple and excluded from further analyses by deleting the corresponding row and the column in the preference matrix.
The remaining options are analyzed using the new matrix of indicators in a similar manner.
Finally, the tuple of Pareto preferences can be obtained as II = {I2, I1, I3}. Therefore, the best alternative for the vector inhomogeneous efficiency index K(Iα) = {K1(Iα), K2(Iα), K3(Iα), K4 (Iα), K5(Iα), K6(Iα)} should be recognized as the second variant. In the Pareto tuple of the considered variants, preference was expressed for the criteria characterizing the NPV and discounting the calculation of the DPP in the vector efficiency index.
So, to answer the research questions which were submitted in
Section 3, we consider these research points and describe them above to show the significance of this research:
- (i).
The proposed methodology for using interval values and assessing the effectiveness of investment projects in the field of industrial waste management gives experts new opportunities for the simpler and more accurate analysis of proposed opinions. In addition, uncertainties can be considered without additional statistic indicators.
- (ii).
This allows managers to evaluate various criteria in different environmental conditions and the influence of factors; furthermore, it allows reflecting on various aspects of the measured phenomena (in particular, the effectiveness of the waste processing investment project).
- (iii).
The proposed set of indicators may include an extended list of influential factors beyond those that are part of the project environment.
5. Discussion
Since Korea’s volume of waste is evidence of changing lifestyles in the midst of a trend toward a convenience-oriented life (single-use products, convenient goods, instant food, etc.) and an abundant capitalist socioeconomic environment (mass consumption/mass production), the current state of waste management in Korea is at a turning point, where a paradigm shift from a convenience-oriented society (single-use product society) to a society oriented toward resource conservation (resource-circulating society) is taking place [
71,
72]. Wastes have a close relationship with each country’s life and cultural patterns, as well as with changes in society, patterns of waste generation and treatment, thereof, change. A summary of the evolution of Korea’s system of legislations for waste management shows that this evolution has been taking place alongside the flow of developmental processes in Korea, and each developing country needs to introduce waste policies suitable for its current economic and social conditions. These policies should be supported with investment perspectives and based upon the development of technology and innovation [
73,
74,
75].
According to the well-developed support policies of waste treatment investment projects and new environmental regulations, the Korean Government expects to observe some effects in terms of the economic, environmental and social impacts of the Framework Act on Resource Circulation (
Table 6).
Waste treatment investment projects are needed to be classified according to the type of waste treatment and operational technology. Each investment project requires risk analysis, which should be evaluated. For further research, it is necessary to identify the correlation between risk type and used technology in waste treatment operations.
Risk-evaluation procedures are the importing starting points for waste management. A well-designed risk evaluation system presents a structured mechanism for searching for potential problems and creating judgements on the consequences. Assessing the risks of waste processing investment underpins the “suitable for use” approach adopted by the Korean regulatory mechanism and supports planning policy [
77]. The main goal is to decide whether there are any unacceptable risks to people or the wider environment—including industries. The risk evaluation process can be very detailed, particularly where risks are diversified. For the discussion of investment in waste recycling, there are a range of specific technical approaches for different contaminants and circumstances.
However, these all broadly fit within a general process that can be seen as a tiered approach. Each tier is applied to the case circumstances, with an increasing level of detail information required by the assessor in progressing through each tier [
78].
There are three tiers, or steps:
Basic risk evaluation.
Risk assessment using generic criteria and assumptions—where a contamination concentration is compared against a generic Soil Guideline Value (SGV).
Risk assessment using specific criteria and assumptions—where a detailed, site-specific approach is used.
During the management of investment projects in the field of industrial waste management, it is important to determine the possible influence of various external factors on the result (market factors, production factors, technological factors, social factors, etc.). In this case, the degree of occurrence of a particular risk is determined and an initial assessment of risk is carried out. Depending on the likelihood of a negative event in the external environment of the investment project and the degree of negative influence of factors on its successful implementation, managers can use only one approach to assess risks, or conduct a multi-stage risk analysis. Usually it depends on the properties (complexity and degree of influence) of pollutants—some of them can be evaluated using common criteria; others may need to develop specific indicators for a more detailed and comprehensive risk assessment.


