1. Introduction
Over the past decades, quality has become a key topic not only in the area of industry, but it has also found its application in different sectors of services. A lot of attention is also paid to quality in the area of higher education, and nowadays it is possible to find a broad range of topics that are investigated from a practical perspective (
Willis and Taylor 1999;
Rodman et al. 2013;
Dicker et al. 2018), as well as from a scientific point of view (
Harvey and Williams 2010). Many concepts of quality in education, such as the Common Assessment Framework (CAF) and Education, European Standards and Guidelines (ESG), or International Agreement (IWA2) are built on a thorough identification and understanding of the requirements of “customers”. The question of who actually is the customer of a higher education institution was theoretically discussed in many debates in the past (
Svensson and Wood 2007;
Finney and Finney 2010). Currently, the prevalent view states that the “customer” of higher education institutions is someone who is using their products—i.e., knowledge acquired there (
Voss et al. 2007). The primary (direct) customer of a higher education institution is, therefore, a student and secondarily (indirectly) his employer (
Chapleo and Simms 2010;
Miller et al. 2014). Students have often been the subject of investigation in relation to the quality of education (
Coates 2005;
Voss et al. 2007), and attention has been paid not only to the identification of their requirements and expectations, but also to their understanding. The motive for choosing this research subject is the fact that organizations providing educational services are currently facing a big challenge related to the competitiveness of their offer. In a market economy which enables intensive development of educational facilities, the fight for each client takes place on many levels: the diversity of services offered, the place and form of their conduct, the quality of the message, and interpersonal relations. It should also be noted that in the catalog of service types, education is particularly important due to its specificity. This is because the learning process as such takes time, but its effectiveness can be assessed only after the fact (
Paskin 2013). It is also important that in every developed country the state is the main provider of educational services. This is related to the important role that education plays in shaping the development processes of countries (
Swanson 2011). The quality of educational services affects virtually all aspects of social life in the long term (
Ginns et al. 2007). Therefore, developing the right quality of educational service is extremely important and essentially involves shaping and modifying its individual features. Each of them can be treated individually and perceived by a given client. In order for the client to be fully satisfied, there is a need to constantly measure the quality of these services, allowing for continuous improvement of the educational process. According to the authors of this paper, the Kano method can significantly facilitate the recognition of university clients’ requirements. This method is based on the assumption that the features of a specific product, including services, are multidimensional and affect the level of customer satisfaction to varying degrees. Some features of the product/service have an impact primarily on creating satisfaction, while others contribute to causing dissatisfaction. Therefore, understanding what the client expects allows the management to focus on developing the right characteristics of the educational service. This approach contributes to a more comprehensive management of the organization’s resources, which can be transferred to where they are needed at any given moment to best serve the needs of the client (
Gajewska and Zimon 2018;
Woźniak and Fill 2018).
Despite the fact that in more technical disciplines the Kano model has been used quite successfully, its potential has not been appreciated enough in the area of education. However, the Kano model is very useful for a better understanding and prioritization of the requirements and expectations of students towards the school. This article aims to fill this particular research gap.
1.1. Kano Model Principles
In the 1980s, a group of Japanese scientists around professor Kano noted that implementation of certain requirements of customers affected only their satisfaction, while implementation of other requirements affected only their dissatisfaction. This led the researchers to create a methodical procedure for the categorization of the so-called “attractive” and “must-be” quality (
Kano et al. 1984). The attractive quality attribute/requirements included requirements that do not result in satisfaction or dissatisfaction if they are not fulfilled (the researchers based this on Herzberg’s theory which does not consider satisfaction as the opposite to dissatisfaction). An example for such a requirement is the candy on a pillow in a hotel room—if the candy is there, customers will be pleased; if it is not there, customers will not be affected in any way because they did not expect it. An example of the must-be attribute/requirements is the ability to lock the door of one’s hotel room. If customers are able to lock the door, it will not affect them, because they consider that a matter of course. But if they cannot lock the door, they will be very displeased.
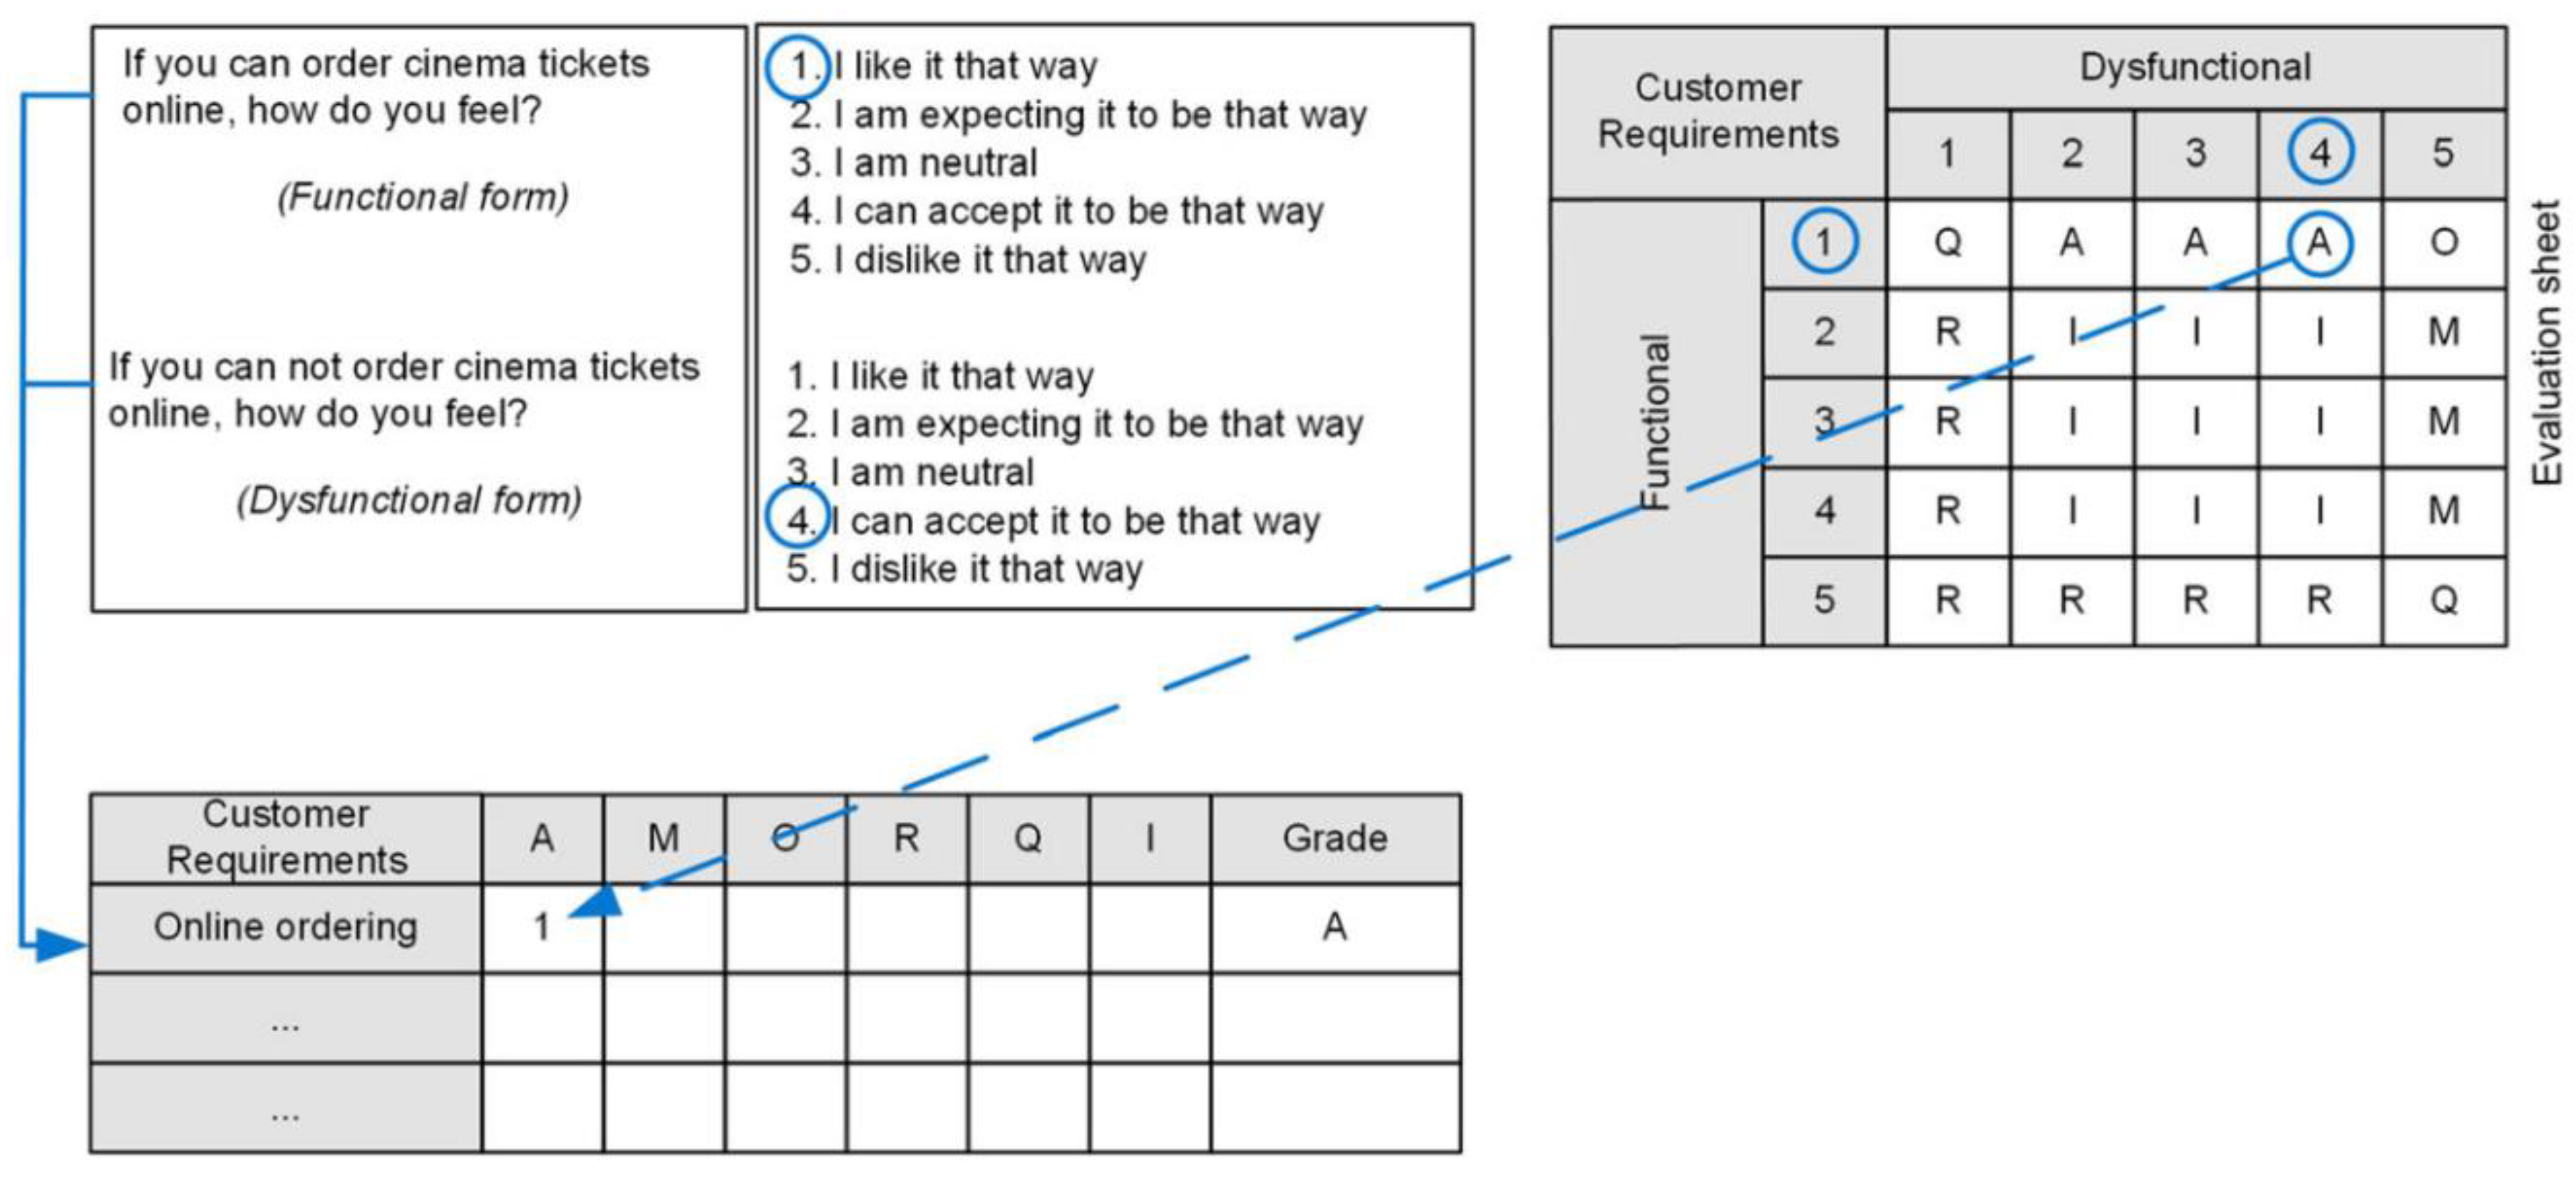
In order to be able to categorize requirements or quality attributes into these groups, it is necessary to use the Kano questionnaire. It contains a pair of questions for each requirement. One question is worded positively, for example: How would you feel if the door of your hotel room could be locked? There are five options for the respondent, ranging from very satisfied to very dissatisfied. These questions enable us to find out how the respondent would feel if we met this specific requirement. The second question is worded negatively, for example: How would you feel if the door of your hotel room could not be locked? Again, the respondents choose an answer on a scale ranging from very satisfied to very dissatisfied. This question shows us how not fulfilling the requirement affects the (dis)satisfaction of the respondent. In total, there are 25 possible combinations of responses to a positively and negatively formulated question (5 × 5). An Evaluation Sheet which contains all the 25 combinations is used to include the requirement into a specific category. The schematic procedure of the categorization is provided in
Figure 1.
Every requirement thus has to be investigated from both perspectives—if it is met, and if it is not met. This means that the number of questions in the Kano questionnaire is always twice the number of analyzed requirements. In this way, the abovementioned procedure results in categorization of every investigated requirement of every respondent. The views of respondents may, of course, vary, and it may well happen that the same requirement is perceived as attractive by one respondent, and as must-be by another. In such cases, the resulting type of requirement is decided on the basis of the most numerous category.
1.2. Types of Requirements and the Method of Their Categorization in the Kano Model
The original Kano model considered only two non-linear types of requirements—attractive and must-be. On the other side, the linearity of the relationship between the (un)fulfilment of a requirement and (dis)satisfaction was explained by a third type of requirement—the so-called one-dimensional requirement (
Kano et al. 1984). Later, two more types of requirements were added to the model—reverse and indifferent requirements. Reverse requirements are requirements whose fulfillment causes dissatisfaction of customers—this is something that customers do not want. Indifferent requirements are requirements whose fulfilment or unfulfillment does not influence satisfaction or dissatisfaction of customers. The last, sixth requirement added to the Kano model is the so-called questionable requirement. This is a controversial or illogical response of respondents, and, in general, this category is not considered valid, or it is recommended to better understand the grounds for such a response. Thus, the currently valid Kano model consists of the following six categories (
Madzík 2018):
‘Must-be’ (M): requirements not expressed by the customer. Should be met automatically but meeting only these requirements does not lead to satisfaction of the customer. This type of requirements presents a certain minimal level of a product or service that must be reached by the organization.
Shahin et al. (
2013), for example, says that “if you don’t get the basis, all else is useless”.
‘One-dimensional’ (O): one-dimensional requirements increase satisfaction in a linear way and are usually explicitly expressed by the customer. These requirements are of the “standard type”—the customer is able to define them even before using the product or service.
‘Attractive’ (A): these requirements potentially increase satisfaction but are difficult to identify because they are latent—they tend to fill the customer with enthusiasm and exponentially increase his/her satisfaction. They usually amount to a small fraction of the price of a product and their function is to amaze the customer. Steve Jobs, for instance, used to advance precisely those elements/attributes of a product which amazed customers. He was famous for his negative attitude towards surveys of customer needs. As he put it, the customers do not know “what fantastic things we have in store for them” (
Hrnčiar 2014).
‘Indifferent’ (I): one is not able to state whether these requirements increase or decrease the perceived quality. This type shows a high rate of identification, which was shown in several empirical studies (
Lee et al. 2011).
‘Reverse’ (R): requirements the customer does not want, and if the product meets them, customer satisfaction decreases. It may be that some functions/attributes of the product or service go against what the customer wants and expects.
‘Questionable’ (Q): requirements that the customer probably does not understand (he/she states that he/she would be very satisfied if the requirement is met, but also if it is not met). Most studies do not list this category of requirements, since it is not used in subsequent reasoning.
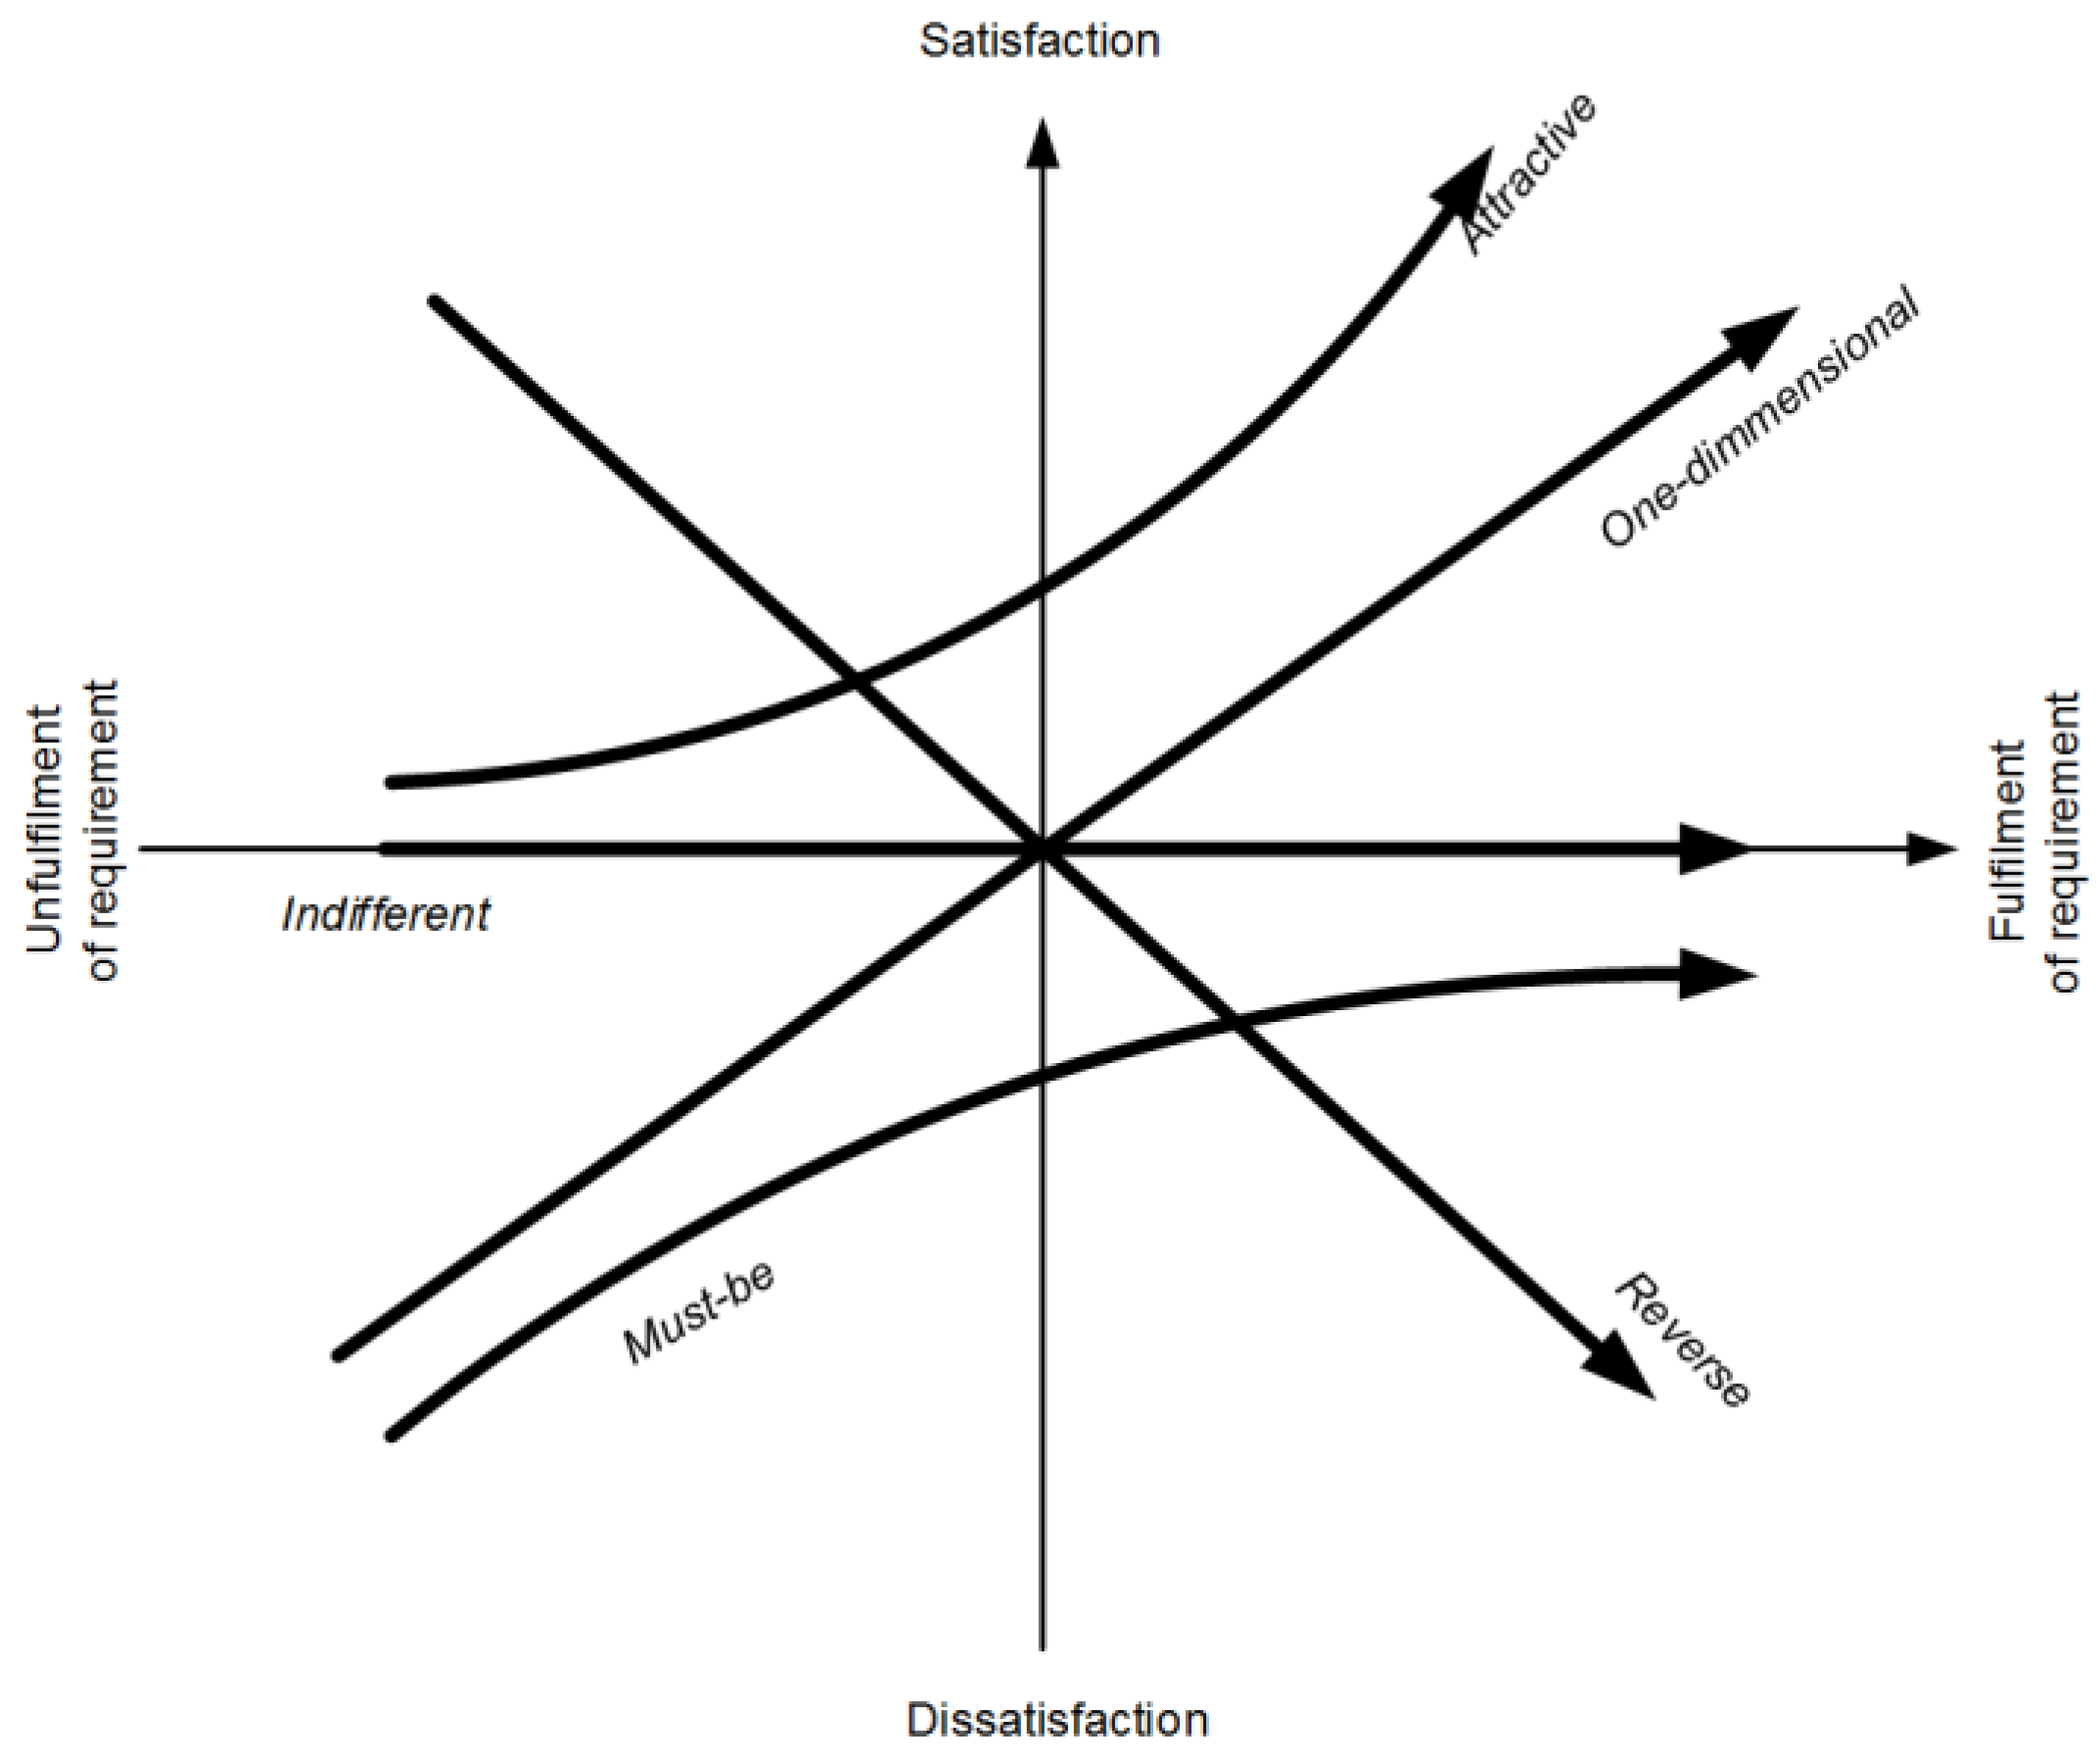
For better interpretation, requirements are usually displayed graphically. This takes the form of an xy coordinate system, where x is the degree of requirement fulfilment (from absolute unfulfilled to absolute fulfilled) and y is the level of (dis)satisfaction (from absolute dissatisfaction to zero dissatisfaction and from zero satisfaction to absolute satisfaction). The particular types of requirements in this coordinate system have the form of curves—
Figure 2.
1.3. Customer Requirements in the Field of Education
The customer of an educational institution is a student and later his/her employer (
Voss et al. 2007;
Chapleo and Simms 2010;
Miller et al. 2014). As stated by earlier studies, requirements of these two types of customers differ. “For example, a student can only partially determine, whether the content of education reflects the needs of the workplace (however, the workplace is able to determine that), and vice versa, employers only partially know how to evaluate the form of education—the learning method, logical continuation of topics, the pedagogical process (the student, however, can identify that)” (
Madzík et al. 2018).
Requirements are based on needs and expectations which are not immutable. It is therefore natural that requirements of students will change over time, reflecting their internal expectations. Because of too-detailed characteristics, it is not possible for this study to point out all the requirements of students described in professional literature. However, it is possible to introduce some of the more general ones which present interesting and often discussed topics within the quality of education. A frequent theme in the debate about quality of education is “
Practice orientation” (
Owlia and Aspinwall 1996;
McGuinness 2003). Practically oriented education has its support in educational sciences, and in general leads to faster acquisition of knowledge and skills (
Fallows and Steven 2000). Attention is also paid particularly to orientation towards “
Skills acquisition” and “
Innovations”, which present an individual topic (
Goldsmith et al. 2006;
Perkmann and Walsh 2007). “
Research quality” has great importance for education (
Taylor 2010), and “
Quality of resources”, intended to support “
Research quality”, is also often discussed (
Cosh and Hughes 2009). Since education is a contact type of service, “
Quality of staff” also plays an irreplaceable role (
Parpala and Lindblom-Ylänne 2007;
De Paola 2009). Finally, in the case of quality of education, there is also the debate about the values schools are based on, their principles of responsibility, or, more generally, about their “
Ethical orientation” (
Dean and Beggs 2006).
It is necessary to mention that the quality of higher education is not determined only by these seven elements. Many sources propose that the quality of education is a multidimensional value influenced by many internal and external factors (
Taylor 2010;
Rodman et al. 2013). On the other hand, the abovementioned seven viewpoints belong to significant factors that influence the perceived quality of tertiary education. The European Standards and Guidelines, which are the result of an international dialogue on quality between European universities, contain direct and indirect references in their methodology concerning all of the seven factors.
These seven views on quality present a selection of scientific and practical approaches, and partial parallels with these aspects can be also found in the work by
Owlia and Aspinwall (
1996). We consider the set of these seven areas sufficient for the illustration purposes of this pilot study. Implementation of the Kano model in schools—particularly higher education institutions—can, with respect to trends in the quality of education, offer interesting results. The aim of this study is to present use of the Kano model for a better understanding of the aforementioned seven views on the quality of education from the perspective of students—the key school customers.
2. Material and Methods
Perception metrics are the dominant method for characterizing requirements on services. These metrics are often based on a questionnaire survey and we also carried out a survey among students. The sample consisted of undergraduate students from two fields of study—Pedagogy and Management. The students’ year of study was also recorded. The sample thus included first, second, and third year students. Before actually answering the questions, we briefly explained to the students the seven investigated requirements in order to decrease the risk of misleading responses.
The Kano model is used to understand requirements, not to identify them. In our case, we identified some of the requirements in
Section 1.3. However, it is possible to use any other requirements and the methodological procedure will remain unchanged. The requirements we identified were rather general and they tend to reflect the attributes of a service. This enables us to avoid an overlong questionnaire because Kano methodology always requires a pair of questions. This method, where researchers ask about more general attributes (instead of more detailed elements) has been used in several similar studies. For instance, the SERVQUAL concept measures quality of services in relation to five attributes—tangibles, reliability, responsiveness, assurance, and empathy (
Pitt et al. 1995). To obtain a basic picture about quality in a certain area, one can start by surveying more general attributes, which can later point to areas that require more detailed attention (
Formánková et al. 2018;
Gajewska and Zimon 2018).
Requirements within the area of education at higher education institutions were divided into seven groups. We subsequently worked with these groups as with separate requirements—they are marked below as “CR”, i.e., Customer Requirements.
Specifically, the following requirements were used: CR
1—Practice Orientation; CR
2—Ethical Orientation; CR
3—Research Orientation; CR
4—Quality Resources; CR
5—Innovation Orientation; CR
6—Skills Orientation; CR
7—Quality Staff. With these requirements, we created a standard pair-wised Kano questionnaire. Every question was elaborated in two formulations—a positive one (if a requirement was met) and a negative one (if a requirement was not met). Kano methodology requires every requirement to be categorized according to the answers responding to a positive and negative question. Apart from two ID variables (field of study and year of study), the questionnaire contained no detailed questions in order to avoid the risk of low return rate due to a long questionnaire. The respondents then indicated the level of satisfaction they felt in a given situation. A 5-degree scale was used, ranging from “I would be thrilled”, through “I would be satisfied”, “Neither satisfied nor dissatisfied”, “I would be dissatisfied”, and up to “I would be upset”. Answers were consequently evaluated according to the revised evaluation sheet (
Lee et al. 2011).
Each requirement for each respondent was located in one of the following categories: Attractive (A); One-dimensional (O); Must-be (M); Indifferent (I); Reverse (R); Questionable (Q). The total amounts of all the requirements allowed them to calculate two separate indices—the Satisfaction Index (SI) and Dissatisfaction Index (DI). In total, 102 respondents (students) were involved in the survey.
The answers which were categorized according to the aforementioned methodology as Questionable and Reverse were not included in the calculation of SI and DI—as recommended by earlier studies (
Berger et al. 1993).
3. Results
A total of 102 students from the Faculty of Education, Catholic University in Ružomberok, took part in the survey. The sample consisted of students from two study programs—Pedagogy and Management. The respondents were first, second, and third year students.
Table 1 shows the number of respondents in their respective categories.
Judging from the sample size, these numbers could be legitimately considered relatively small. The results could be slightly biased. However, these numbers are sufficient in order to illustrate the purpose of the Kano model for a better understanding of students’ requirements. The smaller sample size can affect the confidence interval and, partially, some other statistics. All of the following statistical procedures take into account the sample size, whether in case of the confidence level, the p-value level, or other suitable metrics.
After acquiring the questionnaires, reliability investigation of the used range was carried out. The questions of positive and negative character were tested separately. The main indicator of reliability was Cronbach Alpha. At the same time the reliability testing was carried out under the scenario of excluding the question (variable/item). With positively formulated questions, the value of Cronbach Alpha was 0.566. It is only slightly above the recommended value of 0.5. However, due to the fact that the questions were more broadly conceived, it was considered sufficient. The internal consistency of the used scale was checked by iterative elimination of questions, as well. The results can be found in
Table 2.
As shown in this table, the removal of individual questions would, in almost all cases, result in a decrease in the overall consistency. The only exception is the fourth variable—CR4 Quality Resources, after whose removal the total consistency would increase. This increase, however, would be relatively small, and the exclusion of the variable from the questionnaire would be therefore disputable.
Using the same procedure, the group of negatively formulated questions reached a higher value of Cronbach Alpha, i.e., 0.638. The testing of the scenario of removing individual variables and subsequently calculating the reliability can be found in
Table 3.
The scenario did not confirm the potential of increasing survey reliability, since the value of Cronbach Alpha after the removal of the items was in no case higher than the originally obtained value of this variable. This showed us that the range was consistent and therefore it was possible to proceed to further analyses.
3.1. Impact of Requirement Fulfilment on Satisfaction and of Requirement Unfulfilment on Dissatisfaction
In case of the three basic types of requirements—attractive, one-dimensional, and must-be—the majority of positively formulated responses appears within the range of satisfaction and the majority of negatively formulated responses appears within the range of dissatisfaction. It was also the case of this survey, where the highest level of satisfaction (level 1 and 2) would be met by a HEI/College by meeting the CR1 (Practice Orientation) and CR4 (Quality Resources). From the perspective of students, these two requirements rank among the critical ones, and it can be concluded that they can significantly affect the overall level of students’ satisfaction with their studies.
However, what will the discontent look like if we do not meet some of the following seven requirements? The number of students who will be dissatisfied (level 4) or upset (level 5) is the highest again in the case of the CR
1 (Practice Orientation), but also in case of the CR
7 (Quality Staff). This has been partially confirmed by previous results pointing to the critical role of the teacher in the learning process and his/her influence on the overall satisfaction of students (
Dean and Beggs 2006;
Parpala and Lindblom-Ylänne 2007).
Table 4 provides an overview of all five levels of the used range for all seven pairs of investigated requirements.
In the table we can also see another interesting situation. In case of the CR
6 (Skills Orientation), there is a fairly large group of respondents who said that this does not matter to them—32 respondents (in fulfilling this requirement) and 38 respondents (in its unfulfillment). This contradicts earlier published results which confirm the importance of skills orientation in education (
Caires and Almeida 2005). Since the question was worded more generally (specific skills were not mentioned), it is quite possible that it might have seemed insignificant or unclear to the respondents. However, this is only one of the possible reasons and it would be necessary to carry out a focus group interview with respondents to confirm it.
After processing the frequencies, it was possible to calculate the basic indicators of the position and variability of potential satisfaction. In this case as well, the results are shown in view of the positively and negatively formulated questions for each requirement—
Table 5.
The highest potential of satisfaction can be achieved by meeting the CR
4 (Quality Resources) and CR
1 (Practice Orientation), as confirmed by the aforementioned results of frequencies. At the same time, these two requirements rank among the most stable positive elements affecting satisfaction. By contrast, the CR
7 (Quality staff) requirement ranks among the least stable elements (that is, the answers of respondents differed significantly). This is confirmed by relatively higher levels of variability in
Table 5—Standard Deviation (StDev), Standard Error Mean (SE Mean) and Confidence Intervals (CI for Mean). An interesting finding is that in the case of negatively formulated questions, the variability values were generally higher than in the case of positively formulated questions. Thus, it can be assumed that some of the respondents have a higher degree of non-quality tolerance.
For interpretation purposes, it is appropriate to use, in addition to the presented results, a separate categorization of requirements according to the Kano model. The results can be found in the following,
Section 3.2.
3.2. Categorization of Requirements
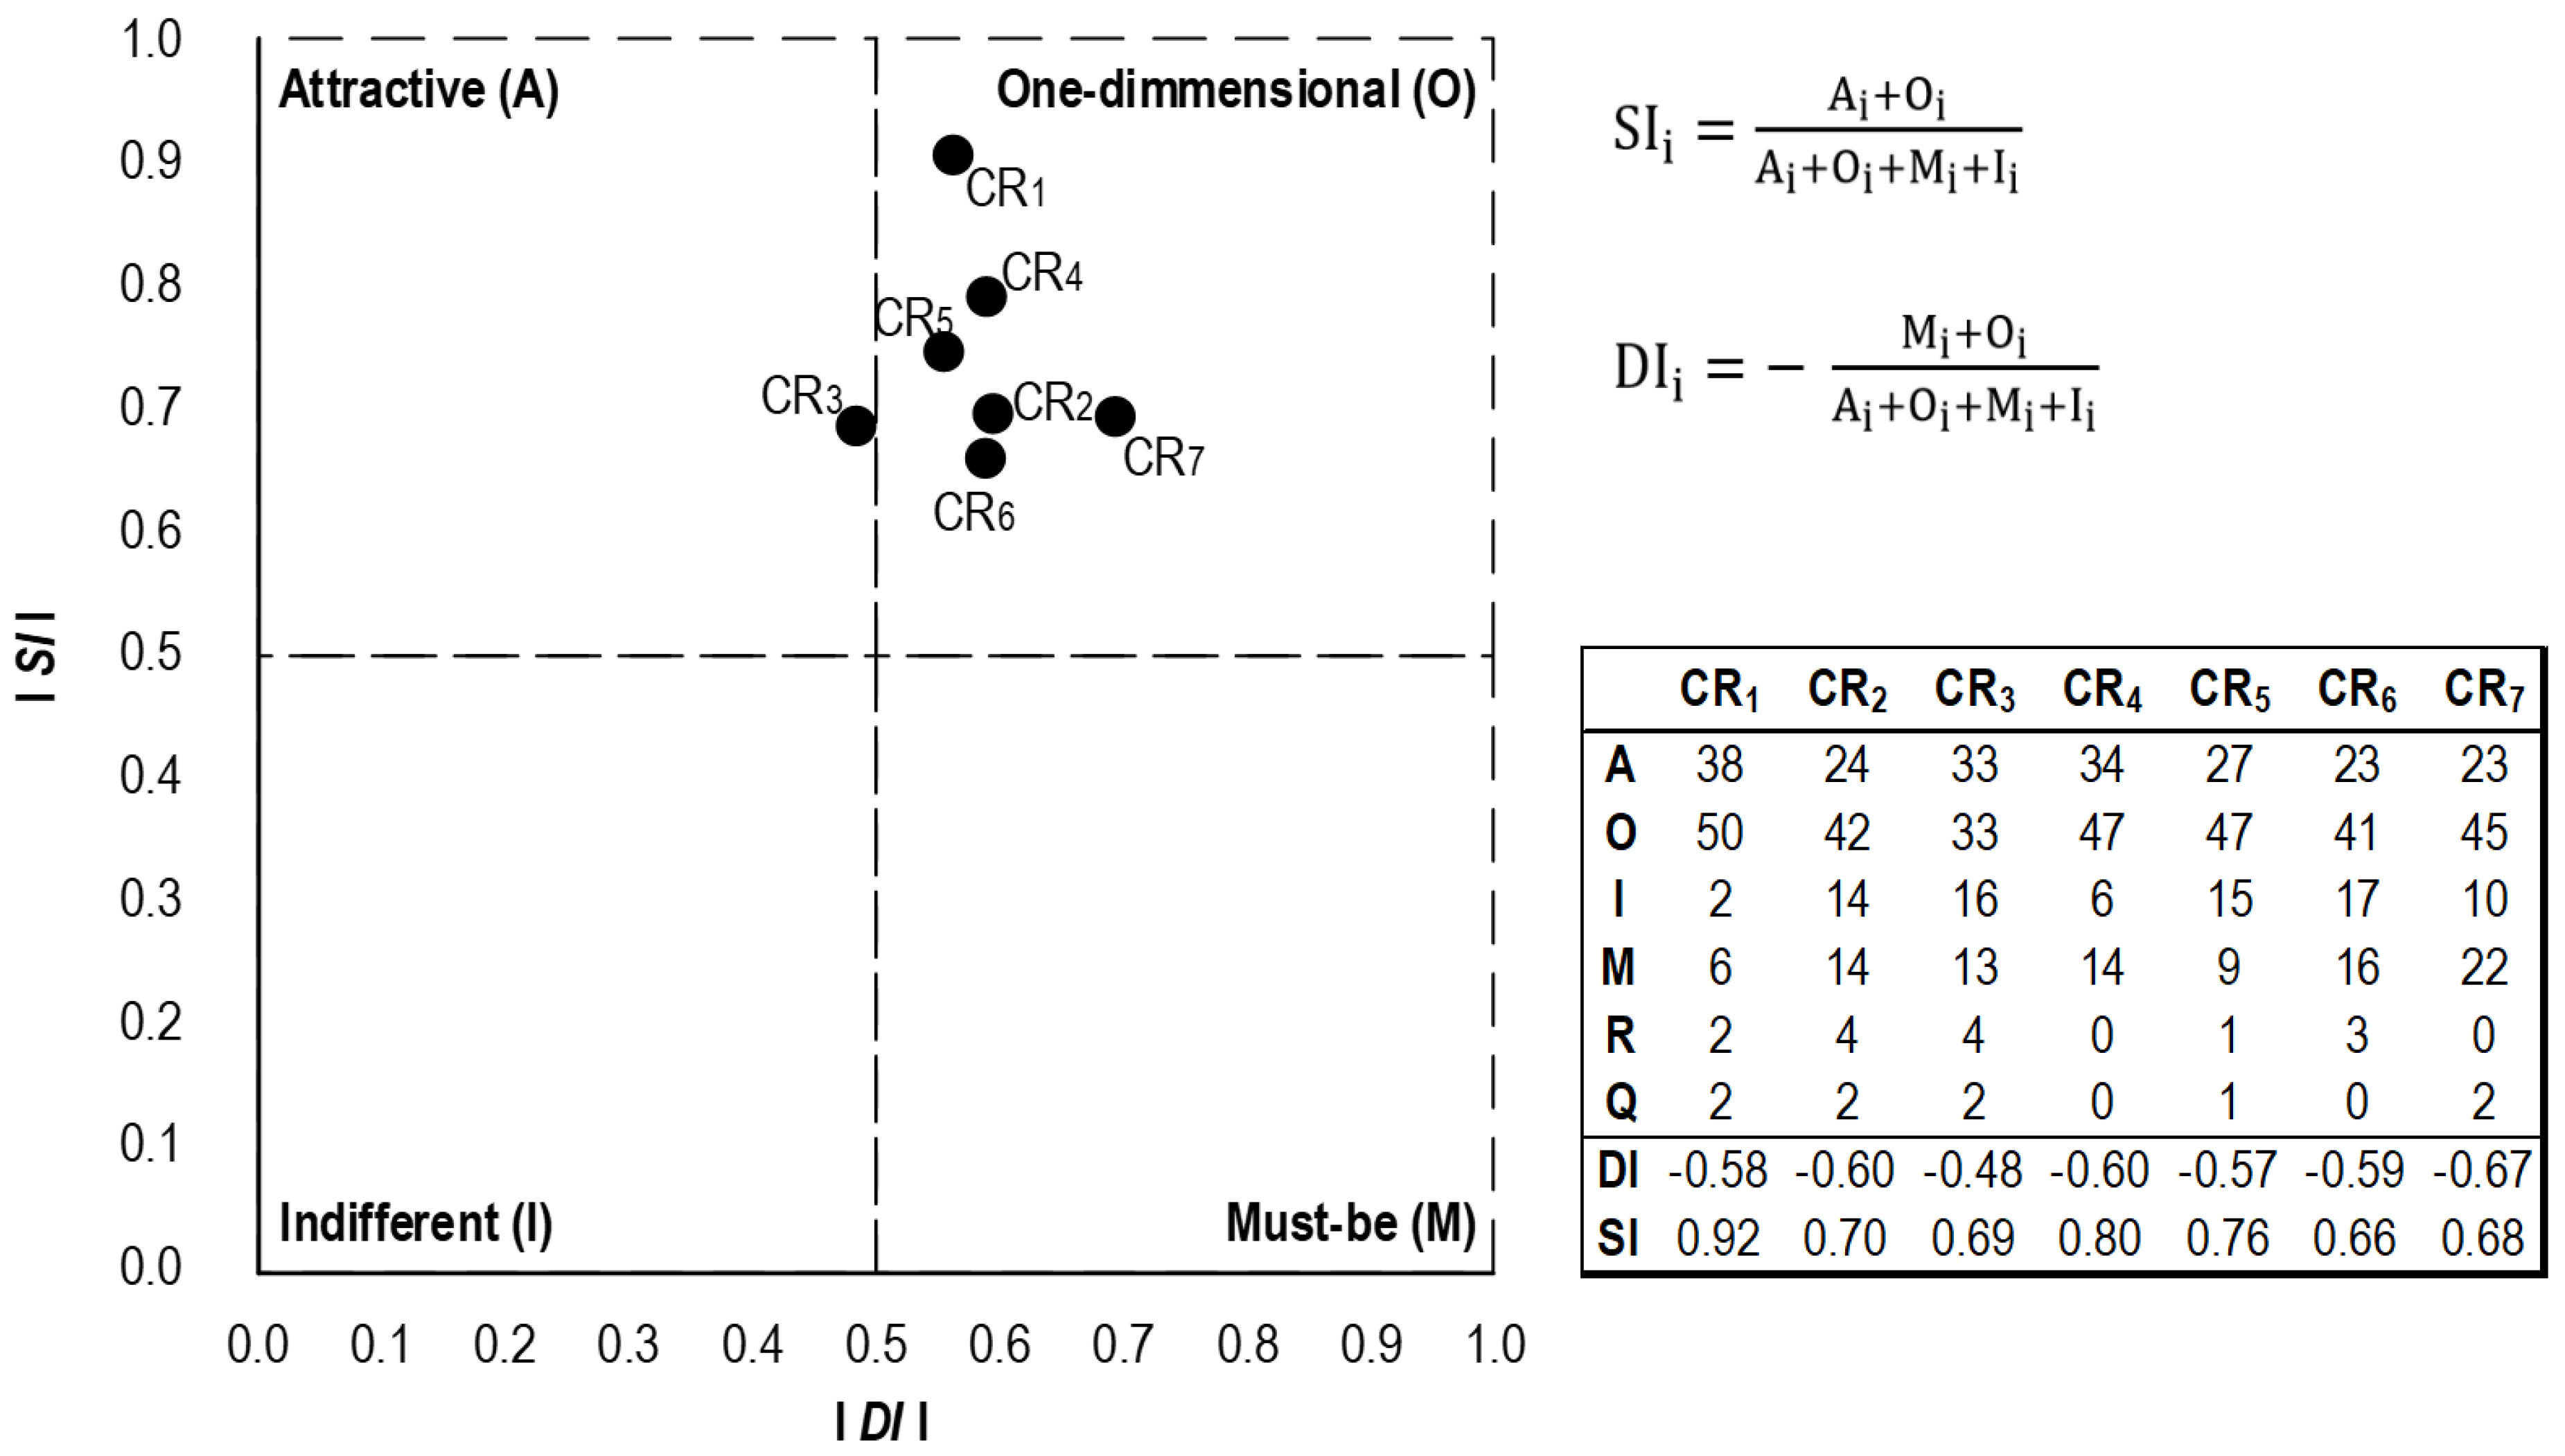
The applied methodology allowed us to categorize requirements into five valid and one invalid category. Although it is possible to display the requirements in the form of curves in an (un)fulfilment/(dis)satisfaction coordinate system, from a practical point of view, a better interpretation ability goes together with the use of the satisfaction vs. dissatisfaction index, which is based on calculation of indices according to
Berger’s study (
1993). Such a view is sometimes referred to as SI/DI plot.
Figure 3 shows the individual requirements in the form of SI/DI plot. As can be seen, almost all of them were categorized as one-dimensional. This means that the ratio between potential satisfaction (in case of requirement fulfilment) and potential dissatisfaction (in case of requirement unfulfillment) is fairly balanced. Based on the results of the investigation, the CR
3 (Research orientation) can be considered an attractive requirement. The figure also shows the rate of requirements in particular categories.
The standard methodology for the categorization of requirements determines a resulting category according to the mode. It is therefore obvious that almost all the requirements have the highest rate in the category O (one-dimensional). However, more than a third of the students involved considered the requirements CR1 (Praxis orientation) and CR4 (Quality resources) attractive. Therefore, these are probably the areas through which higher education institutions can attract potential applicants for their studies. The results also show that the CR6 (Skills Orientation) can be seen as a fairly unclear (i.e., indifferent) requirement. This could mean that meeting this requirement by higher education institutions can do little to affect the resulting dissatisfaction or satisfaction of the students. In this case, however, it can be stated that this result may be caused by the relatively too-general formulation skills. The CR7 (Quality Staff) can be most adequately seen as the requirement whose unfulfillment causes a high rate of students’ dissatisfaction. This then confirms the assumption of the authors that pedagogues and their approach to students are a critical factor in the perceived quality of education.
These results present an overall categorization of requirements for all groups of the respondents. The data can also be stratified according to ID variables of the respondents. Our questionnaire included two such variables—field of study and year of study.
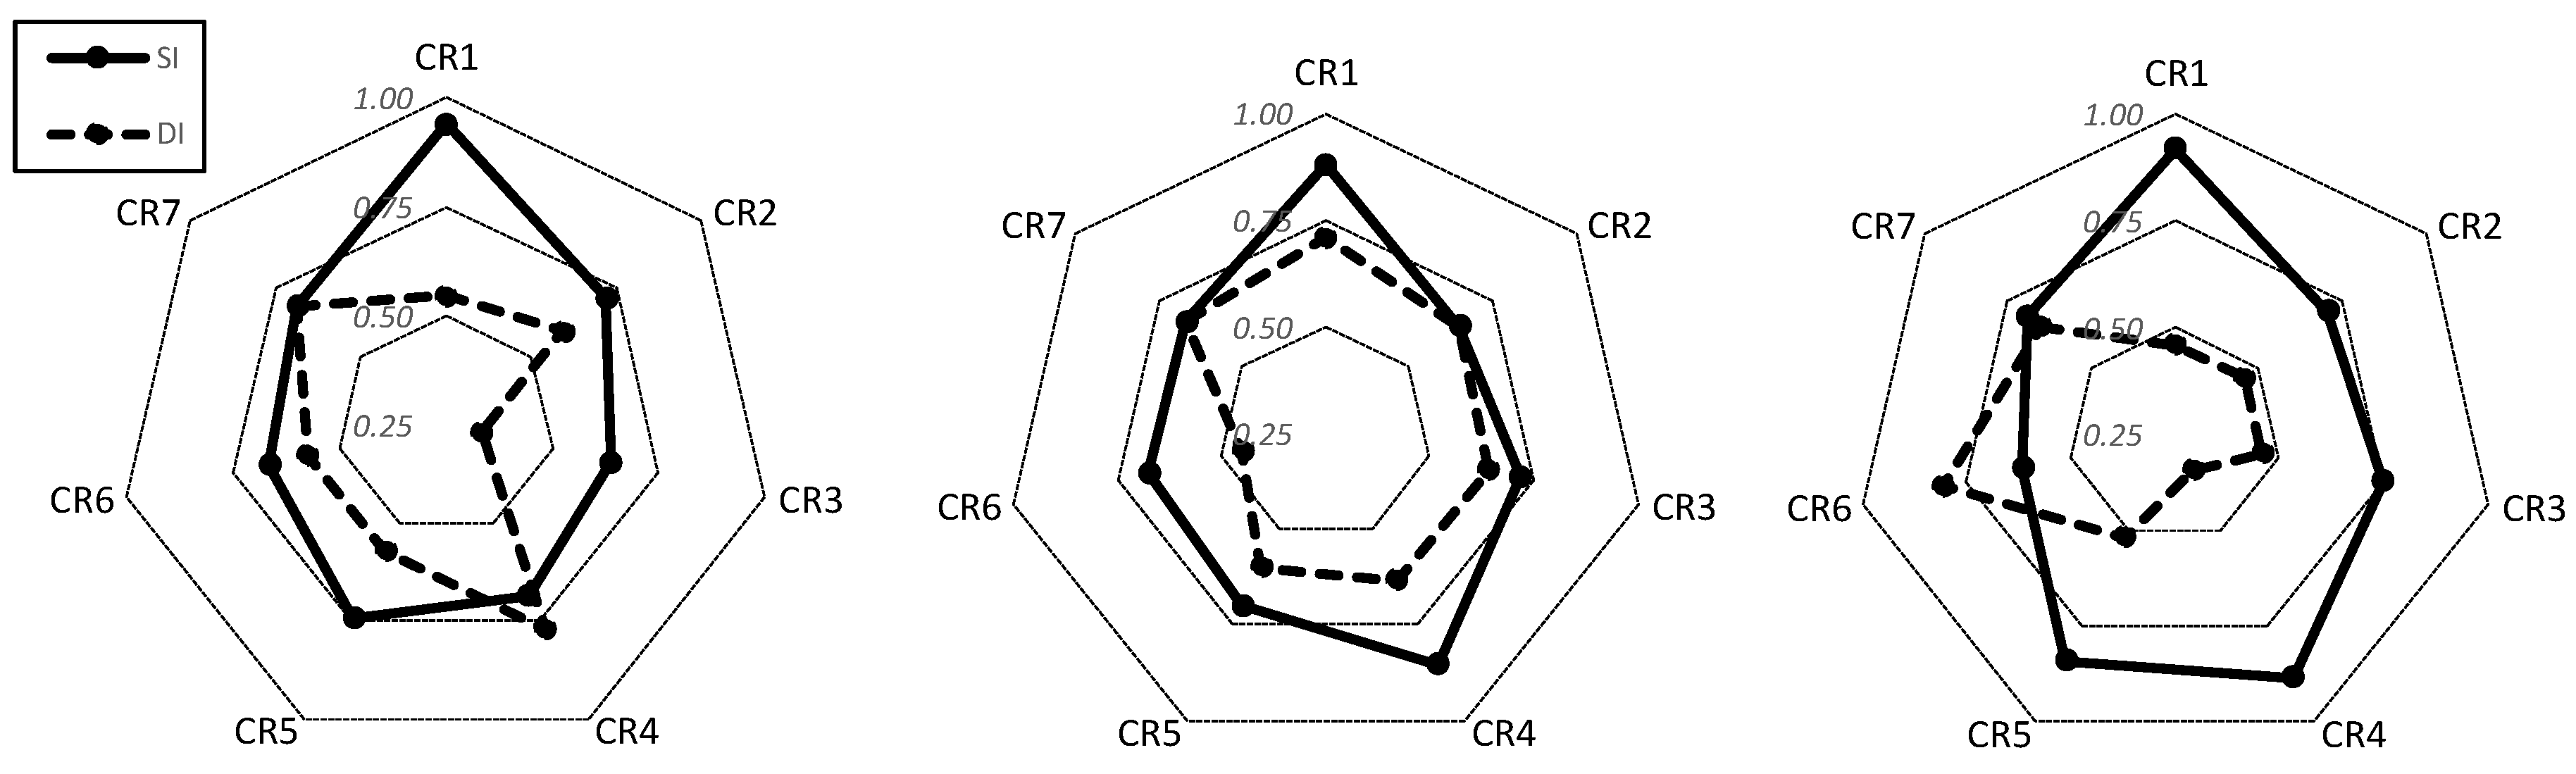
Figure 4 shows the ratio between SI and DI, which shows us the shift in the perception of the seven requirements in the first, second, and third year of study.
According to Kano methodology, these radar charts can be interpreted in the following manner. The greater the dominance of SI over DI, the more attractive the requirement is. And vice-versa, if DI dominates over SI, the requirement is mostly must-be. Based on this interpretation,
Figure 4 offers us some interesting results. If we look at CR
4 (Quality Resources), we can see that this requirement is Must-be for first year students, but gradually it turns into Attractive. This shift can be explained by the dynamics of the Kano model—some requirements change in time. In this case one could suppose that more experienced students imagine Quality Resources (technologies, facilities, etc.) with higher quality than the ones they have experienced so far at the university. Whereas first year students may imagine Quality Resources as a computer laboratory equipped with standard software tools, more experienced students may imagine a specialized neuromarketing laboratory, for instance. The first image is something that is naturally expected (must-be), while the second image is more attractive. CR
6 (Skills Orientation) is another interesting requirement. It changes from Attractive (for less experienced students) into Must-be (for experienced students). In a way, this is natural because students in the last year of their study usually prepare for practice and the school’s orientation on skills is key for them.
In a similar manner, the results can be stratified according to the field of study. In our case, the sample consisted of students from two fields of study—Pedagogy and Management. Differences between these two groups were observed with two requirements. The first was CR2 (Ethical Orientation). While pedagogy students considered this requirement mostly a Must-be, for management students it was mostly One-dimensional. The other case was CR5 (Innovation Orientation). Here the situation was the opposite—Management students considered this requirement a Must-be, while for pedagogy students it was mostly One-dimensional. However, it needs to be mentioned that these results are only illustrative and should be taken with a grain of salt. The survey sample size was only 102 respondents and this stratification makes it even smaller. However, in spite of this limitation, the presented results can be seen as a suitable demonstration of a deeper analysis of requirements based on the Kano model.
3.3. Non-Linearity of Requirements
If a requirement is linear, then its fulfilment or unfulfillment has an equivalent effect on satisfaction or dissatisfaction. Ideally, perfect linearity is characterized by a requirement which has an absolute one-dimensional character—the relationship between fulfilment or unfulfillment of the requirement would be absolutely dependent (i.e., the correlation coefficient would be −1). From
Figure 3 we can deduce that almost all of the requirements have a linear character because they appear in the one-dimensional quadrant. In fact, however, this is not the case, as the verification of non-linearity of requirements shows us in
Table 6.
According to
Table 6, all relevant pairs show a certain level of dependency. At the same time, all of the calculated correlation coefficients are statistically significant with regard to the
p-value. The lowest degree of linearity is in CR
3 (Research Orientation). The degree of non-linearity of this requirement is so high that according to the categorization of the Kano model, the requirement would be classified as “attractive” (
Figure 3). On the contrary, the most linear, hence the most one-dimensional, is CR
5 (Innovation Orientation). This is an interesting finding, especially if we compare it with the SI/DI plot (
Figure 3)—the CR
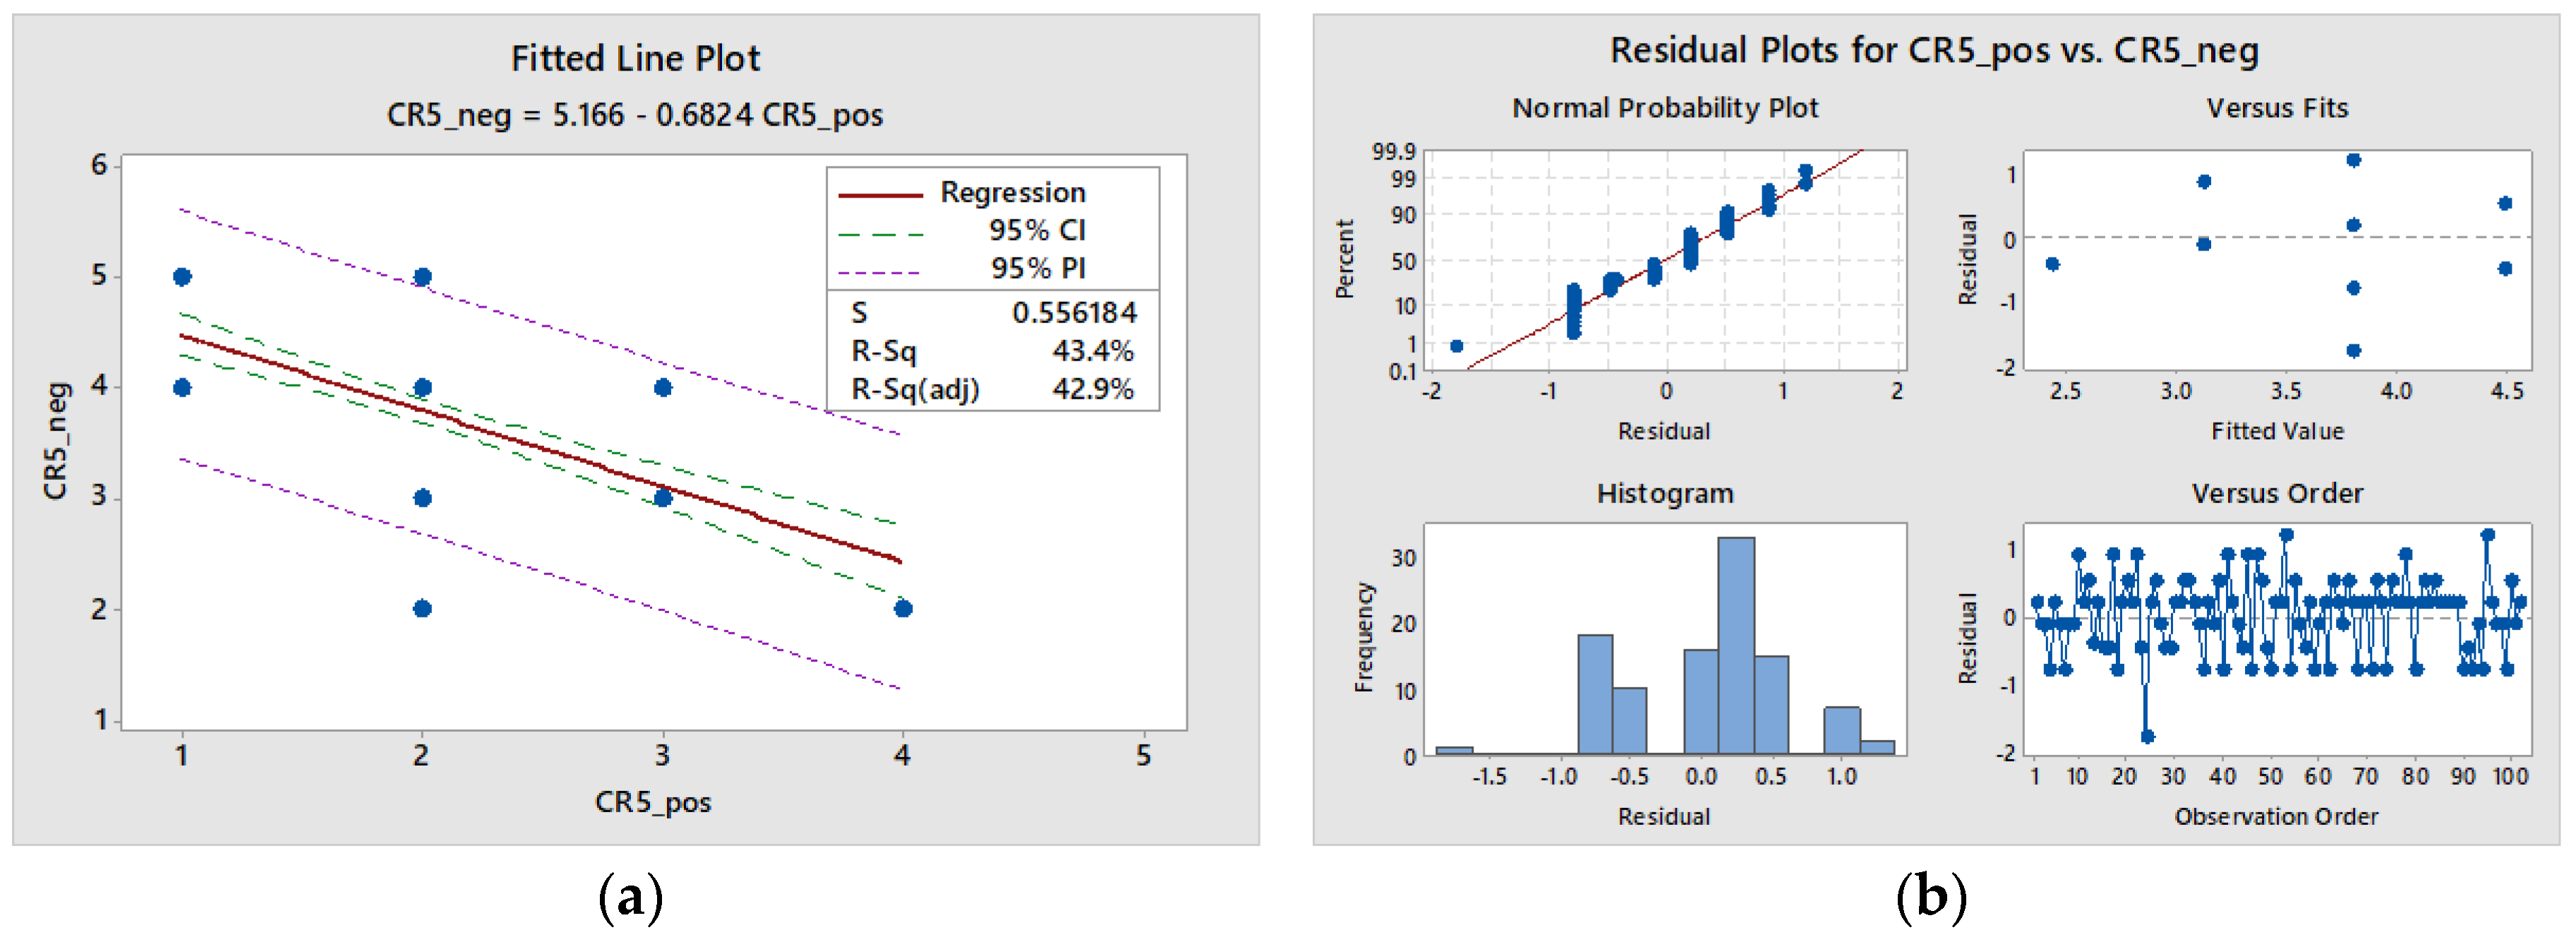
5 is at first sight indistinctive or dull. Since this requirement showed the most significant dependence between the positively and negatively formulated question, it may be more closely analyzed using regression analysis. Linear regression allows for a deeper understanding of the links between the positive and negative question. The results of this analysis can be found in
Figure 5.
The resulting regression model (
Figure 5a) indicates a middle level of dependence, as the calculated equation can explain 43% of the variability between the positive and negative response of a respondent. This means, for example, that if under the question “If quality research at the university was high, how would you feel?” s/he responds “1 = very satisfied”, there is a high probability that under the question “If the quality research at the university was low, how would you feel?” s/he will respond “5 = very dissatisfied”. For other questions, such likelihood is lower. The residual analysis indicates that the questions have a normal distribution, and the identified relationship is not affected by any system error. The advantage of using regression analysis is in the predictability of results and in potential shortening of the questionnaire for future applications.
4. Discussion and Conclusions
This study presents the main pilot results of implementation of the Kano model to better understand requirements of students (i.e., customers) with respect to HEIs. The overall summary of the most important results of the investigation related to individual requirements is found in
Table 7. The table provides an overview of identified impacts on students’ satisfaction in cases when a particular requirement will or will not be met. The table also contains an overview of other findings which were the result of using the methodology.
As is clear from the research results, the greatest impact on students’ satisfaction is represented by meeting the requirement “Practice Orientation”, i.e., placement of graduates in practice. This relation reflects their efforts to adapt rapidly after graduating from HEIs in real practical conditions of their employers. This view fully corresponds for example with the concept implemented already since 1930s in the “Baťa” formation-education model (
Tuček and Tučková 2007). It is a formation-education approach oriented towards customers in complex systemic terms, in which we consider customers in a wide range of “stakeholders”. Customer orientation means that the provider of services should meet requirements that are expressed, legislative, or implied (
Hrnčiar 2014). For HEIs, customer orientation should mean the following:
know the details of target market segments with defined characteristics, features, needs, and preferences of potential student employers,
have mastered the process of identifying the requirements on product quality and processes of potential employers
can professionally meet these requirements with products and processes of their formation-educational services
can create a climate of trust with the organizations that will use the HEI “products” and “draw” them into formation-education processes under the principle “our customer = our partner”
are able to evaluate the quality of their services and obtain adequate feedback from these external partners
can identify the potential for improving the quality of their services and can take relevant measures for the implementation of new upgraded requirements in the formation-education processes.
Our research suggests that the University “Research Orientation” or the presentation of new scientific knowledge in the formation-education process appears as an attractive requirement. Attractive features have to be always innovated by the service providers. They have to always invent new pleasant surprises for their customers because over a period of time, old attractive requirements become one-dimensional. This is due to the increasing maturity of customers, their customer-awareness, their ability to compare products with free competition, which drives the quality of service forwards (
Hrnčiar 2014). Incentives for implementation of attractiveness of the HEI formation-education process can be suggested in the following possible research areas. For a higher education workplace, research topics related to changes in the global external environment of organizations appear particularly attractive. Such significant recent changes include:
The change in the allocation of capital resources in the context of ongoing globalization. For the allocation of capital resources, it is important that in a given geographical area they increase the rate of their added value (
Benner 2002;
Zelený 2011).
The fourth industrial revolution (Industry 4.0). Expectations about the fourth industrial revolution, sometimes reduced only to the issues of digitization and robotization, and put into relation with, for example, the flexibility or optimization of production processes, seem very simplified. The 4.0 Industry can bring distinctively accelerated product life cycles, increased device autonomy and the elimination of simple manual processes, saved natural resources by channeling energy flows, mass customization, dynamic response to customer requirements related to unique products, and unexpected changes can even occur in using energy sources, etc. (
Budaj 2018).
Demographic trends. The generally known development of birth rate, longevity, and mortality in different parts of the world and the resulting diametrically opposed demographic curves are not only a social factor, but they affect other factors as well. The population explosion in the third world (
McNally 2013) tends to be associated with poverty in these countries (
Weber 2004). A very serious problem appears to be a dramatic change in lifestyle in more advanced parts of the world. A large group of people is not able to maintain the work/life balance. There is an increase in the so-called lifestyle diseases, disintegration of the family as the basic cell of society, natural communication is being lost.
Environmental factor of macro-environment. Formulation of models depicting possible scenarios for human development if there are no serious measures taken to deal with anthropogenic impacts on the environment.
Tendencies promoting the dominance of globalized culture at the expense of traditional domestic cultures proven and tested by many years of practice. This leads to various disorders and distortions in value systems, denying the marketing competitive uniqueness.
Our research suggests that an HEI’s “Quality Staff” has a high impact on students’/customers’ dissatisfaction if it is not met. This requirement is closely linked to the frequently emphasized absence of personalities, absence of leaders in all spheres of society (
Ramsden et al. 2007). In the sphere of education, it is often, especially in the post-communistic states, presented in connection with the status of education (including higher education) in the qualitative development of society and with the complex motivation of scientific and pedagogical workers. It is also a confirmation of a well-known fact that the element “people” represents perhaps the most important element of the marketing mix across all services. In terms of the management of human resources in schools, this requirement means that permanent care of the human potential needs to be taken. The care must begin by a well-considered selection for the positions of scientific and pedagogical employees, where high demands will be put on every individual and balanced demands on the structure of the staff in terms of their strengths in the area of creative scholarly work, or strengths in creative thinking supported by rich practical experience in their professional field.
Modern understanding of quality is the result of a long process with a few milestones (standards ISO 9000, etc.). Even in the environment of HEIs it is possible to work with the same definition of quality as it is presented in the ISO standard, i.e., that it is “a degree to which a set of characteristics meets requirements” (
Singels et al. 2001), namely the requirements of a wide range of stakeholders (students, their families, various organizations in the business and non-business sphere, of the state administration, regional authorities, etc.).
Meeting requirements and expectations of customers (students) and of a wide range of HEIs’ stakeholders can be regarded as a basic pre-condition for the application of Deming Chain or the modified Deming Circle (
Carrión-Garcia et al. 2017). According to this theory, the success of an organization must begin with the requirements for quality and improvement of products and processes of schools. One viewpoint on quality says that a quality product is the one which is marked as a quality one by the customer, and that the quality is a permanent adjustment to customer expectations. The process of improving quality must therefore begin with customers. Improving the quality of formation-education processes will increase schools’ capability to meet requirements in two areas:
School’s ability to transform customers’ requirements into the elaboration of a high-quality proposal of a product and process.
Quality assurance in the process of providing a formation-education service. The quality, however, cannot be understood as a technical process, but as a systemic, customer-oriented process that needs to be totally and consistently enforced throughout the formation-educational process.
Improvement of quality, based on such principles as permanent focus on customers and markets, permanent quality management oriented towards processes and results as well, permanent education and training of people (workers) with regard to quality, the use of appropriate sophisticated methods and tools of quality management, must, according to Deming’s theory, bring the improvement of labor productivity and increased efficiency of operations by means of the combination of reducing costs and increasing revenue (e.g., through successfully submitted and carried out research projects). In this way, quality positively affects economic and financial factors of HEIs, building good HEI image and consequently improving an HEI’s competitive position and increasing its market share. This “chaining” will create positive conditions for the area of human resources and social development, including the complex motivation of the scientific and pedagogical staff. In the end, this will lead to successful development of HEIs, to a return of investments, and to possibilities for carrying out other developing programs.
A better understanding of customer requirements by utilizing the Kano model was at the beginning of a chain of consequences which bring success to HEIs. But why does this not work everywhere? Mainly because quality is a subjective notion and its significance depends on what people expect from (formation-education) services. The ideas of school managements about what customers expect often differ from actual expectations of these customers (
Berry et al. 1993). Continuous feedback from customers, measurement and evaluation of qualitative results is therefore a necessary prerequisite for a good, high-quality setting of products and processes in HEIs.
The proposed procedure can also fail if the school top management is not personally involved in the quality programs and does not create the necessary quality culture, does not support a permanent positive relationship to quality, and does not establish an appropriate organizational structure (formal and informal) and motivation programs. Quality management needs to be understood as a way of thinking (
Crosby et al. 1990) which will be focused not (only) on solving technical quality problems, but mainly on ways of preventing quality problems by involving all workers, starting with the management. This means that the paradigm of the HEI management has to be shifted towards leadership based on principle (
Vágner 2015), towards the achievement of synergy effects by creating an environment of mutual respect and trust among the management and employees, customers, and suppliers.
The benefits for HEIs based on good quality management (including the Kano model) can be seen particularly in enhancing the competitiveness of the school, which is a considerable contribution in the current era of hyper-competition and negative demographic trends. Improving the quality of educational processes in schools and the growth in education levels of the population of a country increase the potential and competitiveness of regional economies and national economies in the European Union and the world economic community. The benefits from the use of such a sophisticated approach should be especially felt by graduates of higher education in the form of good placements in practice and the acquiring of creative habits, but also by managers and scientific-pedagogical personnel of higher education in the form of permanent creative access to offered products, realized processes and, consequently, in the form of their personal development.
There are certain natural limitations to this study due to the nature of the sample and the content of the questionnaire questions. The sample size is the first limitation. The research sample consisted of 102 valid questionnaires. The student population in the Slovak republic is approximately 90,000. Therefore, the results require a careful interpretation. However, the aim of this study was to show some pilot results and so to introduce application possibilities of the Kano model for HEIs that wish to better understand expectations and requirements of students. The sample consisted of students from two fields of study—Pedagogy and Management, and from three study years (from first year to third year students). This can also be considered a limitation, because different groups of students can have various expectations of university education, which necessarily affects the results. Nevertheless, application of the Kano model for a better understanding of customer requirements is hardly present in literature and therefore it seems rational to first realize a pilot study, such as this one.
The content of the survey was the second limitation. Seven requirements were examined and interpreted. These requirements were rather general and were not analyzed into a lower (and more specific) level. Quality of higher education is an interesting area which certainly deserves more systematic attention. The authors of this study are aware of the limitations stemming from the general formulation of the questions about the seven factors that influence quality of education. However, more detailed questions would significantly extend the Kano questionnaire—every requirement requires the formulation of two questions (one positive and one negative) in order to categorize the requirement. The ID variables of the respondents can also present a limitation for the interpretation of results. Here, the questionnaire focused only on objective features of the respondents (field of study and year of study). Literature presents some empirical evidence that perception of the quality of a university can be influenced by subjective factors on the part of the students—for instance, their attitudes or motivations (
Holfve-Sabel 2006). This pilot study did not investigate these factors, but they may be interesting for further research initiatives in this area.
In spite of the abovementioned limitations, this study can be considered a suitable platform for scientific discussion about implementation of sophisticated approaches to a better understanding of higher education quality.


