1. Introduction
The COVID-19 pandemic caused by SARS-CoV-2 constituted one of the most significant public health emergencies of the modern era, exposing substantial disparities in the preparedness and responsiveness of healthcare systems worldwide (
Blidaru et al., 2025;
Goniewicz & Khorram-Manesh, 2026;
Goniewicz et al., 2023). Marked differences were observed in the effectiveness of national pandemic responses, largely reflecting variations in institutional capacity, governance structures, and levels of public health preparedness. In contrast, countries characterized by weaker healthcare infrastructures and limited institutional resilience experienced considerable difficulties in managing the crisis (
Lupu & Tiganasu, 2022b).
In Romania, county-level Public Health Directorates (PHDs) played a pivotal role in coordinating the public health response, functioning as an intermediary between the centralized decision-making structures of the Ministry of Health and the National Institute of Public Health (NIPH) and local communities (
UNICEF, 2001).
The organizational framework and responsibilities of the PHDs are regulated by Ministry of Health Order No. 1078/2010. During the COVID-19 pandemic, this framework was supplemented by Law No. 55/2020 regarding measures for preventing and combating the effects of the pandemic, Government Decision No. 394/2020 declaring the state of alert, and several Ministry of Health orders that further specified the operational responsibilities of county public health authorities (
Dinu, 2022;
Vasile & Androniceanu, 2018).
The financing of PHDs is provided entirely through the state budget, with resource allocation traditionally based on relatively stable administrative criteria, including approved staffing structures, historical activity levels, workforce size, and county population characteristics (
Arpinte, 2024). However, the current legislative framework does not systematically incorporate performance indicators or epidemiological risk profiles into funding allocation mechanisms (
OECD, 2019;
Onofrei et al., 2021;
European Observatory on Health Systems and Policies, 2022).
Throughout the pandemic, PHDs were responsible for a wide range of activities, including epidemiological investigations, authorization and supervision of vaccination centers, coordination with hospitals and emergency services, implementation of quarantine and isolation measures, and public health communication campaigns (
Lupu & Tiganasu, 2022b;
UNICEF, 2001). The unprecedented operational demands generated by the pandemic highlighted notable differences among PHDs with regard to the scale of activities performed, the diversity of interventions implemented, and their ability to coordinate complex interinstitutional responses (
Aichimoaie, 2020;
Minciuna, 2023;
Musat et al., 2023;
Tomescu, 2025). In some regions, operational limitations—including delays in epidemiological investigations, contact tracing, isolation procedures, and public health communication activities—contributed to increased pressure on Emergency Reception Units (ERUs) and intensive care services (
Garofil et al., 2023;
Neupane et al., 2024;
Oprita et al., 2022;
Vlădescu et al., 2016).
Research on institutional responses to the COVID-19 pandemic can be organized into three complementary strands. The first examines health-system resilience and pandemic governance at the national level. Comparative studies have shown that crisis performance depended not only on hospital and clinical capacity, but also on governance quality, financing, coordination mechanisms, information systems, and the ability to mobilize personnel and resources rapidly (
Almeida, 2024;
Biernacki, 2025;
Capano & Toth, 2023;
Ehlert, 2021;
Goniewicz & Burkle, 2023;
Lupu & Tiganasu, 2022a;
Tang et al., 2026). Although this literature establishes the importance of institutional capacity, national-level indicators may conceal substantial differences between subnational organizations operating within the same regulatory framework.
A second strand focuses on decentralized and local public health administration. Evidence from European and other decentralized health systems indicates that local public health institutions differed considerably in workforce availability, financial resources, digital infrastructure, interorganizational coordination, and their capacity to implement public health measures (
Bohle & Eihmanis, 2022;
Borzuchowska et al., 2023;
Nițescu et al., 2025;
Saghin et al., 2022). These studies suggest that population size or geographic area alone may not adequately explain institutional performance. The concentration of expertise and the availability of a sufficiently large workforce may be particularly important because local authorities must simultaneously sustain epidemiological surveillance, regulatory activities, public communication, data management, and coordination with healthcare and emergency services.
A third strand addresses organizational learning and institutional resilience. Previous exposure to health emergencies may facilitate the development of operational routines, coordination networks, and adaptive decision-making mechanisms that can be reactivated during subsequent crises (
Norris et al., 2008;
Volintiru & Gherghina, 2023). However, prior crisis-management experience has rarely been examined together with workforce size, financial resources, personnel density, and the diversity of measures implemented. Consequently, the relative contribution of absolute resources, population-adjusted resources, and accumulated institutional experience remains insufficiently understood.
In Romania, previous research has primarily examined health-system resilience, healthcare financing, workforce distribution, and pandemic governance at the national level (
Almeida, 2024;
Bayerlein, 2024;
Biernacki, 2025;
Blidaru et al., 2025;
Ehlert, 2021;
Tang et al., 2026;
Zhao et al., 2022). Comparatively less attention has been paid to county Public Health Directorates as individual administrative organizations. It therefore remains unclear whether differences in county-level response capacity are associated mainly with proportional staffing, absolute institutional scale, financial resources, previous crisis experience, or a combination of these factors. The present study addresses this gap through a comparative, descriptive, and correlational analysis of 20 Romanian Public Health Directorates.
Understanding the factors underlying this variability in institutional response capacity represents an important research objective with direct implications for health policy and public administration (
Almeida, 2024;
Biernacki, 2025;
Ehlert, 2021;
Tang et al., 2026). Although previous studies by
Lupu and Tiganasu (
2022a),
Capano and Toth (
2023), and
Goniewicz et al. (
2023) have examined healthcare system performance at the national level (
Capano & Toth, 2023;
Goniewicz & Burkle, 2023;
Lupu & Tiganasu, 2022a), evidence regarding subnational public health administration in Eastern Europe remains limited (
Bohle & Eihmanis, 2022;
Borzuchowska et al., 2023;
Nițescu et al., 2025;
Saghin et al., 2022). Furthermore, recommendations emerging from recent national strategic forums have emphasized the need to strengthen public health infrastructure and develop more resilient institutional models capable of responding effectively to future health emergencies (
Bayerlein, 2024;
Blidaru et al., 2025;
Zhao et al., 2022). These recommendations advocate a broader public health perspective that extends beyond a healthcare model primarily centered on hospital-based interventions (
Goniewicz & Khorram-Manesh, 2026).
To address this research gap, the main aim of the present study was to examine institutional characteristics associated with COVID-19 response capacity among Romanian county Public Health Directorates. Response capacity was operationalized primarily as the diversity of COVID-19 response measure categories documented in institutional activity reports.
The study addressed the following research questions:
RQ1. How did institutional resources, prior crisis-management experience, and the diversity of COVID-19 response measures differ between PHDs located in counties with university medical centers and those operating in non-university counties?
RQ2. Which institutional characteristics were associated with the diversity of COVID-19 response measures implemented by the included PHDs?
RQ3. How were the included PHDs positioned within an exploratory institutional capacity index based on selected financial, human-resource, experience, and response indicators?
Given the observational and correlational design, the study examined institutional differences and associations without attempting to establish causal relationships.
3. Results
3.1. Sample Description
Table 3 presents the complete dataset for the 20 PHDs analyzed, including all independent variables and derived indicators, with verification of data source availability. Upon initial examination, it can be observed that institutions from counties with university centers (UC group) record substantially higher averages in terms of budget, personnel, crisis management history, and measures applied, compared to counties without university centers (NUC group).
The colors reflect the relative position within the sample (green = upper tertile, yellow = middle, red = lower tertile). The color-coding of each result provides a chromatic overview of vulnerabilities and strengths. Performance colors (green) are concentrated among institutions with university centers, leaving almost exclusively low-performance shades (red) for the NUCs, indicating a generalized and simultaneous fragility across multiple indicators for the latter. It can be noted that for County Area and Employees per 100,000 inhabitants, the colors do not follow the UC/NUC pattern—a visual confirmation of the statistical non-significance of this variable. For Employees per 100,000 inhabitants, PHD Sălaj, Mehedinți, and Harghita (all NUC) appear in green, indicating a position in the upper tertile for this variable—a pattern entirely different from the Budget, Crises, and Measures columns.
3.2. Descriptive Statistics per Variable and per Group (UC vs. NUC)
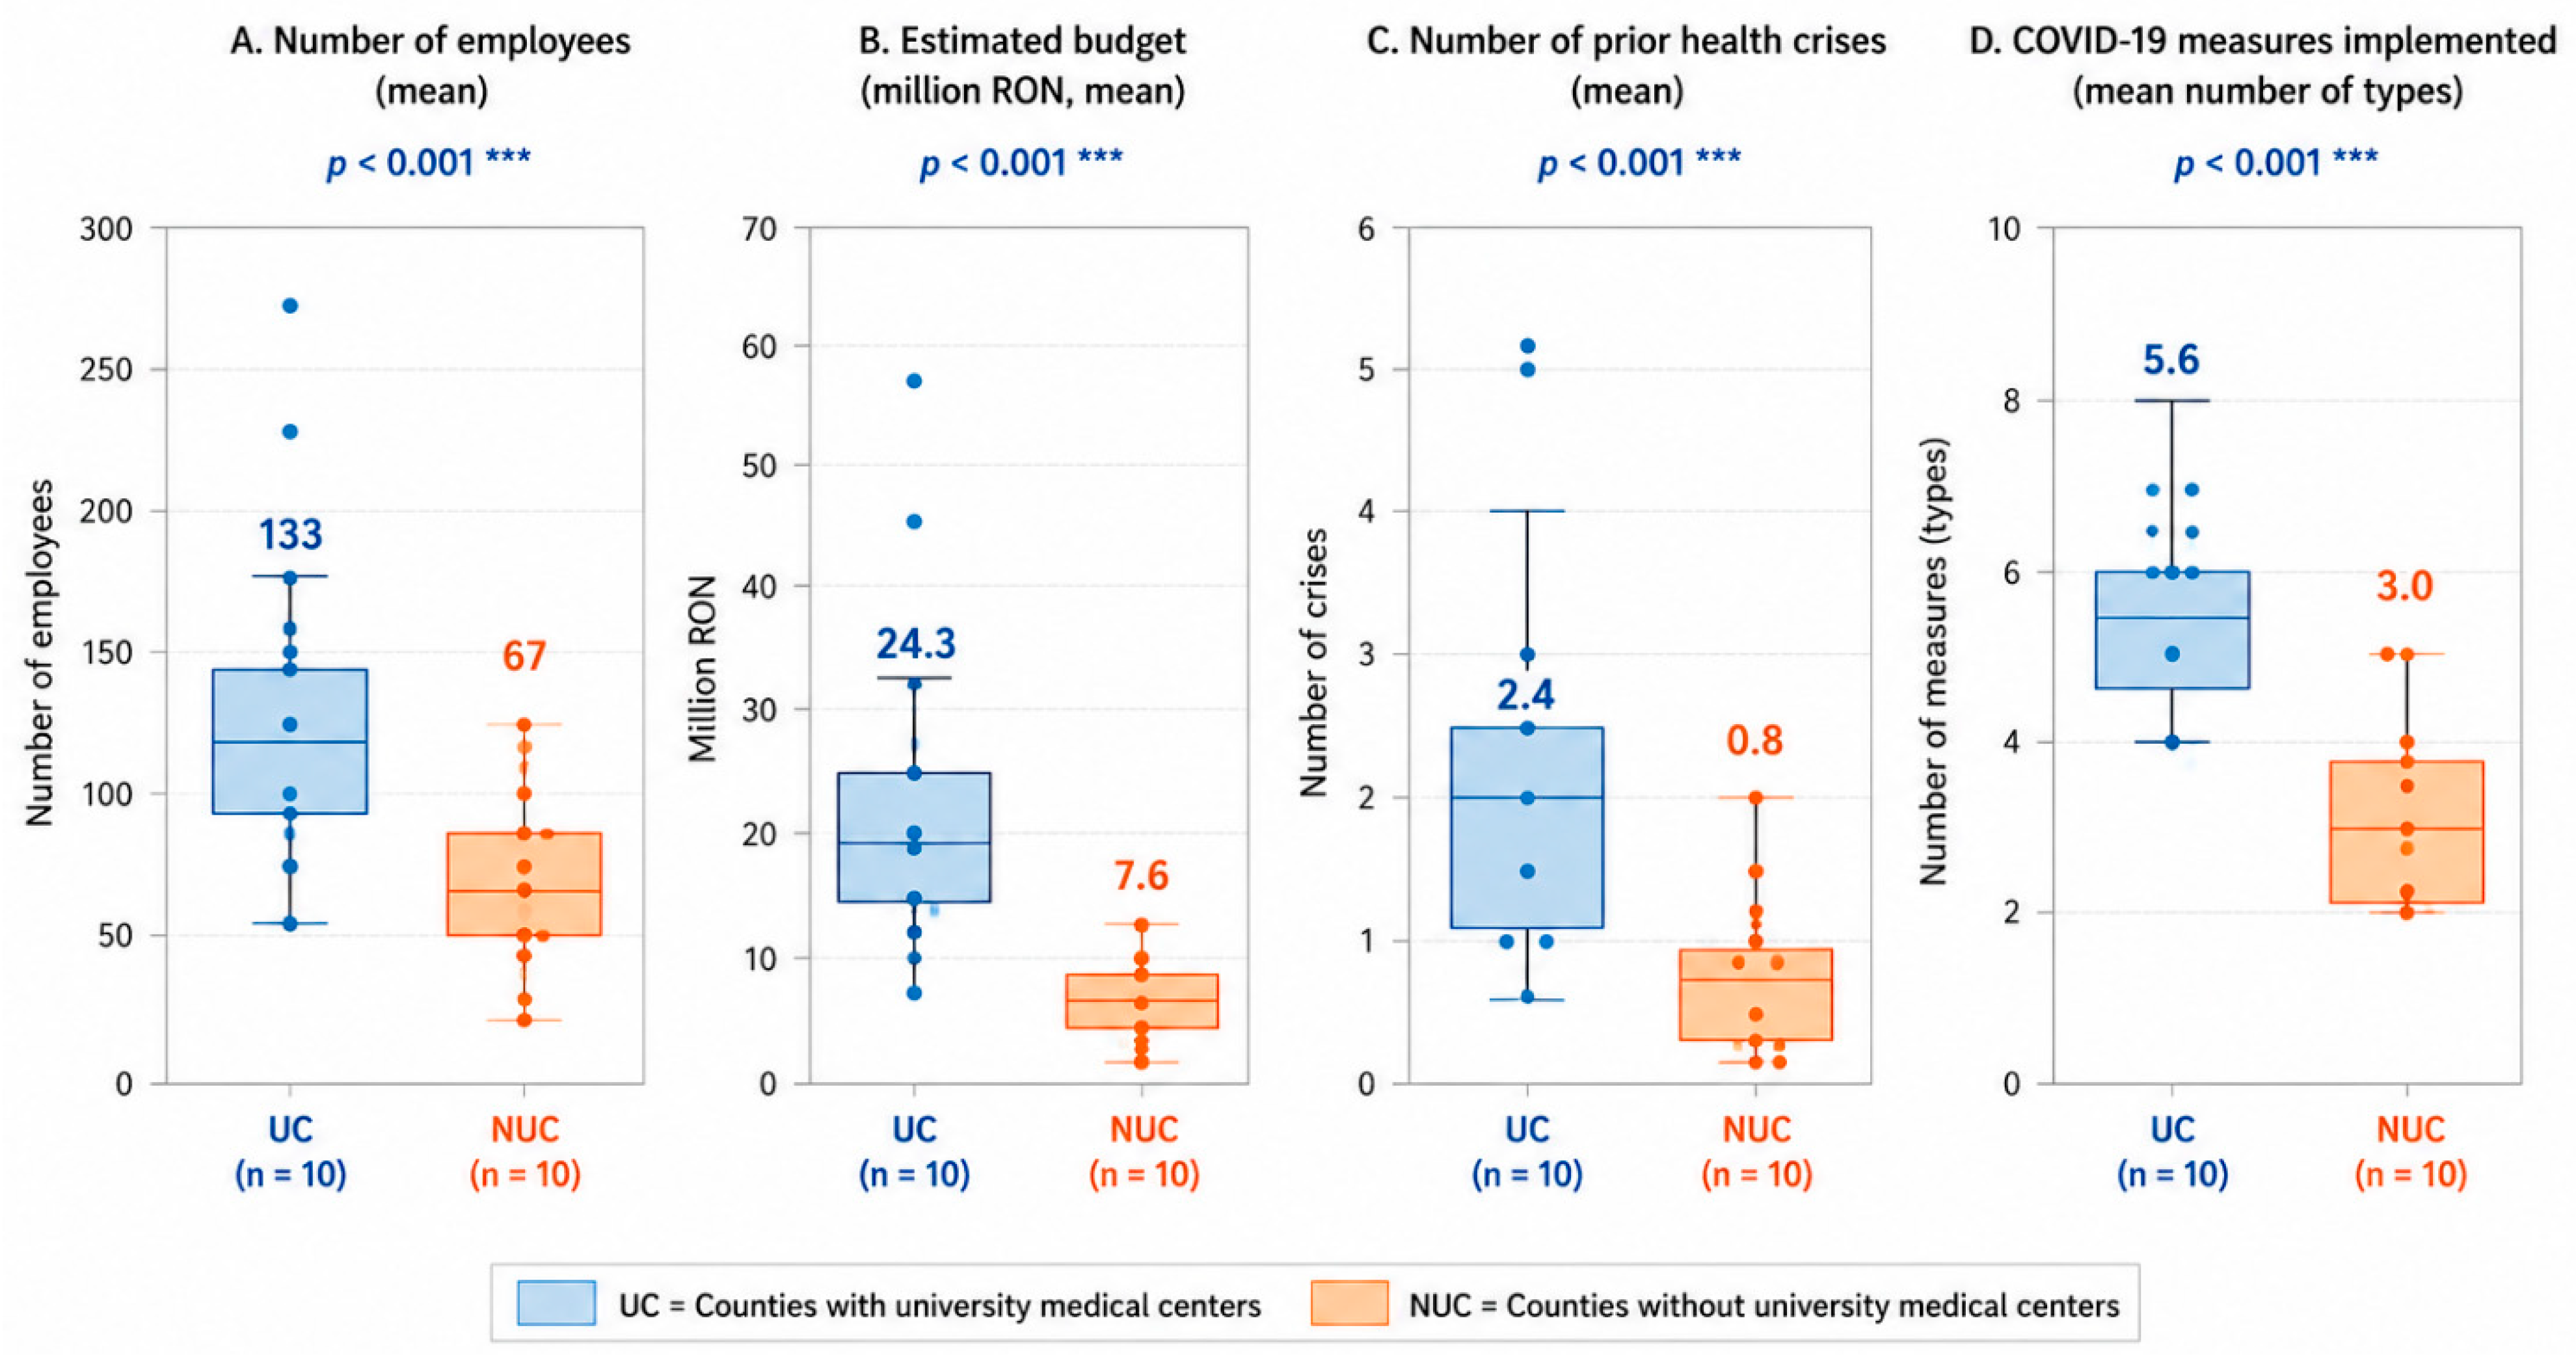
Table 4 and
Figure 1 present the descriptive statistics per variable and per group (UC vs. NUC), together with the results of the Mann–Whitney U test for comparing the distributions between the two groups. The Mann–Whitney U test was chosen as a non-parametric alternative to Student’s
t-test, due to the non-normal distribution of certain variables and the small sample size per group (
n = 10). Medians are reported alongside means due to the influence of extreme values (PHD Bucharest for population and budget). The analysis statistically confirms the differences observed in the descriptive data. The statistical test demonstrates that the resource differences (budget, personnel, experience) between the UC and NUC groups are not random, but are statistically significant (
p < 0.05), the only uncorrelated exceptions being personnel density and the geographic area of the county. Personnel density (employees/100,000 inhabitants) does not differ significantly between the UC and NUC groups (
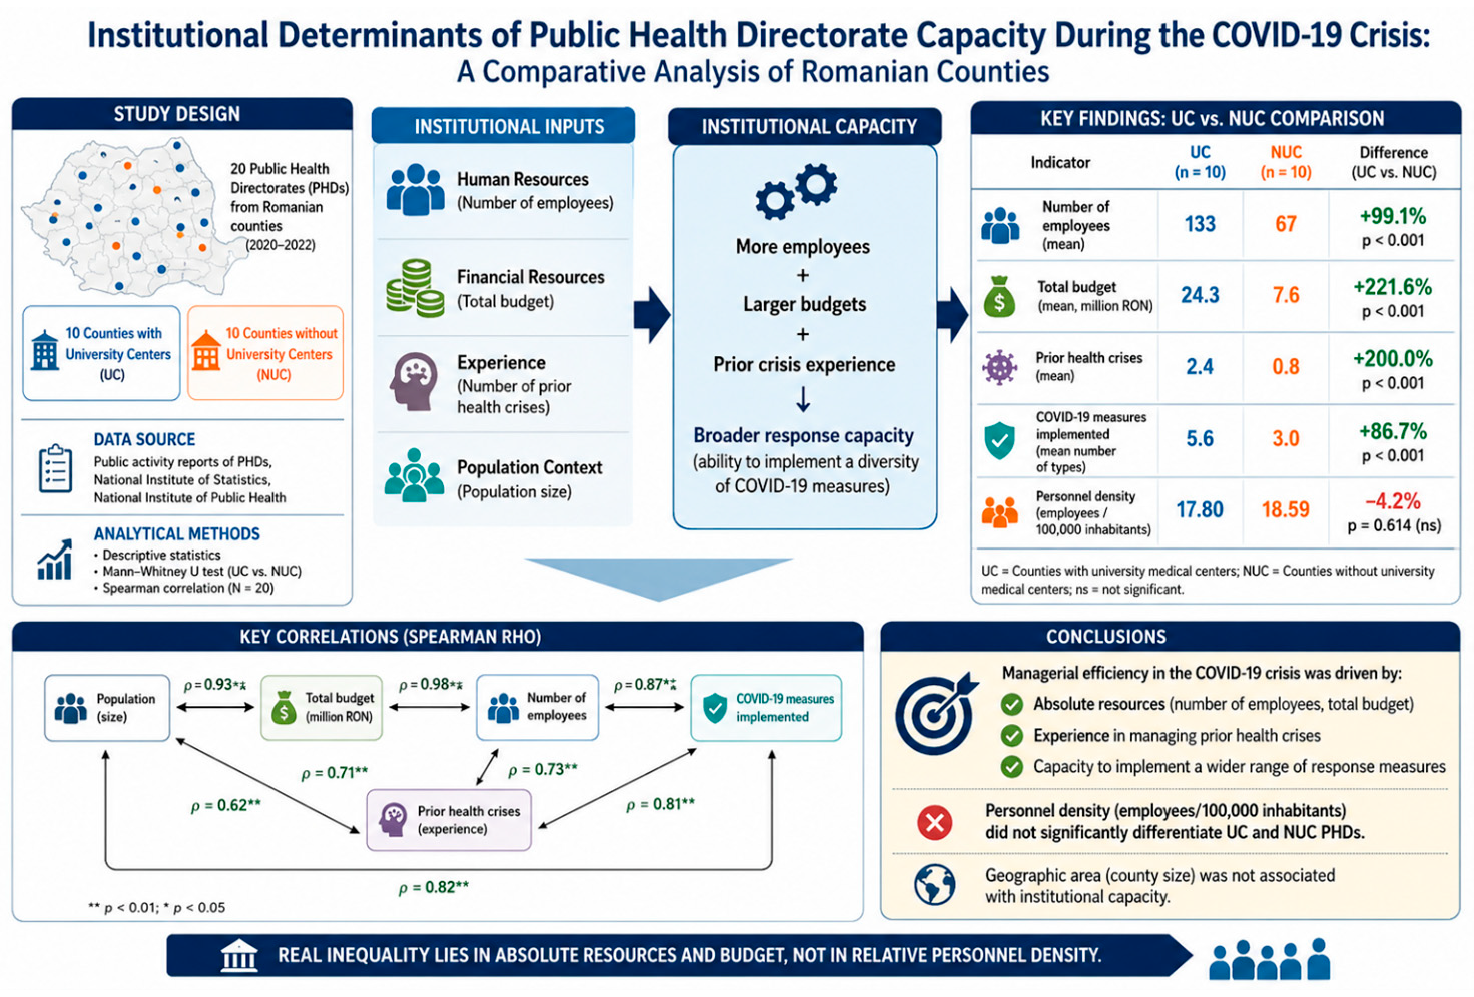
p = 0.614). Specifically, NUC PHDs have a mean of 18.59 emp./100,000, slightly higher than the UC mean of 17.80 emp./100,000 inhabitants. This apparently paradoxical situation is explained by the existence of NUCs with small populations and a relatively large number of staff (e.g., Sălaj: 21.88 emp./100,000 inhabitants, Mehedinți: 20.47 emp./100,000 inhabitants), which raises the NUC group’s average on this indicator.
3.3. Detailed Comparative Analysis UC vs. NUC: Absolute Differences, Percentage Differences, and Statistical Significance
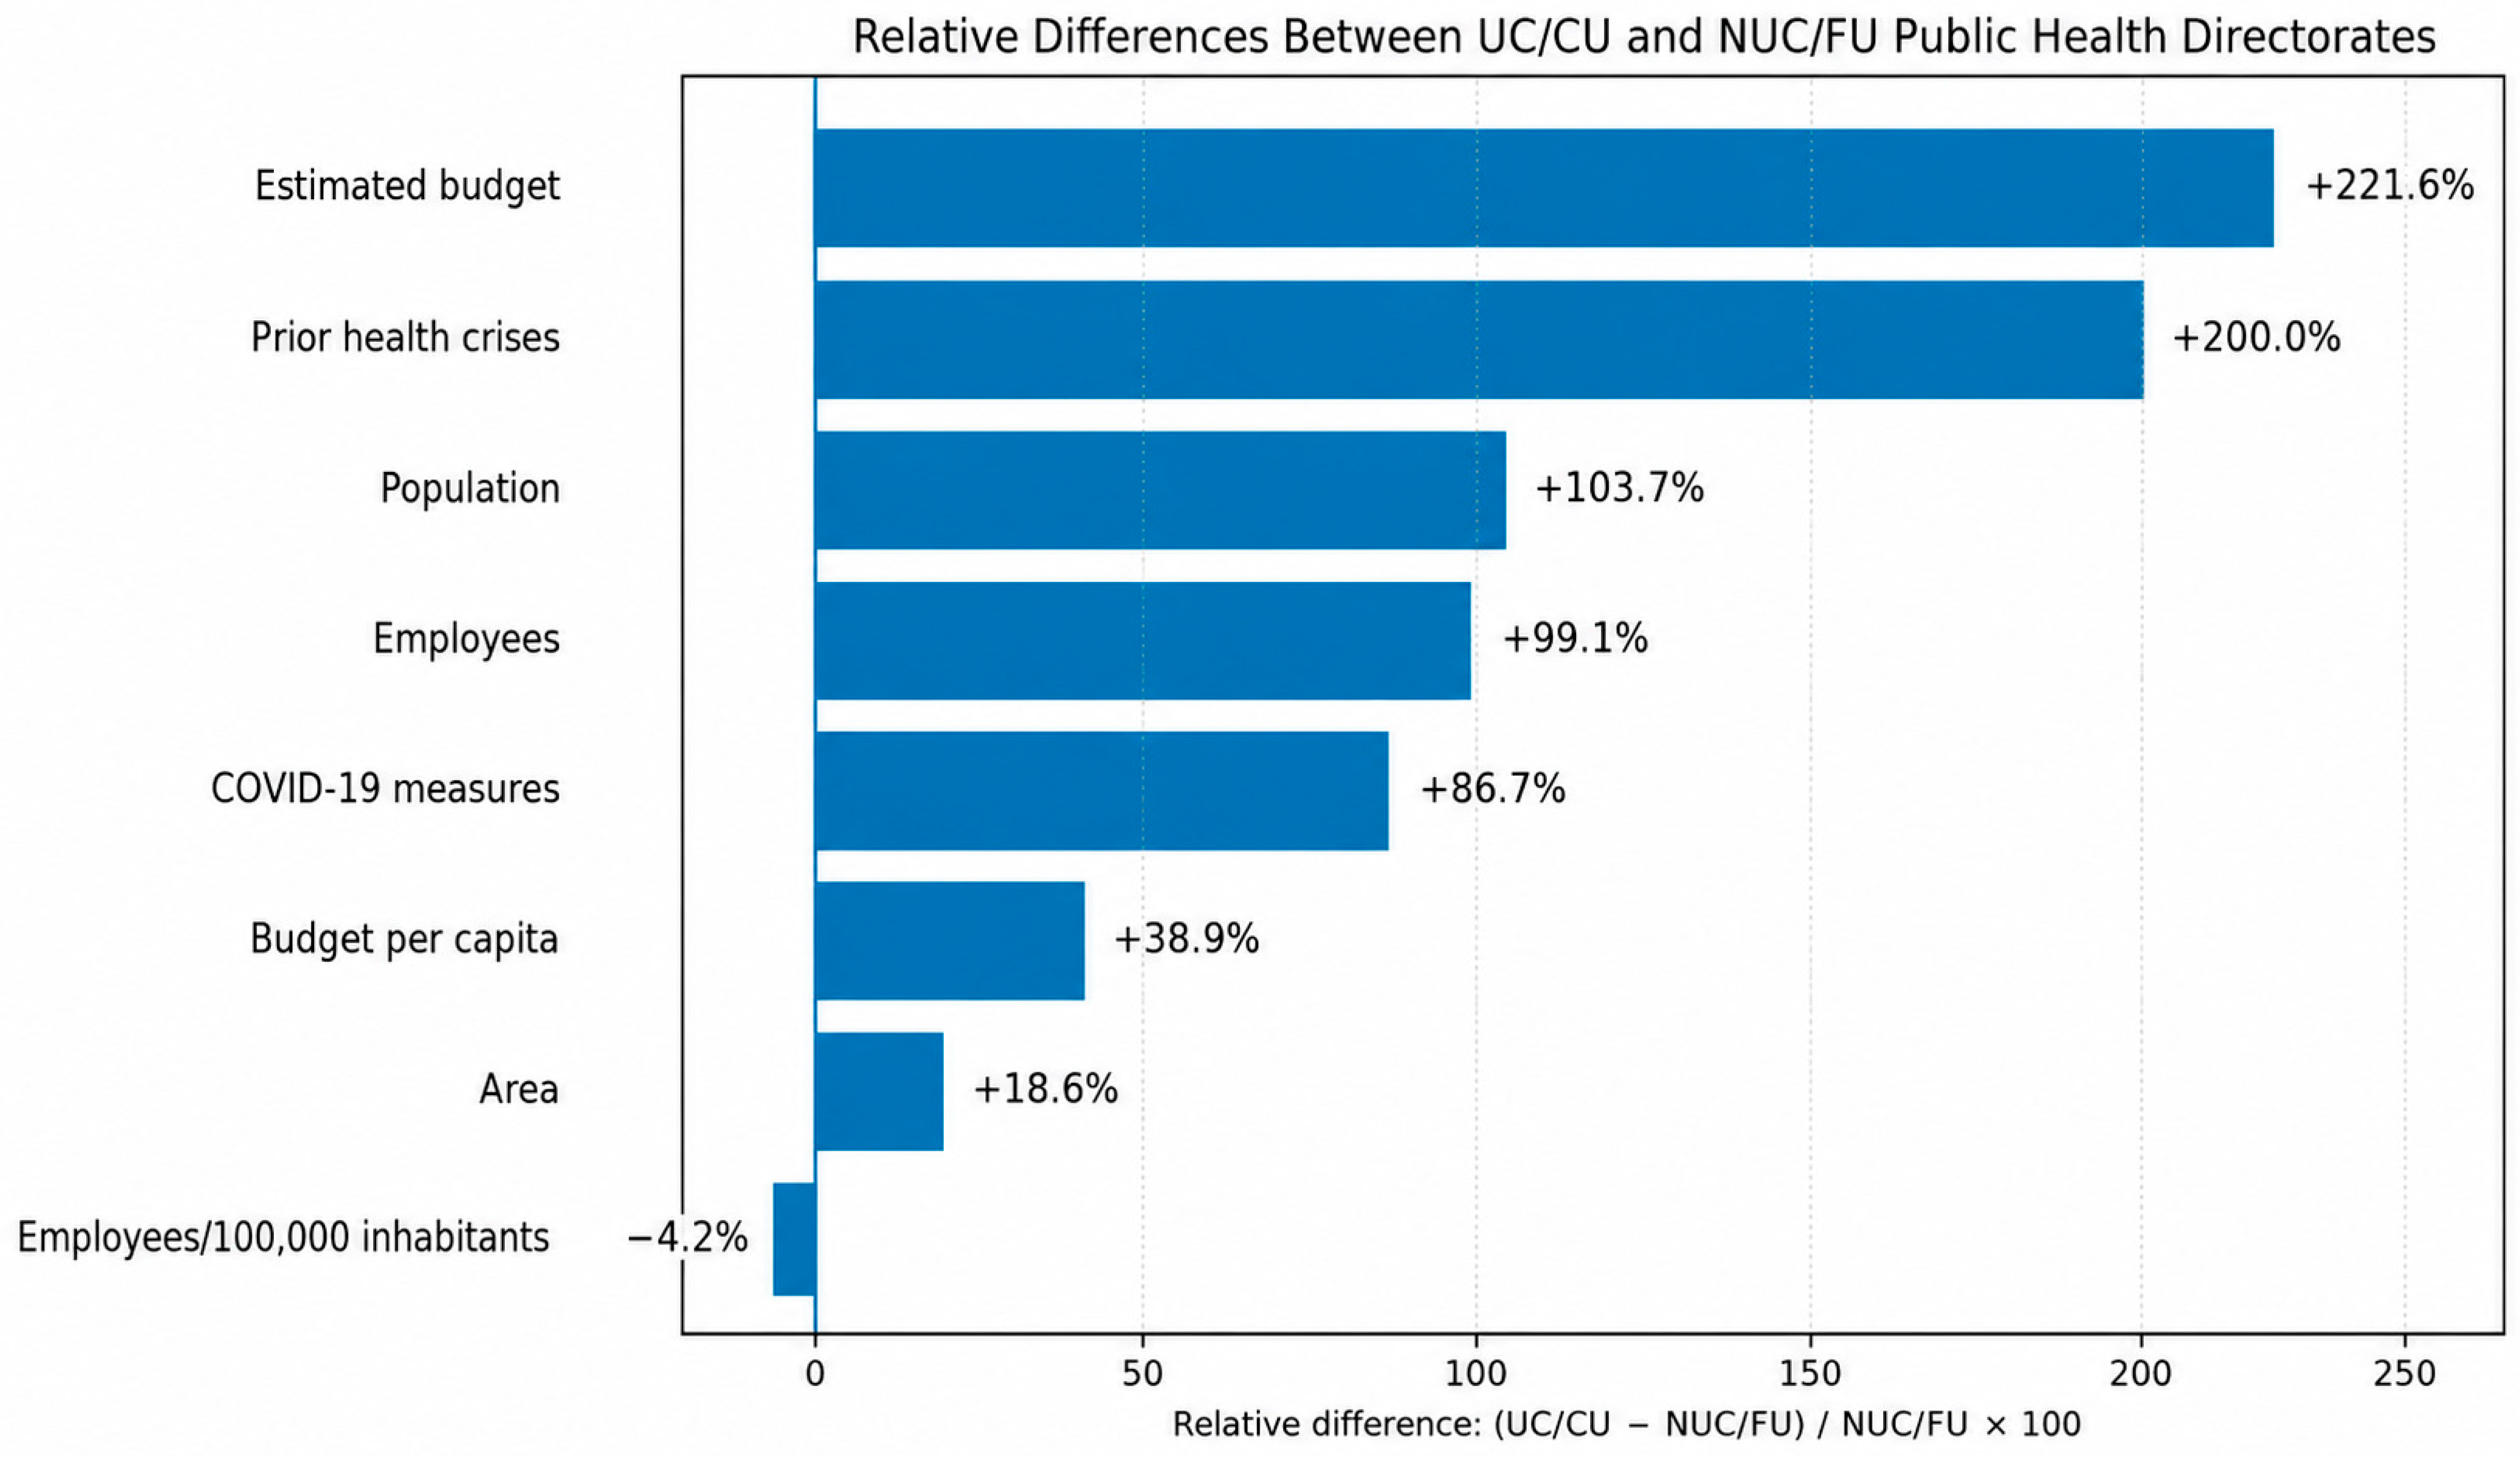
Figure 2 details the absolute and percentage differences between the UC and NUC group means for each indicator, with a substantive interpretation of the identified differences.
The largest percentage difference is recorded in total budget (+16.8 mil. RON, +221.6%), total number of employees (+66 employees, +99.1%), and prior crisis experience (+1.6 crises, +200.0%). The percentage difference in budget (+221.6%) is the largest, but is significantly influenced by PHD Bucharest (89.2 mil. RON), which distorts the UC mean. The UC budget median (17.4 mil. RON) is closer to the NUC mean.
Personnel density and county area show no significant differences. Personnel density (Emp./100,000 inhabitants) is the only capacity indicator that does not significantly differentiate UC from NUC—this indicates a relatively equitable distribution of personnel in relation to the population served, even though in absolute terms UC PHDs have far more employees. County area does not significantly differentiate institutional capacity.
3.4. PHD Personnel Density (Employees/100,000 Inhabitants)
The distribution of the personnel density indicator (PHD employees per 100,000 inhabitants) for all 20 PHDs analyzed is presented in
Table 5. The values represent the average for the 2020–2022 period.
The density indicator does not reveal an under-allocation of human resources per capita for non-university counties. On the contrary, the mean density is slightly higher in the NUC group (18.59 employees/100,000 inhabitants) compared to the UC group (17.81 employees/100,000 inhabitants), with the difference between groups not being statistically significant following the application of the Mann–Whitney U test (p = 0.614). It can be observed that PHD Sălaj, Mehedinți, Harghita, and Alba (all NUC) have a higher density than several UC PHDs (Mureș, Bihor, Dolj, Constanța). PHD Mureș has the lowest density in the sample (15.95 emp./100,000 inhabitants), despite being a PHD with a university center. These findings suggest that personnel allocation may be broadly aligned with population size, adhering to demographic quotas. Nevertheless, the inefficiency of NUC groups stems from the lack of an absolute critical mass of personnel (an average of only 67 employees in total), which proves to be critically necessary for diversifying measures during a crisis, regardless of how small the county’s population may be.
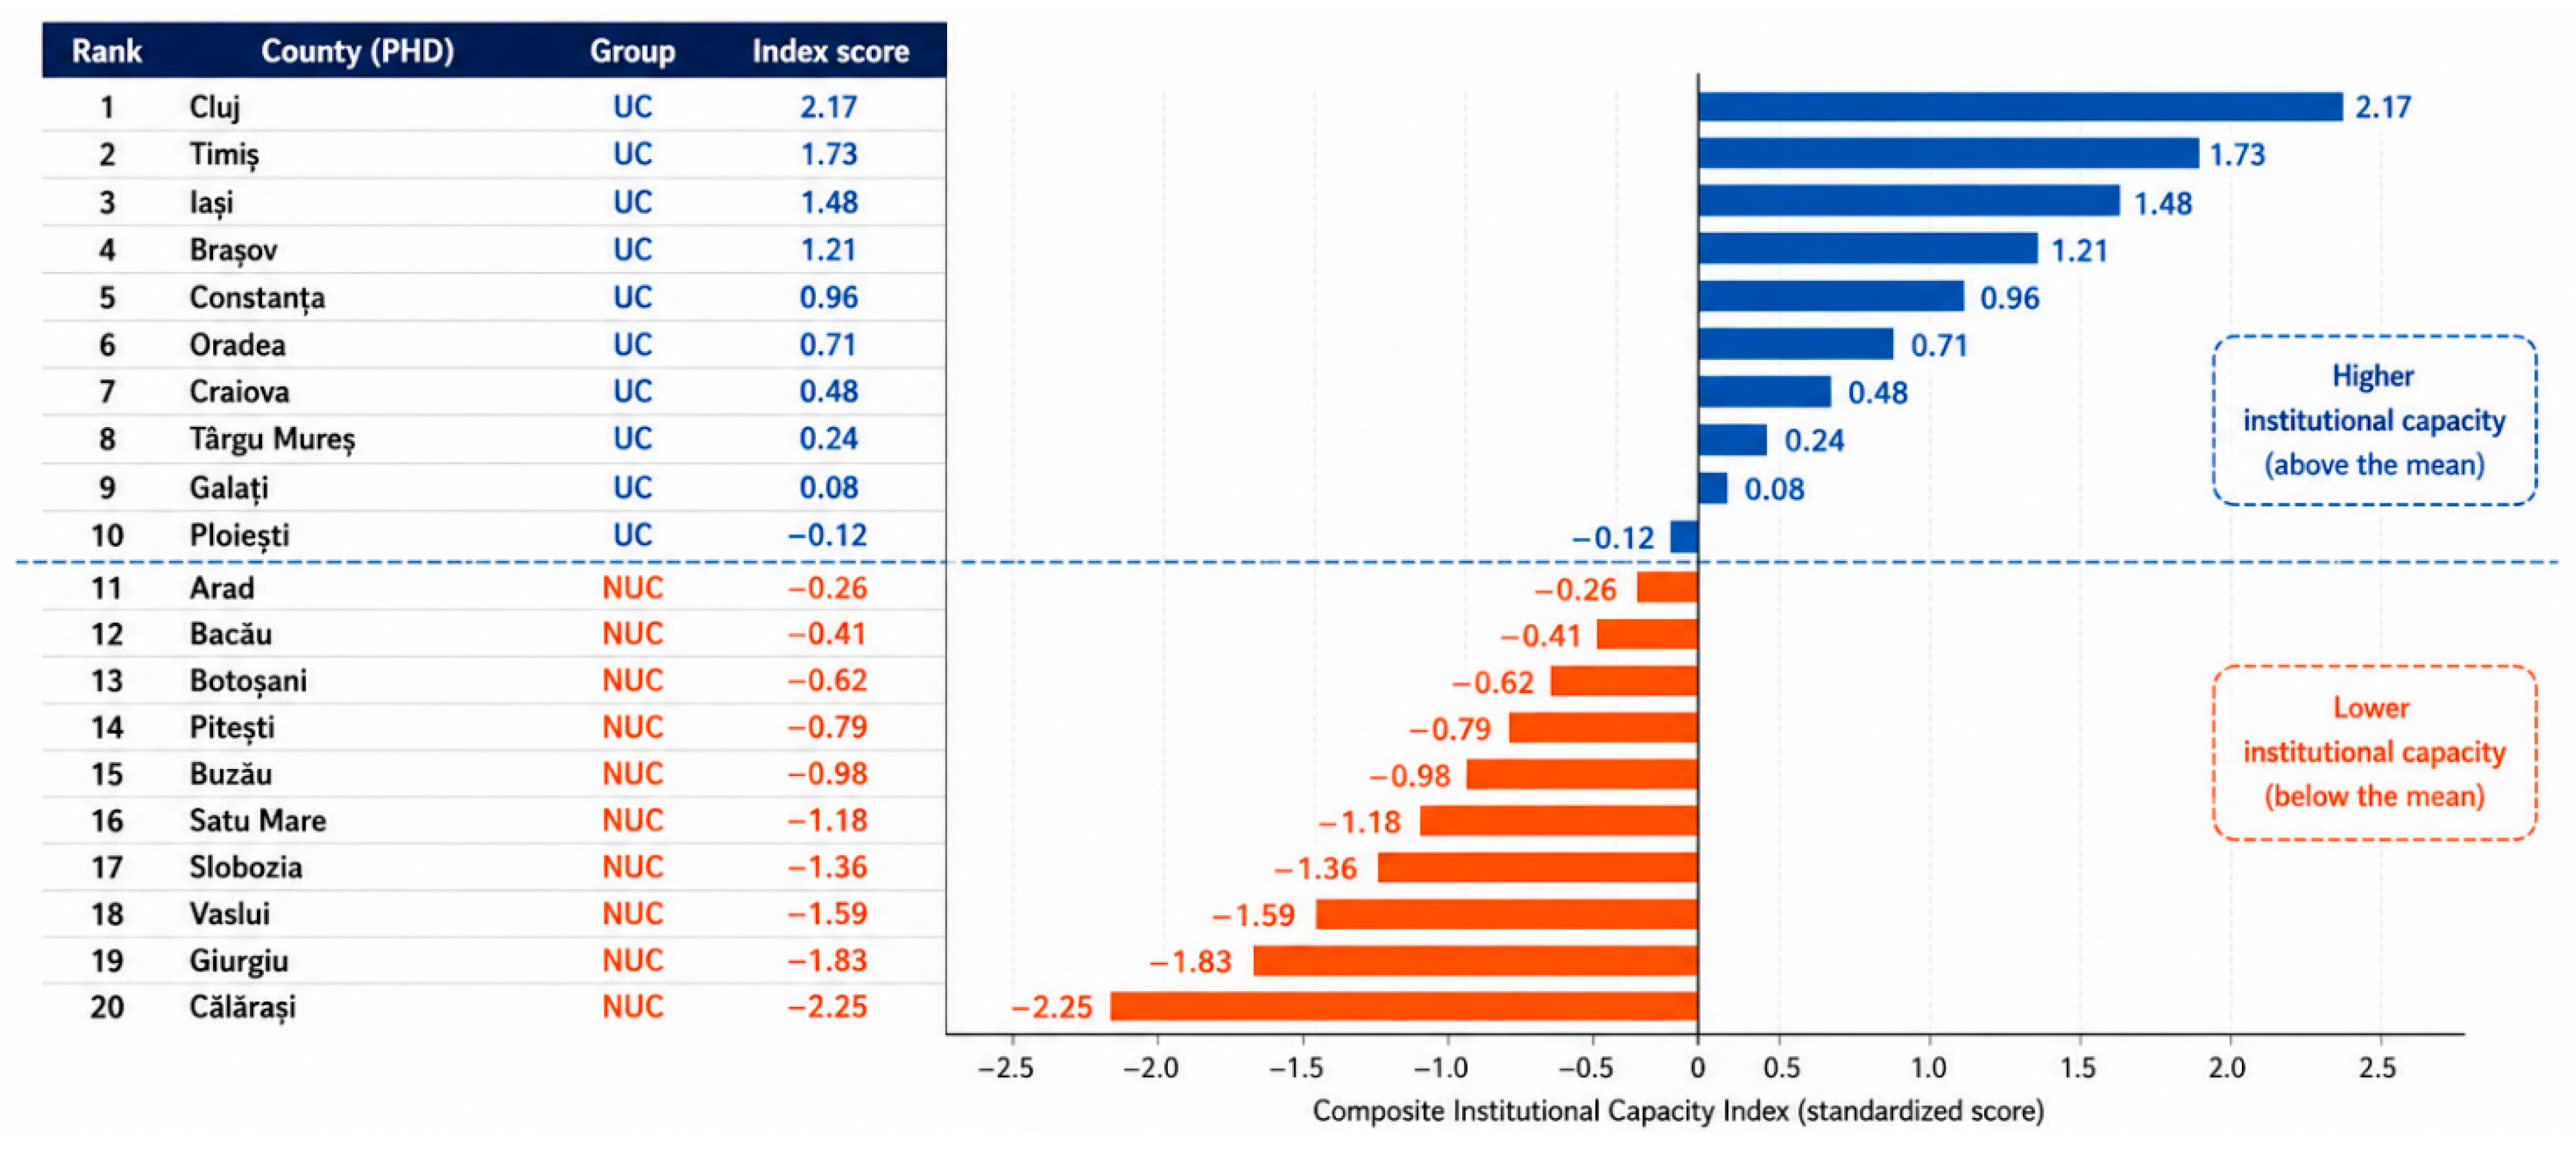
The index revealed a clear concentration of high-capacity institutions among counties with university medical centers. Bucharest and Cluj achieved the highest scores, whereas several NUCs clustered in the limited-capacity category. These findings support the hypothesis that institutional capacity is more strongly associated with absolute resources and accumulated crisis-management experience than with personnel density alone (
Figure 3).
3.5. Measures Implemented
Table 6 presents the number of types of measures implemented by each PHD in managing the COVID-19 crisis, the most direct indicator of active managerial capacity in the context of the crisis. The number of types of measures was calculated through systematic coding of the activity reports, identifying distinct categories of measures: testing and epidemiological investigation; quarantine and isolation; COVID hospital coordination; organization of vaccination centers; communication and health education; inter-institutional collaboration (Emergency Situation Inspectorates, local authorities); digital platforms; and staff training. Each type was assigned a score of 1—measure implemented, and a score of 0—measure absent, with the maximum possible score being 8 (the arithmetic mean of each type of measure implemented). The sum of these scores, per institution, generated a final quantitative index of operational diversity and the breadth of administrative decision-making.
Unlike personnel density, the UC vs. NUC separation on this variable is clear and consistent. All UC PHDs implemented a minimum of 5 types of measures; no NUC PHD exceeded 4 types. Counties with a university hub hold the top positions (Bucharest and Iași reaching the maximum score of 7), reflecting their capacity to carry out a far more complex and diversified range of actions (testing, vaccination, investigations, communication) compared to the remaining counties.
3.6. Spearman Correlation Matrix
The relationships between resources and performance are analyzed using the Spearman correlation matrix (
Table 7). It demonstrates very strong associations: total budget and number of employees (rho = +0.98,
p < 0.01), total budget and number of measures (rho = +0.88,
p < 0.01), and number of employees and number of measures (rho = +0.87,
p < 0.01). The more employees an institution has and the larger its budget, the greater the number of epidemiological measures it manages to implement, confirming that greater institutional resources were associated with a broader range of implemented measures.
Employees/100,000 inhabitants shows a weak and non-significant correlation with number of measures (rho = +0.21, ns) and with number of employees (rho = +0.62, p < 0.01), confirming that the relative density of personnel is not a strong predictor of managerial response capacity.
3.7. Exploratory Institutional Capacity Index
The composite index brings together the variables into a single overall efficiency indicator ranging from 0 to 100%, calculated as the arithmetic mean of 4 normalized indicators: personnel density (employees/100,000 inhabitants), budget/capita, prior crises, and number of measures (
Table 8). Composite index methodology: individual min-max normalization per indicator: (val − min)/(max − min) × 100, where 0 = the weakest PHD in the sample and 100 = the best on that respective indicator.
The inclusion of employees/100,000 inhabitants (with similar UC and NUC means) in the composite explains why some NUC PHDs (e.g., Sălaj, Harghita) achieve higher rankings than certain UC PHDs (e.g., Dolj, Bihor) on this dimension. These results show that a higher personnel density score is completely offset by deficits in historical expertise, itemized budget, and operational incapacity.
The exploratory index provides a descriptive ranking of institutions according to the selected indicators: PHDs from the university core clearly dominate the high-efficiency rankings (>70%, Bucharest and Cluj), while the non-university territorial group falls within the limited efficiency category (below 40% thresholds), demonstrating that dense human resources without funding and expertise do not sustain efficiency.
4. Discussion
The findings of the present study demonstrate the presence of consistent differences between Public Health Directorates (PHDs) located in counties with university medical centers (UC) and those operating in counties without university centers (NUC). Significant disparities were identified for five of the seven variables examined, suggesting that these differences reflect underlying structural inequalities in the distribution of public health resources rather than random variation. The pressures generated by the COVID-19 pandemic further amplified these pre-existing institutional imbalances.
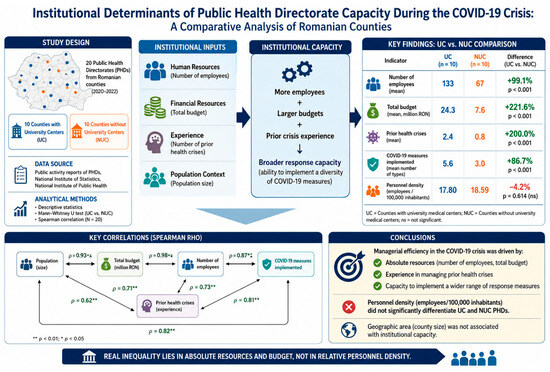
Among all indicators, the largest disparity was observed for institutional budget allocation, with UC PHDs receiving on average 221.6% higher budgets than NUC PHDs. Substantial differences were also identified for prior crisis-management experience (+200.0%) and workforce size (+99.1%). These observations are consistent with the findings of Lupu and Tiganasu (
Lupu & Tiganasu, 2022a), who reported that the ability to rapidly mobilize and coordinate institutional resources represented a major determinant of healthcare system performance during the COVID-19 pandemic across 31 European countries. Their analysis classified Romania among the lower-performing systems during the initial pandemic wave, largely due to structural limitations similar to those identified in the present county-level investigation. Comparable conclusions have been reported in OECD analyses, which indicate that sustained public health investment and institutional stability contribute to faster, more diversified, and more effective responses to public health emergencies (
OECD, 2019).
In contrast, personnel density expressed as employees per 100,000 inhabitants did not differ significantly between the two groups (UC: 17.80 vs. NUC: 18.59;
p = 0.614). This finding indicates that smaller counties generally maintain staffing levels comparable to, or slightly higher than, those observed in larger counties when population size is taken into account. Consequently, the differences observed in response capacity appear to be more strongly associated with absolute institutional resources, including workforce size (133 vs. 67 employees) and total budget allocation (24.3 vs. 7.6 million RON), rather than staffing density alone. This distinction may have important implications for future public health planning and resource-allocation strategies (
Lupu & Tiganasu, 2022a).
The diversity of COVID-19 response measures emerged as the variable that most clearly differentiated UC and NUC PHDs, with average scores of 5.6 and 3.0, respectively (
p < 0.001). Furthermore, this indicator showed the strongest association with the absolute number of employees (ρ = 0.87,
p < 0.01). These results suggest that larger workforces may facilitate the implementation of a broader range of interventions, independently of personnel density. Similar conclusions were reported by Tang et al. (
Tang et al., 2026), who analyzed pandemic responses across 27 OECD member countries and found that institutions with greater staffing capacity implemented public health interventions more rapidly and demonstrated greater flexibility in adapting to changing epidemiological conditions.
One of the most practically relevant findings of the study concerns the substantial difference in prior crisis-management experience between UC and NUC PHDs (2.4 vs. 0.8 crises;
p < 0.001). On average, PHDs located in university counties had previously managed two to three major public health emergencies, including the 2009 H1N1 influenza outbreak and the measles epidemics recorded between 2017 and 2019. In contrast, institutions from the NUC group reported considerably less previous exposure to major epidemiological events. This observation aligns with the broader literature on institutional resilience and emergency preparedness. Norris et al. (
Norris et al., 2008) argued that organizations exposed to previous crises develop adaptive capacities that enhance their ability to respond to future emergencies. Similarly, Volintiru and Gherghina (
Volintiru & Gherghina, 2023) emphasized that institutional resilience emerges through accumulated experience and sustained collaboration with community stakeholders, allowing organizations to respond more effectively under conditions of uncertainty. Prior exposure to epidemiological crises may therefore contribute to greater organizational flexibility, improved decision-making processes, and more efficient interinstitutional coordination.
The absence of a significant association between county area and institutional capacity indicators represents another noteworthy finding. Although larger territories may be expected to generate greater logistical complexity, county area was not significantly associated with workforce size, budget allocation, or response capacity. Similar observations have been reported by Vola et al. (
Vola et al., 2022), who found that regional size alone did not explain differences in public health performance across Italian regions. Instead, factors such as urbanization, concentration of expertise, and healthcare workforce availability were more important determinants of institutional performance. Comparable conclusions were reported by Dragano et al. (
Dragano et al., 2016) in Germany, where disparities between local public health offices were primarily attributed to differences in available financial resources rather than territorial size. Collectively, these findings suggest that geographic extent is a relatively weak predictor of institutional performance when compared with human and financial resource availability (
Calman et al., 2013;
Rezigalla, 2020;
Vola et al., 2022).
The exploratory institutional capacity index provided an integrated perspective on institutional resources, crisis experience, and response diversity. However, the interpretation of this index requires caution. Because all component indicators received equal weights, counties characterized by relatively high personnel density but limited financial resources or crisis-management experience achieved intermediate scores. Consequently, some NUC PHDs were positioned above institutions with substantially larger budgets or broader operational capacity. Although methodologically valid within the selected framework, alternative weighting strategies could produce different institutional rankings. Nevertheless, the index highlights an important distinction: personnel density alone does not fully capture institutional capacity. While staffing ratios appeared relatively balanced between groups, significant inequalities persisted with respect to total workforce size, budget allocation, and operational experience (
Sănătăţii & PUBLICĂ, 2012;
European Observatory on Health Systems and Policies, 2022).
This finding contributes to the broader debate regarding regional inequalities within the Romanian healthcare system. Previous analyses have emphasized the role of workforce shortages and unequal personnel distribution in generating territorial disparities (
Ion et al., 2021;
Khoury et al., 2020). The present study refines this interpretation by demonstrating that proportional staffing allocation does not necessarily translate into equivalent institutional performance. Despite slightly higher personnel density in NUCs, their capacity to implement diverse public health interventions remained substantially lower. This apparent paradox suggests that effective public health administration may require a minimum critical mass of specialists capable of sustaining multiple functional domains simultaneously, including epidemiological surveillance, testing, regulatory activities, and administrative coordination. Institutions operating below this threshold may face structural limitations regardless of proportional staffing indicators.
The differences identified between UC and NUC Public Health Directorates are consistent with disparities reported in other decentralized public health systems across Europe (
Dragano et al., 2016;
OECD, 2018;
Vola et al., 2022). Similar patterns have been described in Lebanon, where Khoury et al. (
Khoury et al., 2020) observed that regional public health institutions with stronger pre-existing capacities, including larger workforces, greater financial resources, and more developed collaboration networks, demonstrated superior performance during the COVID-19 response. These findings suggest that institutional preparedness is strongly influenced by resources accumulated before the onset of a crisis rather than by emergency measures implemented during the crisis itself.
The present results have several implications for public health policy in Romania. First, funding allocation mechanisms could be expanded beyond population-based criteria to incorporate indicators of epidemiological risk, institutional workload, and operational capacity. Such an approach may contribute to reducing disparities in available resources between university and non-university counties. Second, the establishment of minimum organizational standards for public health administration could help ensure that all PHDs maintain sufficient capacity to perform essential epidemiological, preventive, and administrative functions. Third, structured collaboration and mentoring programs between more experienced and less experienced PHDs could facilitate the transfer of institutional knowledge and best practices in crisis management. Finally, the adoption of standardized reporting frameworks would improve the comparability of administrative data and strengthen the monitoring of institutional performance across regions.
Interpretation and Original Contribution
Through micro-institutional level analysis of decentralized structures, the study contributes to the limited literature examining subnational public health administration during health emergencies, offering a detailed analytical perspective essential for future public policies. Each component of this research, from sample selection to the explanation of ethical constraints through the use of open data, reflects an original approach that transforms abstract bureaucratic documents into a genuine instrument of institutional diagnosis. Local institutional variables (county budget, locally employed personnel, local epidemic history) allow an understanding of how a single central directive is reflected in entirely different ways across county-level realities, due to pre-existing structural inequalities.
The selection of the sample into two groups (UC and NUC) demonstrates the extent to which the clinical healthcare system (with major hospitals concentrated in university centers) is identically reproduced, as an institutional echo, at the level of territorial administrative and public health structures.
The number of prior health crises managed and the number of types of measures implemented are two original indicators that allow direct quantification of institutional experience and complexity. Personnel density argues that geographic extent, considered in isolation, does not in reality constitute a factor that dictates or differentiates institutional capacity. The findings suggest that personnel availability alone may be insufficient to support a diversified institutional response when it is not accompanied by adequate financial resources and accumulated organizational experience.
5. Conclusions
This study examined institutional characteristics associated with COVID-19 response capacity across 20 Romanian Public Health Directorates.
Regarding the first research question, PHDs located in counties with university medical centers had significantly larger workforces, higher institutional budgets, greater prior crisis-management experience, and implemented a broader range of COVID-19 response measures than PHDs operating in non-university counties. In contrast, personnel density per 100,000 inhabitants and county geographic area did not differ significantly between the groups. These findings indicate that population-adjusted staffing and territorial size alone did not explain the observed differences in institutional response capacity.
Regarding the second research question, the diversity of COVID-19 response measures was strongly and positively associated with workforce size, institutional budget, and previous crisis-management experience. Conversely, its association with personnel density was weak and not statistically significant. Within the limits of the observational design, these results suggest that absolute organizational scale and accumulated institutional experience were more closely associated with the breadth of crisis-response activities than proportional staffing indicators alone.
Regarding the third research question, the exploratory institutional capacity index indicated a concentration of higher-capacity PHDs among counties with university medical centers, whereas most PHDs from non-university counties were classified in the limited-capacity category. Nevertheless, this index should be interpreted as a descriptive and exploratory instrument rather than as a validated measure of institutional performance because its results depend on the selected indicators, equal weighting, and the completeness of publicly reported information.
Several limitations should be considered. The study included only 20 of the 42 Romanian PHDs, limiting the generalizability and statistical power of the findings. Budget estimates were derived partly from publicly reported financial information and could not be verified against detailed institutional budget execution data. The response-capacity indicator quantified the diversity of documented measures rather than their intensity, quality, timeliness, or effectiveness. Differences in institutional reporting practices may also have influenced the document-coding process. Furthermore, the study used three-year averages, did not examine annual changes, and did not apply multivariable models. Consequently, the observed associations should not be interpreted as causal relationships. The exploratory capacity index was not externally validated.
The findings support several policy recommendations. Resource-allocation mechanisms could complement population-based criteria with indicators of epidemiological risk, institutional workload, minimum functional capacity, and previous crisis-management experience. Establishing minimum organizational standards may help ensure that all PHDs possess sufficient absolute capacity to perform surveillance, regulatory, communication, and emergency-coordination functions simultaneously. Structured collaboration and mentoring between more experienced PHDs and under-resourced institutions could facilitate the transfer of operational knowledge and standardized procedures. Finally, standardized administrative reporting across all Romanian PHDs would improve institutional comparability and support future longitudinal evaluations.
Future studies should include all Romanian Public Health Directorates, examine annual changes in resources and response activities, apply validated institutional-capacity measures, and use multivariable or longitudinal models to distinguish the independent contribution of financial resources, workforce availability, institutional experience, and population characteristics.



 ,
,