


Abstract
Population ageing is one of the most significant phenomena of the 21st century. The main objective of this study is to examine the relationship between organizational culture (supportive culture, innovative culture, market culture, and rule culture) and ageism (prejudice and discrimination) and whether this relationship is moderated by organizational age (obsolescence, age norms, perceived time and opportunities left, and disengagement phase). The sample for this study comprises 400 participants from organizations across different sectors. This is a quantitative and correlational study. The results indicate that only supportive culture and perceived time and opportunities left have a negative and significant effect on discrimination. As for the moderating effect, only obsolescence moderates the relationship between rule culture and prejudice. Additionally, older employees reported a stronger perception of a supportive culture. Considering the results obtained, a supportive culture can combat discrimination and the high perception of the ageing process, the latter requiring a greater understanding of what is meant by perceived opportunities.
1. Introduction
Population ageing is one of the most significant phenomena of the 21st century, with an impact on society and organizations (Kai et al., 2020). This is due to phenomena such as the baby boom after World War II and low birth rates (Ilmarinen, 2001). According to Navaneetham and Arunachalam (2025), from the 1970s onward, the decline in fertility accelerated worldwide (except in sub-Saharan Africa), leading to a reduction in the size of successive birth cohorts and an increase in the proportion of older people relative to younger people. Currently, one in nine people worldwide is aged 60 or over. In Portugal, according to data from the INE (2020), the elderly population will double in size relative to the young population between 2018 and 2080.
The demographic change in the workforce leads to a higher proportion of older employees, resulting from a longer working life (Bae & Choi, 2022), leading organizations to face challenges such as individuals staying longer in organizations and leading to reactions that can be perceived in the organizational culture (Kai et al., 2020). Personal attributes, such as gender, age, and hierarchical position, may influence perceptions of organizational culture and determine the group to which individuals belong (Dunger, 2025).
According to Tadesse Bogale and Debela (2024), organizational culture has a significant impact on workplace dynamics, which in turn influences interactions, treatment, and the management of employees. Ageism has been reflected in the workplace, manifesting as the devaluation and exclusion of employees, affecting not only them but also organizations (Cebola et al., 2021), and it is a current challenge for HRM (Savino, 2019).
The WHO (2021), in response to ageism, launched a global campaign aimed at preventing how we think, feel, and act about age, presenting preventive measures to address the phenomenon.
Combating ageism is a priority, particularly neglected factors such as self-directed ageism (Marques et al., 2020). And according to Gonyea (2013), determining the future of older employees’ work begins with understanding who they are, leading to the pertinent question: “Can organizational age moderate the relationship between organizational culture and ageism?”
Following an extensive bibliographic search, it was concluded that one gap in the literature is the lack of studies examining the relationship among these three variables (organizational culture, ageism, and organizational age).
In a study conducted by Eppler-Hattab et al. (2024), the authors concluded that clan culture has the strongest positive association with all dimensions of age acceptance, followed by innovative culture and rule-based culture. Regarding a goal-oriented culture, the association is negative across all dimensions of age acceptance. In this context, the aim of this study is to analyze and explore the impact of different organizational cultures on ageism, with the expectation that a supportive culture will have the strongest negative association with ageism. Another objective of this study is to test the moderating effect of organizational age on the relationship between organizational culture and ageism. Although, as mentioned earlier, we have not found studies on this moderating effect, we believe that certain indicators of organizational age may influence this relationship. For example, when an employee feels obsolete (one indicator of organizational age), the relationship between organizational culture and ageism may change.
This study is expected to enrich academic literature and organizational practices, particularly in combating ageism.
2. Theoretical Framework
2.1. Organizational Culture
Organizational culture (OC) plays a fundamental role in the development and management of an organization’s vision and mission and is an essential tool for organizational performance (Tan, 2019). It is differentiated by learned practices (Hofstede et al., 2010) and by employees’ perceptions of events in the organizational environment (Hofstede, 2011). Thus, in accordance with Smircich (1983), the study of organizations is linked to the concept of culture, which describes organizations and considers different concepts and their uniqueness (Tan, 2019).
Culture should not be underestimated, as what people may value or consider sacred in one culture may not be considered relevant in another (Schneider & Barsoux, 2003). In this regard, organizations need to find ways to leverage culture to boost business.
There is no consensus on the definition of OC, as it takes various forms (Abu-Jarad et al., 2010; Hofstede, 1984). According to Schein (2010), culture refers to a set of norms, values, beliefs, and attitudes. Hofstede et al. (2010) states that learned practices differentiate OC. Cameron and Quinn (2006) define organizational culture as a set of organizational values that are specific and taken for granted, shared through interpretations and memories of situational circumstances, without having to be communicated verbally.
Aldhafeeri (2024) mentions people, communication, teamwork, relationships, and leadership as antecedents of OC. Regarding the consequences, the author mentions that they can be positive—job satisfaction, organizational commitment, learning process, intention to stay (in the organization), and performance—or negative—conflict, turnover, and bullying.
In this study, we will focus on the contrasting values model developed by Quinn and Cameron (1983), which serves as the basis for the instrument used to assess organizational culture.
According to Quinn and Rohrbaugh (1983), the MVC provides a broad framework for guiding successive organizational analysis efforts. This model was developed based on how organizations work and are managed, leading to a precise description of other organizational aspects, such as the role of leadership and criteria for effectiveness (Quinn & Rohrbaugh, 1983). Furthermore, the MVC organizes effectiveness criteria into four models: rational-actor, open systems, human relations, and internal processes.
This model proposes four types of cultures: support or clan culture, innovation or adhocratic culture, rule or bureaucratic culture, and goal or market culture. Support or clan culture is characterized by shared values and goals aimed at improving teamwork (Quinn & Cameron, 1983). Innovation or adhocratic culture is identified as a temporary and dynamic culture, as it requires a high level of specialization from employees, who are rewarded for their availability and willingness to face changes and new challenges, reinforcing not only adaptability but also innovation within the organization itself (Quinn & Cameron, 1983). Rule-based or hierarchical culture stands out for its clear hierarchical structure, with a clear division of powers and a sense of impersonality. It is based on the standardization of processes, in line with formal rules and policies, among the organization’s employees (Quinn & Cameron, 1983). Goal-oriented or market culture is characterized by an external focus on creating competitive advantage and achieving goals. It is a culture based on the action of achieving goals, directed at external stakeholders, namely customers, and their needs (Quinn & Cameron, 1983).
2.2. Ageism
The term ageism was coined by Butler (1969). Although ageism is a phenomenon that has existed for centuries, the concept and definition of ageism have changed over the years (Ayalon & Tesch-Römer, 2018), and it has only recently become more widely used (WHO, 2021). B. R. Levy and Banaji (2002) define ageism as a modification of behavior, feelings, or beliefs in response to perceived chronological age. More recently, Ayalon and Tesch-Römer (2018) offer a more general definition of ageism as discrimination based on age. However, the WHO (2021) uses a three-part definition, comprising stereotypes (the way we think), prejudice (the way we feel), and discrimination (the way we act). Considering the three-part concept of ageism, there are three dimensions: (1) stereotypes, referring to a cognitive dimension (thoughts), (2) prejudice, referring to an affective dimension (feelings), and (3) discrimination, referring to a behavioral dimension (actions or behaviors) (Marques et al., 2020; Neto & Neto, 2024; WHO, 2021).
Iversen et al. (2009) identify that, about ageism, people perceive based on stereotypes, experience biased feelings, and discriminate through their behavior. Hofmeister-Tóth et al. (2021) note that these positive and negative stereotypes, which older people perceive, can have a beneficial or harmful impact on both their mental and physical health. As Ayalon and Tesch-Römer (2018) point out, individuals’ exposure to negative stereotypes throughout their lives leads to their internalization. They also note that age-related stereotypes precede discrimination based on an individual’s age, although both dimensions are debated in relation to ageism.
Age discrimination refers to behaviors (including actions, policies, and practices) directed at people based on their age (WHO, 2021). According to Faure and Ndobo (2015), workplace discrimination can lead to feelings of injustice, marginalization, and discomfort, raising questions about ethical responsibilities.
Ageism can occur (1) explicitly, that is, in a conscious, intentional, emotional, and active state; or (2) implicitly, which occurs in a state of lesser consciousness, emotion, or even lesser action that impacts social interactions, and can be expressed on three levels: (1) the micro or individual level, referring to emotions, thoughts, and actions; (2) the meso or social network level, referring to groups, organizations, and other social entities; and finally (3) the macro or cultural and institutional level, referring to cultural and social values (Ayalon & Tesch-Römer, 2018; B. R. Levy & Banaji, 2002; Marques et al., 2020; Neto & Neto, 2024; WHO, 2021).
2.2.1. Organizational Culture and Ageism
Organizational culture is an essential factor in resource availability, enabling the employability of older employees (Chen & Gardiner, 2019; Pak et al., 2019). Therefore, building organizational cultures that address the needs of older employees is fundamental, given the growing concern about occupational exclusion and the employability of older individuals (Patient et al., 2024; Renzetti, 2022).
To address challenges related to workforce ageing at both the academic and institutional levels, there has been recognition of the importance of developing age-related OC attributes (Appannah & Biggs, 2015; OCDE, 2019; Truxillo et al., 2015). To combat discrimination, efforts to address it must be integrated into the organizational culture (Rothbart & John, 1993) through a set of measures aimed at creating age-friendly conditions and reducing prejudice in the workplace (Eppler-Hattab et al., 2020; Swift et al., 2021). This is similar to the attempt to counter Stereotype Internalization Theory, which posits that lifelong exposure to negative stereotypes leads to their internalization among older people (Ayalon & Tesch-Römer, 2018).
The perception of CO is positively and negatively correlated with age (Belias & Koustelios, 2014). For Eppler-Hattab et al. (2024), a supportive culture is positively correlated with age, as it can lead to a greater perception of age-friendly environments by promoting interpersonal relationships, collaborative work, and loyalty. On the other hand, Belias and Koustelios (2014) note that a culture of innovation is negatively correlated with age.
Older employees prefer to work in a more friendly/familiar environment, where there is mutual trust, predominant interpersonal relationships, and an environment that is not only conducive to opportunities but also recognizes employees’ ambitions and teamwork (Belias & Koustelios, 2014). Patient et al. (2024) indicate that organizational culture, in terms of its characteristics, can predict stereotypes between groups, depending on age. The relationship between organizational culture and ageism can be explained by social identity theory, developed by Tajfel and Turner (1979), which posits that individuals categorize themselves and others into groups (e.g., young people and older people), and organizational culture can reinforce these divisions. When this division is based on age, according to the intergroup threat theory developed by Stephan et al. (2009), there is a perception that the other group poses a threat to the well-being, resources and values of the in-group (Ayalon, 2025). This situation may lead older employees to adopt stereotypes about ageing embedded in their organization’s culture; according to the theory of stereotype embodiment developed by B. Levy (2009), these stereotypes are internalized, affecting their health and functioning.
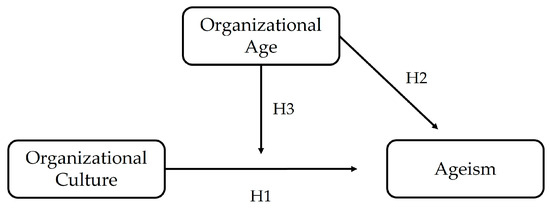
In view of the above, the first hypothesis of this study is suggested:
Hypothesis 1.
Organizational culture has a negative and significant effect on ageism.
2.2.2. The Moderating Role of Organizational Age in the Relationship Between Organizational Culture and Ageism
The concept of organizational age (OA) was defined by Sterns and Doverspike (1989) to understand the ageing process in the workplace and to determine when someone subjectively identifies as an older employee (Doucet et al., 2023). On the other hand, according to De Lange et al. (2021), OA refers to the ageing process of employees within their positions and organizations, that is, seniority within the position or organization.
Organizational age comprises several disparate indicators of ageing that have been explored in the literature—the employee’s career stage, obsolescence, and age norms (De Lange et al., 2021; Kooij et al., 2008; McCarthy et al., 2014a); there is also mention of indicators related to the concept of retirement (De Lange et al., 2021; Kooij et al., 2008; McCarthy et al., 2014a).
Obsolescence, according to Kooij et al. (2008), is one of the indicators of ageing in organizations and is a relevant indicator for OA, as it indicates changes or even limitations in an employee’s knowledge and skills over time within their organization. According to Doucet et al. (2023), employees who feel obsolete also perceive themselves as having high OA.
Age norms are defined as the shared judgment of an individual’s age standard or common age within an organizational role or context (Lawrence, 1998). These contribute to defining what constitutes an older employee within a given context (e.g., organization, sector, and seniority) and can manifest in different ways (McCarthy et al., 2014a). According to Doucet et al. (2023), individuals with a stronger perception of age norms have a higher OA.
Retirement, when planned, is an indicator of OA (McCarthy et al., 2014b). According to Doucet et al. (2023), the OA measure aims to assess the complexity of the reasons underlying disengagement and the transition to retirement. This indicator unfolds into two: (1) the perception of time remaining in the workplace, (2) and the perception of development opportunities still existing in the workplace (Doucet et al., 2023). In other words, the less time and fewer development opportunities the employee identifies in the organization, the greater their OA (Doucet et al., 2023).
According to Suberry and Bodner (2024), the perception of ageing refers to an individual’s subjective age and the process of ageing. In this regard, they note that this perception is associated with lower levels of age discrimination in the workplace. This reasoning leads us to formulate the following hypotheses:
Hypothesis 2.
Organizational age has a positive, significant effect on ageism.
Hypothesis 3.
Organizational age moderates the relationship between organizational culture and ageism.
Figure 1 presents the conceptual model, which summarizes the hypotheses formulated in this study.
Figure 1.
Conceptual Model.
3. Materials and Methods
3.1. Data Collection Procedure
This study seeks to understand how organizational culture influences ageism and how organizational age can moderate this relationship. To this end, an exploratory and correlational study was chosen.
The sampling process was non-probabilistic, convenience-based, intentional, and snowball-type (Trochim, 2000). This type of sampling was chosen due to the difficulty in finding participants and its low cost (Vilelas, 2025). It is also a cross-sectional study, as the data were collected over a single period.
The questionnaire was posted online on the Google Forms platform. The link to the questionnaire was sent via private message on LinkedIn and by email to the researchers’ contacts. Before beginning the questionnaire, they were asked to read the informed consent form, which explained the purpose of the study and guaranteed the confidentiality of their responses. It was also guaranteed that individual data would never be disclosed, since the analyses would be performed on the entire dataset. They were also informed that they could stop answering the questionnaire at any time if they wished. After reading the informed consent form, they had to answer a question about their willingness to participate in the study. If they answered no, they were directed to the end of the questionnaire. If they answered yes, they were directed to the next section to complete the questionnaire.
The questionnaire consisted of several sociodemographic questions, the purpose of which was to characterize the sample, and three scales: First Organizational Culture Unified Search (FOCUS), Fabroni Scale of Ageism (FSA–SF) and Organizational Age Scale (OAS). Data collection was available from 15 February 2025 to 27 March 2025.
3.2. Participants
This study involved 422 volunteer participants, of whom 400 constitute the sample (N = 400), which is considered adequate according to Kyriazos (2018).
In this sample, more than half of the respondents were female (60.8%), with the remainder being male (39%) and “prefer not to say” (0.3%). In terms of chronological age, participants ranged from 18 to 66 years, with more than half of the sample in the 30–49 age group, accounting for 63.6% of the sample. Regarding educational qualifications, more than 90% of the sample participants reported having higher education. Regarding country of origin, 94% of the sample reported being from Portugal. By sector of activity, the private sector accounts for 85.5%, followed by 7.8% in the public sector, 3.3% in the public/private sector, and 3.5% in the third sector. In terms of sector of specialization, there was a wide variety of responses, with industry (12.3%), other (13%), human resources (11%), technology (9.8%), consulting (9.3%), and banking (9.0%) standing out. Regarding company size, 58% of the sample reported working for companies with more than 250 employees. In terms of position, 41% of the sample held technical positions, followed by 31% in managerial positions, 20.3% in executive positions, and finally 7.8% in operational positions. In terms of seniority, most participants in the sample (43%) had been with their company for 1–5 years. Finally, regarding economic perceptions, more than half of the sample (58.2%) reported having sufficient income.
3.3. Data Analysis Procedure
After data collection, they were imported into IBM SPSS AMOS and IBM SPSS Statistics 30. The validity of the instruments was tested using confirmatory factor analysis in AMOS Graphics 30 software. The procedure followed a “model generation” logic (Jöreskog & Sörbom, 1993). Following the recommendations of Hu and Bentler (1999), six fit indices were calculated: chi-square/degrees of freedom (χ2/df); Tucker–Lewis index (TLI); goodness-of-fit index (GFI); comparative fit index (CFI); root mean square error of approximation (RMSEA); and root mean square residual (RMSR). The chi-square/degrees of freedom ratio (χ2/df) should be less than 5. The CFI, GFI, and TLI values should be equal to or greater than 0.90. For the RMSEA to be considered a good fit, its value must be less than 0.08 (MacCallum et al., 1996). The lower the RMSR value, the better the fit (Hu & Bentler, 1999). Next, construct reliability and convergent validity (AVE) were calculated for each instrument dimension used in this study. Construct reliability values must be greater than 0.70, and the AVE value must be equal to or greater than 0.50 (Fornell & Larcker, 1981). However, values between 0.40 and 0.50 are acceptable if the construct reliability is 0.70 or higher (Hair et al., 2010, 2017).
Internal consistency is assessed using Cronbach’s alpha, which should be greater than 0.70 in organizational studies (Bryman & Cramer, 2003). A sensitivity study was carried out by calculating measures of central tendency and shape for the various items on the scales under study. All items must have responses at all points and must not have the median close to either extreme. As for their absolute values of asymmetry and kurtosis, they must be below 2 and 7, respectively (Finney & DiStefano, 2013).
The descriptive statistics of the variables under study were tested using Student’s t-test for a sample. The effects of sociodemographic variables on the variables under study were tested using Student’s t-tests for independent samples (when the independent variable consisted of two groups) and the One-Way ANOVA (when the independent variable consisted of more than two groups). To test the association between the variables under study, Pearson’s correlation coefficients were calculated. The hypotheses formulated were tested using multiple linear regressions. A significant level of 0.05 was considered.
3.4. Instruments
The perception of organizational culture was assessed using the FOCUS instrument, validated and adapted for the Portuguese population by Neves (2000). The instrument consists of four dimensions: (1) culture of innovation, encompassing items 2, 5, 6, 7, 9, 13, 14, 15, 16, and 33; (2) support culture, comprising items 1, 17, 20, 24, 25, 27, 28, 29, 31, 32, and 34; (3) a culture of goals, including items 3, 4, 8, 10, 11, and 12; and (4) a culture of rules, encompassing items 18, 19, 21, 22, 23, 26, 30, and 35. Thus, 35 items are assessed on a 6-point Likert scale. Items 1 and 2 are scored from 1—“No one” to 6—“Everyone.” Items 3 to 15 are scored from 1—‘Never’ to 6—“Always.” Items 16 to 35 are rated from 1—“Not at all” to 6—“Very much.” After performing a four-factor confirmatory factor analysis, it was found that items 1, 2, 9, and 30 needed to be removed because they had a low factor weight. The adjustment indices obtained were adequate or very close to adequate values (χ2/gl = 2.25; GFI = 0.89; CFI = 0.95; TLI = 0.93; RMSEA = 0.056; SRMR = 0.085). The construct reliability of the instrument’s dimensions ranges from 0.87 (goal culture) to 0.94 (support culture). As for convergent validity, the AVEs range from 0.52 (goal culture) to 0.63 (support culture). Regarding internal consistency, Cronbach’s alpha values range from 0.87 (goal culture and rule culture) to 0.95 (support culture).
To measure perceptions of ageism, the Fabroni Scale of Ageism (FSA–SF) was used, validated and adapted for the Portuguese population by Neto and Neto (2024). The instrument consists of three dimensions: stereotypes (items 1, 2, and 3); prejudice (items 4, 5, and 6); discrimination (items 7, 8, and 9). These items are classified on a 7-point Likert scale (from 1—“Strongly disagree” to 7—“Strongly agree”). Initially, a three-factor confirmatory factor analysis was performed. However, the stereotypes dimension was significantly correlated with the discrimination dimension. The strong correlation between these two dimensions leads us to conduct a new two-factor analysis to avoid multicollinearity problems in subsequent statistical analyses. A new confirmatory factor analysis was performed on two factors. The result of this union was designated as discrimination. The adjustment indices obtained were adequate (χ2/gl = 2.12; GFI = 0.97; CFI = 0.97; TLI = 0.95; RMSEA = 0.053; SRMR = 0.052). Regarding construct reliability, the prejudice dimension has a value of 0.78, and the discrimination dimension has a value of 0.81. Regarding convergent validity, the prejudice dimension has an AVE value of 0.55. The discrimination dimension has an AVE value of 0.42, below 0.50. However, because the composite reliability is greater than 0.70, values greater than 0.40 can be accepted (Hair et al., 2010, 2017). Regarding internal consistency, prejudice has a Cronbach’s alpha value of 0.77 and discrimination of 0.80.
Organizational age was measured using the OAS instrument by Doucet et al. (2023). This instrument consists of 17 items classified on a Likert scale (from “1” Strongly Disagree to “7” Strongly Agree). The instrument consists of five factors: obsolescence (items 1, 2, and 3); perception of time remaining (items 4, 5, 6, and 7); disengagement phase (items 8, 9, 10, and 11); perceived development opportunities (items 12, 13, and 14); Age norms (items 15, 16, and 17). In this context, 17 items were identified: items 1 to 3 were evaluated on a 6-point Likert scale, and items 4 to 17 on a 7-point Likert scale. After performing a 5-factor confirmatory factor analysis, it was found that a new 4-factor analysis was necessary because the dimensions “perception of remaining time” and “development opportunities” were strongly correlated. The dimension resulting from this union was named “perceived remaining time and opportunities”, which could reveal problems of multicollinearity in subsequent statistical analyses. It was necessary to remove items 1, 13, and 15 because they had a low factor weight. The fit indices obtained were adequate (χ2/df = 2.49; GFI = 0.95; CFI = 0.95; TLI = 0.90; RMSEA = 0.061; SRMR = 0.095). The construct reliability values range from 70 (obsolescence) to 0.84 (age norms). Regarding convergent validity, the dimensions of obsolescence (0.54) and age norms (0.73) exceed 0.50. The dimensions “perceived remaining time and opportunities” (0.42) and “disengagement phase” (0.46) have values below 0.50. However, as their composite reliability values are above 0.70 (0.81 for the perceived remaining time and opportunities dimension and 0.76 for the disengagement phase dimension), AVE values above 0.40 are accepted (Hair et al., 2010, 2017). Regarding internal consistency, Cronbach’s alpha values range from 0.70 (obsolescence) to 0.83 (age norms).
Regarding item sensitivity, all items have responses at all points, and none have a median close to either extreme. Their asymmetry and kurtosis values are below 2 and 7, respectively, indicating that they do not grossly violate normality assumptions (Finney & DiStefano, 2013).
4. Results
4.1. Descriptive Statistics of the Variables Under Study
Regarding the dimension of organizational culture, all responses in this study are significantly above the midpoint (3.5), highlighting a culture of rules and suggesting that participants perceive it more strongly. Regarding the dimensions of ageism and organizational age, the values are below the midpoint (4), indicating that participants in this study have a low perception of prejudice and discrimination (ageism) and a low self-perception of ageing (organizational age) (Table 1). Only the disengagement phase dimension of the organizational age scale does not differ significantly from the scale’s midpoint (Table 1).
Table 1.
Descriptive statistics of the variables under study.
4.2. Effect of Sociodemographic Variables on the Variables Under Study
This section presents only the effects of sociodemographic variables on the variables under study, whose results were statistically significant.
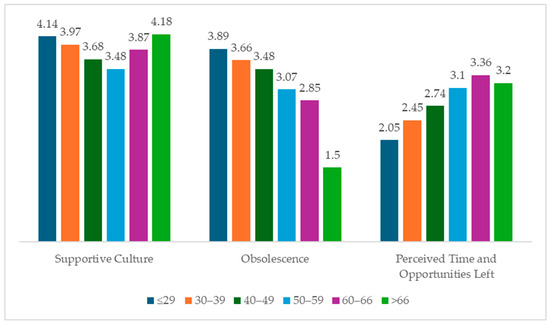
Age group only has a significant effect on supportive culture (F (5, 394) = 4.16; p = 0.001; η2p = 0.05), obsolescence (F (5, 394) = 9.42; p < 0.001; η2p = 0.06), and perceived remaining time and opportunities (F (5, 394) = 10.20; p < 0.001; η2p = 0.12). Participants aged 29 or younger and those aged 66 or older have the highest perception of support culture (Figure 2). On the other hand, participants aged 50–59 have the lowest perception of a supportive culture (Figure 2). As age increases, perceived obsolescence decreases. As for perceived remaining time and opportunities, perceptions increase with age, though they decrease slightly among participants aged 66 and older (Figure 2).
Figure 2.
Effect of age on the variables under study.
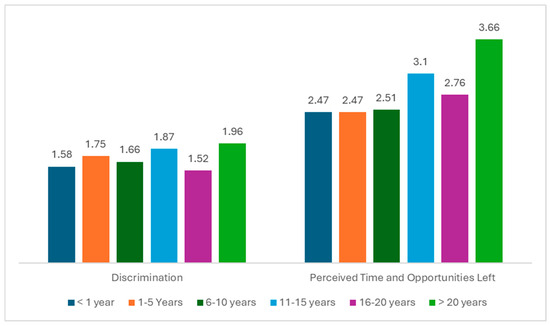
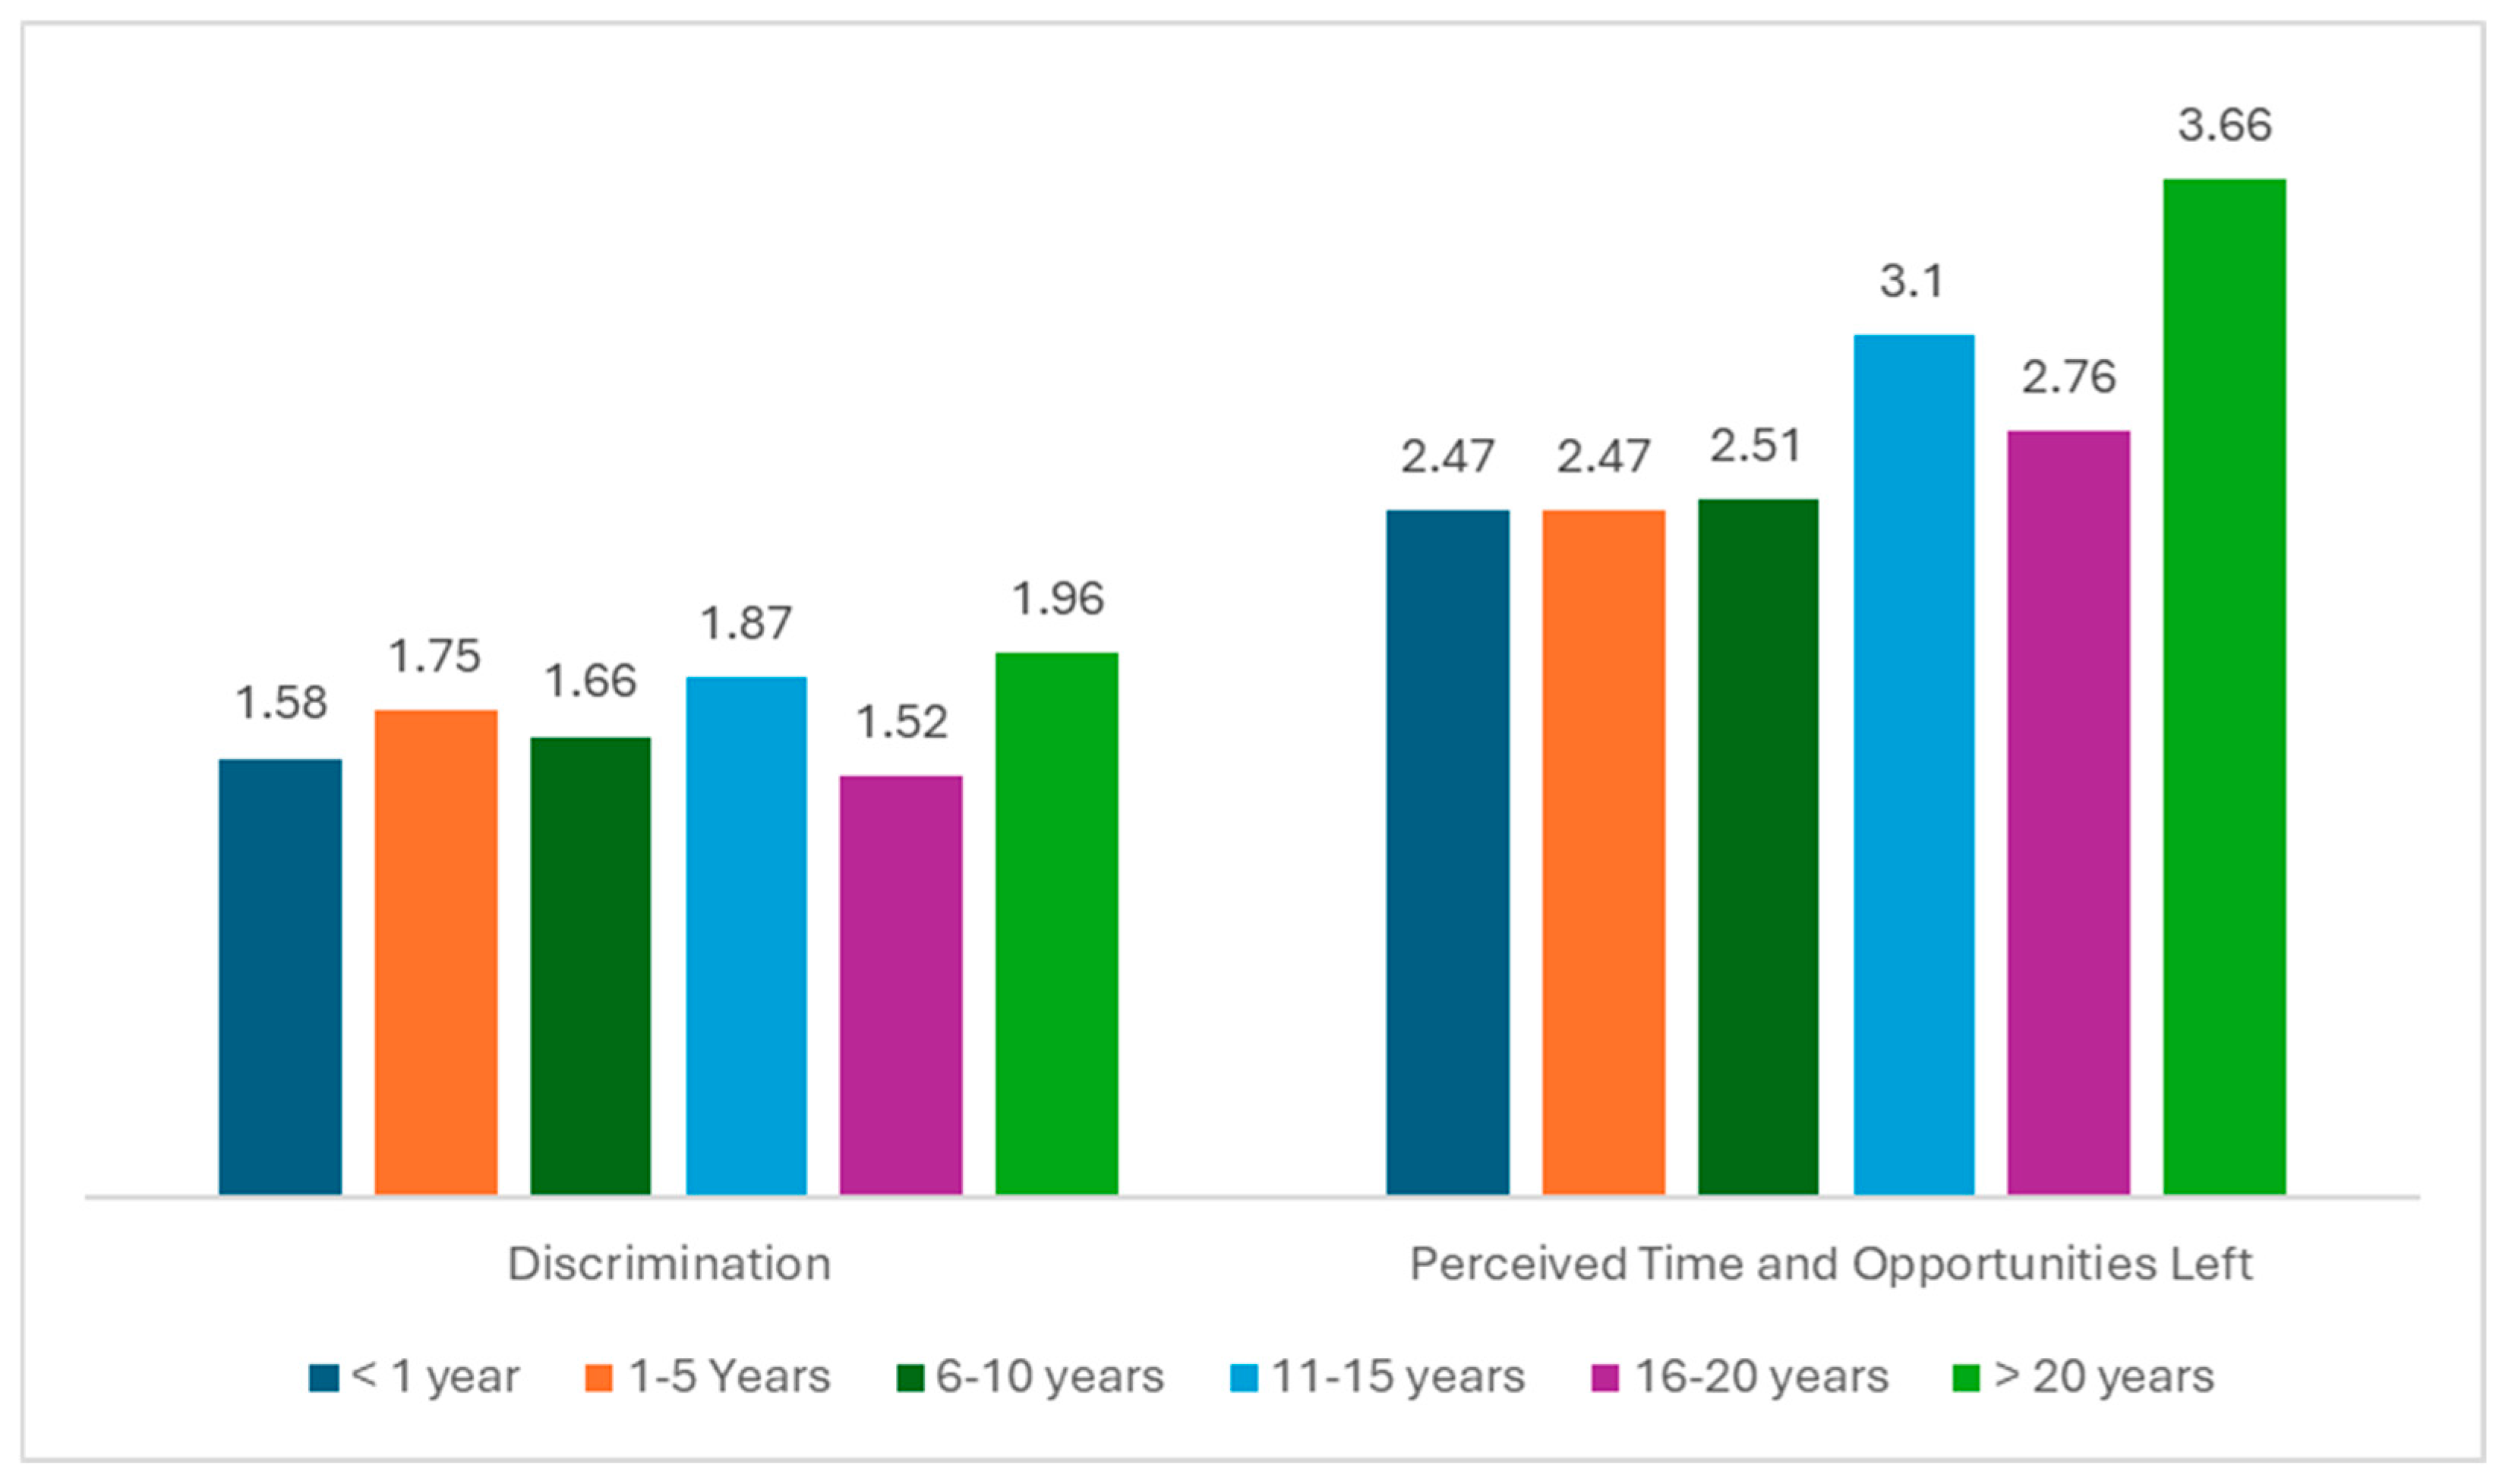
Seniority in the organization has a significant effect on discrimination (F (5, 394) = 2.43; p = 0.035; η2p = 0.03) and on perceived remaining time and opportunities (F (5, 394) = 10.05; p < 0.001; η2p = 0.11). Participants who have been with the organization for more than 20 years perceive higher levels of discrimination, shorter remaining time and fewer opportunities (Figure 3). Participants with 16 to 20 years of seniority perceive lower levels of discrimination (Figure 3). As for perceived remaining time and opportunities, participants who have been with the organization for a shorter time have lower perceptions (Figure 3).
Figure 3.
Effect of seniority on the variables under study.
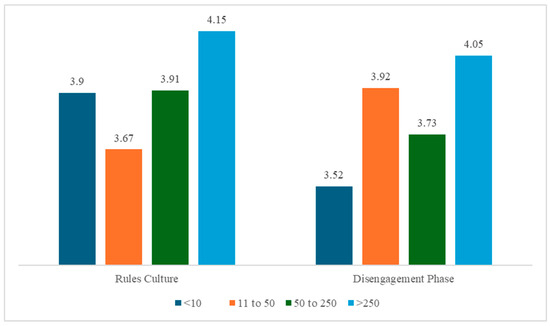
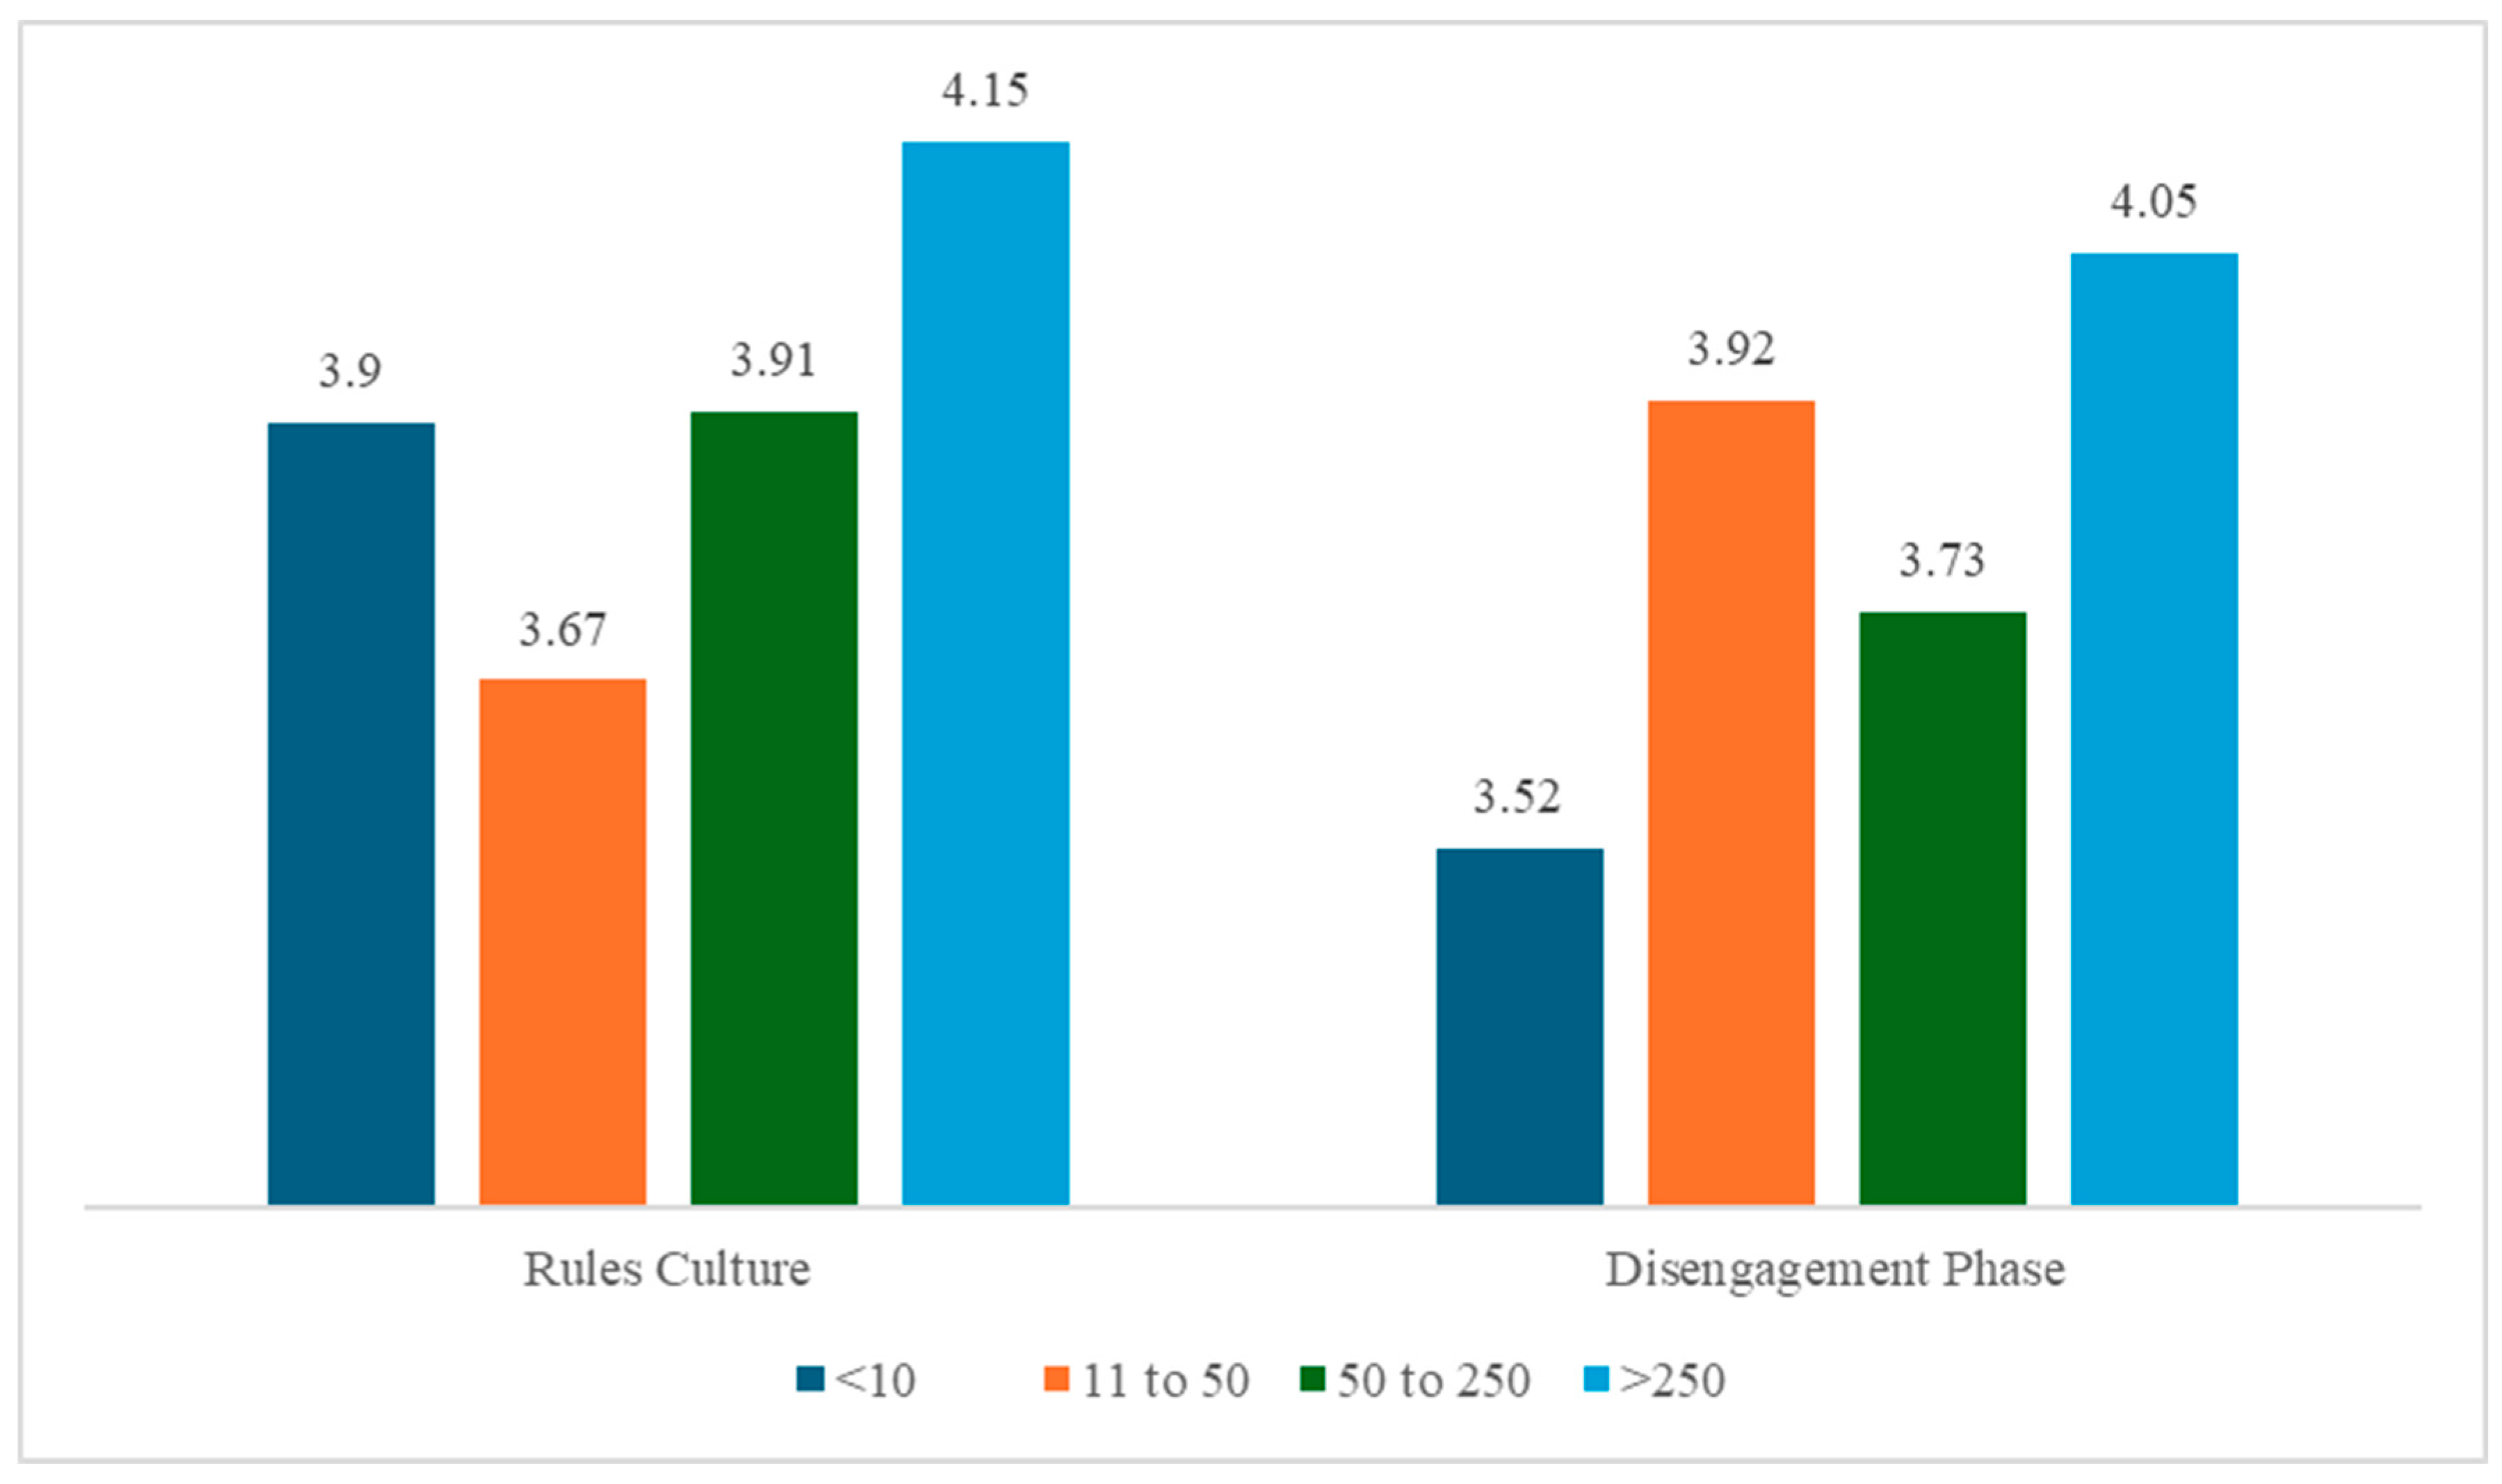
The organization’s dimension has a significant effect on the culture of rules (F (5, 394) = 6.22; p < 0.001; η2p = 0.05) and on the disengagement phase (F (5, 394) = 3.34; p = 0.019; η2p = 0.03). Participants who work in organizations with more than 250 employees have a higher perception of a rule culture and disengagement phase (Figure 4).
Figure 4.
Effect of the organization’s dimension on the variables under study.
4.3. Association Between the Variables Under Study
The association between the variables under study was tested using Pearson correlations. Support culture showed negative and significant associations with discrimination, obsolescence, perceived remaining time and opportunities, and the disengagement phase (Table 2). Innovative culture was negatively and significantly related to obsolescence and perceived remaining time and opportunities (Table 2). A goal-oriented culture similarly showed negative, significant associations with obsolescence, perceived remaining time and opportunities, and the disengagement phases (Table 2). Rule-oriented culture was negatively and significantly associated exclusively with the disengagement phases. Prejudice was positively and significantly associated only with obsolescence, while discrimination was positively and significantly related only to perceived remaining time and opportunities (Table 2).
Table 2.
Association between the variables under study.
4.4. Tests of Hypotheses
The hypotheses formulated in this study were tested using multiple linear regressions.
Regarding hypothesis 1, the model with prejudice as the dependent variable was not statistically significant. In the model with discrimination as the dependent variable, only the supportive culture had a positive and significant effect on discrimination (β = −0.13; p = 0.045) (Table 3). The model explains only 2% of the variability in discrimination (Table 3). The model is statistically significant (F (4, 395) = 2.61; p = 0.050) (Table 3). The results partially support this hypothesis. Given the low coefficients of determination, the results of this hypothesis should be interpreted with caution.
Table 3.
The effect of organizational culture on ageism.
As for the second hypothesis, only obsolescence has a positive and significant effect on prejudice (β = 0.13; p = 0.011). The model explains 3% of the variability in prejudice and is statistically significant (F (4, 395) = 2.63; p = 0.034) (Table 4).
Table 4.
The effect of organizational age on ageism.
In turn, only Perceived Time and Opportunities Left have a positive and significant effect on discrimination (β = 0.22; p < 0.001). The model explains 6% of the variability in discrimination and is statistically significant (F (4, 395) = 6.13; p < 0.001) (Table 4). The results partially support this hypothesis. However, these results should be interpreted with some caution, as the determination coefficients are very low.
To test the third hypothesis, it was necessary to center independent and moderating variables to create interaction variables, thereby avoiding multicollinearity problems (Aiken & West, 1991). Next, two multiple linear regressions were performed in two steps. In the first step, the predictor and moderator variables were entered as independent variables; in the second step, the interaction variables were entered.
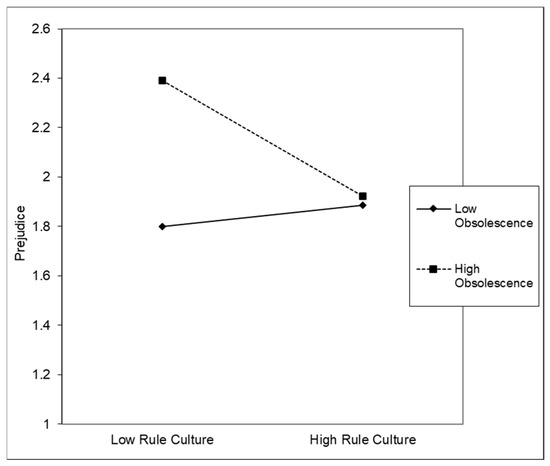
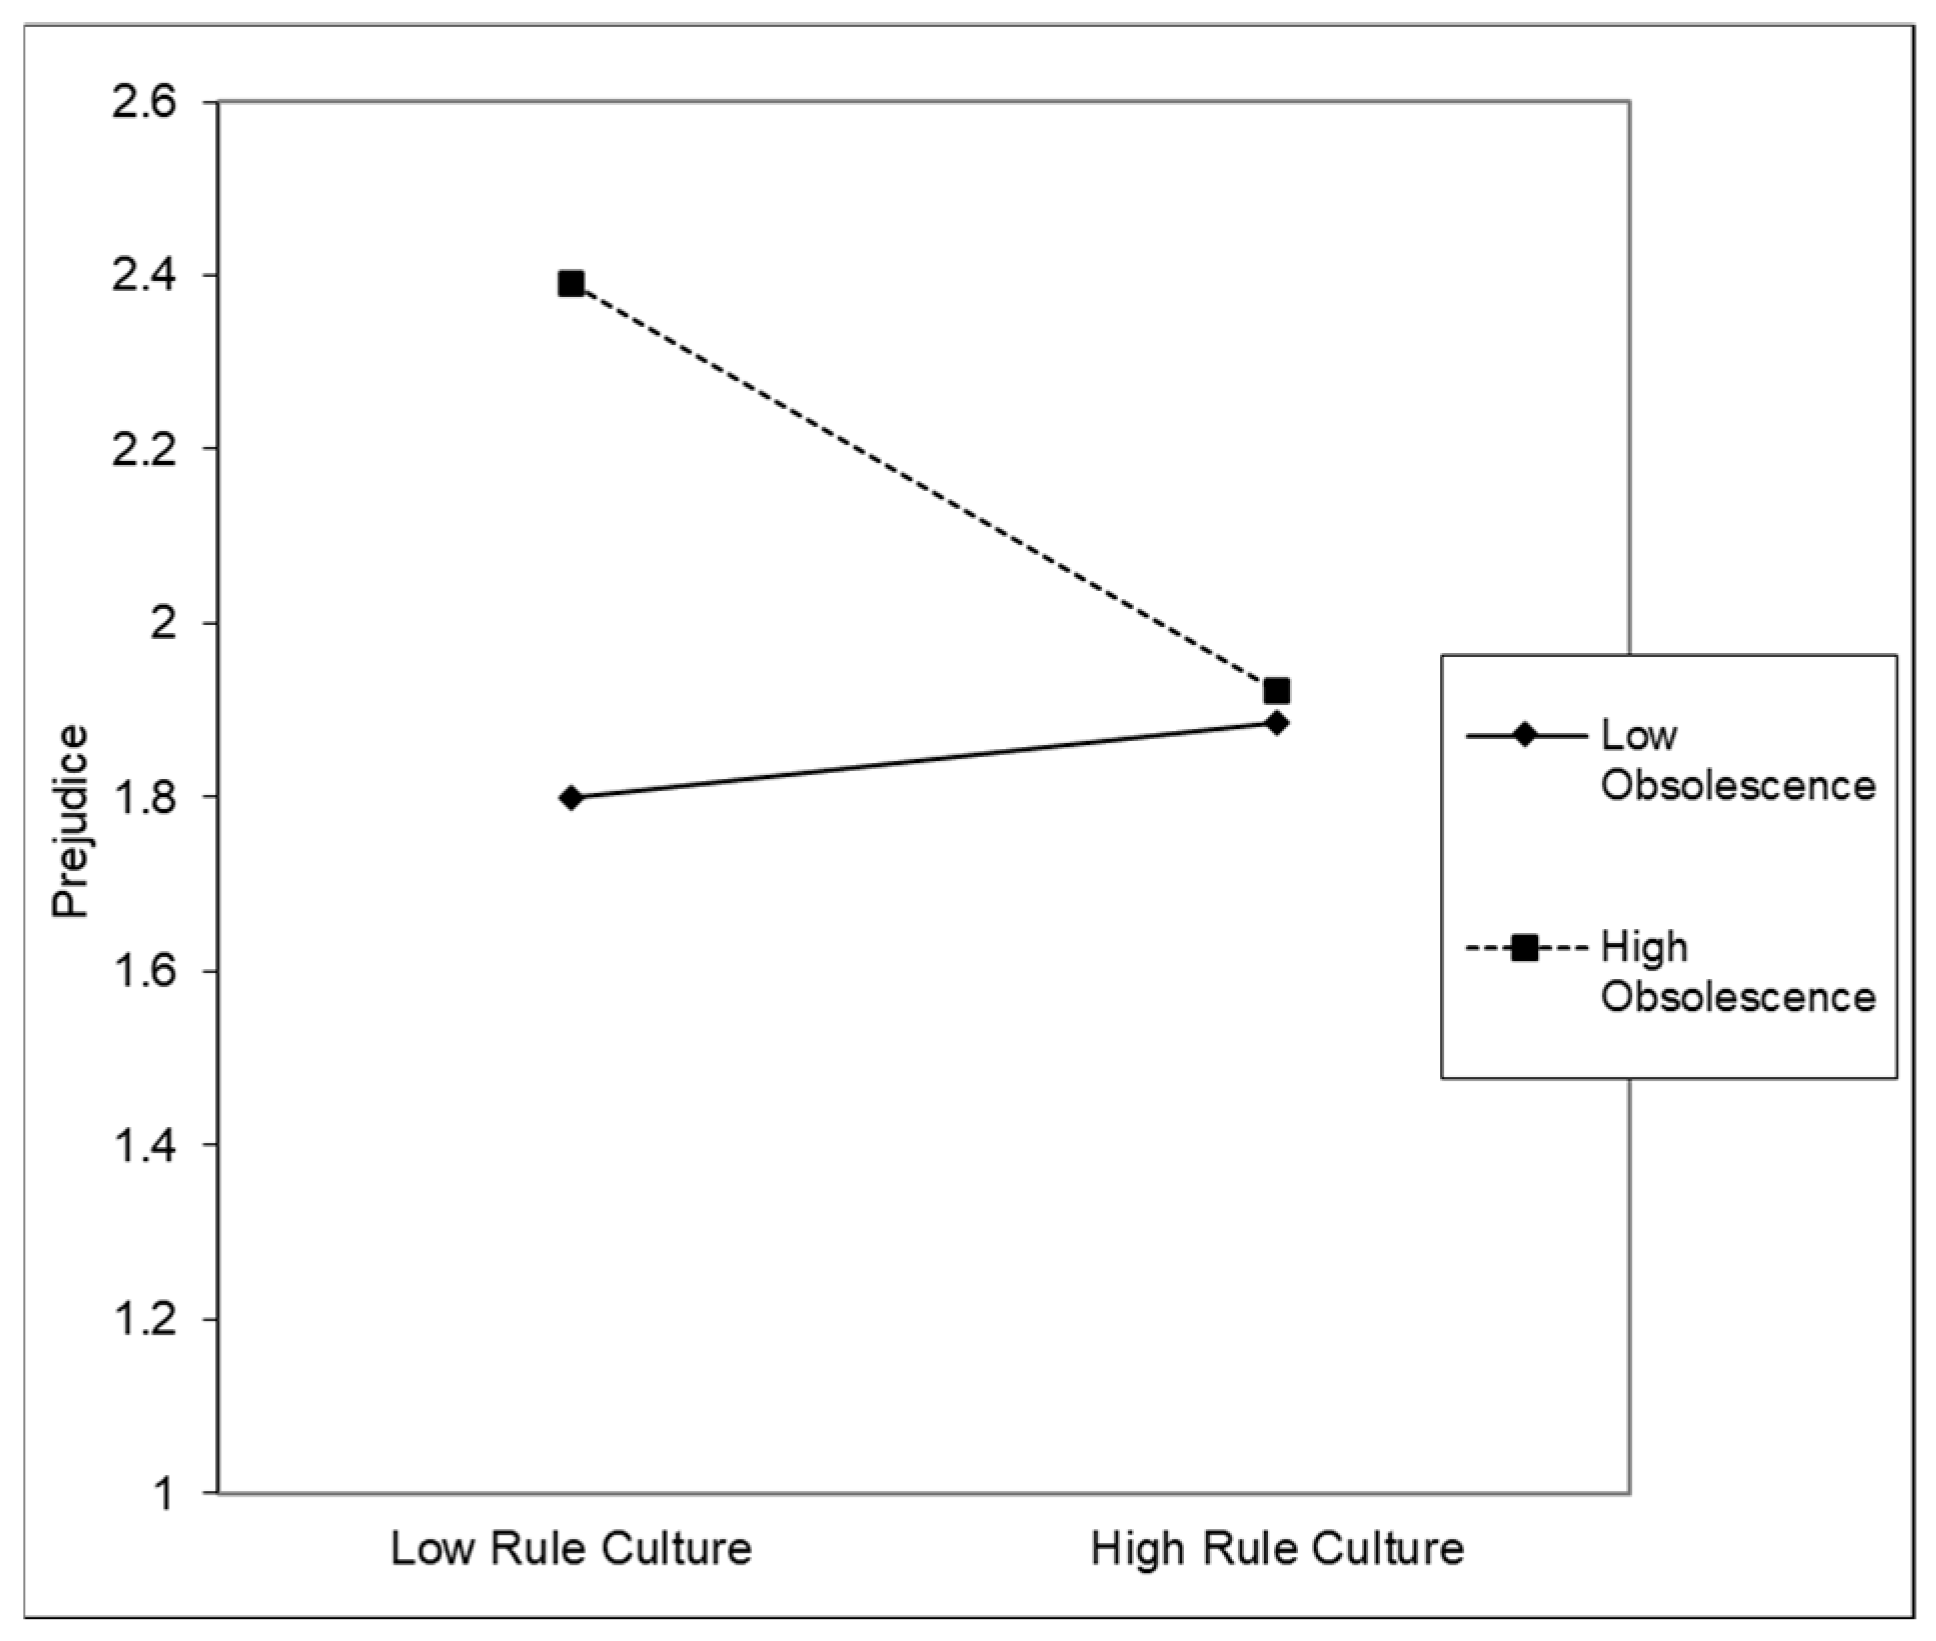
The results indicate that only the obsolescence variable moderates the relationship between rule culture and prejudice (Table 5). The results partially support this hypothesis. However, these results should be interpreted with some caution, as the coefficients of determination are very low.
Table 5.
Results of the moderate effect.
For participants with high levels of obsolescence, compared with those with low levels, the culture of rules is relevant for reducing prejudice (Figure 5).
Figure 5.
Interaction graphic “culture of rules vs. obsolescence”.
5. Discussion
This study aimed to investigate how organizational culture (supportive, innovative, rule, and goal culture) affects ageism (prejudice and discrimination). It also examined whether organizational age (obsolescence, age norms, PTOL, and disengagement phase) moderates this relationship.
Firstly, only the effect of supportive culture on discrimination was confirmed. These results are consistent with the literature. According to Wu et al. (2025), an inclusive, intergenerational climate, fostered by a supportive culture, can mitigate age prejudice. Supportive culture is internally focused, people-oriented, and characterized by practices that promote team cohesion, employee development, and engagement (Cameron & Quinn, 2006). It can be said that, in organizations, it is important to strengthen support structures or promote cultures of this nature, as they reduce discrimination (Silva et al., 2018) and are more favorable to older employees (Belias & Koustelios, 2014; Eppler-Hattab et al., 2024). These findings are also consistent with those reported by Eppler-Hattab et al. (2024), who found that a supportive culture has the strongest positive association with all dimensions of age acceptance.
Secondly, Hypothesis 2 was partially verified. Obsolescence has a positive and significant effect on prejudice, and Perceived Time and Opportunities Left has a positive and significant effect on discrimination. These results are consistent with literature. Employees with higher levels of obsolescence are those with greater organizational seniority and therefore experience greater prejudice (Doucet et al., 2023). The less time and fewer development opportunities an employee identifies in the organization, the greater their IO, which leads to lower levels of discrimination (Doucet et al., 2023).
Thirdly, only one moderating effect was observed. Obsolescence moderates the relationship between rule culture and prejudice. For participants with high levels of obsolescence, rule culture is more relevant than for those with low levels in reducing prejudice. Considering that rule culture stands out for the clarity of its hierarchical structure and the standardization of processes (Quinn & Cameron, 1983), it can be better understood by older participants and reduce their levels of discrimination.
Direct, significant associations also stand out, namely between IO and ageism, revealing that the greater the perception of more changes or less knowledge and skills acquired over time and the lower the perception of time and opportunities for development, the greater the prejudice. In this regard, obsolescence, that is, when the individual perceives themselves as older and/or feels obsolete (Doucet et al., 2023) and considering the Stereotyped Content Model, which indicates that groups of individuals are classified, for example, by skills (Cuddy & Fiske, 2002), this can lead to Intergroup Threat Theory, i.e., hostile behavior towards groups that are considered harmful. Still in this line of thought and reflecting on modern times (highlighted by technological advances) that are destined for the “fittest” (Ayalon & Tesch-Römer, 2018), this perception can be intensified.
Negative associations are observed between the support culture and organizational age dimensions, namely obsolescence, PTOL, and the disengagement phase. Thus, it is suggested that the greater the perception of a support culture, the lower the self-perception of the self-ageing process.
Also, the culture of innovation is associated with two negative outcomes: obsolescence and PTOL, suggesting that the greater the perception of a culture of innovation, the less obsolete employees perceive themselves to be, and the lower their perception of time and opportunities. In turn, the goal-oriented culture is positively associated with company size and negatively associated with economic perception, obsolescence, PTOL, and the disengagement phase.
When performing descriptive statistics on the variables under study, it is evident that all dimensions of organizational culture are significantly above the midpoint of the scale. It should be noted that the culture of rules was perceived as the highest, which is natural given Portugal’s culture of high hierarchical distance (Hofstede, 2011). In contrast, the dimension perceived with the lowest average was the culture of innovation. This can also be explained by Portugal’s strong aversion to uncertainty (Hofstede, 2011).
In terms of ageism and organizational age, the values are below the midpoint, suggesting that participants in this study perceive low levels of prejudice and discrimination (ageism) and low self-perception of ageing (organizational age). In this regard, and in line with the study by Patient et al. (2024), Portuguese employees tend not to accept negative beliefs about older employees, which may indicate a trend that helps explain the low perception of ageism observed in this study.
Participants aged 66 and older have a higher perception of a supportive culture. Studies report that organizational culture is an essential factor for the employability of older employees (Pak et al., 2019). This type of culture leads to a greater perception of cordiality across age, fostering collaboration, loyalty, and interpersonal relationships (Cameron & Quinn, 2006). Younger participants perceive higher levels of obsolescence. Regarding perceptions of time and remaining opportunities, participants aged 60–66 have the highest perceptions.
Considering the size of the organization, those who worked for companies with >250 employees had a stronger perception of the culture of rules. In other words, as larger companies, they may have a greater need for foundations to ensure their sustainability. Therefore, they need more norms and rules to guide their direction. It should be noted that employees of larger organizations also perceive a greater degree of disengagement.
Participants who have been with the organization for more years perceive higher levels of discrimination and less time and opportunities remain. Thus, it can be inferred that seniority can also lead to workplace discrimination.
5.1. Theoretical Implications
This study seeks to enrich academic and scientific literature by exploring and deepening the understanding of the variables under study.
There is no current literature on studies that directly relate organizational culture, as defined by Quinn and Cameron (1983) model, to ageism and the moderating effect of organizational age on this relationship. Therefore, this research aims to analyze relationships that have not yet been explored, using recently developed instruments and applying them to the Portuguese work context.
According to McCarthy et al. (2023), given the increase in older employees in the workforce and, consequently, greater generational diversity in organizations, the aim is to identify how organizational culture and self-perception of the ageing process can promote a more inclusive, diverse, and, in turn, more sustainable workplace in the coming years.
This study aims to contribute to a broader understanding of theories (e.g., Social Identity Theory, Stereotype Incorporation Theory, Modernization Theory, and Intergroup Threat Theory) and their relationships with the variables under study.
Finally, this study seeks to contribute to the creation of an empirical basis that will enable the development of more in-depth future research appropriate to the Portuguese labor market, namely, the deconstruction of ageism as a strategy for minimizing prejudice and discrimination, and the identification of environments favorable to age diversity.
5.2. Practical Implications
This study contributes to organizational practices aimed at managing age diversity, developing more inclusive work environments, and enabling healthy, active ageing. Understanding the results obtained, it aims to support organizational practices that value employees and increase opportunities and longevity in the workplace.
Firstly, it seeks to contribute to identifying a more appropriate organizational culture to combat ageism in organizations. Considering the results obtained, promoting a supportive, people-oriented culture that encourages collaboration, involvement, and the development of (older) employees can help minimize discriminatory practices.
Secondly, in general, development opportunities are a relevant factor in combating discrimination and mitigating perceptions of the self-ageing process. As McCarthy et al. (2023) point out, for the future of work, which is increasingly diverse in terms of age, it is essential to develop strategies to sustain organizations in this reality.
Thirdly, it is urgent to respond to employees who identify themselves as obsolete, either because they feel they are not keeping up with changes or because their skills and/or knowledge are outdated. McCarthy et al. (2023) state that technological advances may affect diversity and inclusion. This could be a good starting point for organizations focused on developing their employees, especially regarding new technologies.
5.3. Limitations
In this study, several relevant limitations were identified that warrant highlighting.
One of the most obvious limitations is that some of the constructs under study, particularly organizational age, are still relatively recent topics in the literature and have received little research attention (Doucet et al., 2023), which hinders research and the comparability of the results. There are also limitations in identifying studies that relate the organizational culture model proposed by Quinn and Cameron (1983) to ageism.
The sampling process prevents generalizing the results because it yields a non-probabilistic sample, using a snowball convenience sample.
The cross-sectional nature of the study prevents longitudinal observation, and the correlational design prevents causal inference about the associations under study. Therefore, we suggest adopting longitudinal or experimental studies to determine whether the results remain the same or change over time, and to understand the variables and their cause-and-effect relationships.
Another limitation of this study is that the factor structures of two of the instruments used (the ageism scale and the organizational age scale) had to be modified due to high factor correlations.
Finally, we may consider the low coefficient of determination in the tests conducted to test the formulated hypotheses as a limitation. These low coefficients of determination lead us to interpret the results obtained with some caution.
6. Conclusions
The ageing of the population, a phenomenon of the 21st century (Kai et al., 2020), is a demographic change in the workforce driven by longer working lives (Bae & Choi, 2022). Considering that we will increasingly have older employees in the labor market and that, according to Cebola et al. (2021), ageism has been reflected in the work context, this study analyzed the impact of the dimensions of the CO variable on ageism (prejudice and discrimination), with organizational age as a moderator, considering, above all, the Portuguese labor market.
The main contributions of the study are that (1) supportive cultures can help combat discrimination and reduce the perception of the self-aging process, (2) development opportunities, to update knowledge and skills, identified in the organization by the employee are fundamental to a lower perception of ageism, particularly in its dimension of prejudice, (3) a greater perception of time and development opportunities perceived by employees is relevant to combating discrimination, and (4) a culture of rules is favorable to a lower self-perception of the aging process when prejudice is mitigated. It can therefore be concluded that organizations in Portugal should foster a culture of solidarity and a people-centered approach, encouraging collaboration among employees of different age groups to minimize age discrimination. Such a culture could encourage the development of strategies to update the skills of older employees, so that they do not feel obsolete or discriminated against. One factor that has led older employees to feel obsolete and discriminated against is rapid technological development. In this regard, a culture that encourages collaboration can help to overcome this situation.
In conclusion, since professional life does not necessarily follow the normal ageing process (Ilmarinen, 2012), we can all feel like younger or older employees, regardless of our chronological age.
Author Contributions
Conceptualization, V.A. and A.A.; methodology, A.P.-M.; software, A.P.-M.; validation, V.A., A.A., A.P.-M., I.D. and A.B.; formal analysis, A.P.-M.; investigation, V.A., A.A., A.P.-M., I.D. and A.B.; resources, V.A. and A.A.; data curation, A.P.-M.; writing—original draft preparation, V.A., A.A., A.P.-M., I.D. and A.B.; writing—review and editing, V.A. and A.A.; visualization, V.A. and A.A.; supervision, V.A. and A.A.; project administration, V.A. and A.A.; funding acquisition, A.P.-M. All authors have read and agreed to the published version of the manuscript.
Funding
This research received no external funding.
Institutional Review Board Statement
Ethical review and approval were waived for the research project has been reviewed and favorably approved by the European University Ethics Committee for Research. The study employs pseudonymized personal data, which effectively minimizes the risk of data subject exposure and enhances data security in line with the EU General Data Protection Regulation (Regulation (EU) 2016/679). Written informed consent was obtained from all participants prior to data collection, and the principal investigator has formally committed to full compliance with relevant ethical guidelines, international standards, and applicable legislation. The collected data will be used exclusively for scientific research purposes with strict participant confidentiality and data protection guaranteed. Given the minimal risk nature of the study, the implementation of robust data pseudonymization, and full adherence to ethical and legal requirements, a waiver of full Institutional Review Board protocol review is justified to streamline the research process while upholding research integrity and ethical standards.
Informed Consent Statement
Informed consent was obtained from all subjects involved in the study.
Data Availability Statement
The data presented in this study are available upon request from the corresponding author. The data are not publicly available because the participants’ responses are confidential.
Conflicts of Interest
The authors declare no conflicts of interest.
References
- Abu-Jarad, I. Y., Yusof, N. A., & Nikbin, D. (2010). A review paper on organizational culture and organizational performance. International Journal of Business and Social Science, 1(3), 26–46. [Google Scholar]
- Aiken, L. S., & West, S. G. (1991). Multiple regression: Testing and interpreting interactions. Sage Publications, Inc. [Google Scholar]
- Aldhafeeri, N. A. (2024). Organizational culture: A concept analysis. Nursing Science Quarterly, 37(4), 365–372. [Google Scholar] [CrossRef] [Scilit]
- Appannah, A., & Biggs, S. (2015). Age-friendly organisations: The role of organisational culture and the participation of older workers. Journal of Social Work Practice, 29(1), 37–51. [Google Scholar] [CrossRef] [Scilit]
- Ayalon, L. (2025). Toward an intragroup approach to alleviate ageism in the second half of life. Gerontologist, 65(10), gnaf169. [Google Scholar] [CrossRef] [Scilit] [PubMed]
- Ayalon, L., & Tesch-Römer, C. (2018). Introduction to the section: Ageism—Concept and origins. In L. Ayalon, & C. Tesch-Römer (Eds.), Contemporary perspectives on ageism. International perspectives on aging (Vol. 19). Springer. [Google Scholar] [CrossRef] [Scilit]
- Bae, S., & Choi, M. (2022). Age and workplace ageism: A systematic review and meta-analysis. Journal of Gerontological Social Work, 66(6), 724–738. [Google Scholar] [CrossRef] [Scilit] [PubMed]
- Belias, D., & Koustelios, A. (2014). The influence of demographic characteristics of Greek bank employees on their perceptions of organizational culture. International Journal of Human Resource Studies, 4(1), 81. [Google Scholar] [CrossRef] [Scilit]
- Bryman, A., & Cramer, D. (2003). Quantitative data analysis with minitab: A guide for social scientists. Routledge. [Google Scholar]
- Butler, R. (1969). Age-Ism: Another form of bigotry. Gerontologist, 9, 243–246. [Google Scholar] [CrossRef] [Scilit]
- Cameron, K. S., & Quinn, R. E. (2006). Diagnosing and changing organizational culture: Based on the competing values framework (3rd ed.). Jossey-Bass. [Google Scholar]
- Cebola, M. M. J., Santos, N. R. D., & Dionísio, A. (2021). Worker-related ageism: A systematic review of empirical research. Ageing and Society, 43(8), 1882–1914. [Google Scholar] [CrossRef] [Scilit]
- Chen, M. K. L., & Gardiner, E. (2019). Supporting older workers to work: A systematic review. Personnel Review, 48(5), 1318–1335. [Google Scholar] [CrossRef] [Scilit]
- Cuddy, A. J., & Fiske, S. T. (2002). Doddering but dear: Process, content, and function in stereotyping of older persons. In T. Nelson (Ed.), Ageism: Stereotyping and prejudice against older persons (pp. 3–26). The MIT Press. [Google Scholar]
- De Lange, A. H., Van der Heijden, B., Van Vuuren, T., Furunes, T., De Lange, C., & Dikkers, J. (2021). Employable as we age? A systematic review of relationships between age conceptualizations and employability. Frontiers in Psychology, 11, 605684. [Google Scholar] [CrossRef] [Scilit]
- Doucet, A., Meunier, S., & Lagacé, M. (2023). Organizational age scale: New lenses to assess the ageing of workers. Canadian Journal of Career Development, 22(2), 6–29. [Google Scholar] [CrossRef] [Scilit]
- Dunger, S. (2025). It’s the hierarchy, stupid: Varying perceptions of organizational culture between demographic groups. International Studies of Management & Organization, 55(1), 83–111. [Google Scholar]
- Eppler-Hattab, R., Doron, I., & Meshoulam, I. (2024). The role of organizational ageism, inter age contact, and organizational values in the formation of workplace age-friendliness: A multilevel cross-organizational study. Journal of Population Ageing, 17(3), 449–473. [Google Scholar] [CrossRef] [Scilit]
- Eppler-Hattab, R., Meshoulam, I., & Doron, I. (2020). Conceptualizing age-friendliness in workplaces: Proposing a new multidimensional model. The Gerontologist, 60(1), 12–21. [Google Scholar] [CrossRef] [Scilit]
- Faure, A., & Ndobo, A. (2015). On gender-based and age-based discrimination: When the social ingraining and acceptability of non-discriminatory norms matter. Revue Internationale de Psychologie Sociale, 28(4), 7–43. [Google Scholar]
- Finney, S. J., & DiStefano, C. (2013). Nonnormal and categorical data in structural equation modeling. In G. R. Hancock, & R. O. Mueller (Eds.), Structural equation modeling: A second course (2nd ed., pp. 439–492). IAP Information Age Publishing. [Google Scholar]
- Fornell, C., & Larcker, D. F. (1981). Evaluating structural equation models with unobservable variables and measurement error. Journal of Marketing Research, 18, 39–50. [Google Scholar] [CrossRef] [Scilit]
- Gonyea, J. G. (Ed.). (2013). The older worker and the changing labor market: New challenges for the workplace. Routledge. [Google Scholar]
- Hair, J. F., Black, W. C., Babin, B. J., & Anderson, R. E. (2010). Multivariate data analysis (7th ed.). Pearson. [Google Scholar]
- Hair, J. F., Hult, G. T. M., Ringle, C. M., & Sarstedt, M. (2017). A primer on partial least squares structural equation modeling (PLS-SEM) (2nd ed.). Sage Publications Inc. [Google Scholar]
- Hofmeister-Tóth, Á., Neulinger, Á., & Debreceni, J. (2021). Measuring discrimination against older people applying the Fraboni scale of ageism. Information, 12, 458. [Google Scholar] [CrossRef] [Scilit]
- Hofstede, G. (1984). Culture’s consequences: International differences in work-related values (Vol. 5). Sage. [Google Scholar]
- Hofstede, G. (2011). Dimensionalizing cultures: The Hofstede model in context. Online Readings in Psychology and Culture, 2, 8–16. [Google Scholar] [CrossRef] [Scilit]
- Hofstede, G., Hofstede, G. J., & Minkov, M. (2010). Cultures and organizations: Software of the mind: Intercultural cooperation and its importance for survival (3rd ed., p. 561). McGraw-Hill. [Google Scholar]
- Hu, L.-T., & Bentler, P. M. (1999). Cutoff criteria for fit indexes in covariance structure analysis: Conventional criteria versus new alternatives. Structural Equation Modeling, 6, 1–55. [Google Scholar] [CrossRef] [Scilit]
- Ilmarinen, J. E. (2001). Aging workers. Occupational and Environmental Medicine, 58(8), 546. [Google Scholar] [CrossRef] [Scilit]
- Ilmarinen, J. E. (2012). Promoting active ageing in the workplace. European Agency for Safety and Health at Work. Available online: https://osha.europa.eu/en/publications/promoting-active-ageing-workplace (accessed on 7 March 2025).
- Instituto Nacional de Estatística. (2020). Projeções de população residente: 2018–2080. EU. Available online: https://www.ine.pt/xportal/xmain?xpid=INE&xpgid=ine_destaques&DESTAQUESdest_boui=406534255&DESTAQUESmodo=2 (accessed on 10 March 2025).
- Iversen, T. N., Larsen, L., & Solem, P. E. (2009). A conceptual analysis of Ageism. Nordic Psychology, 61(3), 4–22. [Google Scholar] [CrossRef] [Scilit]
- Jöreskog, K. G., & Sörbom, D. (1993). LISREL8: Structural equation modelling with the SIMPLIS command language. Scientific Software International. [Google Scholar]
- Kai, F. O., Lourenço, M. L., & Fernandes, C. (2020). The organizational culture in the aging process of educational work. Administração: Ensino e Pesquisa, 21(3), 385–424. [Google Scholar] [CrossRef] [Scilit]
- Kooij, D., De Lange, A. H., Jansen, P., & Dikkers, J. (2008). Older workers’ motivation to continue to work: Five meanings of age. A conceptual review. Journal of Managerial Psychology, 23(4), 364–394. [Google Scholar] [CrossRef] [Scilit]
- Kyriazos, T. A. (2018). Applied psychometrics: Sample size and sample power considerations in factor analysis (EFA, CFA) and SEM in general. Psychology, 9(1), 2207–2230. [Google Scholar] [CrossRef]
- Lawrence, B. S. (1998). New wrinkles in the theory of age: Demography, norms, and performance ratings. Academy of Management Journal, 31(2), 309–337. [Google Scholar] [CrossRef] [Scilit]
- Levy, B. (2009). Stereotype embodiment: A psychosocial approach to aging. Current Directions in Psychological Science, 18(6), 32–336. [Google Scholar] [CrossRef] [Scilit]
- Levy, B. R., & Banaji, M. R. (2002). Implicit ageism. In T. D. Nelson (Ed.), Ageism: Stereotyping and prejudice against older persons (pp. 49–75). MIT Press. [Google Scholar]
- MacCallum, R., Browne, M., & Sugawara, H. (1996). Power analysis and determination of sample size for covariance structural modelling. Psychological Methods, 1, 130–149. [Google Scholar] [CrossRef]
- Marques, S., Mariano, J., Mendonça, J., De Tavernier, W., Hess, M., Naegele, L., & Martins, D. (2020). Determinants of ageism against older adults: A systematic review. International Journal of Environmental Research and Public Health, 17(7), 2560. [Google Scholar] [CrossRef] [Scilit]
- McCarthy, J., Bosak, J., Cleveland, J. N., & Parry, E. (2023). Diversity and inclusion. In The future of work: Challenges and prospects for organisations, jobs and workers (pp. 97–109). Springer International Publishing. [Google Scholar]
- McCarthy, J., Heraty, N., Cross, C., & Cleveland, J. N. (2014a). Whx is considered an ‘older worker’? Extending our conceptualisation of ‘older’ from an organisational decision maker perspective. Human Resource Management Journal, 24(4), 374–393. [Google Scholar] [CrossRef] [Scilit]
- McCarthy, J., Rowley, J., Ashworth, C. J., & Pioch, E. (2014b). Managing brand presence through social media: The case of UK football clubs. Internet Research, 24, 181–204. [Google Scholar] [CrossRef] [Scilit]
- Navaneetham, K., & Arunachalam, D. (2025). Global population aging, 1950–2050. In S. I. Rajan (Ed.), Handbook of aging, health and public policy. Springer. [Google Scholar] [CrossRef] [Scilit]
- Neto, J., & Neto, F. (2024). Measuring ageism: Psychometric analysis of the Portuguese short form of the Fraboni scale (FSA-SF). Measurement Instruments for the Social Sciences, 6, 1–19. [Google Scholar] [CrossRef] [Scilit]
- Neves, J. G. (2000). Clima organizacional, cultura organizacional e gestão de recursos humanos. RH Editora. ISBN 972–6897-3-3. [Google Scholar]
- OCDE. (2019). Trabalhando melhor com a idade. Envelhecimento e Políticas de Emprego, Publicação da OCDE. [Google Scholar] [CrossRef] [Scilit]
- Organização Mundial da Saúde, Alto Comissariado de Direitos Humanos, Departamento de Assuntos Econômicos e Sociais das Nações Unidas & Fundo de População das Nações Unidas. (2021). Relatório mundial sobre o idadismo. In Campanha mundial de combate ao idadismo. Available online: https://www.who.int/pt/publications/i/item/9789240020504 (accessed on 15 March 2025).
- Pak, K., Kooij, D. T., De Lange, A. H., & Van Veldhoven, M. J. (2019). Human resource management and the ability, motivation and opportunity to continue working: A review of quantitative studies. Human Resource Management Review, 29(3), 336–352. [Google Scholar] [CrossRef] [Scilit]
- Patient, D., Esteves, C. S., Vauclair, C.-M., Rosa, M., & Schmitz, S. (2024). Understanding ageism in the workplace. Fundação Francisco Manuel dos Santos. Available online: https://ffms.pt/en/research/studies/understanding-ageism-workplace (accessed on 25 February 2025).
- Quinn, R. E., & Cameron, K. (1983). Organizational life cycles and shifting criteria of effectiveness: Some preliminary evidence. Management Science, 29(1), 33–51. [Google Scholar] [CrossRef] [Scilit]
- Quinn, R. E., & Rohrbaugh, J. (1983). A spatial model of effectiveness criteria: Toward a competing values approach to organizational analysis. Management Science, 29, 363–377. [Google Scholar] [CrossRef] [Scilit]
- Renzetti, F. M. M. N. (2022). Organizações age-friendly e experiência de inclusão de trabalhadores mais velhos. Available online: https://dspace.mackenzie.br/items/792d43ad-5eef-44d0-82ce-c59b7cf14bae (accessed on 14 February 2025).
- Rothbart, M., & John, O. P. (1993). Intergroup relations and stereotype change: A social-cognitive analysis and some longitudinal findings. In P. M. Sniderman, P. E. Tetlock, & E. G. Carmines (Eds.), Prejudice, politics, and the American dilemma (pp. 32–59). Stanford University Press. [Google Scholar]
- Savino, D. M. (2019). Managing workforce diversity in a new age: The challenges and implications of ageism. Journal of the North American Management Society, 12(2), 1. [Google Scholar]
- Schein, E. H. (2010). Organizational culture and leadership (4th ed., Vol. 2). John Wiley & Sons. [Google Scholar]
- Schneider, S. C., & Barsoux, J.-L. (2003). Managing across cultures (2nd ed.). Prentice Hall Financial Times. [Google Scholar]
- Silva, L. P. D., Castro, M. A. R., & Dos-Santos, M. G. (2018). Influência da cultura organizacional mediada pelo assédio moral na satisfação no trabalho. Revista de Administração Contemporânea, 22, 249–270. [Google Scholar] [CrossRef] [Scilit]
- Smircich, L. (1983). Concepts of culture and organizational analysis. Administrative Science Quarterly, 28(3), 339–358. [Google Scholar] [CrossRef] [Scilit]
- Stephan, W. G., Ybarra, O., & Morrison, K. R. (2009). Intergroup threat theory. In T. D. Nelson (Ed.), Handbook of prejudice, stereotyping, and discrimination (pp. 43–59). Psychology Press. [Google Scholar]
- Sterns, H. L., & Doverspike, D. (1989). Aging and the process of training and learning. In I. L. Goldstein (Ed.), Training and development in organizations (pp. 299–332). Jossey-Bass. [Google Scholar]
- Suberry, A., & Bodner, E. (2024). Psychological well-being and self-aging attitudes moderate the association between subjective age and age discrimination in the workplace. Behavior Science, 14, 742. [Google Scholar] [CrossRef] [Scilit]
- Swift, J. K., Trusty, W. T., & Penix, E. A. (2021). The effectiveness of the collaborative assessment and management of suicidality (CAMS) compared to alternative treatment conditions: A meta-analysis. Suicide & Life-Threatening Behavior, 51(5), 882–896. [Google Scholar] [CrossRef] [Scilit]
- Tadesse Bogale, A., & Debela, K. L. (2024). Organizational culture: A systematic review. Cogent Business & Management, 11, 2340129. [Google Scholar] [CrossRef] [Scilit]
- Tajfel, H., & Turner, J. C. (1979). An integrative theory of intergroup conflict. In W. G. Austin, & S. Worchel (Eds.), The social psychology of intergroup relations (pp. 33–37). Brooks/Cole. [Google Scholar]
- Tan, B. (2019). In search of the link between organizational culture and performance: A review from the conclusion validity perspective. Leadership & Organization Development Journal, 40(3), 356–368. [Google Scholar] [CrossRef] [Scilit]
- Trochim, W. (2000). The research methods knowledge base (2nd ed). Atomic Dog Publishing. [Google Scholar]
- Truxillo, D. M., Cadiz, D. M., & Hammer, L. B. (2015). Supporting the aging workforce: A review and recommendations for workplace intervention research. Annual Review of Organizational Psychology and Organizational Behavior, 2(1), 351–381. [Google Scholar] [CrossRef] [Scilit]
- Vilelas, J. (2025). Investigação: O processo de construção do conhecimento (4th ed.). Edições Sílabo. [Google Scholar]
- Wu, J., Elliott O’Dare, C., & Greene, J. (2025). Ageism and intergenerational dynamics in the workplace: A scoping review with implications for gender and sustainable human resource management (HRM). Gender and Sustainability in the Global South, 2(1), 281–308. [Google Scholar] [CrossRef] [Scilit]

Disclaimer/Publisher’s Note: The statements, opinions and data contained in all publications are solely those of the individual author(s) and contributor(s) and not of MDPI and/or the editor(s). MDPI and/or the editor(s) disclaim responsibility for any injury to people or property resulting from any ideas, methods, instructions or products referred to in the content. |
© 2026 by the authors. Licensee MDPI, Basel, Switzerland. This article is an open access article distributed under the terms and conditions of the Creative Commons Attribution (CC BY) license.