Article

Brand Image and Net Promoter Score: A Repeated Cross-Sectional Study in the Banking Sector

by
Thorhallur Gudlaugsson
and
Unnar Theodorsson
*
Department of Business Administration, School of Social Sciences, Gimli Sæmundargata, University of Iceland, 102 Reykjavík, Iceland
*
Author to whom correspondence should be addressed.
Adm. Sci. 2025, 15(7), 237; https://doi.org/10.3390/admsci15070237
Submission received: 13 May 2025 / Revised: 13 June 2025 / Accepted: 16 June 2025 / Published: 20 June 2025

Abstract

:
This study explores the link between brand image and Net Promoter Score (NPS) in Iceland’s banking sector using data from three survey waves (2021, 2023, and 2025). While NPS is widely used to track customer loyalty, its relationship with brand image, especially in financial services, remains unclear. Drawing on repeated cross-sectional data (n = 1504), we examine how trust, corporate social responsibility, customer satisfaction, and perceived corruption relate to NPS across three major banks. Results show a consistently strong positive correlation (r > 0.5), with Arion Bank customers showing the highest association (r = 0.68). This suggests that customers with a positive image of the bank are far more likely to recommend it. The findings offer both theoretical and practical value: they reinforce the role of brand image in driving customer advocacy and support a more contextualized use of NPS in brand strategy and customer experience management.

1. Introduction

In an increasingly competitive service landscape, understanding the drivers of customer advocacy has become a strategic priority for firms across industries. Among the most widely used metrics for capturing such advocacy is the Net Promoter Score (NPS), introduced by Reichheld (2003), which asks customers how likely they are to recommend a company or product to others. Despite the widespread adoption of NPS as a performance and loyalty metric in both academic and managerial contexts, significant gaps remain in our understanding of its conceptual underpinnings and empirical relationships, particularly in service industries characterized by high credence attributes such as banking (N. A. Morgan & Rego, 2006; Keiningham et al., 2007; Zolkiewski et al., 2017). NPS has been criticized for its methodological simplicity and for lacking a robust theoretical foundation, especially when used in isolation from other constructs such as trust, satisfaction, and brand perceptions (Kristensen & Eskildsen, 2014; Rassens & Haans, 2017). While NPS offers a simple and widely recognized measure of customer loyalty, it is insufficient on its own as it lacks diagnostic depth and does not explain why customers promote or detract from a brand (Hayes, 1998, 2013).
At the same time, brand image has long been recognized as a key antecedent of consumer decision-making, loyalty, and advocacy (Aaker, 1996; Keller, 1993). Particularly in the banking sector, brand image elements like trust, perceived service quality, and corporate responsibility (CSR) are especially salient due to the intangibility of service and the importance of long-term customer relationships (Bravo et al., 2009; Nguyen & Leblanc, 2001; Iglesias et al., 2011). However, while both NPS and brand image are individually well explored, there remains a lack of integrative research that examines how specific dimensions of brand image influence NPS, especially in longitudinal, industry-specific contexts.
As Zolkiewski et al. (2017) emphasize, there is a growing need for models that move beyond descriptive metric toward explanatory frameworks that integrate perceptual, behavioral, and experiential data. The banking sector presents a particularly compelling case for this exploration. Post-crisis reputational challenges, digital transformation, and the commoditization of financial products have elevated the importance of image-based differentiation and customer trust (Hur et al., 2014; Gounaris et al., 2010). Yet, few studies have tested whether commonly used loyalty metrics like NPS adequately capture the reputational and relational dimensions that define banking customer experience. Despite its popularity and adoption across sectors (including financial services, telecommunications, and retail) NPS continues to face scrutiny in academic literature. Critics have questioned its predictive validity, methodological robustness, and conceptual simplicity (Keiningham et al., 2007; Kristensen & Eskildsen, 2014). Nevertheless, when interpreted in context and combined with other metrics, NPS may still offer valuable insights into customer perceptions and brand health (Baehre et al., 2021; Reichheld et al., 2021). Parallel to the discussion on NPS, brand image has long been recognized as a central factor influencing consumer behavior. Brand image refers to the set of associations and perceptions held by customers regarding a brand (Keller, 1993). It encompasses both functional and symbolic attributes, including trust, satisfaction, and perceived social responsibility—factors especially relevant in service industries like banking, where the products are intangible and differentiation often depends on reputation (Bravo et al., 2009; Nguyen & Leblanc, 2001). Prior research has linked strong brand image to favorable outcomes such as increased loyalty, reduced churn, and higher willingness to pay (Aaker, 1996; Rio et al., 2001).
Although both NPS and brand image have been widely studied independently, their intersection remains under-explored, particularly in the context of financial services. A few studies suggest that brand image attributes (such as trust and perceived service quality) can significantly shape NPS outcomes (de Haan et al., 2015; Bravo et al., 2012). However, most of this work has either focused on limited aspects of image or treated NPS as a standalone metric, without deeper theoretical integration. This gap is especially relevant in the banking industry, where the importance of trust and perceived integrity has only grown in the aftermath of financial crises (Gudlaugsson, 2017). A study by Gudlaugsson (2020) investigated the link between NPS and trust within the banking industry. The findings revealed a strong positive correlation between NPS and the image attribute of trust (r = 0.51; p < 0.001). This relationship was even stronger when analyzing individual banks, with correlation coefficients ranging from 0.60 to 0.75. The study suggests that higher NPS scores are associated with increased customer trust in banks, indicating that NPS can be a valuable proxy for assessing trust related aspects of a bank’s image. Another study compares NPS with the J.D. Power Customer Satisfaction Index (JDP Index) among retail and small business banking customers in the U.S. (Devlin, 2020) The research found a strong positive correlation between NPS and the JDP Index in both segments: r = 0.69 for retail banking customers and r = 0.73 for small business banking customers. These results indicate that NPS aligns closely with comprehensive customer satisfaction measures, reinforcing its relevance as an indicator of customer sentiment in the banking industry. No further relevant research was found on the relationship between NPS and image.
The uniqueness of this research is that image is composed of several elements which have not been done before in this context. This study addresses these gaps mentioned above by examining how multiple dimensions of brand image, including trust, customer satisfaction, CSR, and perception of corruption, relate to NPS in the Icelandic banking sector. By leveraging three waves of large-scale survey data (2021, 2023, and 2025), this research not only extends the temporal scope of existing studies but also applies to a more nuanced and multidimensional view of brand image. In doing so, it contributes to the call for theoretically grounded, context-sensitive analysis of loyalty and advocacy metrics (N. A. Morgan & Rego, 2006; Rassens & Haans, 2017) and provides actionable insights for financial service managers seeking to align brand positioning with customer sentiment. The central research questions are:
(1)
What is the relationship between Net Promoter Score and brand image?
(2)
Does the strength of this relationship vary depending on where customers conduct their banking transactions?
By answering these questions, the study offers theoretical insight and practical value for managers aiming to improve customer experience through brand development. In a competitive marketplace, understanding what drives loyalty and advocacy is crucial for long-term success. While NPS and brand image are widely used, their relationship is still underexplored. This study helps fill that gap and highlights how brand image can shape customer willingness to recommend. The findings offer useful guidance for improving branding strategies, resource allocation, and performance tracking.
The paper is structured as follows: it begins with a theoretical overview that discusses the measurement instrument, its characteristics, applications, and the critiques it has received. Subsequently, the concept of image is examined, including its various definitions and its relationship with organizational performance. The third chapter outlines the research methodology, detailing the preparation and execution of the study, the sample, and the data analysis process. The fourth chapter presents the findings, while the fifth chapter provides a discussion and conclusion in which the results are interpreted within a theoretical framework, leading to relevant conclusions.

2. Literature Review

Understanding the dynamics between customer loyalty metrics and brand perception is pivotal in contemporary marketing research. This chapter examines two critical constructs: the Net Promoter Score (NPS) and brand image. The former serves as a gauge for customer loyalty and potential business growth, while the latter encapsulates consumers’ perceptions and associations with a brand. By exploring existing literature, we aim to elucidate the individual dimensions of these constructs and their interrelationship, providing a foundation for subsequent empirical analysis.

2.1. The Net Promoter Score

The Net Promoter Score (NPS) has become one of the most widely adopted metrics in customer experience and relationship marketing, particularly for its purported simplicity and predictive value. Introduced by Reichheld (2003), NPS is based on a single question that asks customers how likely they are to recommend a company, product, or service to others. Responses are given on an eleven-point scale from 0 (not at all likely) to 10 (extremely likely), with respondents then categorized as promoters (scores of 9–10), passives (7–8), or detractors (0–6). The final NPS is calculated by subtracting the percentage of detractors from the percentage of promoters.
The original appeal of NPS stemmed from its intuitive design and the argument that it served as a strong predictor of business growth. Reichheld (2003) claimed that NPS could explain variances in company performance better than traditional customer satisfaction metrics, especially when applied consistently over time. As a result, many organizations adopted NPS not only as a tool for monitoring customer loyalty but also as a key performance indicator linked to employee bonuses, strategy, and product development (Reichheld et al., 2021). Its widespread implementation across sectors (including banking, telecommunications, retail, and healthcare) has further contributed to its perceived legitimacy and utility in both academic and practitioner circles (Zolkiewski et al., 2017).
Despite its popularity, NPS has not been without criticism. Scholars have pointed to several conceptual and methodological limitations that challenge its validity. Keiningham et al. (2007) were among the first to question the metric’s ability to predict growth, demonstrating that alternative satisfaction and loyalty measures often outperform NPS in explanatory power. Furthermore, the categorization of responses into promoters, passives, and detractors has been criticized for discarding valuable information and oversimplifying consumer sentiment (Kristensen & Eskildsen, 2014). This reductionist approach may obscure the nuances of customer experience, especially in industries with complex service offerings, such as financial services or healthcare. Another point of contention is the assumption that the likelihood to recommend is universally understood and valued across different cultural and demographic contexts. Research indicates that cultural norms affect how likely individuals are to make recommendations, leading to possible systematic biases in NPS results across markets (Baehre et al., 2021). Moreover, the scale itself has been debated. Some researchers argue that treating the 11-point scale as categorical, as in the traditional NPS model, limits its usefulness for advanced statistical analysis. Treating NPS as a continuous variable, instead, can reveal more nuanced insights through correlation or regression analysis (N. A. Morgan & Rego, 2006).
Nonetheless, NPS continues to be widely used, in part due to its ease of implementation and the strategic clarity it provides for managers. Its application as a proxy for customer advocacy, loyalty, and overall satisfaction makes it an attractive option for businesses seeking actionable feedback. The ongoing academic debate highlights the need for organizations to interpret NPS within context, potentially supplementing it with additional qualitative or quantitative measures to gain a more comprehensive understanding of customer perceptions.

2.2. Image

Brand image is a pivotal concept in marketing, referring to the collective perceptions and associations that consumers hold about a brand (Keller, 1993). It encompasses the beliefs, ideas, and impressions that are formed through direct and indirect experiences with a company and its products or services. One of the most influential definitions comes from Keller (1993), who describes brand image as the set of brand associations held in consumer memory. These associations can be shaped by various touchpoints, including advertising, customer service interactions, peer recommendations, and personal experiences.
Brand image is multifaceted, consisting of cognitive, emotional, and symbolic components. On a cognitive level, consumers evaluate functional attributes such as reliability, performance, or convenience. Emotional components relate to how the brand makes the consumer feel, whether it evokes trust, excitement, or security. Symbolic aspects reflect the degree to which a brand aligns with a consumer’s identity or values (Aaker, 1996). Collectively, these components influence not only how consumers perceive the brand but also how they behave toward it, impacting purchase intentions, loyalty, and advocacy. The significance of brand image lies in its effect on consumer decision-making. A positive brand image enhances perceived value, reduces perceived risk, and increases customer satisfaction and loyalty (Nguyen & Leblanc, 2001). Consumers often rely on brand image as a heuristic when making purchasing decisions, especially in low-involvement or complex product categories. For instance, in financial services, where product differentiation is minimal, brand image can serve as a key differentiator and a source of competitive advantage (Bravo et al., 2009). In these cases, attributes such as trustworthiness, corporate social responsibility, and customer care become critical elements of brand perception.
From a strategic perspective, managing brand image is essential for maintaining strong brand equity. Aaker (1991) posits that brand image contributes to brand equity by influencing consumer preferences, purchase behavior, and the willingness to pay a price premium. In this sense, brand image is not only a reflection of current market perceptions but also a driver of future brand performance. Companies invest heavily in shaping brand image through marketing communication, visual identity, customer experience, and public relations, aiming to create consistent and favorable brand associations over time.
Measuring brand image presents methodological challenges due to its abstract and subjective nature. Common approaches include the use of structured surveys employing Likert-type or semantic differential scales to assess perceptions across a range of attributes, such as reliability, friendliness, or modernity (Rio et al., 2001). Factor analysis is often employed to identify underlying dimensions of brand image from observed attributes, thereby simplifying interpretation and enabling comparison across brands. Additionally, qualitative techniques such as brand personality profiling or projective methods can be used to capture deeper, symbolic meanings associated with brands (Zhang, 2015). As markets become increasingly saturated and competitive, brand image plays a central role in differentiating offerings and fostering customer loyalty. It acts as a psychological shortcut in consumer decision-making and serves as a key asset in long-term brand management. The continuous monitoring and strategic development of brand image are therefore vital for sustaining competitive advantage in today’s dynamic marketing environment.
This study is part of a research project that has been ongoing since 2004 and uses the perceptual mapping method for measuring image or position of the brand in the mind of customers (
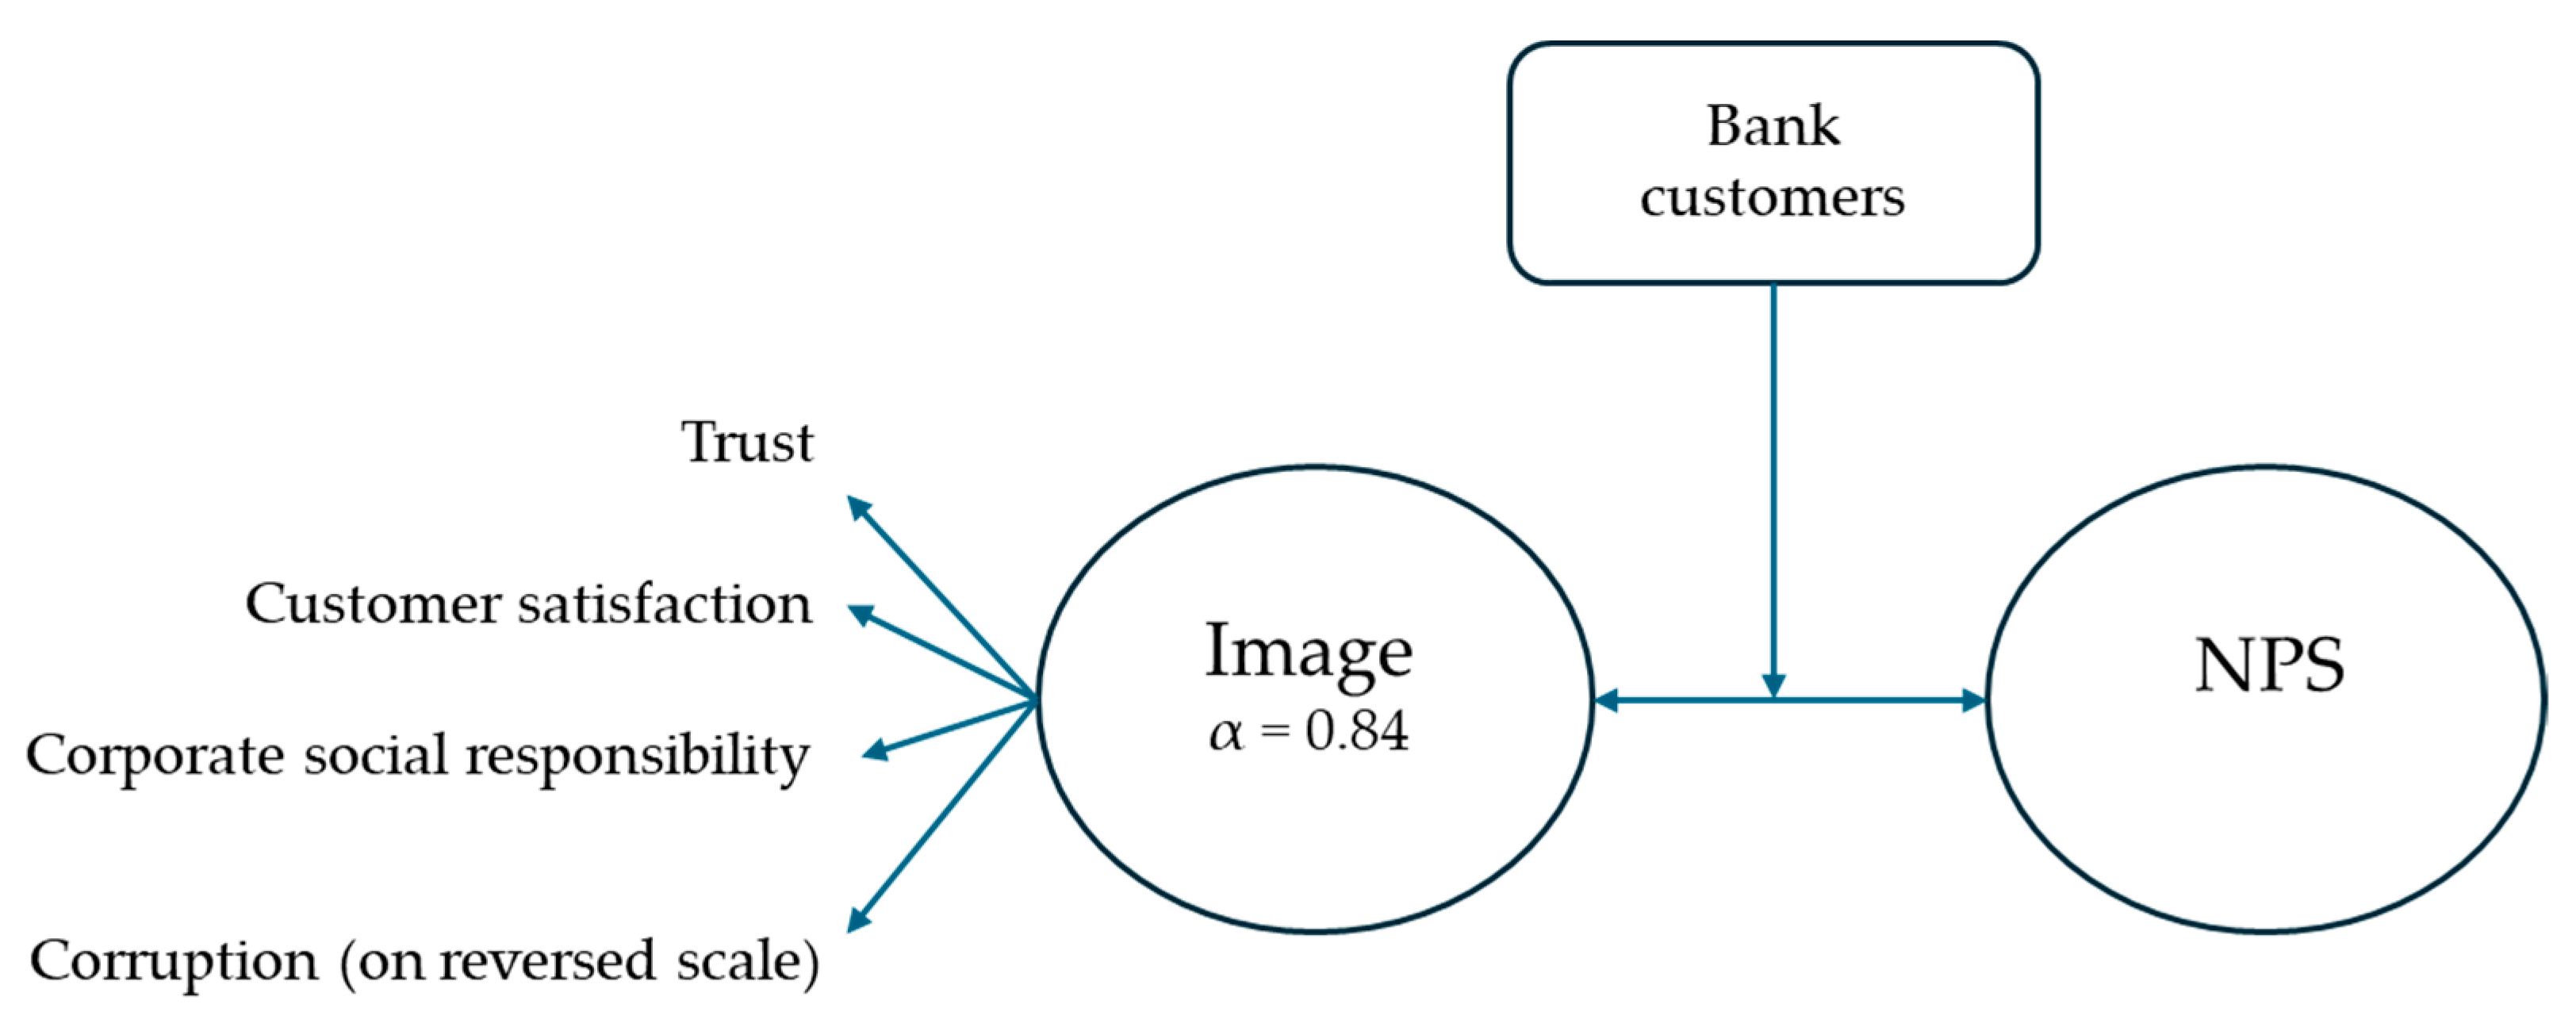
Lilien & Rangasqamy, 2004). Perceptual mapping is a strategic tool widely used in marketing to visually represent consumer perceptions of brands relative to one another across selected attributes which are considered important for the industry. The attributes used here were defined in a detailed preparatory study in 2004 and included, among others, trust, CSR, customer satisfaction, and corruption, which were considered important for the banking sector. These attributes have been assessed regularly since 2004.
Trust is a core determinant of long-term customer relationships and loyalty (Chaudhuri & Holbrook, 2001). In perceptual mapping, trust functions as a critical axis that differentiates brands not merely on performance, but on relational quality. Consumers are more likely to exhibit brand commitment and word-of-mouth advocacy when trust is high, making it a non-negotiable factor in brand evaluation (R. M. Morgan & Hunt, 1994).
Corporate social responsibility has emerged as a significant factor influencing consumer perceptions and brand evaluations, particularly among socially conscious demographics. CSR initiatives, such as environmental stewardship, community engagement, and ethical sourcing, signal a brand’s alignment with broader societal values (Du et al., 2010). Including CSR in perceptual mapping allows firms to position themselves in terms of moral capital, which can drive differentiation and consumer goodwill (Luo & Bhattacharya, 2006). Furthermore, CSR perceptions are known to interact with brand trust and emotional attachment, amplifying their impact on brand loyalty (Pivato et al., 2008).
Customer satisfaction remains a robust predictor of repurchase intention, brand loyalty, and profitability (Anderson et al., 1994). As a perceptual attribute, it captures consumers’ cumulative evaluation of brand performance and experience. Measuring customer satisfaction enables organizations to understand where they stand in delivering value compared to competitors, which is essential for identifying areas requiring operational or experiential improvements (Oliver, 1997). Moreover, satisfaction levels often mediate the relationship between other brand attributes, such as CSR or trust, and behavioral outcomes (Homburg et al., 2006).
Corruption is actually the opposite of trust and when using perceptual mapping it is necessary to have attributes that are opposite (Lilien & Rangasqamy, 2004). While often overlooked in traditional marketing models, perceived corruption or lack of integrity can substantially damage brand equity, especially in industries where trust is paramount (Rodriguez et al., 2006) which is the case in banking. In emerging markets or highly regulated industries, consumers’ perceptions of ethical conduct, including transparency, honesty, and fairness, can be as influential as product quality. Incorporating corruption as a perceptual dimension helps map negative space in brand positioning, highlighting reputational risks and informing crisis communication strategies. Research suggests that even indirect associations with unethical behavior can harm consumer trust and reduce brand legitimacy (Chang, 2011).
Integrating trust, CSR, customer satisfaction, and corruption when measuring image provides a multidimensional view of brand equity that is more aligned with contemporary stakeholder expectations. Such an approach supports more socially attuned and ethically grounded branding strategies. From a research standpoint, it encourages the application of stakeholder theory and signaling theory to perceptual analysis, expanding traditional consumer-centric paradigms (Freeman, 1984; Spence, 1973). As brands navigate complex consumer expectations and an increasingly transparent digital landscape, traditional positioning based solely on price or quality is no longer sufficient. The inclusion of trust, CSR, customer satisfaction, and perceived corruption when measuring image offers a powerful framework for understanding brand equity through a moral and experiential lens. This approach not only enhances strategic clarity but also supports ethical brand management and stakeholder alignment in a socially conscious marketplace. For these reasons, it is very interesting and important to examine the relationship between image, which is composed of the above-mentioned attributes, and NPS.

2.3. The Relationship Between NPS and Image

The relationship between the Net Promoter Score (NPS) and brand image has become increasingly relevant in the context of brand performance measurement and strategic customer management. While NPS is primarily used as a metric for customer loyalty and advocacy (Reichheld, 2003), brand image encompasses the perceptions and associations that shape how consumers evaluate and relate to a brand (Keller, 1993). Understanding the intersection of these constructs is crucial for organizations seeking to foster long-term relationships, enhance reputation, and drive sustainable growth (Baehre et al., 2021). Although both concepts originate from different theoretical backgrounds—NPS from customer experience management and brand image from consumer psychology—their convergence reflects the broader evolution of marketing toward a customer-centric paradigm. Several scholars have investigated the empirical and conceptual ties between brand image and NPS, identifying multiple pathways through which they may influence one another (Baehre et al., 2021; de Haan et al., 2015; Keiningham et al., 2008). These studies show that factors like trust, perceived value, and overall satisfaction, which are integral components of brand image, play a critical role in shaping customers’ willingness to recommend a brand, as measured by NPS.
On a basic level, a favorable brand image enhances the likelihood of a customer becoming a promoter. As NPS directly measures customers’ willingness to recommend, it is logical that such advocacy stems from positive brand experiences and strong emotional or symbolic associations with the brand. According to de Haan et al. (2015), customer satisfaction and brand perceptions are significant antecedents of NPS ratings. In their study across several industries, they found that improvements in brand image attributes, such as trust, innovativeness, and social responsibility, positively influenced NPS outcomes, highlighting a direct link between perceived image and willingness to recommend. This relationship can be further explained through the lens of brand equity and customer-based brand strength. Brand image, as part of the overall brand equity framework (Keller, 1993), contributes to brand value by shaping customer attitudes, satisfaction, and loyalty. These constructs are highly predictive of NPS, which acts as a proxy for customers’ emotional and rational attachment to the brand. Baehre et al. (2021) argue that when NPS is treated not as a strict performance indicator but as a brand health metric, it reflects the cumulative effects of various image-related components, including service quality, corporate reputation, and consumer trust.
Empirical studies in sectors such as banking, telecommunications, and hospitality support these theoretical claims. Recent studies from outside the banking sector also support this connection. For instance, Harrigan et al. (2018) found that brand image significantly influenced customer advocacy in both hospitality and telecom contexts. Similarly, Xie et al. (2022) demonstrated strong links between brand trust and advocacy across several industries, including e-commerce and transportation, reinforcing the relevance of these dynamics beyond financial services. In a study on retail banking, Bravo et al. (2012) demonstrated that brand image factors (particularly trust and corporate social responsibility) significantly influenced customers’ loyalty behaviors, including their likelihood to recommend the bank. These behaviors align closely with how NPS is operationalized, suggesting that image and NPS are not independent constructs, but rather mutually reinforcing. Similarly, Keiningham et al. (2007) highlighted that satisfaction and perceived image quality were strong predictors of recommendation behavior, further supporting the idea that brand image can explain variations in NPS. Beyond direct influence, brand image also moderates the interpretation and strategic use of NPS data. In markets where trust and reputation are essential, such as financial services, a high NPS score may not be achievable without a strong underlying image. This point is particularly important in comparative studies across industries or regions. Kristensen and Eskildsen (2014) noted that differences in national culture and brand familiarity can affect both brand perceptions and NPS evaluations, potentially confounding their relationship. Therefore, analyzing NPS without accounting for brand image may lead to incomplete or misleading conclusions about customer sentiment and future behavior.
At the same time, it is important to acknowledge that the relationship between brand image and NPS is not entirely linear. Some customers may have favorable perceptions of a brand yet be unlikely to recommend it, due to personal preferences, switching costs, or social dynamics. Reichheld et al. (2021) suggest that while promoters are often emotionally connected to the brand, not all satisfied or loyal customers become advocates. This asymmetry suggests that while brand image is a necessary condition for high NPS, it may not be sufficient on its own. Other factors, such as customer effort, recent service experiences, or emotional triggers, may mediate or moderate the image–NPS link.
From a managerial perspective, integrating brand image analysis with NPS tracking offers several strategic benefits. Organizations can identify which dimensions of image, such as trust, innovation, or environmental responsibility, are most predictive of advocacy and prioritize investment accordingly (Bravo et al., 2012; Keller, 1993). Moreover, using image-based segmentation in NPS analysis allows for more nuanced interpretation of results, helping firms distinguish between passive satisfaction and active enthusiasm (Baehre et al., 2021). As brands seek to build long-term customer relationships and differentiate themselves in competitive markets, this integrated approach enables more targeted, effective brand and experience management (Zolkiewski et al., 2017). In conclusion, the relationship between NPS and brand image is both conceptually coherent and empirically supported. NPS reflects the outcome of accumulated brand perceptions, while brand image shapes the emotional and cognitive foundation for customer loyalty and advocacy (de Haan et al., 2015). The interplay between these constructs reinforces the importance of managing customer experience and brand equity in tandem. As research in this area evolves, future studies may benefit from exploring longitudinal dynamics, industry-specific variations, and cross-cultural contexts to deepen understanding and enhance practical application. Figure 1 shows a hypothetical model exploring the relationship between image and NPS and whether there are differences depending on the banks’ customer groups.
To investigate these relationships empirically, the following chapter outlines the methodological approach used in this study. It describes the research design, data collection procedures, sample characteristics, and the analytical techniques employed to examine the connection between brand image and NPS across multiple measurement periods.

3. Method

This chapter provides an overview of the research process, detailing the methodology employed, the procedures for data collection and analysis, and the manner in which the findings are presented.

3.1. Preparation and Implementation

The study is based on an online survey conducted in February 2021 (n = 512), 2023 (n = 563), and 2025 (n = 430) among customers of banks and savings and loans in Iceland, yielding a total of 1504 valid responses. All years used convenience sampling, and data were collected in the same way using QuestionPro. The questionnaire consisted of 17 questions, which were the same for all the years in which data were collected. It was also examined whether there was a different distribution or difference in the results of key questions by year, and it turned out that this was not the case. The first question was open-ended and related to awareness (top of mind), aiming to assess which bank or savings bank first came to respondents’ minds. This was followed by seven questions related to image, in which respondents were asked to indicate how well or poorly a given attribute applied to each bank on a scale from 1 to 9, where 1 represented “does not apply at all to the given bank” and 9 represented “applies very well to the given bank.” An example of a question is presented in Table 1.
In addition to the image factor trust, respondents were asked about the following image attributes: corporate social responsibility, customer satisfaction, and corruption, as well as whether the bank was perceived as modern, outdated, or targeted toward young people. Data of this kind are often analyzed using a method known as perceptual mapping, which visually represents consumer perceptions of brands or organizations. These image attributes were originally defined in a comprehensive study conducted in 2004 (Gudlaugsson, 2017), which involved interviews with customers, executives, and employees, as well as an analysis of bank websites and general media coverage. Following these questions, four additional questions were presented. The first of these was a traditional Net Promoter Score (NPS) question. Subsequently, respondents were asked:
  • How likely or unlikely they were to switch banks within the next six months.
  • Whether they had changed banks in the past six months.
  • If they had switched banks, which bank they had previously used.
Finally, three demographic questions were included, covering gender, age, and education.

3.2. The Sample and Data Analysis

The population for this research consists of bank customers. A total of 2530 individuals began the survey, and 1721 completed it. Since correlation tests are sensitive to data distortions, such as extreme responses, neutral answers, and outliers, extensive efforts were made to remove suspicious responses. After this process, 1504 valid responses remained, with strong indications that the image-related responses followed a normal distribution (skewness = −0.5; kurtosis = −0.16). The image construct was composed of four image factors—trust, social responsibility, satisfied customers, and corruption—which demonstrated acceptable internal reliability (α = 0.84), which is higher than Cohen’s (1988) criterion (α > 0.70). A convenience sampling method and an online survey were employed. Based on the authors’ experience, women tend to be overrepresented in online surveys, and a higher proportion of younger participants is also common. This pattern was observed in the present study, and the sample composition is presented in Table 2.
As shown in Table 2, females (58.80%) constituted the majority of the sample, and younger respondents (under 30 years old) made up 33.70%. To address this imbalance, the data were weighted based on gender and age, ensuring that the sample reflected the distribution of gender and age among individuals aged 18 to 70 (Statistics Iceland, n.d.). Table 3 presents the calculation of weighting factors based on these criteria.
This approach ensures that no single group, such as young women, disproportionately influences the results relative to the population’s overall distribution. All calculations were conducted using weighted data where applicable. To examine the correlation between image and NPS, a traditional correlation analysis (Pearson bivariate correlations) was used. The strength of the relationship was classified as follows (Cohen, 1988):
  • Weak correlation: 0.10–0.29
  • Moderate correlation: 0.30–0.49
  • Strong correlation: ≥0.50
To determine whether there were differences among the three banks, correlation coefficients for each customer group were converted into z-scores, and the statistical significance of the differences was assessed using Equation (1).
z o b s = z 1 z 2 1 N 1 3 + 1 N 2 3
where Z1 represents the transformed z-score for Group 1, and Z2 represents the transformed z-score for Group 2. To assess whether there is a statistically significant difference, the following criteria were applied:
  • If −1.96 < Zobs < 1.96, there is no significant difference between the groups.
  • If Zobs ≤ −1.96 or Zobs ≥ 1.96, there is a significant difference between the groups.

4. Results

This chapter presents the results of the study. First, the findings related to the relationship between NPS and image are discussed. Subsequently, the results are analyzed by customer groups, providing insights into potential differences among them.
Table 4 presents the results for brand image on a nine-point scale, where 1 indicates a weak perception and 9 represents a strong perception. The overall industry average is 5.05 (+/− 0.08), which is significantly lower than the levels observed before the financial crisis (October 2008). In comparison, the average brand image score was 6.86 in 2006 (Eysteinsson & Gudlaugsson, 2011).
When examining individual banks, it is evident that Landsbankinn (M = 5.16; +/− 0.13) and Íslandsbanki (M = 5.15; +/− 0.14) have higher average image scores than Arion Banki (M = 4.87; +/− 0.16). It is important to note that research suggests customers tend to rate their own bank more favorably than others (Gudlaugsson, 2017). Table 5 presents the average trust scores based on respondents’ banking relationships.
Trust is a key component of brand image, making it particularly relevant to highlight these findings here. Regarding the other image factors, corporate social responsibility, customer satisfaction, and corruption, a similar pattern emerges: respondents tend to associate their own bank more strongly with positive attributes and less strongly with negative ones. As shown in Table 5, in all cases, customers rate their own bank higher in trust than they do other banks. When examining trust in Landsbankinn across customer groups, a statistically significant difference (p < 0.05) is observed between the groups [F(2, 1468) = 59.812, p < 0.001]. A post hoc test reveals that the difference is between Landsbanki customers (LB-C: M = 6.95, SD = 1.90) and the customers of Íslandsbanki (ÍB-C: M = 5.70, SD = 2.27) and Arion Bank (AB-C: M = 5.68, SD = 2.26). The effect size (eta squared) is 0.075, indicating that 7.5% of the variance in trust toward Landsbankinn can be attributed to respondents’ banking relationships. According to Cohen (1988), this effect size is considered moderate to strong. Regarding trust in the other banks, the results follow a similar pattern, each bank receives the highest trust rating from its own customers.
Table 6 presents the calculated NPS for each bank based on survey data. The overall NPS is −16.80, indicating that detractors outnumber promoters by approximately 17 percentage points.
When examining individual banks, Landsbankinn has the highest NPS score at −0.95, while Íslandsbanki scores −6.87, and Arion Bank scores −8.98. This aligns well with the trust results, where Landsbankinn (6.95) received the highest trust rating, while Arion Bank had the lowest (4.89).
It is important to consider the criticism regarding how NPS is calculated. Some researchers argue that it is preferable to treat the scale as an interval scale rather than as a categorical classification. Since this study examines correlations, the NPS scale is treated as an interval scale in the analysis (reference from an earlier study). Table 7 presents the mean values when the NPS scale is treated as an interval scale.
As shown in Table 7, Landsbankinn has the highest mean score (M = 6.99, +/− 0.23) when the NPS scale is treated as an interval scale. This score is significantly higher than the mean scores for Íslandsbanki (M = 6.37, +/− 0.25) and Arion Bank (M = 5.95, +/− 0.28). However, the difference between Íslandsbanki and Arion Bank does not meet the 95% significance threshold, indicating that their scores are not statistically different at this confidence level.
When examining the correlation between brand image and NPS, a strong positive relationship is observed (r = 0.58; n = 1146; p < 0.001). This indicates that a higher NPS is likely associated with a higher brand image score. However, when analyzing the correlation separately for each bank, it varies depending on where respondents primarily conduct their banking transactions. The results of the correlation analysis for individual banks are presented in Table 8.
The correlation between image and NPS is strong and positive in all cases (Cohen, 1988). The strongest correlation is observed among Arion Bank customers (r = 0.68; n = 313). For Íslandsbanki customers, the correlation is also strong (r = 0.59; n = 408). Among Landsbankinn customers, the correlation is weaker in comparison (r = 0.55; n = 166), but still falls within the strong range.
To determine whether these differences meet the 95% significance threshold, the correlation coefficients were converted into z-scores, and the differences were tested using Equation (1). The results of this analysis are presented in Table 9.
A significant difference in correlation coefficients (Z_obs ≤ −1.96 or ≥ 1.96) is observed in two cases:
  • Between Arion Bank and Íslandsbanki
  • Between Landsbankinn and Arion Bank
This means that, with 95% confidence, the relationship between brand image and NPS is stronger for Arion Bank compared to the other two banks.

5. Discussion and Conclusions

This study finds a strong and consistent link between Net Promoter Score (NPS) and brand image in the Icelandic banking sector. By using data collected at three points in time (2021, 2023, and 2025), the analysis adds to previous research and gives a broader view of how customers’ perceptions of a bank’s image, such as trust, social responsibility, satisfaction, and corruption (reversed), are related to their willingness to recommend the bank to others. One of the key findings is that the correlation between image and NPS is strong across all three major banks, ranging from r = 0.55 to r = 0.68. This supports earlier studies that have shown how brand image factors influence customer loyalty and advocacy (de Haan et al., 2015; Keiningham et al., 2007). Still, the relationship is not exactly the same for every bank. Arion Bank, for example, had the strongest correlation, even though it had the lowest overall NPS and image scores. This suggests that customers of Arion Bank who view the brand positively are much more likely to recommend it, compared to customers at other banks. It may be that for Arion Bank, positive image matters even more for creating promoters than for Landsbankinn or Íslandsbanki. This kind of variation can depend on things like customer expectations, experiences, or how the bank positions itself.
For managers, this means that strengthening image attributes like trust or CSR may have an outsized impact on customer advocacy for Arion Bank, relative to its peers. The findings also reflect what Keller (1993) described in his brand equity model, that customers’ attitudes, beliefs, and feelings toward a brand help explain their behavior. In this case, factors like trust and social responsibility are not just nice ideas; they make people more likely to speak positively about the bank. This is similar to results in studies like Bravo et al. (2012) and Nguyen and Leblanc (2001), who also found that brand image plays an important role in shaping loyalty, especially in the banking and services sector where trust is essential.
It is also worth mentioning that this study used a more detailed measure of brand image, including multiple items like satisfaction and anti-corruption. Earlier research often focused just on trust or a single image indicator. This broader approach gives a better picture of how complex the relationship is between brand image and NPS. The fact that each bank was rated highest in image by its own customers supports earlier research (Gudlaugsson, 2017) and shows how personal experience can shape perception.
There has been some debate about the value of NPS as a measurement tool. Critics like Kristensen and Eskildsen (2014) have argued that NPS simplifies too much, and that cutting the 0–10 scale into three categories might hide important information. But this study, which treats NPS as a continuous variable and looks at its relationship with image, supports the view that NPS can still be useful, especially when it is analyzed in combination with other data (Reichheld et al., 2021). The strong and consistent correlations across years and banks suggest that NPS does capture something real and important about customer attitudes, at least in this context. At the same time, some caution is needed. This research was done in a specific country (Iceland), in a specific industry (banking), and culture, history, and customer behavior can all influence both NPS and brand image. Zolkiewski et al. (2017) have pointed out that customer experience metrics are very context-dependent. Thus, the results here might not look the same in other sectors or countries.
The practical implications for managers are clear. Banks should not look at NPS numbers in isolation. They should also pay attention to the image factors that influence whether customers become promoters. For example, if trust is the most strongly connected factor, then building trust through transparency and good service should be a strategic priority. Also, the fact that each bank’s own customers’ ratings are higher than others show how much individual experience matters, and how important it is to maintain high service quality and positive interactions. The study offers practical insight by identifying which brand image attributes are most influential for customer advocacy in each bank. For example, since Arion Bank showed the strongest correlation between image and NPS despite lower absolute scores, the implication is that marginal improvements in image (e.g., through CSR communication or service reliability) could lead to relatively higher advocacy returns. Managers should therefore tailor brand strategies to prioritize trust and transparency for customer segments showing weaker image–NPS alignment. This highlights the operational value of integrating perceptual brand metrics directly into NPS tracking frameworks. Another important point is about how the data was analyzed. Instead of using the standard NPS categories (promoters, passives, detractors), this study treats the full 0–10 scale as a continuous variable. This approach, as supported by N. A. Morgan and Rego (2006), gives more detail and allows for better statistical comparisons. It also avoids losing valuable information, especially in studies where the goal is to understand underlying relationships.
In conclusion, this study shows a consistent and meaningful relationship between brand image and Net Promoter Score (NPS) within the Icelandic banking sector. Customers who view their bank positively in areas like trust, social responsibility, and satisfaction are more likely to recommend it. While NPS has been criticized for being too simplistic, our findings suggest it remains useful when paired with deeper image measures. Treating NPS as a continuous variable adds nuance and improves its value as a tool for understanding customer sentiment. Future research could look more at how this relationship changes over time, or how it might be different in other industries and cultures.
The limitations of the study are that it is a convenience sample, which, even though adjusted for gender and age, can affect the results. The assessment also focuses on only one industry and limited numbers of image factors, so measurements would need to be made in other industries so that something can be said about industries there. It is also important to keep in mind that the study is limited to Iceland and therefore the results may be different in other countries. An important contextual factor is the controversial sale of Íslandsbanki in 2023, which attracted significant public criticism and may have negatively influenced perceptions of trust and integrity. While this event may have affected the 2023 and 2025 image scores for Íslandsbanki, it does not compromise the core findings about brand image–NPS relationships, which remained consistent across banks and waves. Future studies could replicate this framework in other service industries, such as telecommunications or insurance, to explore whether image–NPS dynamics vary across sectors. Cross-national comparisons could also help clarify the role of cultural or regulatory context in shaping customer advocacy.

Author Contributions

Conceptualization, T.G. and U.T.; methodology, T.G.; writing—original draft preparation, T.G.; writing—review and editing, U.T. and T.G.; visualization, T.G.; supervision, T.G.; project administration, T.G. and U.T.; All authors have read and agreed to the published version of the manuscript.

Funding

This research received no external funding.

Institutional Review Board Statement

Ethical review and approval were waived for this study due to the nature of the research, which involved the analysis of anonymized survey data collected from adult participants. The study did not include sensitive personal information or interventions, and participation was entirely voluntary with informed consent obtained. As such, the research posed minimal risk to participants and met the criteria for exemption from formal ethical review according to the guidelines of the University of Iceland, School of Social Sciences.

Informed Consent Statement

Informed consent was obtained from all subjects involved in the study.

Data Availability Statement

The data supporting the findings of this study are not publicly available due to privacy and ethical restrictions, but they are available from the corresponding author upon reasonable request.

Conflicts of Interest

The authors declare no conflict of interest.

References

  1. Aaker, D. A. (1991). Managing brand equity: Capitalizing on the value of a brand name. Free Press. [Google Scholar]
  2. Aaker, D. A. (1996). Building strong brands. Free Press. [Google Scholar]
  3. Anderson, E. W., Fornell, C., & Lehmann, D. R. (1994). Customer satisfaction, market share, and profitability: Findings from Sweden. Journal of Marketing, 58(3), 53–66. [Google Scholar] [CrossRef]
  4. Baehre, S., O’Dwyer, M., O’Malley, L., & Lee, N. (2021). The use of Net Promoter Score (NPS) to predict sales growth: Insights from an empirical investigation. Journal of the Academy of Marketing Science, 50, 67–84. [Google Scholar] [CrossRef]
  5. Bravo, R., Montaner, T., & Pina, J. M. (2009). The role of bank image for customers versus non-customers. International Journal of Bank Marketing, 27(4), 315–334. [Google Scholar] [CrossRef]
  6. Bravo, R., Montaner, T., & Pina, J. M. (2012). Corporate brand image in retail banking: Development and validation of a scale. The Service Industries Journal, 32(8), 1347–1364. [Google Scholar] [CrossRef]
  7. Chang, M. K. (2011). The role of perceived ethics and trust in consumers’ decision to use internet banking services in Hong Kong. Journal of Business Ethics, 95(1), 1–14. [Google Scholar]
  8. Chaudhuri, A., & Holbrook, M. B. (2001). The chain of effects from brand trust and brand affect to brand performance: The role of brand loyalty. Journal of Marketing, 65(2), 81–93. [Google Scholar] [CrossRef]
  9. Cohen, J. (1988). Statistical power analysis for the behavioral sciences. Erlbaum. [Google Scholar]
  10. de Haan, E., Verhoef, P. C., & Wiesel, T. (2015). The predictive ability of different customer feedback metrics for retention. International Journal of Research in Marketing, 32(2), 195–206. [Google Scholar] [CrossRef]
  11. Devlin, M. A. (2020). Comparing Net Promoter Score and J.D. Power Customer Satisfaction Index. Retail and small business banking [Ph.D. thesis, Wilmington University]. [Google Scholar]
  12. Du, S., Bhattacharya, C. B., & Sen, S. (2010). Maximizing business returns to corporate social responsibility (CSR): The role of CSR communication. International Journal of Management Reviews, 12(1), 8–19. [Google Scholar] [CrossRef]
  13. Eysteinsson, F., & Gudlaugsson, T. (2011). How the banking crisis in Iceland affected the image of its banking sector and individual banks. Journal of International Finance Studies, 11(1), 34–39. [Google Scholar]
  14. Freeman, R. E. (1984). Strategic management: A stakeholder approach. Pitman. [Google Scholar]
  15. Gounaris, S. P., Tzempelikos, N., & Chatzipanagiotou, K. (2010). The relationships of customer-perceived value, satisfaction, loyalty and behavioral intentions. Journal of Relationship Marketing, 6(1), 63–87. [Google Scholar] [CrossRef]
  16. Gudlaugsson, T. (2017). Trust and loyalty in retail banking and the effect of the banking crisis in Iceland. International Journal of Business Research, 17(1), 65–72. [Google Scholar] [CrossRef]
  17. Gudlaugsson, T. (2020, July 6–9). The relationship between NPS and trust. Proceedings 27th International Conference on Recent Advances in Retailing and Consumer Science (pp. 2–16), Baveno, Italy. [Google Scholar]
  18. Harrigan, P., Evers, U., Miles, M. P., & Daly, T. (2018). Customer engagement and the relationship between involvement, engagement, self-brand connection and brand usage intent. Journal of Business Research, 88, 388–396. [Google Scholar] [CrossRef]
  19. Hayes, B. E. (1998). Measuring customer satisfacton. Survey design, use, and statistical analysis methods (2nd ed.). ASQ Quality Press. [Google Scholar]
  20. Hayes, B. E. (2013). TCE: Total customer experience—Building business through customercentric measurement and analytics. Business Over Broadway. [Google Scholar]
  21. Homburg, C., Koschate, N., & Hoyer, W. D. (2006). The role of cognition and affect in the formation of customer satisfaction: A dynamic perspective. Journal of Marketing, 70(3), 21–31. [Google Scholar] [CrossRef]
  22. Hur, W. M., Kim, H., & Woo, J. (2014). How CSR leads to corporate brand equity: Mediating mechanisms of corporate brand credibility and reputation. Journal of Business Ethics, 125, 75–86. [Google Scholar] [CrossRef]
  23. Iglesias, O., Singh, J. J., & Batista-Goquet, J. M. (2011). The role of brand experience and affective commitment in determining brand loyalty. Journal of Brand Management, 18, 570–582. [Google Scholar] [CrossRef]
  24. Keiningham, T. L., Aksoy, L., Cooil, B., & Andreassen, T. W. (2008). Linking customer loyalty to growth. MIT Sloan Management Review, 49(4), 51–57. Available online: https://sloanreview.mit.edu/article/linking-customer-loyalty-to-growth/ (accessed on 16 May 2025).
  25. Keiningham, T. L., Cooil, B., Aksoy, L., Andreassen, T. W., & Weiner, J. (2007). The value of different customer satisfaction and loyalty metrics in predicting customer retention, recommendation, and share-of-wallet. Managing Service Quality, 17(4), 361–384. [Google Scholar] [CrossRef]
  26. Keller, K. L. (1993). Conceptualizing, measuring, and managing customer-based brand equity. Journal of Marketing, 57(1), 1–22. [Google Scholar] [CrossRef]
  27. Kristensen, K., & Eskildsen, J. (2014). Is the NPS a trustworthy performance measure? The TQM Journal, 26(2), 202–214. [Google Scholar] [CrossRef]
  28. Lilien, G. L., & Rangasqamy, A. (2004). Marketing engineering: Compute-assisted marketing analysis and planning. Trafford Publshing. [Google Scholar]
  29. Luo, X., & Bhattacharya, C. B. (2006). Corporate social responsibility, customer satisfaction, and market value. Journal of Marketing, 70(4), 1–18. [Google Scholar] [CrossRef]
  30. Morgan, N. A., & Rego, L. L. (2006). The value of different customer satisfaction and loyalty metrics in predicting business performance. Marketing Science, 25(5), 426–439. [Google Scholar] [CrossRef]
  31. Morgan, R. M., & Hunt, S. D. (1994). The commitment-trust theory of relationship marketing. Journal of Marketing, 58(3), 20–38. [Google Scholar] [CrossRef]
  32. Nguyen, N., & Leblanc, G. (2001). Corporate image and corporate reputation in customers’ retention decisions in services. Journal of Retailing and Consumer Services, 8(4), 227–236. [Google Scholar] [CrossRef]
  33. Oliver, R. L. (1997). Satisfaction: A behavioral perspective on the Consumer. McGraw-Hill. [Google Scholar]
  34. Pivato, S., Misani, N., & Tencati, A. (2008). The impact of corporate social responsibility on consumer trust: The case of organic food. Business Ethics: A European Review, 17(1), 3–12. [Google Scholar] [CrossRef]
  35. Rassens, N., & Haans, H. (2017). NPS and online WOM: Investigating the relationship between customers’ promoter scores and eWOM behaviour. Journal of Service Research, 20(3), 322–334. [Google Scholar] [CrossRef] [PubMed]
  36. Reichheld, F. F. (2003). The one number you need to grow. Harvard Business Review, 81(12), 46–54. Available online: https://hbr.org/2003/12/the-one-number-you-need-to-grow (accessed on 10 May 2025).
  37. Reichheld, F. F., Markey, R. G., & Hopton, C. (2021). Winning on purpose: The unbeatable strategy of loving customers. Harvard Business Review Press. [Google Scholar]
  38. Rio, A. B., del Vazquez, R., & Iglesias, V. (2001). The effects of brand associations on consumer response. Journal of Consumer Marketing, 18(5), 410–425. [Google Scholar] [CrossRef]
  39. Rodriguez, P., Siegel, D., Hillman, A., & Eden, L. (2006). Three lenses on the multinational enterprise: Politics, corruption, and corporate social responsibility. Journal of International Business Studies, 37(6), 733–746. [Google Scholar] [CrossRef]
  40. Spence, M. (1973). Job market signaling. Quarterly Journal of Economics, 87(3), 355–374. [Google Scholar] [CrossRef]
  41. Statistics Iceland. (n.d.). Available online: https://hagstofa.is/talnaefni/ibuar/mannfjoldi/ (accessed on 13 February 2025).
  42. Xie, L., Zhang, Y., & Zhang, L. (2022). Brand experience and customer advocacy: A cross-industry study. Journal of Retailing and Consumer Services, 66, 102888. [Google Scholar] [CrossRef]
  43. Zhang, Y. (2015). The impact of brand image on consumer behavior: A literature review. Open Journal of Business and Management, 3(1), 58–62. [Google Scholar] [CrossRef]
  44. Zolkiewski, J., Story, V., Burton, J., Chan, P., Gomes, A., Hunter-Jones, P., O’Malley, L., Peters, L. D., Radars, C., & Robinson, W. (2017). Strategic B2B customer experience management: The importance of outcomes-based measures. Journal of Services Marketing, 31(2), 172–184. [Google Scholar] [CrossRef]
Figure 1. The hypothetical model.
Admsci 15 00237 g001
Table 1. An example of a question assessing brand image.
How well or poorly do you think the following applies to the banks? TRUST
123456789
Landsbankinn
Íslandsbanki
Arion banki
Table 2. Background information on the sample.
Gender
Male41.20%
Female58.80%
Age
Younger than 30 years old33.70%
30 to 49 years old28.20%
50 years or older38.10%
Education
High school diploma or lower39.70%
University degree60.30%
Table 3. Calculation of weighting factors.
PopulationSampleWeighting Factors
Male (1)Female (2)Male (1)Female (2)Male (1)Female (2)
18–29 years old (1)13.10%12.10%14.30%19.30%0.920.63
30–49 years old (2)21.60%19.40%9.10%18.10%2.371.07
50–70 years old (3)17.02%16.90%18.30%20.90%0.930.81
Table 4. Industry image and differences among customer groups.
95% Confidence Interval
NMeanSdLowerUpper+/−
Average score11465.051.434.975.140.08
Landsbankinn (LB)4035.161.395.035.30.13
Íslandsbanki (ÍB)4085.151.45.015.280.14
Arion banki (AB)3134.871.494.715.040.16
Table 5. Average trust scores based on respondents’ banking relationships.
Score for the Image Attribute Trust
Customer GroupLandsbankiÍslandsbankiArion Banki
Landsbanki customers (n = 542) 6.95 +/− 0.165.22 +/− 0.184.95 +/− 0.19
Íslandsbnaki customers (n = 505) 5.70 +/− 0.206.28 +/− 0.204.89 +/− 0.21
Arion banki customers (n = 425) 5.68 +/− 0.224.95 +/− 0.205.99 +/− 0.23
Table 6. NPS scores by banks in Iceland: average scores based on the 2021, 2023, and 2025 surveys.
LandsbankiÍslandsbankiArion BankiTotal
Detractors (0–6)13.47%15.31%15.31%44.08%
Passives (7–8)10.82%10.41%7.41%28.64%
Promoters (9–10)12.52%8.44%6.33%27.28%
NPS (P-D)−0.95−6.87−8.98−16.80
Table 7. Mean scores across banks using the NPS scale as an interval scale.
95% Confidence Interval
NMeanSdLowerUpper+/−
Average score 15036.502.836.366.650.14
Landsbankinn (LB) 5416.992.686.767.210.23
Íslandsbanki (ÍB) 5056.372.806.126.610.25
Arion banki (AB) 4255.952.975.676.230.28
Table 8. Correlation between image and NPS for individual banks.
nrp
Landsbankinn 4030.55<0.001
Íslandsbanki 4080.59<0.001
Arion banki 3130.68<0.001
Table 9. Analysis of differences in correlation coefficients across banks.
TestZobs
ZLB;IB−0.85
ZLB;AB−2.79
ZAB;IB2.00
Disclaimer/Publisher’s Note: The statements, opinions and data contained in all publications are solely those of the individual author(s) and contributor(s) and not of MDPI and/or the editor(s). MDPI and/or the editor(s) disclaim responsibility for any injury to people or property resulting from any ideas, methods, instructions or products referred to in the content.

