Corporate Sustainability and Wealth Distribution: Evidence from Brazil’s Corporate Sustainability Index


 , , and
Abstract
1. Introduction
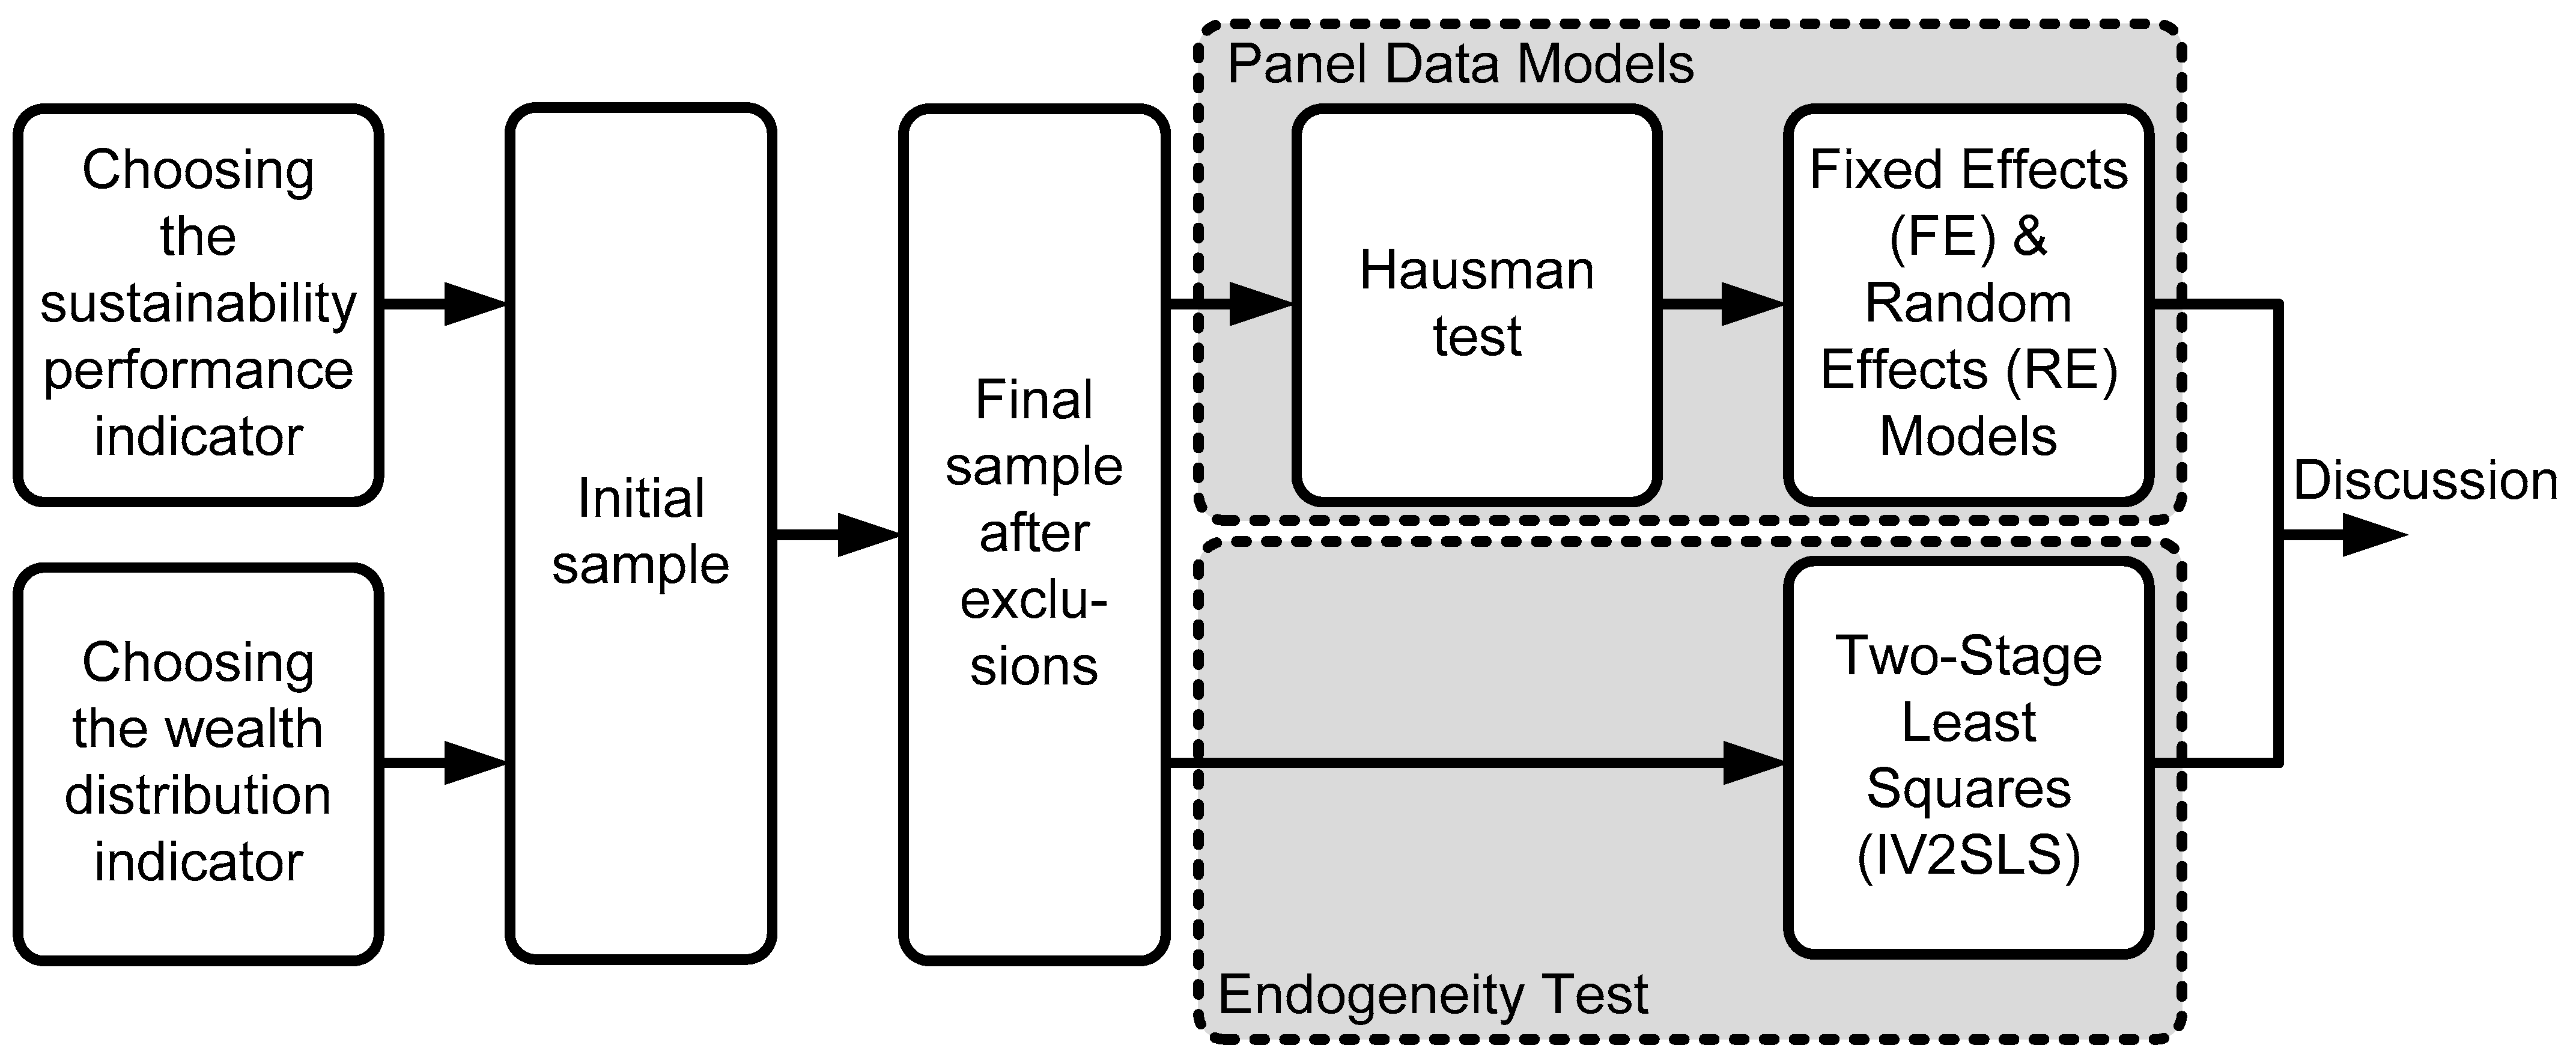
2. Methods
2.1. Choosing the Sustainability Performance Indicator
2.2. Choosing the Distribution of Wealth Created Indicator
2.3. Initial Sample
2.4. Final Sample
- (a)
- Excluding all companies in the financial and insurance sectors. According to Pérez-Calderón et al. (2012) and Fernández-Guadaño and Sarria-Pedroza (2018), comparing their information with that of other sectors is complex (when possible) due to the peculiarities of their financial reporting standards. Another justification is that the SAV for companies in these sectors has a different structure from that used for all other sectors (Melo, 2021).
- (b)
- All companies in a portfolio that, during the period of its validity, received the classification called ‘in a special situation’, according to the ISE-B3 Guidelines (ISE B3, 2022b) were excluded. This includes companies that entered into judicial recovery proceedings.
- (c)
- Companies that presented incomprehensible and/or non-standard data in the SAV were excluded, according to the authors’ experience. For example, data that was apparently incorrect and/or without explanations or comments to justify it were excluded.
- (d)
- Companies that had problems obtaining SAV on their websites; difficult access to information.
- (e)
- Outliers were excluded based on the authors’ experience through visual inspection of box-plot diagrams of total sample, considering each variable per revenue category. The variables included DAV, Personal and Expenses, Taxes, Fees and Contribution, Remuneration of Third-party Capital, and Remuneration of Equity Capital.
2.5. Assessing the Relationship Between Sustainability and Economic Indicators: Econometric Tools
2.5.1. About the Endogeneity Sources and Instrument Validity
2.5.2. Model Selection and Estimation Procedure
3. Results and Discussions
3.1. Main Results: IV-2SLS Model
3.2. Robustness Checks: Panel Data Models (Hausman Test and RE Model)
3.2.1. Hausman Test
3.2.2. Results from the Random Effects (RE) Model
3.3. Discussion of Findings
4. Conclusions
Supplementary Materials
Author Contributions
Funding
Institutional Review Board Statement
Informed Consent Statement
Data Availability Statement
Acknowledgments
Conflicts of Interest
Appendix A

| Company Name | ISE-B3 | Variable/Revenue | ||||
|---|---|---|---|---|---|---|
| DAV | Personnel and Expenses | Taxes, Fees and Contributions | Remuneration of Third-Party Capital | Remuneration of Equity Capital | ||
| WEG S.A. | 62.78 | 0.46 | 0.20 | 0.10 | 0.03 | 0.14 |
| AZUL S.A. | 58.89 | 0.24 | 0.14 | 0.06 | 0.45 | −0.41 |
| RUMO S.A. | 71.12 | 0.39 | 0.13 | 0.01 | 0.24 | 0.02 |
| IOCHPE MAXION S.A. | 58.24 | 0.28 | 0.17 | 0.07 | 0.03 | 0.01 |
| MAGAZINE LUIZA S.A. | 61.47 | 0.38 | 0.06 | 0.09 | 0.03 | 0.20 |
| VIA VAREJO S.A. | 61.97 | 0.16 | 0.14 | −0.02 | 0.04 | −0.01 |
| LOJAS RENNER S.A. | 85.13 | 0.41 | 0.12 | 0.18 | 0.05 | 0.06 |
| MRV ENGENHARIA E PARTICIPACOES S.A. | 62.97 | 0.43 | 0.15 | 0.11 | 0.06 | 0.12 |
| AREZZO INDÚSTRIA E COMÉRCIO S.A. | 64.39 | 0.29 | 0.09 | 0.00 | 0.03 | 0.17 |
| M.DIAS BRANCO S.A. IND COM DE ALIMENTOS | 69.87 | 0.27 | 0.12 | 0.06 | 0.04 | 0.06 |
| BRF S.A. | 72.79 | 0.20 | 0.11 | 0.09 | 0.07 | −0.06 |
| MARFRIG GLOBAL FOODS S.A. | 69.23 | 0.29 | 0.09 | 0.04 | 0.09 | 0.08 |
| MINERVA S.A. | 63.46 | 0.13 | 0.02 | 0.00 | 0.05 | 0.05 |
| CIA BRASILEIRA DE DISTRIBUICAO | 74.05 | 0.21 | 0.13 | −0.03 | 0.06 | 0.05 |
| SimPAR S.A. | 63.53 | 0.48 | 0.15 | 0.12 | 0.13 | 0.09 |
| DURATEX S.A. | 74.55 | 0.40 | 0.09 | 0.07 | 0.03 | 0.22 |
| KLABIN S.A. | 80.81 | 0.43 | 0.09 | 0.09 | 0.08 | 0.16 |
| SUZANO S.A. | 78.79 | 0.62 | 0.06 | 0.02 | 0.36 | 0.19 |
| BRASKEM S.A. | 76.69 | 0.32 | 0.02 | 0.10 | 0.09 | 0.11 |
| COSAN S.A. | 74.58 | 0.43 | 0.05 | 0.05 | 0.13 | 0.21 |
| PETROBRAS DISTRIBUIDORA S/A | 72.66 | 0.63 | 0.05 | 0.30 | 0.12 | 0.16 |
| RAIA DROGASIL S.A. | 67.29 | 0.29 | 0.10 | 0.13 | 0.03 | 0.03 |
| FLEURY S.A. | 74.27 | 0.50 | 0.22 | 0.14 | 0.06 | 0.08 |
| TELEFÔNICA BRASIL S.A | 81.71 | 0.46 | 0.08 | 0.21 | 0.06 | 0.10 |
| TIM S.A. | 77.18 | 0.53 | 0.04 | 0.24 | 0.13 | 0.12 |
| AMBIPAR PARTICIPACOES E EMPREENDIMENTOS S/A | 79.04 | 0.62 | 0.30 | 0.18 | 0.06 | 0.08 |
| CIA ENERGETICA DE MINAS GERAIS—CEMIG | 73.42 | 0.44 | 0.03 | 0.27 | 0.07 | 0.08 |
| CIA PARANAENSE DE ENERGIA—COPEL | 77.54 | 0.52 | 0.05 | 0.33 | 0.03 | 0.10 |
| CPFL ENERGIA S.A. | 81.99 | 0.44 | 0.03 | 0.29 | 0.04 | 0.09 |
| EDP—ENERGIAS DO BRASIL S.A. | 90.25 | 0.33 | 0.02 | 0.23 | 0.06 | 0.03 |
| LIGHT S.A. | 64.11 | 0.46 | 0.02 | 0.35 | 0.08 | 0.02 |
| NEOENERGIA S.A. | 77.00 | 0.42 | 0.03 | 0.26 | 0.11 | 0.02 |
| AES BRASIL ENERGIA S.A. | 74.74 | 0.19 | 0.03 | −0.11 | 0.13 | 0.13 |
| CENTRAIS ELET BRAS S.A.—ELETROBRAS | 65.04 | 0.53 | 0.11 | 0.20 | 0.11 | 0.11 |
| ENGIE BRASIL ENERGIA S.A. | 78.22 | 0.48 | 0.03 | 0.17 | 0.17 | 0.11 |
| Company Name | ISE-B3 | Variable/Revenue | ||||
|---|---|---|---|---|---|---|
| DAV | Personnel and Expenses | Taxes, Fees and Contributions | Remuneration of Third-Party Capital | Remuneration of Equity Capital | ||
| AES BRASIL ENERGIA S.A. | 80.16 | 0.28 | 0.03 | 0.09 | 0.11 | 0.05 |
| AREZZO INDÚSTRIA E COMÉRCIO S.A. | 75.93 | 0.25 | 0.11 | −0.01 | 0.03 | 0.12 |
| AZUL S.A. | 73.60 | 0.27 | 0.10 | 0.05 | 0.16 | −0.04 |
| BRASKEM S.A. | 76.97 | 0.14 | 0.02 | 0.06 | 0.06 | −0.01 |
| BRF S.A. | 76.19 | 0.28 | 0.10 | 0.10 | 0.07 | 0.01 |
| CENTRAIS ELET BRAS S.A.—ELETROBRAS | 78.82 | 0.57 | 0.15 | 0.13 | 0.21 | 0.08 |
| CIA BRASILEIRA DE DISTRIBUICAO | 77.93 | 0.21 | 0.12 | 0.00 | 0.09 | −0.01 |
| CIA PARANAENSE DE ENERGIA—COPEL | 81.17 | 0.47 | 0.04 | 0.31 | 0.09 | 0.04 |
| COSAN S.A. | 75.78 | 0.40 | 0.04 | 0.08 | 0.22 | 0.06 |
| CPFL ENERGIA S.A. | 84.87 | 0.51 | 0.04 | 0.28 | 0.09 | 0.09 |
| DURATEX | 77.62 | 0.33 | 0.10 | 0.04 | 0.09 | 0.10 |
| EDP—ENERGIAS DO BRASIL S.A. | 89.99 | 0.41 | 0.02 | 0.26 | 0.09 | 0.04 |
| ENGIE BRASIL ENERGIA S.A. | 82.71 | 0.60 | 0.03 | 0.19 | 0.18 | 0.20 |
| FLEURY S.A. | 75.90 | 0.52 | 0.23 | 0.12 | 0.10 | 0.06 |
| IOCHPE MAXION S.A. | 70.91 | 0.25 | 0.14 | 0.07 | 0.04 | 0.01 |
| CIA ENERGETICA DE MINAS GERAIS—CEMIG | 78.89 | 0.43 | 0.04 | 0.24 | 0.07 | 0.09 |
| KLABIN S.A. | 86.04 | 0.41 | 0.09 | 0.11 | 0.03 | 0.19 |
| LOJAS RENNER S.A. | 86.65 | 0.45 | 0.10 | 0.19 | 0.06 | 0.10 |
| M.DIAS BRANCO S.A. IND COM DE ALIMENTOS | 77.41 | 0.24 | 0.10 | 0.05 | 0.05 | 0.04 |
| MAGAZINE LUIZA S.A. | 76.48 | 0.44 | 0.07 | 0.09 | 0.06 | 0.21 |
| MARFRIG GLOBAL FOODS S.A. | 77.89 | 0.28 | 0.08 | 0.04 | 0.14 | 0.02 |
| MINERVA S.A. | 68.22 | 0.07 | 0.02 | −0.02 | 0.03 | 0.04 |
| MOVIDA PARTICIPACOES SA | 70.36 | 1.23 | 0.01 | −0.12 | 0.77 | 0.56 |
| MRV ENGENHARIA E PARTICIPACOES S.A. | 74.33 | 0.36 | 0.18 | 0.12 | 0.08 | −0.02 |
| RAIA DROGASIL S.A. | 76.01 | 0.25 | 0.10 | 0.08 | 0.04 | 0.03 |
| RUMO S.A. | 74.80 | 0.53 | 0.09 | 0.08 | 0.31 | 0.04 |
| SIMPAR S.A. | 63.76 | 0.41 | 0.12 | 0.05 | 0.20 | 0.03 |
| SUZANO S.A. | 81.80 | 0.61 | 0.05 | 0.01 | 0.18 | 0.37 |
| GRENDENE S.A. | 69.02 | 0.54 | 0.22 | 0.08 | 0.04 | 0.20 |
| TELEFÔNICA BRASIL S.A | 87.67 | 0.45 | 0.09 | 0.21 | 0.09 | 0.07 |
| TIM S.A. | 82.16 | 0.50 | 0.04 | 0.23 | 0.16 | 0.07 |
| USINAS SID DE MINAS GERAIS S.A.-USIMINAS | 66.02 | 0.24 | 0.03 | 0.15 | 0.02 | 0.05 |
| VIA S.A | 64.44 | 0.18 | 0.09 | 0.01 | 0.08 | −0.01 |
| AMBEV S.A. | 63.23 | 0.50 | 0.06 | 0.25 | 0.07 | 0.13 |
| IRANI PAPEL E EMBALAGEM S.A. | 75.54 | 0.52 | 0.11 | 0.16 | 0.08 | 0.18 |
| CTEEP—CIA TRANSMISSÃO ENERGIA ELÉTRICA PAULISTA | 80.28 | 0.78 | 0.06 | 0.20 | 0.16 | 0.37 |
| GUARARAPES CONFECCOES S.A. | 68.71 | 0.45 | 0.19 | 0.08 | 0.16 | 0.03 |
| VAMOS LOCAÇÃO DE CAMINHÕES, MÁQUINAS E EQUIP. S.A. | 63.64 | 0.98 | 0.06 | 0.06 | 0.53 | 0.32 |
| ALIANSCE SONAE SHOPPING CENTERS S.A. | 68.17 | 0.71 | 0.09 | 0.09 | 0.34 | 0.19 |
| GAFISA S.A. | 59.10 | 1.05 | 0.30 | 0.25 | 1.03 | −0.52 |
| HYPERA S.A. | 66.21 | 0.46 | 0.10 | 0.00 | 0.14 | 0.21 |
| AERIS IND. E COM. DE EQUIP. GERACAO DE ENERGIA S/A | 70.56 | 0.32 | 0.13 | 0.03 | 0.20 | −0.03 |
| CIA SANEAMENTO DO PARANA—SANEPAR | 60.97 | 0.66 | 0.20 | 0.18 | 0.09 | 0.20 |
| COMPANHIA BRASILEIRA DE ALUMÍNIO | 86.02 | 0.47 | 0.09 | 0.18 | 0.11 | 0.09 |
| ENEVA S.A | 75.62 | 0.47 | 0.07 | 0.16 | 0.18 | 0.05 |
| RAÍZEN S.A. | 75.76 | 0.15 | 0.04 | 0.05 | 0.04 | 0.02 |
| Rede DOr São Luiz S.A. | 70.93 | 0.75 | 0.29 | 0.06 | 0.36 | 0.03 |
| SANTOS BRASIL PARTICIPACOES S.A. | 66.26 | 0.80 | 0.23 | 0.19 | 0.09 | 0.29 |
| SENDAS DISTRIBUIDORA S.A. | 70.14 | 0.11 | 0.05 | 0.00 | 0.03 | 0.02 |
| SLC AGRICOLA S.A. | 69.58 | 0.50 | 0.06 | 0.08 | 0.19 | 0.17 |
| VIBRA ENERGIA S.A. | 71.33 | 0.15 | 0.00 | 0.13 | 0.02 | 0.01 |
| Company Name | ISE-B3 | Variable/Revenue | ||||
|---|---|---|---|---|---|---|
| DAV | Personnel and Expenses | Taxes, Fees and Contributions | Remuneration of Third-Party Capital | Remuneration of Equity Capital | ||
| LOJAS RENNER S.A. | 90.20 | 0.41 | 0.10 | 0.19 | 0.05 | 0.07 |
| CPFL ENERGIA S.A. | 89.51 | 0.52 | 0.04 | 0.30 | 0.08 | 0.10 |
| TELEFÔNICA BRASIL S.A | 89.16 | 0.44 | 0.10 | 0.17 | 0.09 | 0.08 |
| TIM S.A. | 88.84 | 0.40 | 0.03 | 0.16 | 0.12 | 0.08 |
| AMBIPAR PARTICIPACOES E EMPREENDIMENTOS S/A | 87.87 | 0.67 | 0.30 | 0.16 | 0.20 | 0.01 |
| COMPANHIA BRASILEIRA DE ALUMÍNIO | 87.31 | 0.27 | 0.11 | 0.16 | 0.09 | −0.09 |
| SUZANO S.A. | 85.32 | 0.56 | 0.07 | 0.02 | 0.21 | 0.27 |
| KLABIN S.A. | 85.32 | 0.37 | 0.10 | 0.10 | 0.05 | 0.13 |
| NEOENERGIA S.A. | 84.97 | 0.52 | 0.03 | 0.27 | 0.16 | 0.07 |
| CIA PARANAENSE DE ENERGIA—COPEL | 84.80 | 0.53 | 0.07 | 0.29 | 0.07 | 0.07 |
| AES BRASIL ENERGIA S.A. | 83.88 | 0.33 | 0.03 | 0.10 | 0.16 | 0.05 |
| CCR S.A. | 83.83 | 0.58 | 0.10 | 0.12 | 0.28 | 0.09 |
| SLC AGRICOLA S.A. | 82.54 | 0.39 | 0.07 | 0.01 | 0.18 | 0.12 |
| RAIA DROGASIL S.A. | 82.53 | 0.31 | 0.10 | 0.13 | 0.04 | 0.03 |
| NATURA &CO HOLDING S.A. | 82.40 | 0.78 | 0.15 | 0.13 | 0.42 | 0.09 |
| FLEURY S.A. | 82.13 | 0.56 | 0.24 | 0.10 | 0.11 | 0.09 |
| CIA BRASILEIRA DE DISTRIBUICAO | 81.78 | 0.11 | 0.12 | 0.01 | 0.08 | −0.11 |
| CENTRAIS ELET BRAS S.A.—ELETROBRAS | 81.60 | 0.65 | 0.11 | 0.04 | 0.35 | 0.10 |
| RAIZEN S.A. | 81.30 | 0.10 | 0.02 | 0.05 | 0.03 | 0.01 |
| ECORODOVIAS INFRAESTRUTURA E LOGÍSTICA S.A. | 81.08 | 0.46 | 0.06 | 0.13 | 0.20 | 0.06 |
| DEXCO S.A. | 80.96 | 0.42 | 0.12 | 0.05 | 0.14 | 0.12 |
| Rede DOr São Luiz S.A. | 80.50 | 0.53 | 0.17 | 0.05 | 0.27 | 0.02 |
| COSAN S.A. | 80.23 | 0.46 | 0.05 | 0.09 | 0.22 | 0.10 |
| RUMO S.A. | 79.88 | 0.58 | 0.10 | 0.09 | 0.33 | 0.06 |
| CIA ENERGETICA DE MINAS GERAIS—CEMIG | 79.55 | 0.44 | 0.04 | 0.25 | 0.03 | 0.12 |
| AREZZO INDÚSTRIA E COMÉRCIO S.A. | 78.93 | 0.22 | 0.08 | 0.01 | 0.04 | 0.09 |
| M.DIAS BRANCO S.A. IND COM DE ALIMENTOS | 78.91 | 0.31 | 0.11 | 0.09 | 0.05 | 0.07 |
| MRV ENGENHARIA E PARTICIPACOES S.A. | 78.17 | 0.32 | 0.17 | 0.06 | 0.09 | 0.00 |
| AZUL S.A. | 78.12 | 0.25 | 0.11 | 0.02 | 0.24 | −0.13 |
| CTEEP—CIA TRANSMISSÃO ENERGIA ELÉTRICA PAULISTA | 78.08 | 0.76 | 0.05 | 0.16 | 0.15 | 0.41 |
| ATACADÃO S.A. | 78.04 | 0.15 | 0.05 | 0.06 | 0.04 | −0.01 |
| BRF S.A. | 77.00 | 0.24 | 0.11 | 0.09 | 0.07 | −0.03 |
| WEG S.A. | 76.41 | 0.48 | 0.18 | 0.10 | 0.04 | 0.16 |
| IOCHPE MAXION S.A. | 76.16 | 0.29 | 0.17 | 0.06 | 0.05 | 0.00 |
| MAGAZINE LUIZA S.A. | 76.03 | 0.22 | 0.07 | 0.11 | 0.07 | −0.02 |
| ENEVA S.A | 75.96 | 0.51 | 0.05 | 0.12 | 0.31 | 0.03 |
| VIBRA ENERGIA S.A. | 74.56 | 0.09 | 0.01 | 0.05 | 0.01 | 0.03 |
| IRANI PAPEL E EMBALAGEM S.A. | 74.33 | 0.58 | 0.12 | 0.17 | 0.11 | 0.18 |
| ENAUTA PARTICIPAÇÕES S.A. | 72.33 | 0.39 | 0.08 | 0.10 | 0.24 | −0.03 |
| GUARARAPES CONFECCOES S.A. | 72.22 | 0.33 | 0.16 | 0.11 | 0.06 | 0.00 |
| MOVIDA PARTICIPACOES SA | 72.22 | 0.22 | 0.05 | 0.02 | 0.21 | −0.06 |
| SENDAS DISTRIBUIDORA S.A. | 72.21 | 0.11 | 0.05 | 0.00 | 0.04 | 0.01 |
| MINERVA S.A. | 71.69 | 0.14 | 0.04 | 0.01 | 0.07 | 0.01 |
| AMBEV S.A. | 71.15 | 0.51 | 0.06 | 0.27 | 0.05 | 0.12 |
| CIA SANEAMENTO DO PARANA—SANEPAR | 70.95 | 0.68 | 0.19 | 0.18 | 0.09 | 0.22 |
| COGNA EDUCAÇÃO S.A. | 70.90 | 0.66 | 0.35 | −0.01 | 0.43 | −0.12 |
| HYPERA S.A. | 69.87 | 0.45 | 0.11 | −0.01 | 0.16 | 0.20 |
| SANTOS BRASIL PARTICIPACOES S.A. | 69.36 | 0.80 | 0.22 | 0.19 | 0.09 | 0.22 |
| CEA MODAS S.A. | 68.38 | 0.46 | 0.11 | 0.25 | 0.10 | 0.00 |
| AUREN ENERGIA S.A. | 67.70 | 0.44 | 0.03 | 0.27 | 0.17 | −0.05 |
| USINAS SID DE MINAS GERAIS S.A.-USIMINAS | 66.64 | 0.21 | 0.03 | 0.11 | 0.02 | 0.05 |
| YDUQS PARTICIPACOES S.A. | 66.47 | 0.64 | 0.29 | 0.09 | 0.22 | 0.03 |
| CIA SANEAMENTO DE MINAS GERAIS-COPASA MG | 66.15 | 0.59 | 0.20 | 0.16 | 0.06 | 0.18 |
| VAMOS LOCAÇÃO DE CAMINHÕES, MÁQUINAS E EQUIP. S.A. | 66.01 | 0.48 | 0.07 | 0.05 | 0.27 | 0.09 |
| CYRELA BRAZIL REALTY S.A.EMPREEND E PART | 65.86 | 0.37 | 0.06 | 0.05 | 0.09 | 0.17 |
| IGUATEMI S.A. | 65.77 | 0.83 | 0.12 | 0.14 | 0.35 | 0.23 |
| SIMPAR S.A. | 65.46 | 0.42 | 0.12 | 0.05 | 0.21 | 0.04 |
| CAMIL ALIMENTOS S.A. | 64.41 | 0.23 | 0.06 | 0.07 | 0.06 | 0.03 |
| JSL S.A. | 64.22 | 0.52 | 0.25 | 0.11 | 0.12 | 0.04 |
| OMEGA ENERGIA S.A. | 63.93 | 0.38 | 0.03 | 0.04 | 0.29 | 0.02 |
| ULTRAPAR PARTICIPACOES S.A. | 63.41 | 0.07 | 0.02 | 0.02 | 0.02 | 0.02 |
| DIAGNOSTICOS DA AMERICA S.A. | 63.12 | 0.36 | 0.26 | 0.07 | 0.11 | −0.07 |
| GAFISA S.A. | 62.08 | 0.30 | 0.06 | 0.08 | 0.32 | 0.00 |
References
- Alshehhi, A., Nobanee, H., & Khare, N. (2018). The impact of sustainability practices on corporate financial performance: Literature trends and future research potential. Sustainability, 10(2), 494. [Google Scholar] [CrossRef]
- Angrist, J. D., & Pischke, J. S. (2008). Mostly harmless econometrics: An empiricist’s companion. Princeton University Press. [Google Scholar]
- Arellano, M., & Bond, S. (1991). Some tests of specification for panel data: Monte carlo evidence and an application to employment equations. The Review of Economic Studies, 58, 277–297. [Google Scholar] [CrossRef]
- Ates, S. (2020). Membership of sustainability index in an emerging market: Implications for sustainability. Journal of Cleaner Production, 250, 119465. [Google Scholar] [CrossRef]
- Badía, G., Cortez, M. C., & Ferruz, L. (2020). Socially responsible investing worldwide: Do markets value corporate social responsibility? Corporate Social Responsibility and Environmental Management, 27(6), 2751–2764. [Google Scholar] [CrossRef]
- Bodhanwala, S., & Bodhanwala, R. (2018). Does corporate sustainability impact firm profitability? Evidence from India. Management Decision, 56, 1734–1747. [Google Scholar] [CrossRef]
- Brundtland, G. (1987). Report of the world commission on environment and development. Our common future. United Nations. General assembly document A/42/427. Available online: https://documents.un.org/doc/undoc/gen/n87/184/67/pdf/n8718467.pdf (accessed on 15 November 2024).
- Cerciello, M., Busato, F., & Taddeo, S. (2022). The effect of sustainable business practices on profitability. Accounting for strategic disclosure. Corporate Social Responsibility and Environmental Management, 30, 487–1023. [Google Scholar] [CrossRef]
- Chang, D. S., & Kuo, L. C. (2008). The effects of sustainable development on firms’ financial performance—An empirical approach. Sustainable Development, 16, 365–380. [Google Scholar] [CrossRef]
- Daly, H. E. (1990). Toward some operational principles of sustainable development. Ecological Economics, 2(1), 1–6. [Google Scholar] [CrossRef]
- Daugaard, D. (2020). Emerging new themes in environmental, social and governance investing: A systematic literature review. Accounting & Finance, 60(2), 1501–1530. [Google Scholar] [CrossRef]
- Drempetic, S., Klein, C., & Zwergel, B. (2020). The influence of firm size on the ESG score: Corporate sustainability ratings under review. Journal of Business Ethics, 167(2), 333–360. [Google Scholar] [CrossRef]
- Eccles, R. G., Ioannou, I., & Serafeim, G. (2014). The impact of corporate sustainability on organizational processes and performance. Available online: https://www.hbs.edu/ris/Publication%20Files/SSRN-id1964011_6791edac-7daa-4603-a220-4a0c6c7a3f7a.pdf (accessed on 24 March 2025).
- Elkington, J. (1997). Cannibals with forks: The triple bottom line of the 21st century. Capstone. New Society Publishers. [Google Scholar]
- ESG WORKSPACE. (2023). Dashboard. Available online: https://esgworkspace.b3.com.br/dashboard (accessed on 15 April 2024).
- Fernández-Guadaño, J., & Sarria-Pedroza, J. H. (2018). Impact of corporate social responsibility on value creation from a stakeholder perspective. Sustainability, 10(6), 2062. [Google Scholar] [CrossRef]
- Freeman, R. E. (1984). Strategic management: A stokcholder approach. Pitman. [Google Scholar]
- Freguete, L. M., Nossa, V., & Funchal, B. (2015). Corporate social responsibility and Brazilian firms’ financial performance. Revista de Administração Contemporânea (RAC), 19, 232–248. [Google Scholar] [CrossRef]
- Friede, G., Busch, T., & Bassen, A. (2015). ESG and financial performance: Aggregated Evidence from more than 2000 empirical studies. Journal of Sustainable Finance & Investment, 5(4), 210–233. [Google Scholar] [CrossRef]
- Friedman, M. (1962). Capitalism and freedom (Vol. 133). University of Chicago Press. [Google Scholar]
- Friedman, M. (1970). The social responsibility of business is to increase its profits. In L. B. Pincus (Ed.), Perspectives in business ethics. McGraw-Hill. [Google Scholar]
- GRI. (2025). Global reporting initiative. Available online: https://www.globalreporting.org/ (accessed on 2 June 2025).
- GSIA. (2021). Global sustainable investment alliance. Global sustainable investment review 2020. Available online: https://www.gsi-alliance.org/trends-report-2020/ (accessed on 15 February 2025).
- Hirigoyen, G., & Poulain-Rehm, T. (2015). Relationships between corporate social responsibility and financial performance: What is the causality? Journal of business & Management, 4(1), 18–43. Available online: https://hal.science/hal-01382072/ (accessed on 14 May 2025).
- Hossain, M. (2017). Value added statement: A part of social responsibility reporting. Journal of Finance and Accounting, 5(2), 74–79. [Google Scholar] [CrossRef]
- Hörisch, J., Schaltegger, S., & Freeman, R. E. (2020). Integrating stakeholder theory and sustainability accounting: A conceptual synthesis. Journal of Cleaner Production, 275, 124097. [Google Scholar] [CrossRef]
- ISE B3. (2022a). Índice de sustentabilidade empresarial (Corporate sustainability index). ESG Workspace. Available online: https://iseb3.com.br/esg-workspace (accessed on 4 April 2024).
- ISE B3. (2022b). Índice de sustentabilidade empresarial (Corporate sustainability index). Guidelines. Available online: https://iseb3-site.s3.amazonaws.com/ISE_B3_-_Diretrizes_2024.pdf (accessed on 4 April 2024).
- ISE B3. (2022c). Índice de sustentabilidade empresarial (Corporate sustainability index). Metodologia (Methodology). Available online: https://www.b3.com.br/data/files/DB/B2/66/3C/6B6AA71096B63AA7AC094EA8/ISE-Metodologia-pt-br%20vf.pdf (accessed on 4 April 2024).
- Lassala, C., Apetrei, A., & Sapena, J. (2017). Sustainability matter and financial performance of companies. Sustainability, 9(9), 1498. [Google Scholar] [CrossRef]
- Marcondes, A. W., & Bacarji, C. D. (2010). ISE—Sustentabilidade no mercado de capitais (Available in English: Sustainability in the capital market). Report Editora. BM&FBovespa. [Google Scholar]
- Margolis, J. D., & Walsh, J. P. (2003). Misery loves companies: Rethinking social initiatives by business. Administrative Science Quarterly, 48(2), 268–305. [Google Scholar] [CrossRef]
- Melo, M. M. (2021). DVA: Demonstração do valor adicionado (Statement of added value). Freitas Bastos. [Google Scholar]
- Oliveira, V. G. M., Nascimento, Í. C. S., de Oliveira, A. M., Costa Lima, J. E. N., & Melo, G. C. V. (2024). Demonstração do Valor Adicionado (DVA): Análise da distribuição de riquezas das maiores companhias brasileiras por valor de vendas líquidas. Anais do Congresso Brasileiro de Custos-ABC, 14(1), 62–82. Available online: https://liceu.emnuvens.com.br/LICEU_ON-LINE/article/view/1938 (accessed on 10 February 2025).
- OpenAI. (2025). ChatGPT (Version GPT-4) [AI language model]. Available online: https://openai.com (accessed on 23 February 2025).
- Pérez-Calderón, E., Milanés-Montero, P., & Ortega-Rossell, F. J. (2012). Environmental performance and firm value: Evidence from Dow Jones sustainability index Europe. International Journal of Environmental Research, 6(4), 1007–1014. [Google Scholar] [CrossRef]
- Prado, G. F., Piekarski, C. M., Luz, L. M., Souza, J. T., Salvador, R., & Francisco, A. C. (2019). Sustainable development and economic performance: Gaps and trends for future research. Sustainable Development, 28(1), 368–384. [Google Scholar] [CrossRef]
- PRI. (2017). Principles for responsible investment. A blueprint for responsible investment. Available online: https://www.unpri.org/about-us/a-blueprint-for-responsible-investment (accessed on 16 November 2024).
- PRI. (2021a). Principles for responsible investment. Annual report 2021. Available online: https://www.unpri.org/annual-report-2021 (accessed on 16 November 2024).
- PRI. (2021b). Principles for responsible investment. What are the principles of responsible investment? Available online: https://www.unpri.org/about-us/what-are-the-principles-for-responsible-investment (accessed on 10 October 2024).
- Reale, R., Magro, T. C., & Ribas, L. C. (2018). Measurement and analyses of biodiversity conservation actions of corporations listed in the Brazilian stock exchange’s corporate sustainability index. Journal of Cleaner Production, 170, 14–24. [Google Scholar] [CrossRef]
- Ruggerio, C. A. (2021). Sustainability and sustainable development: A review of principles and definitions. Science of the Total Environment, 786, 147481. [Google Scholar] [CrossRef]
- SASB. (2025). Sustainability accounting standards board. Available online: https://www.sasb.org/about (accessed on 2 June 2025).
- Siew, R. Y. (2015). A review of corporate sustainability reporting tools (SRTs). Journal of Environmental Management, 164, 180–195. [Google Scholar] [CrossRef] [PubMed]
- Sousa, T. S., & Faria, J. A. (2018). Demonstração do Valor Adicionado (DVA): Uma análise da geração e distribuição de riquezas das empresas listadas no índice de sustentabilidade empresarial (ISE)-B3. Revista de Gestão, Finanças e Contabilidade, 8(2), 137–154. [Google Scholar] [CrossRef]
- Staiger, D., & Stock, J. H. (1997). Instrumental variables regression with weak instruments. Econometria, 65, 557–586. [Google Scholar] [CrossRef]
- United Nations Global Compact. (2023). Global compact strategy 2021–2023. Available online: https://www.unglobalcompact.org/what-is-gc/mission/principles (accessed on 9 January 2025).
- Waas, T., Hugé, J., Verbruggen, A., & Wright, T. (2011). Sustainable development: A bird’s eye view. Sustainability, 3(10), 1637–1661. [Google Scholar] [CrossRef]
- Widyawati, L. (2019). A systematic literature review of socially responsible investment and environmental social governance metrics. Business Strategy and the Environment, 29(2), 619–637. [Google Scholar] [CrossRef]
- Wooldridge, J. M. (2010). Econometric analysis of cross section and panel data. MIT Press. [Google Scholar]
| Stakeholders | DAV Indicators |
|---|---|
| Workers | Personnel and Expenses |
| Government and society | Taxes, Fees and Contributions |
| Creditors | Remuneration of Third-party Capital |
| Shareholders/Owners | Remuneration of Equity Capital |
| Indicator | Source | How Data Was Obtained |
|---|---|---|
| Net revenue | Income Statement (IS) | Access the company’s website in the Investor Relations section. Then, navigate to the Results Center section and download the standardized financial statements file (TFC/SFS) for the period under study. In this document, refer to the Income Statement (IS). |
| Distributed added value (DAV), including Personnel and Expenses, Taxes, Fees and Contributions, Remuneration of Third-Party Capital, Remuneration of Equity Capital | Statement of Added Value (SAV) | Access the company’s website in the Investor Relations section. Then, navigate to the Results Center section and download the standardized financial statements file (TFC/SFS) for the period under study. In this document, refer to the Statement of Added Value (SAV). |
| Samples and Exclusions | Number of Companies in ISE-B3 | ||
|---|---|---|---|
| Portfolio 2022 (2021 Base Year) | Portfolio 2023 (2022 Base Year) | Portfolio 2024 (2023 Base Year) | |
| Initial sample | 48 | 66 | 78 |
| Exclusions: | 13 | 15 | 15 |
| Insurance financial sector | 8 | 9 | 9 |
| Special situation (judicial recovery) | 1 | - | - |
| No information from the SAV | 1 | 4 | 3 |
| Outliers | 2 | 2 | - |
| Questionable data | 1 | - | 3 |
| Final sample | 35 | 51 | 63 |
| Dependent Variable/Revenue | Coefficient ISE-B3 | p-Value (ISE-B3) | Lagged Coefficient (L1) | p-Value (L1) | R2 |
|---|---|---|---|---|---|
| DAV | −0.0006 | 0.896 | 0.9628 | 0.000 | 0.765 |
| Personal and Expenses | −0.0004 | 0.644 | 0.9986 | 0.000 | 0.898 |
| Taxes, Fees and Contributions | 0.0003 | 0.873 | 0.8295 | 0.000 | 0.855 |
| Third-party capital | −0.0027 | 0.126 | 1.3578 | 0.000 | 0.845 |
| Equity Capital | 0.0027 | 0.422 | 1.0226 | 0.004 | 0.433 |
| Variable per Revenue | Coefficient FE | Coefficient RE | FE-RE | Chi-Square | p-Value |
|---|---|---|---|---|---|
| DAV | 92.765459 | 69.875592 | 22.889868 | - | - |
| Personal and Expenses | −151.631736 | −93.213232 | −58.418504 | - | - |
| Taxes, Fees and Contributions | −112.165633 | −57.251380 | −54.914253 | - | - |
| Third-Party Capital | −96.152642 | −73.775773 | −22.376869 | - | - |
| Equity Capital | −102.175593 | −68.024906 | −34.150687 | - | - |
| Hausman test | - | - | - | 5.600978 | 0.347 |
| Variable per Revenue | Coefficient ISE-B3 | p-Value | R2 (Overall) | Significance? |
|---|---|---|---|---|
| DAV | −0.0007 | 0.7115 | −0.0024 | No |
| Personal and Expenses | −0.0009 | 0.0898 | 0.0306 | Marginal |
| Taxes, Fees and Contributions | 0.0003 | 0.7256 | 0.0107 | No |
| Third-party Capital | −0.0016 | 0.2571 | 0.0190 | No |
| Equity Capital | 0.0016 | 0.4276 | 0.0104 | No |
Disclaimer/Publisher’s Note: The statements, opinions and data contained in all publications are solely those of the individual author(s) and contributor(s) and not of MDPI and/or the editor(s). MDPI and/or the editor(s) disclaim responsibility for any injury to people or property resulting from any ideas, methods, instructions or products referred to in the content. |
© 2025 by the authors. Licensee MDPI, Basel, Switzerland. This article is an open access article distributed under the terms and conditions of the Creative Commons Attribution (CC BY) license (https://creativecommons.org/licenses/by/4.0/).
Share and Cite
Lozano, P.A.; Agostinho, F.; Clasen, A.P.; Almeida, C.M.V.B.; Giannetti, B.F. Corporate Sustainability and Wealth Distribution: Evidence from Brazil’s Corporate Sustainability Index. Adm. Sci. 2025, 15, 234. https://doi.org/10.3390/admsci15060234
Lozano PA, Agostinho F, Clasen AP, Almeida CMVB, Giannetti BF. Corporate Sustainability and Wealth Distribution: Evidence from Brazil’s Corporate Sustainability Index. Administrative Sciences. 2025; 15(6):234. https://doi.org/10.3390/admsci15060234
Chicago/Turabian StyleLozano, Paulo A., Feni Agostinho, Arno P. Clasen, Cecília M. V. B. Almeida, and Biagio F. Giannetti. 2025. "Corporate Sustainability and Wealth Distribution: Evidence from Brazil’s Corporate Sustainability Index" Administrative Sciences 15, no. 6: 234. https://doi.org/10.3390/admsci15060234
APA StyleLozano, P. A., Agostinho, F., Clasen, A. P., Almeida, C. M. V. B., & Giannetti, B. F. (2025). Corporate Sustainability and Wealth Distribution: Evidence from Brazil’s Corporate Sustainability Index. Administrative Sciences, 15(6), 234. https://doi.org/10.3390/admsci15060234