Effects of Organizational Culture and Pay Levels on Employee Retention: Focused on Generational Difference


Abstract
1. Introduction
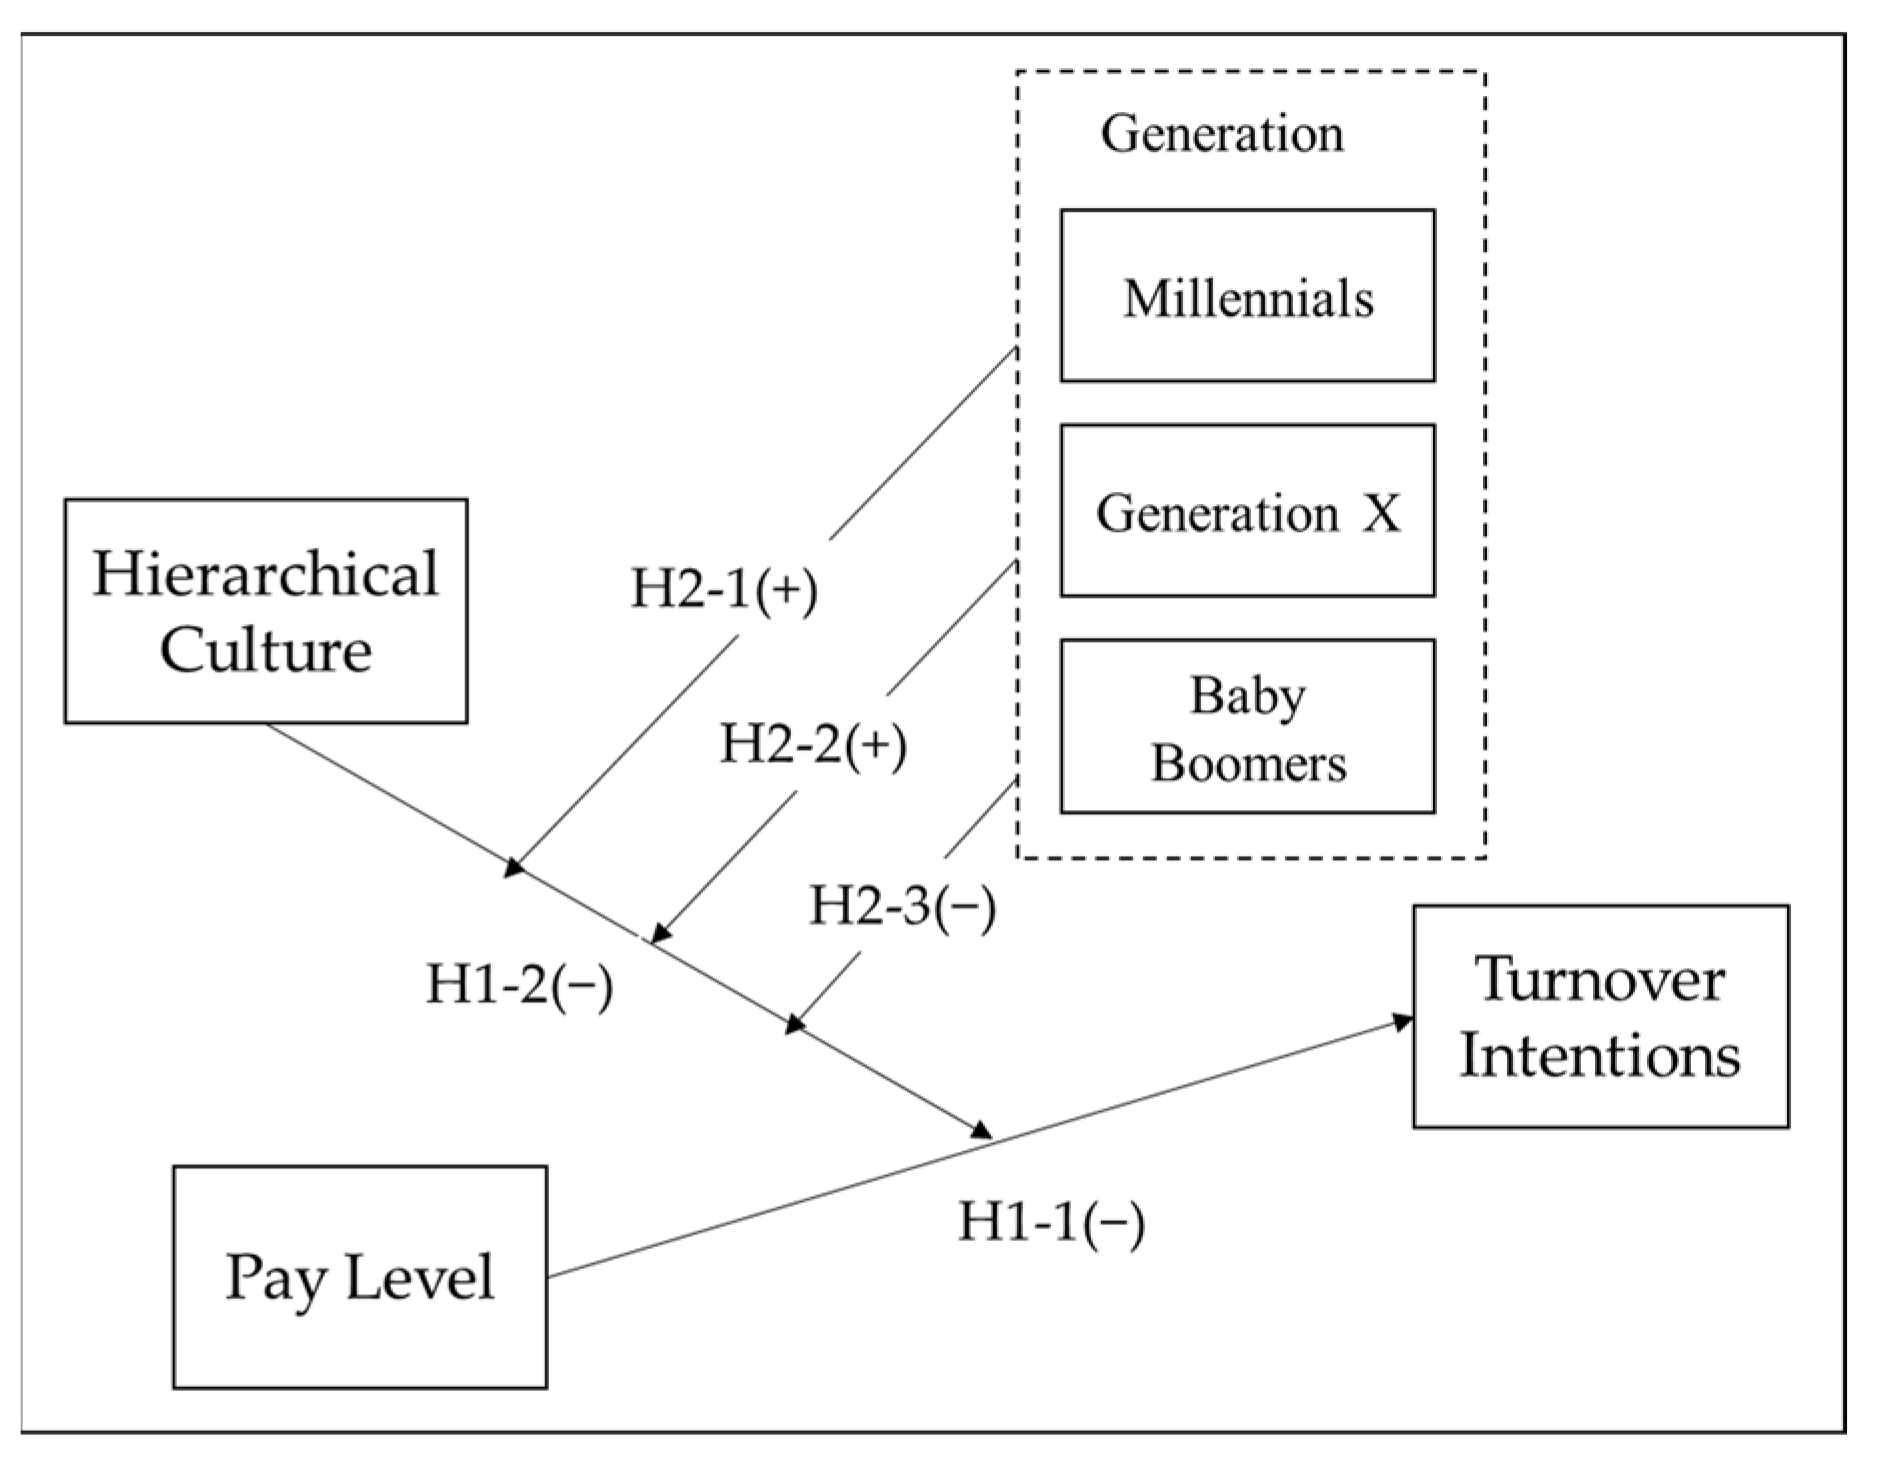
2. Theoretical Background and Hypotheses
2.1. Pay Level and Turnover Intention
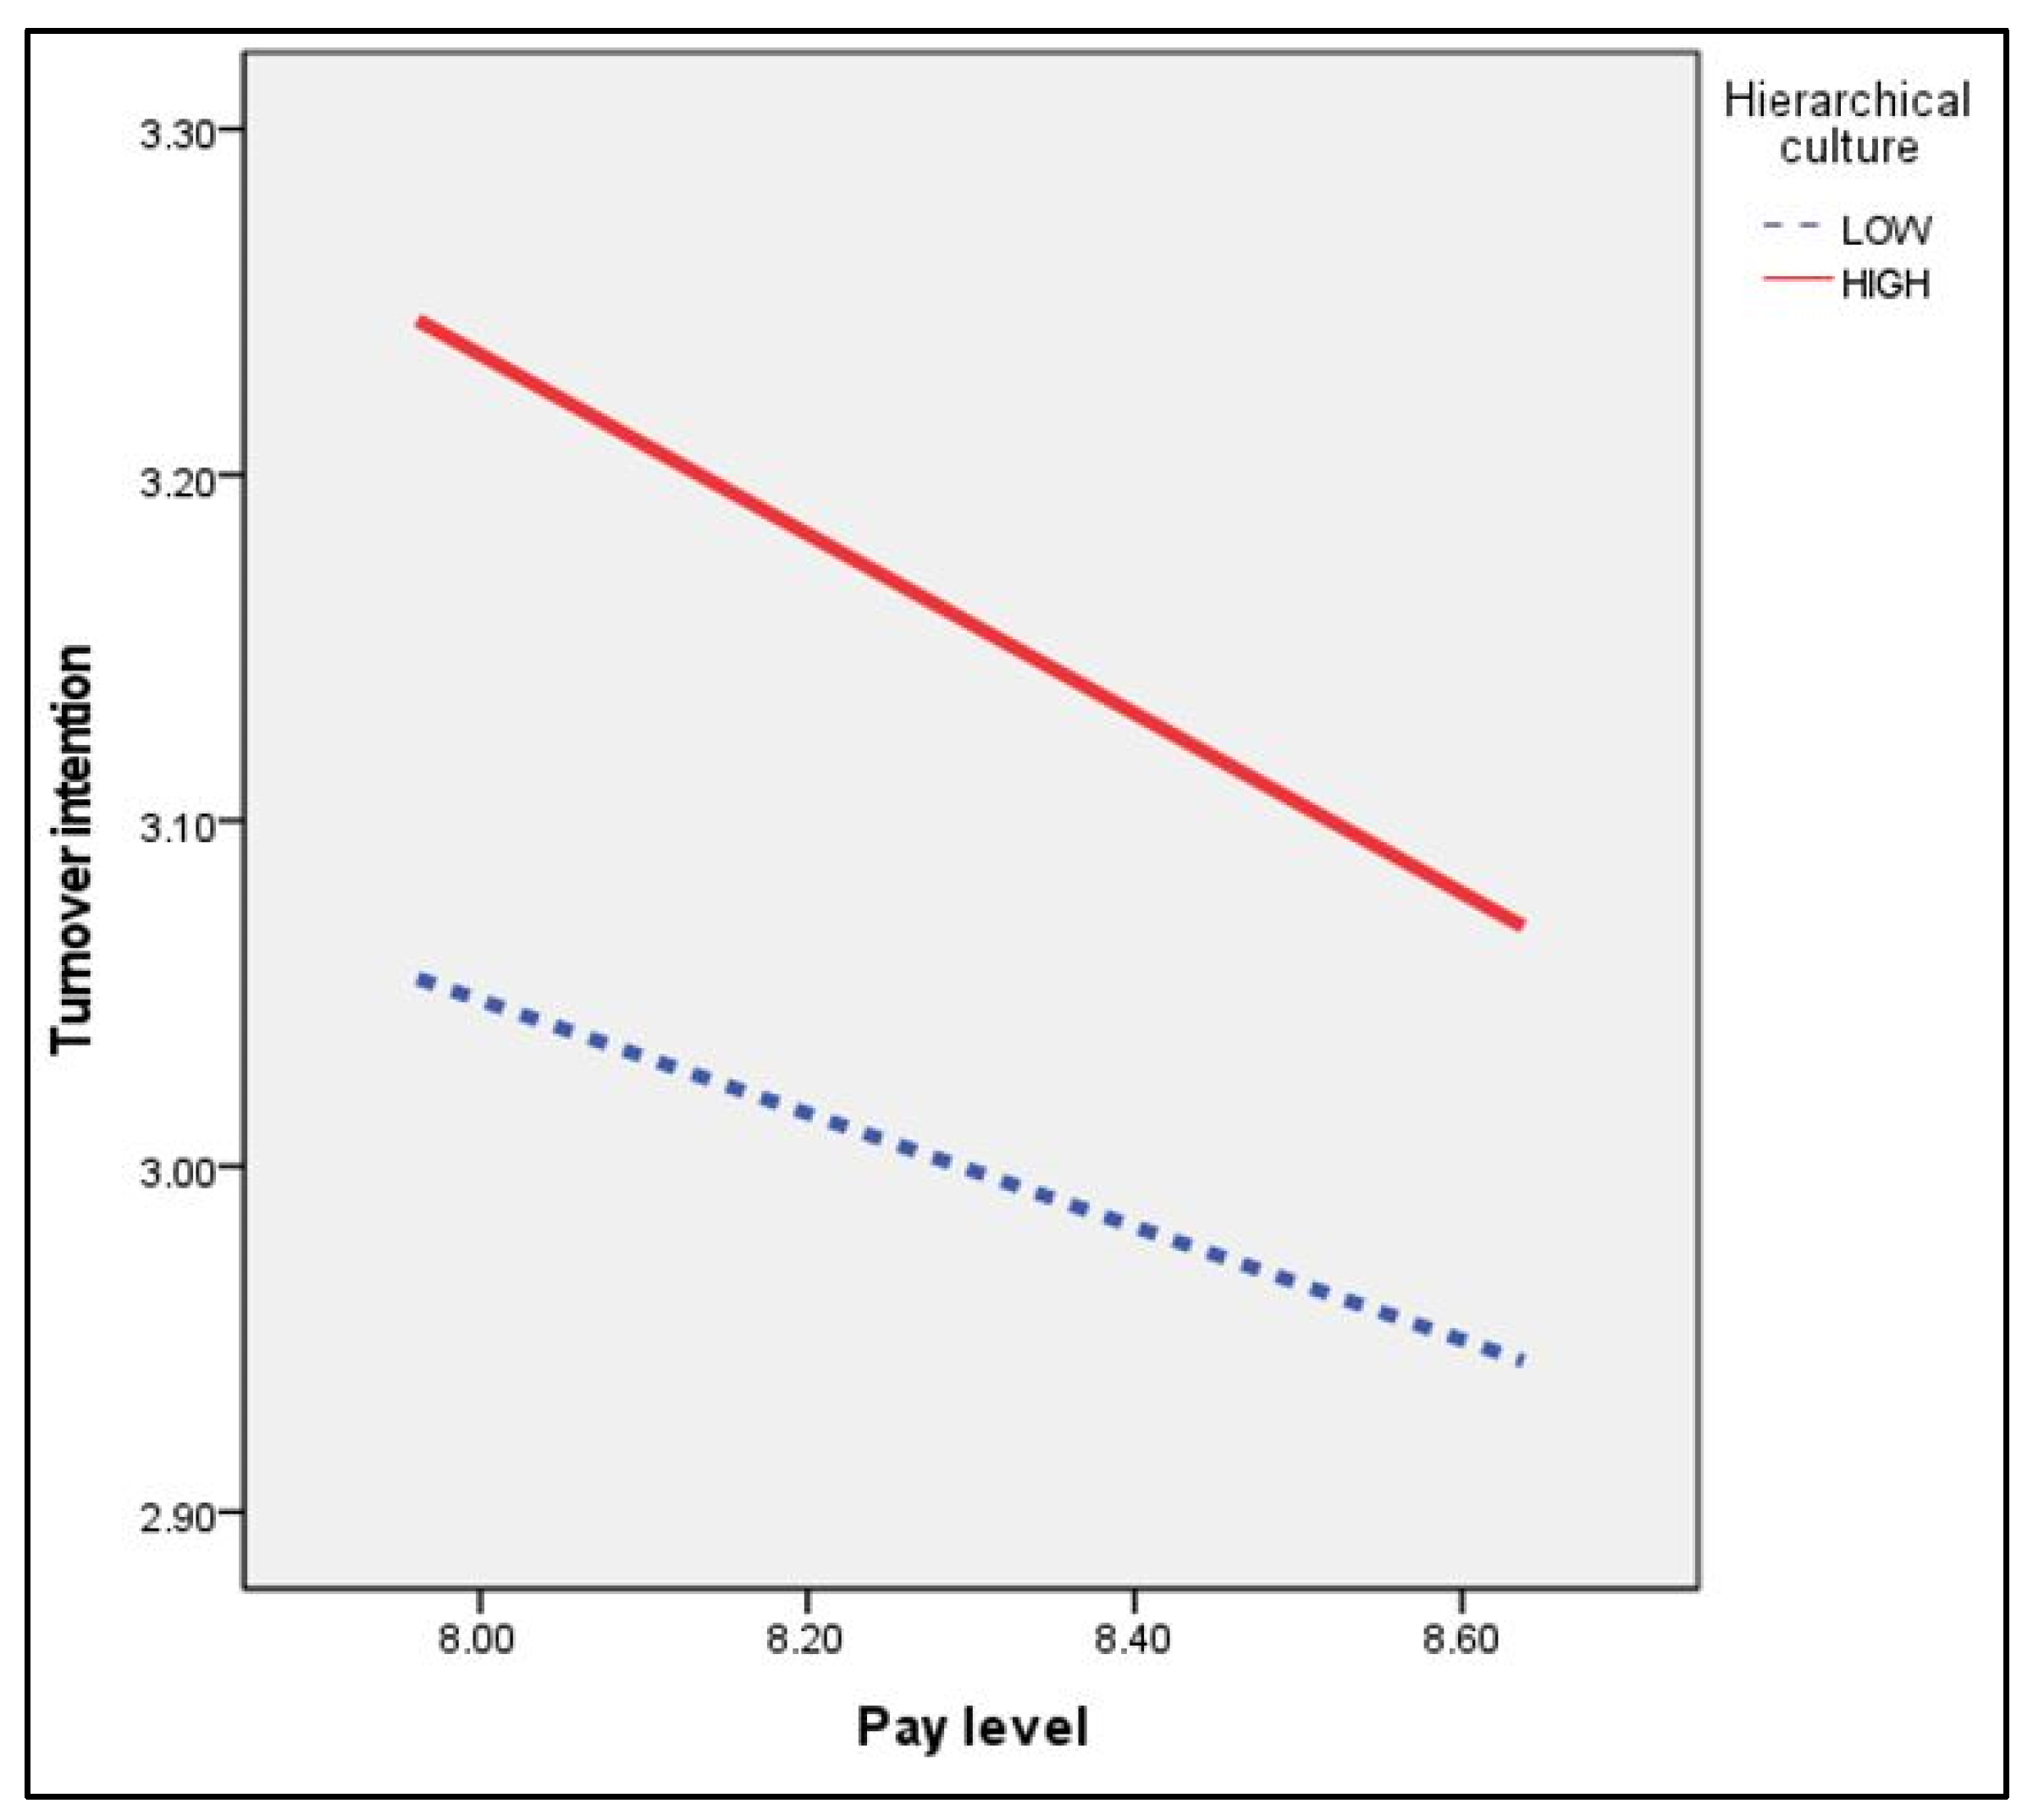
2.2. The Interaction Effect of Hierarchical Culture on the Relationship Between Pay Level and Turnover Intention
2.3. Generations in the Workplace
2.3.1. Millennials
2.3.2. Generation X
2.3.3. Baby Boomer Generation
3. Materials and Methods
3.1. Sample and Procedures
3.2. Measures
3.2.1. Turnover Intentions
3.2.2. Pay Level and Hierarchical Culture
3.2.3. Generations
3.2.4. Controls
3.3. Analytic Strategy
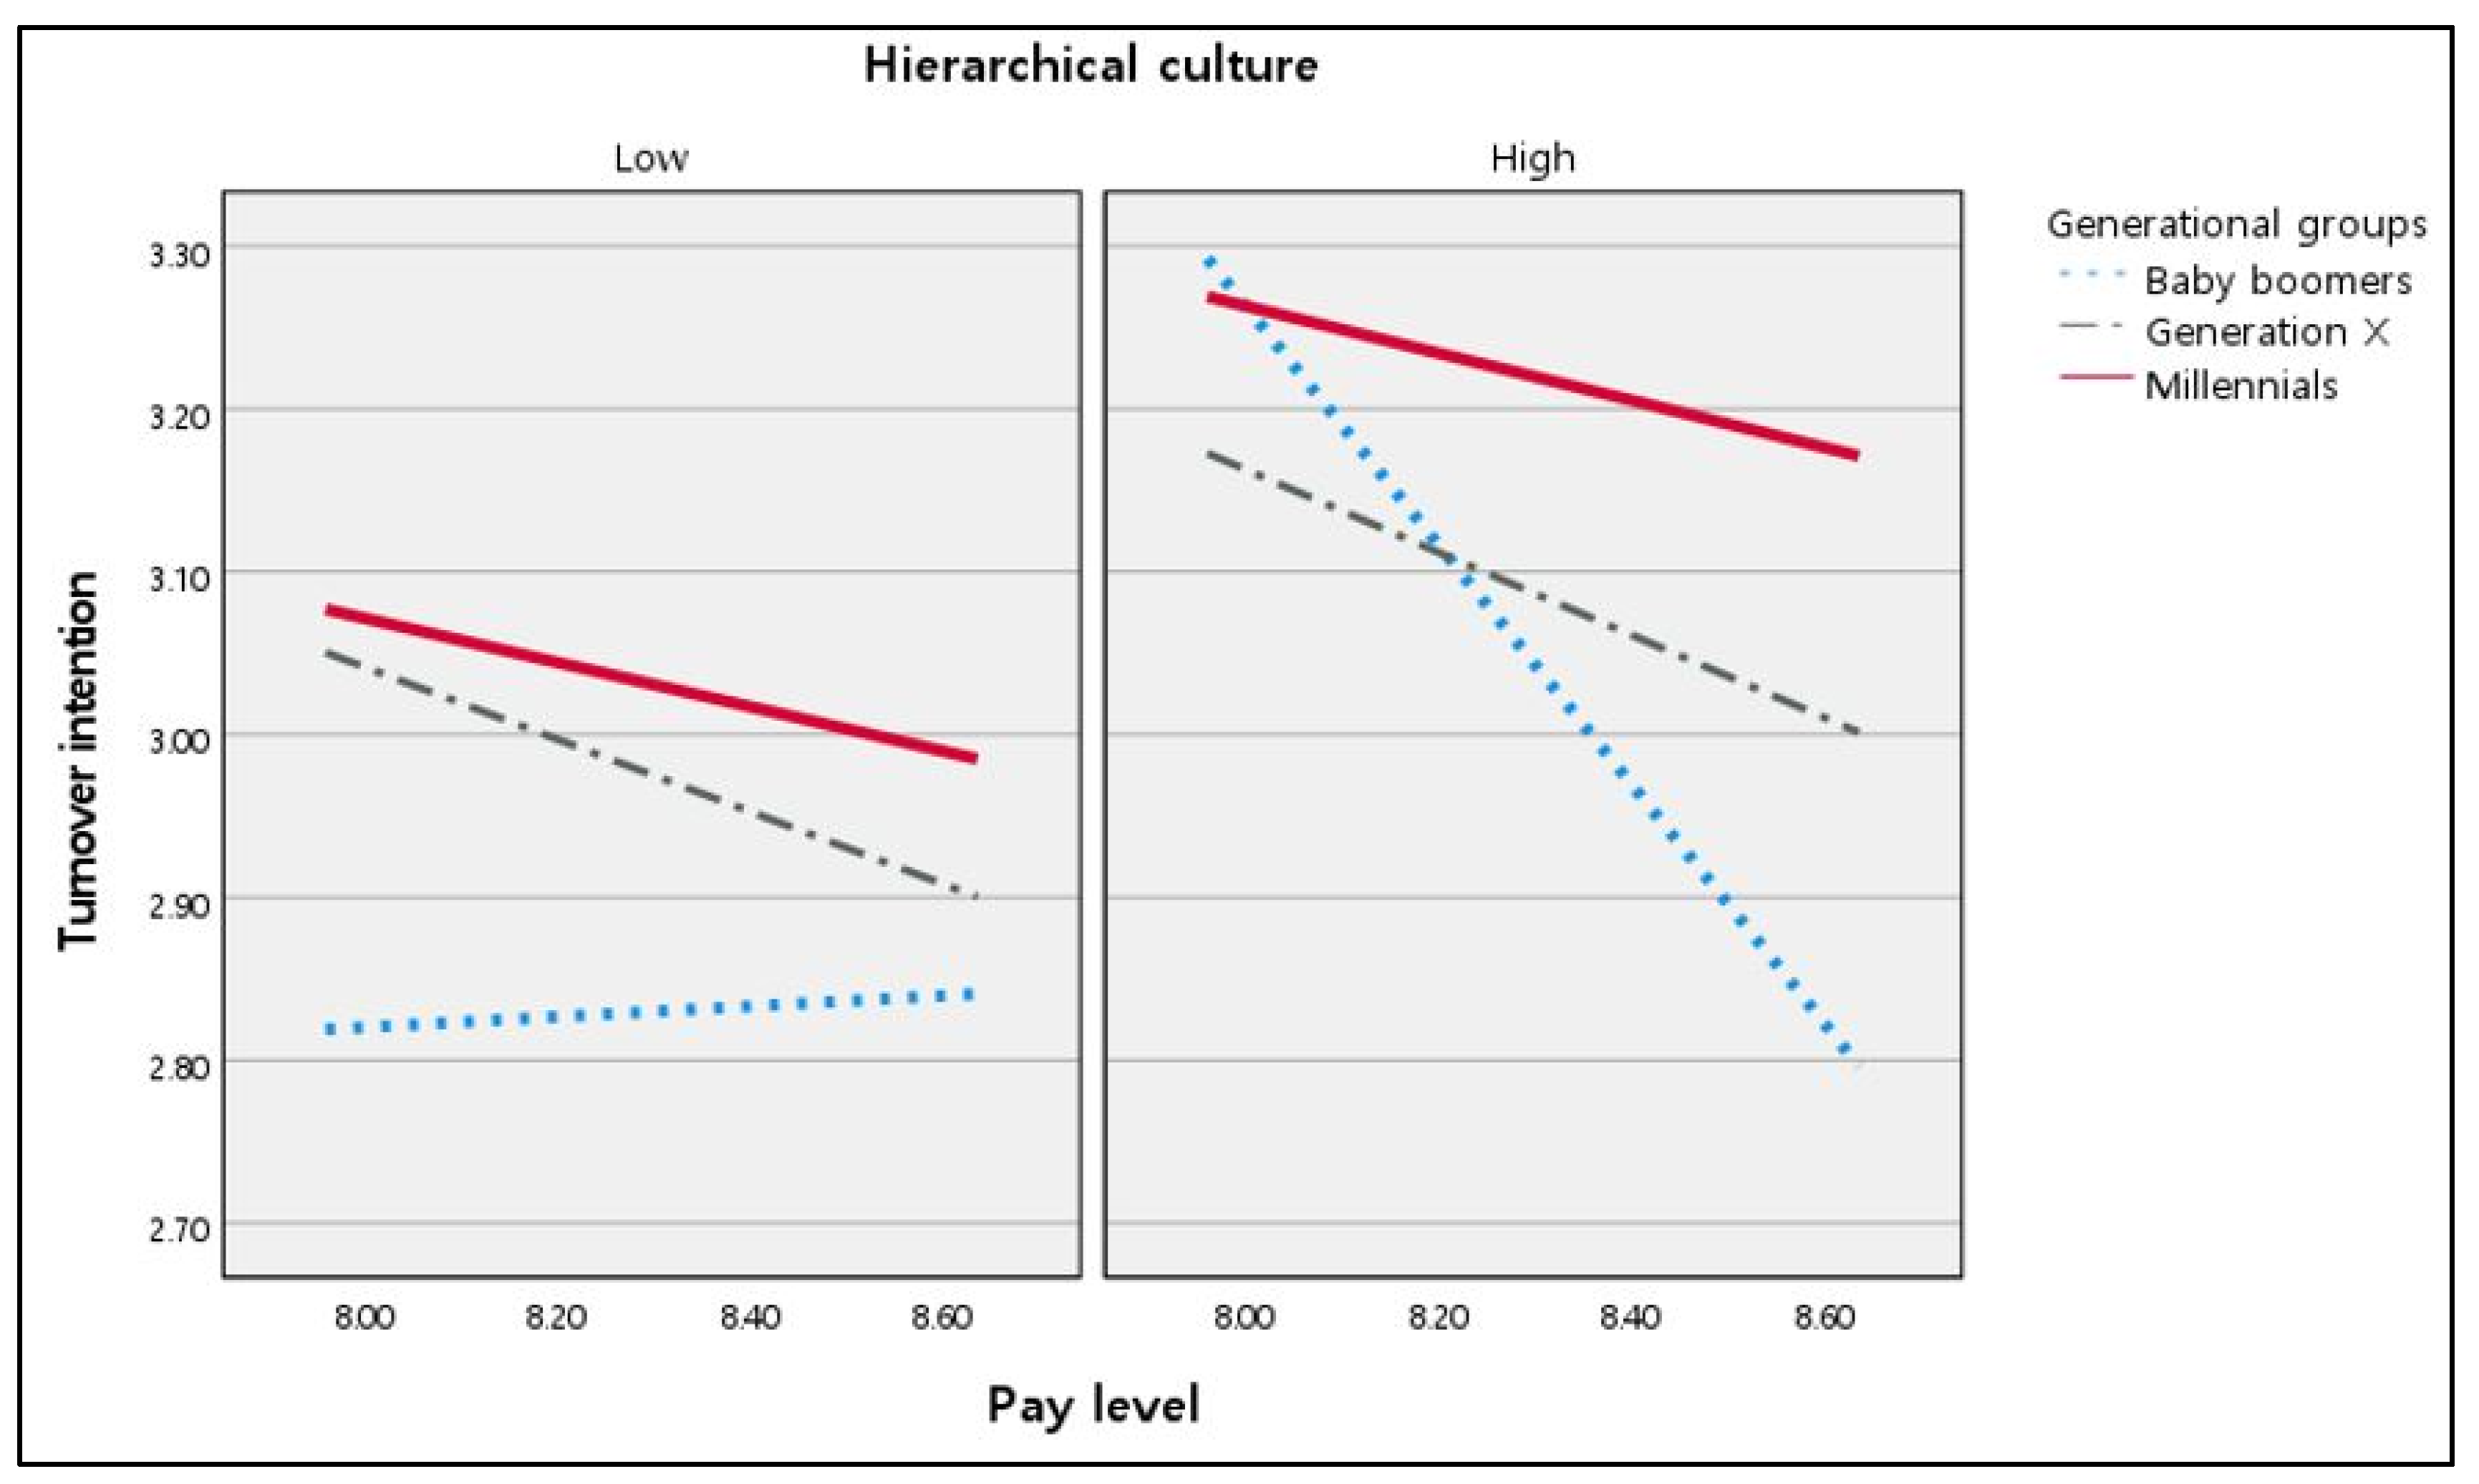
Three-Way Interaction Analysis
4. Results
4.1. Descriptive Statistics and Correlations
4.2. Confirmatory Factor Analysis
4.3. Hypothesis Testing
5. Discussion
5.1. Research Contributions
5.2. Practical Implications
5.3. Limitations and Future Research
Author Contributions
Funding
Data Availability Statement
Conflicts of Interest
| 1 | South Korea received an IMF loan in 1997 due to a foreign exchange liquidity crisis, which led to the rapid globalization of Korean society. During this time, Gen Xers in South Korea saw their parents, the Baby Boomers, who were loyal to the organization, get laid off from their jobs, which made Gen Xers realize that loyalty to an organization is not worth it. This is an important event to understand that Gen Xers in Korea are highly individualistic (S. Park & Park, 2018). |
References
- Angeline, T. (2011). Managing generational diversity at the workplace: Expectations and perceptions of different generations of employees. African Journal of Business Management, 5(2), 249. [Google Scholar]
- Benson, J., & Brown, M. (2011). Generations at work: Are there differences and do they matter? The International Journal of Human Resource Management, 22(9), 1843–1865. [Google Scholar] [CrossRef]
- Bentler, P. M. (1990). Comparative fit indexes in structural models. Psychological Bulletin, 107(2), 238–246. [Google Scholar] [CrossRef] [PubMed]
- Beutell, N. J. (2013). Generational differences in work-family conflict and synergy. International Journal of Environmental Research and Public Health, 10(6), 2544–2559. [Google Scholar] [CrossRef]
- Bonett, D. G., & Wright, T. A. (2015). Cronbach’s alpha reliability: Interval estimation, hypothesis testing, and sample size planning. Journal of Organizational Behavior, 36(1), 3–15. [Google Scholar] [CrossRef]
- Browne, M. W., & Cudeck, R. (1992). Alternative ways of assessing model fit. Sociological Methods & Research, 21(2), 230–258. [Google Scholar]
- Chapman, D. S., Reeves, P., & Chapin, M. (2018). A lexical approach to identifying dimensions of organizational culture. Frontiers in Psychology, 9, 876. [Google Scholar] [CrossRef]
- Cho, E., Kim, J., & Lee, Y. (2022). The impact of high performance work system on organizational effectiveness: Moderating effects of generation MZ. Korean Journal of Business Administration, 35(3), 403–429. [Google Scholar]
- Choi, Y. S., Seo, M., Scott, D., & Martin, J. (2010). Validation of the organizational culture assessment instrument: An application of the Korean version. Journal of Sport Management, 24(2), 169–189. [Google Scholar] [CrossRef]
- Dawson, J. F. (2014). Moderation in management research: What, why, when, and how. Journal of Business and Psychology, 29(1), 1–19. [Google Scholar] [CrossRef]
- Dawson, J. F., & Richter, A. W. (2006). Probing three-way interactions in moderated multiple regression: Development and application of a slope difference test. Journal of Applied Psychology, 91(4), 917–926. [Google Scholar] [PubMed]
- Dencker, J. C., Joshi, A., & Martocchio, J. J. (2008). Towards a theoretical framework linking generational memories to workplace attitudes and behaviors. Human Resource Management Review, 18(3), 180–187. [Google Scholar]
- Denison, D. R., & Spreitzer, G. M. (1991). Organizational culture and organizational development: A competing values approach. Research in Organizational Change and Development, 5(1), 1–21. [Google Scholar]
- Detert, J. R., Schroeder, R. G., & Mauriel, J. J. (2000). A framework for linking culture and improvement initiatives in organizations. Academy of Management Review, 25(4), 850–863. [Google Scholar]
- Fishman, A. A. (2016). How generational differences will impact america’s aging workforce: Strategies for dealing with aging millennials, generation X, and baby boomers. Strategic HR Review, 15(6), 250–257. [Google Scholar]
- Hair, J., Jr., Sarstedt, M., Hopkins, L., & Kuppelwieser, V. G. (2014). Partial least squares structural equation modeling (PLS-SEM) An emerging tool in business research. European Business Review, 26(2), 106–121. [Google Scholar] [CrossRef]
- Hartnell, C. A., Ou, A. Y., & Kinicki, A. (2011). Organizational culture and organizational effectiveness: A meta-analytic investigation of the competing values framework’s theoretical suppositions. Journal of Applied Psychology, 96(4), 677–694. [Google Scholar]
- Holzwarth, S., Gunnesch-Luca, G., Soucek, R., & Moser, K. (2020). How communication in organizations is related to foci of commitment and turnover intentions. Journal of Personnel Psychology, 20(1), 27–38. [Google Scholar]
- Hu, L., & Bentler, P. M. (1999). Cutoff criteria for fit indexes in covariance structure analysis: Conventional criteria versus new alternatives. Structural Equation Modeling: A Multidisciplinary Journal, 6(1), 1–55. [Google Scholar]
- Jolly, P. M., McDowell, C., Dawson, M., & Abbott, J. (2021). Pay and benefit satisfaction, perceived organizational support, and turnover intentions: The moderating role of job variety. International Journal of Hospitality Management, 95, 102921. [Google Scholar]
- Ju, H. J., & Jang, B. J. (2019). A comparative study on organizational culture among generations of government organizations: Focused on korea forest service. Korean Journal of Local Government & Administration Studies, 33(3), 225–245. [Google Scholar]
- Kim, H., & Lee, M. (2022). Employee perception of corporate social responsibility authenticity: A multilevel approach. Frontiers in Psychology, 13, 948363. [Google Scholar] [CrossRef] [PubMed]
- Kupperschmidt, B. R. (2000). Multigeneration employees: Strategies for effective management. The Health Care Manager, 19(1), 65–76. [Google Scholar] [PubMed]
- Lawler, E. E. (1981). Pay and organization development. Addison-Wiley. [Google Scholar]
- Lee, E., & Jang, I. (2020). Nurses’ fatigue, job stress, organizational culture, and turnover intention: A culture–work–health model. Western Journal of Nursing Research, 42(2), 108–116. [Google Scholar] [CrossRef]
- Li, R., & Yao, M. (2022). What promotes teachers’ turnover intention? Evidence from a meta-analysis. Educational Research Review, 37, 100477. [Google Scholar]
- Li, Y., Huang, H., & Chen, Y. (2020). Organizational climate, job satisfaction, and turnover in voluntary child welfare workers. Children and Youth Services Review, 119, 105640. [Google Scholar]
- Lyons, S., & Kuron, L. (2014). Generational differences in the workplace: A review of the evidence and directions for future research. Journal of Organizational Behavior, 35(S1), S139–S157. [Google Scholar]
- Magni, F., & Manzoni, B. (2020). Generational differences in workers’ expectations: Millennials want more of the same things. European Management Review, 17(4), 901–914. [Google Scholar]
- Mannheim, K. (1952). Essays on the sociology of knowledge. Routledge. [Google Scholar]
- March, J. G., & Simon, H. A. (1958). Organizations. Wiley. [Google Scholar]
- Martínez-Navalón, J. G., Gelashvili, V., & Saura, J. R. (2020). The impact of environmental social media publications on user satisfaction with and trust in tourism businesses. International Journal of Environmental Research and Public Health, 17(15), 5417. [Google Scholar] [CrossRef]
- Moreno, A., Navarro, C., & Fuentes-Lara, C. (2022). Factors affecting turnover intentions among millennial public relations professionals: The latin american case. Public Relations Inquiry, 11(2), 199–220. [Google Scholar] [CrossRef]
- Mueller, C. W., & Price, J. L. (1990). Economic, psychological, and sociological determinants of voluntary turnover. Journal of Behavioral Economics, 19(3), 321–335. [Google Scholar] [CrossRef]
- Murray, W. C., & Holmes, M. R. (2021). Impacts of employee empowerment and organizational commitment on workforce sustainability. Sustainability, 13(6), 3163. [Google Scholar] [CrossRef]
- Ng, E. S., Schweitzer, L., & Lyons, S. T. (2010). New generation, great expectations: A field study of the millennial generation. Journal of Business and Psychology, 25, 281–292. [Google Scholar] [CrossRef]
- Obeng, H. A., & Atan, T. (2024). Understanding turnover intentions: The interplay of organizational politics, employee resilience, and person-job fit in ghana’s healthcare sector. Sustainability, 16(22), 9980. [Google Scholar] [CrossRef]
- Park, J.-H. (2001). Theoretical and methodological issues in the study of generations. Korea Journal of Population Studies, 24(2), 47–78. [Google Scholar]
- Park, J. S., & Kim, T. (2009). Do types of organizational culture matter in nurse job satisfaction and turnover intention? Leadership in Health Services, 22(1), 20–38. [Google Scholar] [CrossRef]
- Park, S., & Park, S. (2018). Exploring the generation gap in the workplace in south korea. Human Resource Development International, 21(3), 276–283. [Google Scholar]
- Podsakoff, P. M., MacKenzie, S. B., Lee, J., & Podsakoff, N. P. (2003). Common method biases in behavioral research: A critical review of the literature and recommended remedies. Journal of Applied Psychology, 88(5), 879–903. [Google Scholar]
- Porter, L. W., & Steers, R. M. (1973). Organizational, work, and personal factors in employee turnover and absenteeism. Psychological Bulletin, 80(2), 151–176. [Google Scholar] [CrossRef]
- Price, J. L. (1989). The impact of turnover on the organization. Work and Occupations, 16(4), 461–473. [Google Scholar]
- Quinn, R. E. (2011). Diagnosing and changing organizational culture: Based on the competing values framework. Jossey-Bass. [Google Scholar]
- Reyes-Menendez, A., Saura, J. R., & Martinez-Navalon, J. G. (2019). The impact of e-WOM on hotels management reputation: Exploring tripadvisor review credibility with the ELM model. IEEE Access, 7, 68868–68877. [Google Scholar] [CrossRef]
- Schaie, K. W. (1965). A general model for the study of developmental problems. Psychological Bulletin, 64(2), 92–107. [Google Scholar] [CrossRef] [PubMed]
- Schein, E. H. (1990). Organizational culture. American Psychologist, 45(2), 109–119. [Google Scholar] [CrossRef]
- Smircich, L. (1983). Concepts of culture and organizational analysis. Administrative Science Quarterly, 28(3), 339–358. [Google Scholar] [CrossRef]
- Twenge, J. M. (2010). A review of the empirical evidence on generational differences in work attitudes. Journal of Business and Psychology, 25(1), 201–210. [Google Scholar] [CrossRef]
- Valenti, A. (2019). Leadership preferences of the millennial generation. Journal of Business Diversity, 19(1), 75–84. [Google Scholar]
- Vinarski-Peretz, H., Mashiach-Eizenberg, M., & Halperin, D. (2024). Workforce sustainability in our aging society: Exploring how the Burden–Burnout mechanism exacerbates the turnover intentions of employees who combine work and informal eldercare. Sustainability, 16(17), 7553. [Google Scholar] [CrossRef]
- Walden, J., Jung, E. H., & Westerman, C. Y. (2017). Employee communication, job engagement, and organizational commitment: A study of members of the millennial generation. Journal of Public Relations Research, 29(2–3), 73–89. [Google Scholar]
- Wey Smola, K., & Sutton, C. D. (2002). Generational differences: Revisiting generational work values for the new millennium. Journal of Organizational Behavior: The International Journal of Industrial, Occupational and Organizational Psychology and Behavior, 23(4), 363–382. [Google Scholar] [CrossRef]
- Xiong, G., Wang, X. T., & Li, A. (2018). Leave or stay as a risky choice: Effects of salary reference points and anchors on turnover intention. Frontiers in Psychology, 9, 686. [Google Scholar]
- Yang, Y., & Konrad, A. M. (2011). Understanding diversity management practices: Implications of institutional theory and resource-based theory. Group & Organization Management, 36(1), 6–38. [Google Scholar]
- Yoon, J., & Jung, H. (2023). Structural relationship between clan culture, awareness of the importance of human resources, and organizational commitment: Conditional direct and indirect effects moderated by the MZ generation. The Korean Journal of Human Resource Development Quarterly, 25(1), 225–256. [Google Scholar]

| N = 9053 | Frequency | Percent (%) | N = 9053 | Frequency | Percent (%) | ||
|---|---|---|---|---|---|---|---|
| Industry | Manufacturing | 7256 | 80.20 | Job level | Staff | 2355 | 26.00 |
| Finance | 501 | 5.50 | Administrative manager | 1166 | 12.90 | ||
| Non-financial sector | 1296 | 14.30 | Assistant manager | 1971 | 21.80 | ||
| Firm size * | Fewer than 300 | 5215 | 57.60 | Manager | 1551 | 17.10 | |
| 300–999 | 2910 | 32.10 | Deputy general manager | 1083 | 12.00 | ||
| More than 1000 | 928 | 10.30 | Department manager | 655 | 7.20 | ||
| Gender | Female | 2531 | 28.00 | Executive manager | 91 | 1.00 | |
| Male | 6521 | 72.00 | |||||
| Marital status | Not married | 3954 | 43.70 | Production manager | 181 | 2.00 | |
| Married | 5097 | 56.30 | |||||
| Employment | Temporary employment | 121 | 1.30 | Education | Graduate from junior high school | 41 | 0.50 |
| Permanent employment | 8932 | 98.70 | Graduate from high school | 430 | 4.70 | ||
| Unionization | Nonunion | 8059 | 89.00 | Graduate from vocational high school | 1061 | 11.70 | |
| Joined a union | 994 | 11.00 | Graduate from junior college | 1622 | 17.90 | ||
| Generations | Baby boomers | 117 | 1.30 | Bachelor’s degree | 5404 | 59.70 | |
| Generation X | 3112 | 34.40 | Master’s degrees | 452 | 5.00 | ||
| Millennials | 5818 | 64.30 | Doctorate degrees | 42 | 0.50 | ||
| N = 9047 | Baby Boomers | Generation X | Millennials | ||||
|---|---|---|---|---|---|---|---|
| Frequency | Percent (%) | Frequency | Percent (%) | Frequency | Percent (%) | ||
| Firm size | Fewer than 300 | 96 | 82.10% | 1837 | 59.00% | 3279 | 56.40% |
| 300–999 | 15 | 12.80% | 991 | 31.80% | 1901 | 32.70% | |
| More than 1000 | 6 | 5.10% | 284 | 9.10% | 638 | 11.00% | |
| Industry | Manufacturing | 111 | 94.90% | 2512 | 80.70% | 4630 | 79.60% |
| Finance | 0 | 0.00% | 142 | 4.60% | 356 | 6.10% | |
| Non-financial sector | 6 | 5.10% | 458 | 14.70% | 832 | 14.30% | |
| Length of service | Mean | 5.064 | - | 5.071 | - | 4.104 | - |
| Gender | Female | 21 | 17.90% | 513 | 16.50% | 1995 | 34.30% |
| Male | 96 | 82.10% | 2599 | 83.50% | 3823 | 65.70% | |
| Marital status | Not married | 3 | 2.60% | 382 | 12.30% | 3569 | 61.40% |
| Married | 114 | 97.40% | 2730 | 87.70% | 2248 | 38.60% | |
| Employment | Temporary employment | 5 | 4.30% | 7 | 0.20% | 109 | 1.90% |
| Permanent employment | 112 | 95.70% | 3105 | 99.80% | 5709 | 98.10% | |
| Unionization | Nonunion | 98 | 83.80% | 2734 | 87.90% | 5223 | 89.80% |
| Joined a union | 19 | 16.20% | 378 | 12.10% | 595 | 10.20% | |
| Job level | Staff | 46 | 39.30% | 339 | 10.90% | 1969 | 33.80% |
| Administrative manager | 5 | 4.30% | 163 | 5.20% | 997 | 17.10% | |
| Assistant manager | 4 | 3.40% | 233 | 7.50% | 1732 | 29.80% | |
| Manager | 7 | 6.00% | 645 | 20.70% | 898 | 15.40% | |
| Deputy general manager | 8 | 6.80% | 895 | 28.80% | 179 | 3.10% | |
| Department manager | 13 | 11.10% | 628 | 20.20% | 14 | 0.20% | |
| Executive manager | 17 | 14.50% | 73 | 2.30% | 1 | 0.00% | |
| Production manager | 17 | 14.50% | 136 | 4.40% | 28 | 0.50% | |
| Pay level | Mean | 8.288 | - | 8.489 | - | 8.169 | - |
| Turnover intention | Mean | 2.71 | - | 2.87 | - | 3.26 | - |
| Sum | - | 117 | 1.30% | 3112 | 34.40% | 5818 | 64.30% |
| M | SD | 1 | 2 | 3 | 4 | 5 | 6 | 7 | 8 | 9 | 10 | 11 | 12 | 13 | 14 | ||
|---|---|---|---|---|---|---|---|---|---|---|---|---|---|---|---|---|---|
| 1 | Manufacturing | 0.80 | 0.40 | ||||||||||||||
| 2 | Firm size 1 | 1.53 | 0.67 | −0.19 ** | |||||||||||||
| 3 | Length of service 2 | 4.45 | 0.85 | 0.02 | 0.12 ** | ||||||||||||
| 4 | Gender 3 | 0.72 | 0.45 | 0.11 ** | 0.01 | 0.14 ** | |||||||||||
| 5 | Marital status 4 | 0.56 | 0.50 | 0.04 ** | 0.01 | 0.50 ** | 0.18 ** | ||||||||||
| 6 | Graduate from high school | 0.16 | 0.37 | 0.11 ** | −0.12 ** | 0.09 ** | −0.08 ** | 0.04 ** | |||||||||
| 7 | Bachelor’s degree | 0.60 | 0.49 | −0.058 ** | 0.13 ** | −0.11 ** | 0.14 ** | −0.06 ** | −0.54 ** | ||||||||
| 8 | Employment 5 | 0.99 | 0.11 | 0.06 ** | −0.03 ** | 0.13 ** | 0.10 ** | 0.06 ** | 0.00 | 0.04 ** | |||||||
| 9 | Unionization 6 | 0.11 | 0.31 | −0.14 ** | 0.16 ** | 0.12 ** | 0.02 * | 0.04 ** | 0.11 ** | −0.08 ** | 0.04 ** | ||||||
| 10 | Turnover intention | 3.12 | 0.85 | 0.00 | −0.06 ** | −0.23 ** | −0.14 ** | −0.18 ** | −0.03 ** | 0.04 ** | −0.03 ** | −0.06 ** | |||||
| 11 | Baby boomers | 0.01 | 0.11 | 0.04 ** | −0.05 ** | 0.08 ** | 0.03 * | 0.10 ** | 0.12 ** | −0.11 ** | −0.03 ** | 0.02 | −0.06 ** | ||||
| 12 | Generation X | 0.34 | 0.48 | 0.01 | −0.03 ** | 0.53 ** | 0.19 ** | 0.46 ** | 0.16 ** | −0.17 ** | 0.07 ** | 0.03 ** | −0.21 ** | −0.08 ** | |||
| 13 | Millennials | 0.64 | 0.48 | −0.02 | 0.04 ** | −0.54 ** | −0.19 ** | −0.48 ** | −0.19 ** | 0.19 ** | −0.06 ** | −0.03 ** | 0.22 ** | −0.15 ** | −0.97 ** | ||
| 14 | Pay level | 8.30 | 0.34 | −0.06 ** | 0.09 ** | 0.47 ** | 0.20 ** | 0.36 ** | −0.18 ** | 0.13 ** | 0.06 ** | −0.10 ** | −0.26 ** | 0 | 0.46 ** | −0.46 ** | |
| 15 | Hierarchical culture | 3.49 | 0.66 | −0.04 ** | 0.13 ** | 0.04 ** | 0.03 * | 0.04 ** | −0.10 ** | 0.08 ** | −0.02 | 0.03 * | −0.09 ** | 0 | 0 | 0 | 0.07 ** |
| Turnover Intention | Model 1 | Model 2 | Model 3 | Model 4 | Model 5 |
|---|---|---|---|---|---|
| β | β | β | β | β | |
| Constant | 3.727 *** | 7.209 *** | 5.061 *** | 7.037 *** | −8.982 |
| Manufacturing | 0.147 *** | 0.031 | 0.030 | 0.035 | 0.033 |
| Non-financial sector | 0.216 *** | 0.097 * | 0.094 * | 0.104 * | 0.101 * |
| Firm size: fewer than 300 | 0.116 *** | 0.034 | 0.033 | 0.040 | 0.040 |
| Firm size: 300–999 | 0.089 ** | 0.020 | 0.019 | 0.022 | 0.022 |
| Log (length of service) | −0.263 *** | −0.236 *** | −0.236 *** | −0.214 *** | −0.216 *** |
| Staff | 0.427 *** | 0.065 | 0.064 | 0.010 | −0.009 |
| Administrative manager | 0.360 *** | 0.033 | 0.029 | −0.029 | −0.056 |
| Assistant manager | 0.386 *** | 0.108 | 0.103 | 0.037 | 0.004 |
| Manager | 0.340 *** | 0.093 | 0.088 | 0.038 | 0.001 |
| Deputy general manager | 0.159 + | 0.045 | 0.042 | 0.023 | 0.000 |
| Production manager | 0.024 | −0.159 | −0.165 + | −0.193 + | −0.217 * |
| Gender 1 | −0.125 *** | −0.093 *** | −0.092 *** | −0.085 *** | −0.083 *** |
| Marital status 2 | −0.048 * | −0.064 ** | −0.063 ** | −0.049 * | −0.054 ** |
| Graduate from high school | 0.170 | 0.184 | 0.188 | 0.118 | 0.174 |
| Graduate from junior college | 0.200 | 0.225 + | 0.229 + | 0.143 | 0.203 |
| Bachelor’s degree | 0.225 | 0.242 + | 0.244 + | 0.152 | 0.210 |
| Master’s degree | 0.071 | 0.167 | 0.172 | 0.082 | 0.141 |
| Employment 3 | −0.026 | −0.062 | −0.062 | −0.071 | −0.065 |
| Unionization 4 | −0.058 + | −0.108 *** | −0.108 *** | −0.107 *** | −0.113 *** |
| Innovative culture | −0.267 *** | −0.267 *** | −0.267 *** | −0.266 *** | |
| Clan culture | −0.246 *** | −0.247 *** | −0.248 *** | −0.249 *** | |
| Market culture | −0.041 * | −0.042 * | −0.040 * | −0.039 * | |
| Pay level (X) | −0.216 *** | 0.045 | −0.213 *** | 1.70 + | |
| ) | 0.114 | 15.752 + | |||
| ) | 0.205 ** | 15.333 + | |||
| Hierarchical culture (Z) | 0.123 *** | 0.729 * | 0.123 *** | 5.031 + | |
| −1.853 + | |||||
| −1.817 + | |||||
| −0.073 + | −0.586 * | ||||
| −4.746 * | |||||
| −4.830 * | |||||
| 0.562 * | |||||
| 0.580 * | |||||
| F | 47.97 *** | 132.14 *** | 127.13 *** | 122.85 *** | 97.350 *** |
| 0.113 | 0.305 | 0.308 | 0.309 | 0.310 |
Disclaimer/Publisher’s Note: The statements, opinions and data contained in all publications are solely those of the individual author(s) and contributor(s) and not of MDPI and/or the editor(s). MDPI and/or the editor(s) disclaim responsibility for any injury to people or property resulting from any ideas, methods, instructions or products referred to in the content. |
© 2025 by the authors. Licensee MDPI, Basel, Switzerland. This article is an open access article distributed under the terms and conditions of the Creative Commons Attribution (CC BY) license (https://creativecommons.org/licenses/by/4.0/).
Share and Cite
Lee, M.; Oh, K.; Kim, H. Effects of Organizational Culture and Pay Levels on Employee Retention: Focused on Generational Difference. Adm. Sci. 2025, 15, 125. https://doi.org/10.3390/admsci15040125
Lee M, Oh K, Kim H. Effects of Organizational Culture and Pay Levels on Employee Retention: Focused on Generational Difference. Administrative Sciences. 2025; 15(4):125. https://doi.org/10.3390/admsci15040125
Chicago/Turabian StyleLee, Myeongju, Kyetaik Oh, and Hyunok Kim. 2025. "Effects of Organizational Culture and Pay Levels on Employee Retention: Focused on Generational Difference" Administrative Sciences 15, no. 4: 125. https://doi.org/10.3390/admsci15040125
APA StyleLee, M., Oh, K., & Kim, H. (2025). Effects of Organizational Culture and Pay Levels on Employee Retention: Focused on Generational Difference. Administrative Sciences, 15(4), 125. https://doi.org/10.3390/admsci15040125