Article

What Is the Value of Wild Bee Pollination for Wild Blueberries and Cranberries, and Who Values It?

by
Aaron K. Hoshide
1,*,
Francis A. Drummond
2,3,
Thomas H. Stevens
4,
Eric M. Venturini
5,
Samuel P. Hanes
6,
Martha M. Sylvia
7,
Cynthia S. Loftin
8,
David E. Yarborough
3,9 and
Anne L. Averill
10
1
School of Economics, University of Maine, 206 Winslow Hall, Orono, ME 04469, USA
2
School of Biology & Ecology University of Maine, Orono, ME 04469, USA
3
University of Maine Cooperative Extension, University of Maine, 5722 Deering Hall, Orono, ME 04469, USA
4
Department of Resource Economics, University of Massachusetts, 224 Stockbridge Hall, Amherst, MA 01003, USA
5
The Xerces Society for Invertebrate Conservation, 1423 Broadway, Bangor, ME 04401, USA
6
Department of Anthropology, University of Maine, 5773 South Stevens Hall, Orono, ME 04469, USA
7
UMass Cranberry Station, 1 State Bog Road, P.O. Box 569, East Wareham, MA 02538, USA
8
U.S. Geological Survey, Maine Cooperative Fish & Wildlife Research Unit, 5755 Nutting Hall, Orono, ME 04469, USA
9
School of Food & Agriculture, University of Maine, Deering Hall, Orono, ME 04469, USA
10
Department of Environmental Conservation, University of Massachusetts, Holdsworth Hall, Amherst, MA 01003, USA
*
Author to whom correspondence should be addressed.
Environments 2018, 5(9), 98; https://doi.org/10.3390/environments5090098
Submission received: 30 June 2018 / Revised: 24 August 2018 / Accepted: 28 August 2018 / Published: 31 August 2018
(This article belongs to the Special Issue Agricultural Ecosystem Services)

Abstract

:
Pollinator conservation efforts and growing interest in wild bee pollination have increased markedly in the last decade, making it increasingly important to have clear and practical estimates of the value of pollinators to agriculture. We used agricultural statistics, socio-economic producer surveys, and agronomic field research data to estimate traditional pollination value metrics and create novel approaches to the valuation of the ecosystem services provided by wild pollinators. Using two regionally important United States (USA) crops—Maine wild blueberry and Massachusetts cranberry—as models, we present the perceived values of wild bee pollinators from the perspectives of both consumers and producers. The net income attributable to wild bees was similar for wild blueberry ($613/ha) and cranberry ($689/ha). Marginal profit from incrementally adding more hives per ha was greater from stocking a third/fourth hive for cranberry ($6206/ha) than stocking a ninth/10th hive for wild blueberry ($556/ha), given the greater initial responsiveness of yield, revenue, and profit using rented honey bee hives in cranberry compared with wild blueberry. Both crops’ producers were willing to annually invest only $140–188/ha in wild pollination enhancements on their farms, justifying government financial support. Consumers are willing to pay ≈6.7 times more to support wild bees than producers, which indicates a potential source for market-based subsidies for invertebrate conservation.

1. Introduction

Recent declines in both managed and wild pollinator populations [1] highlight the importance of pollination for maintaining the stability of agroecosystems [2,3,4]. Honey bees, the predominant managed pollinator used in the United States of America (USA), have declined by 62% over the past 60 years owing to agricultural intensification [5] as well as the establishment of Varroa mites since the mid-1980s [6], and colony collapse disorder since 2006 characterized by worker bee disappearance [7,8,9]. Wild, non-honey bees are arguably more important to crop pollination [10], and may also be in decline. One study modeled bee abundance across the USA and suggested that the abundance of wild non-honey bees declined by 23% from 2008 to 2013 [11]. Seven species of bumble bees have significantly decreased over 35 years in Ontario, Canada [12], while Europe has lost at least four species of bumble bees over the past 60 years [13]. Greater monitoring efforts [14] and increases in pollinator habitat [15] may help to stem the decline of some of these species. An ecosystem service valuation of wild (i.e., typically “native” non-honey bee) pollinators in agricultural systems is paramount to producers’ pollination strategy decisions and pollinator conservation efforts. Grower adoption of alternative pollination strategies may be hindered by real or perceived low valuations of wild bee contributions to crop pollination.
The ecosystem service value of pollination by wild (versus managed) pollinators can be estimated by quantifying (1) their contribution to the value of the crops they pollinate, or (2) their value to consumers. Winfree et al. (2011) [16] developed a framework valuing the role of wild bees in crop pollination where pollination value could be estimated using production value, replacement cost, or attributable net income (Table 1). Production value, where a pollinator-dependent percentage of total crop value is lost owing to a lack of pollination, assumes catastrophic crop loss from the collapse of all of the pollinators. Although globally wild bees (bees that are not managed bees) may contribute more to crop pollination than honey bees [10], in larger fields, honey bees play larger roles [17]. In the most intensively managed systems, which are often typified by larger fields, wild bee populations are less likely to meet the demand for pollination, so managed bees (e.g., rented honey bee, Apis mellifera hives) supplement wild bee pollination services to close yield gaps [18,19,20]. Thus, the market values of these crops exceed the ecosystem service value contributed by wild pollinators. The replacement cost assumes that agricultural producers are able to invest in wild pollinator replacements, such as renting or owning managed honey bee hives or bumble bee colonies to substitute for wild bees. The replacement cost approach may underestimate the value of wild pollination if the pollination alternative (e.g., managed honey bees) is not an adequate substitute for wild bees [10]. Further, data sources for the cost of such replacements such as historical honey bee rental fee data are robust in the western USA [21], but only limited surveys are available for the eastern USA [22].
Wild bees (non-honey bees) in western Kenya are estimated to contribute $3.2 million (only wild bees) to the $8.5 million (wild and managed honey bees) total production value of eight crops [23]. The crop pollination services contributed by forest ecosystems around Costa Rican coffee plantations can increase crop production value by $382/ha [24]. However, there are wide discrepancies between replacement cost and production value estimates in watermelon in New Jersey and Pennsylvania [16], and several other crops globally [25,26]. Attributable net income may be the most realistic way to estimate the value of wild pollinators where crop profits are attributed to managed or wild pollinators [16]. Unlike production value [27,28], net farm income and attributable net income account for yield-dependent costs [16,29] that vary proportionally with yield, such as transportation or labor costs. Excluding these and other production costs from valuation estimates may exaggerate wild pollinators’ contribution.
Pollination value can be measured through using surveys that assess the stated preference of both consumers’ and producers’ willingness to pay for crops pollinated by wild (versus managed) bees, and for producers’ willingness to invest in wild bee pollination strategies. Stated preference is for services with no markets such as wild bee pollination, while revealed preference can directly be observed from markets such as those for rented honey bee hives. Studies on consumer willingness to pay for wild bee pollinated crops is scant. Consumers are willing to pay $0.51/dry liter more for wild bee pollinated blueberries (both wild and cultivated), which is enough to cover the annualized cost of planting bee pastures [30]. United Kingdom (UK) consumers’ willingness to pay was estimated to be $22/person/year to maintain local agriculture and wildflower esthetics [31]. Studies of farmers’ willingness to pay for pollination services is limited to small-shareholder farmers in western Kenya, where average farmer willingness to pay for bee pollination is $88/year [32]. Studies quantifying the amount that agricultural producers are willing to annually invest in pollinator-friendly practices such as planting bee pastures (a.k.a. pollination reservoirs) are limited [30].
In Massachusetts, USA, cranberry (Vaccinium macrocarpon Aiton) is cultivated primarily in Plymouth (4681 ha), Barnstable (433 ha), and Bristol (403 ha) counties (Figure 1). Distributed statewide, wild blueberry (Vaccinium angustifolium Aiton) in Maine, USA is harvested biennially, with a distinct fruiting year and vegetative year. Wild blueberries in Maine are primarily grown in Washington (11,735 ha), Hancock (2331 ha), Knox (751 ha), Lincoln (222 ha), and Waldo (172 ha) counties (Figure 1; [33], 2012). Both industries expanded in the 1980s with a subsequent decline of harvested fruiting area during 1997–2012 of 29% (10,921 ha to 7329 ha) for Maine blueberry and 5% (5557 ha to 5284 ha) for Massachusetts cranberry; yet, both are still major production areas (50% globally for Maine wild blueberry, and 25% globally for Massachusetts cranberry) ([33], 1997–2012).
During 1985–2013 Maine, wild blueberry hive rental increased 191% (25,700–74,800 hives), while wild blueberry crop area remained relatively stable [33,34]. Hive-stocking density for blueberries increased 197% from 3.2 hives/ha in 1983 to nine hives/ha in 2013. However during 2013–2018, rented hives plummeted 50% as producers cut costs after price declines from successive years of high production (Figure 2). Massachusetts cranberry industry hive use increased 17% during 1985 (16,678) to 2013 (19,482), with stocking density increasing from 2.35 hives/ha to 3.66 hives/ha. The rental cost of honey bees is greater for blueberry producers than cranberry producers by about $20 per hive. This reflects the time of year when hives are needed, with spring being a much more competitive hive rental market than early summer [21].
This study uses consumer and producer survey data to quantify the value of wild bee pollination, and compares these perceived values to estimates that are based on crop production data. Despite stable feral wild honey bee colonies elsewhere in the northeast [35], wild bees in our study are predominantly not honey bees, owing to the low persistence of swarms from rented honey bee colonies [36,37]. We use crop production data from a single year, 2012. Our focal crops, cranberries and wild blueberries, are somewhat unique. Both are native to northeastern North America, and their wild bee fauna is evolutionarily adapted to their floral morphologies and life history strategies [3]. However, both systems rely heavily on honey bees for supplemental pollination, particularly since the 1970s [38,39]. Therefore, we consider these crops to be ideal models for an economic analysis of pollination value. Our objectives were to: (1) compare Maine wild blueberry and Massachusetts cranberry producers’ sources of pollination, and (2) improve wild bee pollination value estimates for both crops using data from both producer and consumer economic surveys as both a complement to and alternative for the contribution of wild pollinators to fruit set and yield measured in entomological field studies.

2. Materials and Methods

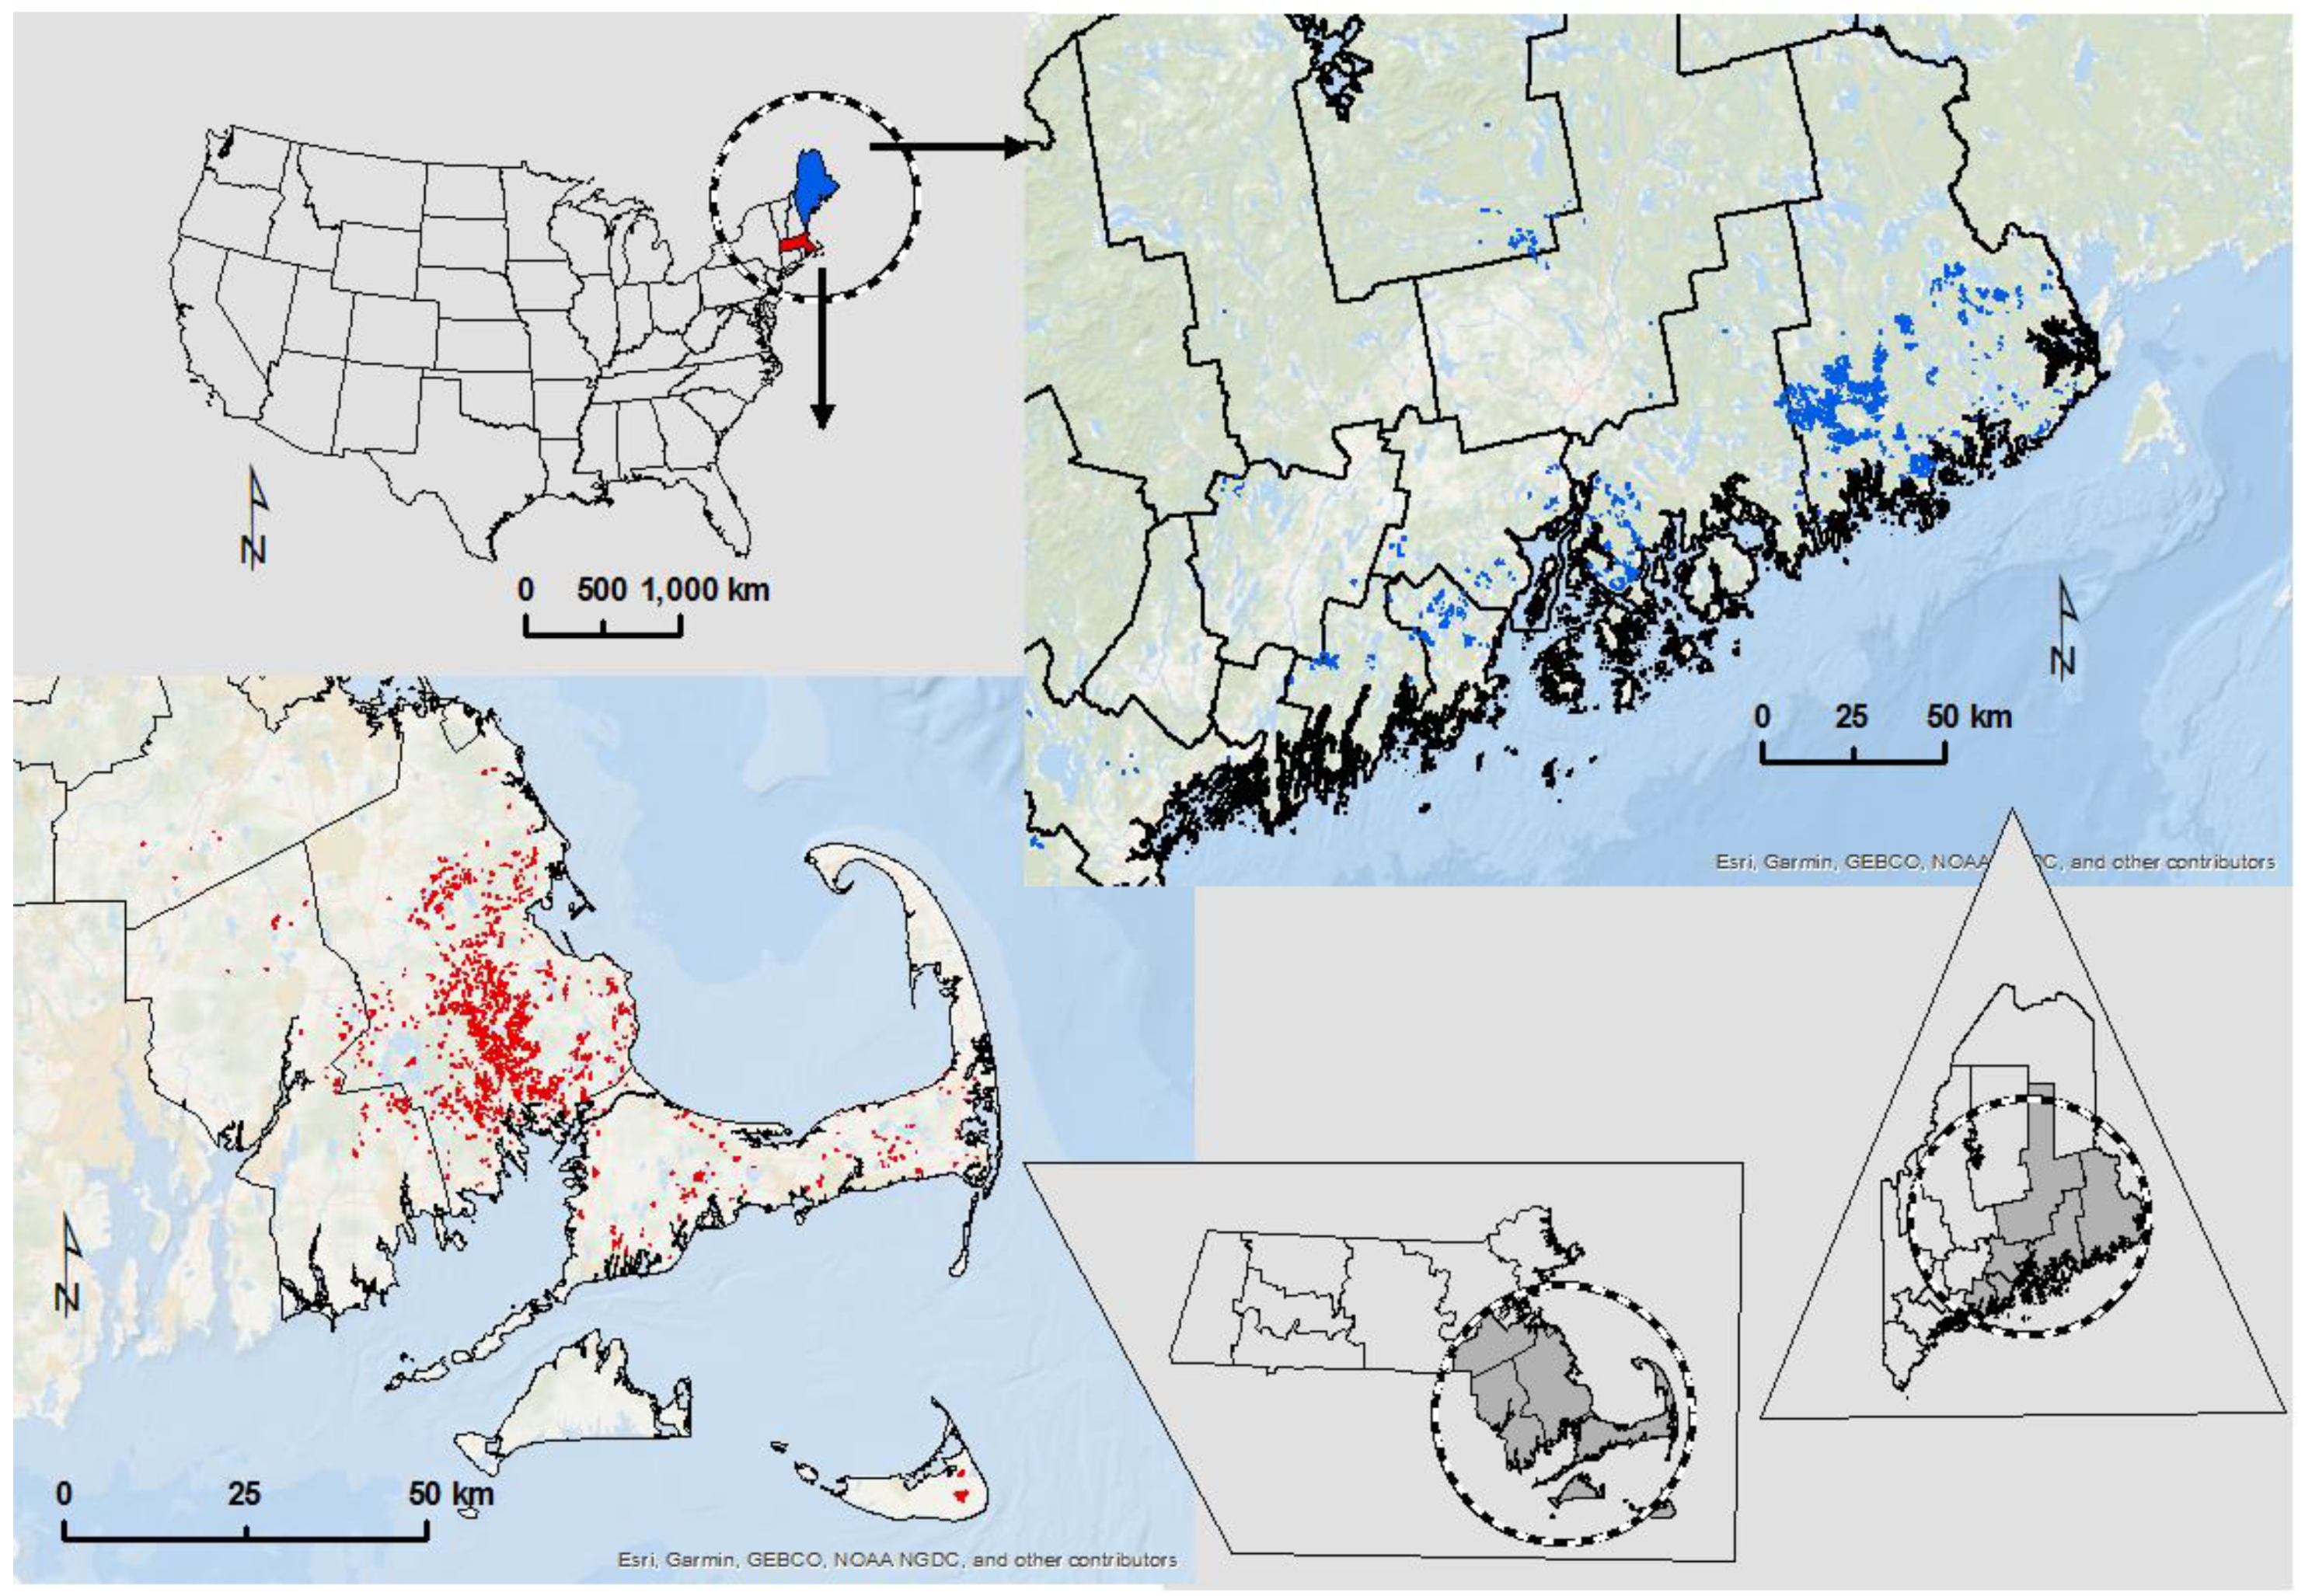
2.1. Mapping Study Area

Maine, USA, wild blueberry fields were identified from a composite land cover map [40], and Massachusetts, USA, cranberry bogs were identified from the 2005 Massachusetts Land Use Dataset [41] with ArcGIS® version 10.2 (Environmental Systems Research Institute, Redlands, CA, USA, 2014).

2.2. Producer Surveys

Surveys of Maine wild blueberry producers in 2012 and 2013 (n = 80, 20% of 400 commercial producers) informed pollination value estimates for the crop. We surveyed 46 respondents predominantly from Washington County at the Maine Wild Blueberry Industry’s Annual Field Day on 18 July 2012, in Jonesboro, Maine. We surveyed an additional 34 producers from Hancock, Knox, Waldo, and Lincoln counties on-farm or over the phone between 19 July 2012 and 1 July 2013. More detailed crop budget in-person interviews were conducted with 35 producers on-farm between 2012–2015. From these data, we created a wild blueberry enterprise budget representative of the cropping system. This enterprise budget was used for net farm income (i.e., profit) calculations.
Wild blueberry and cranberry producer surveys followed the same format (Supplementary Materials, Tables S1 and S2). We surveyed Massachusetts’ cranberry producers (n = 66, 22% of 300 commercial producers) at the University of Massachusetts Cranberry Station Pesticide Safety Training meeting in East Wareham on 9 April 2013. In a supplemental survey on 15 April 2014, we asked cranberry producers (n = 40) about their historical rented honey bee hive stocking densities as well as their production practices (Supplementary Materials, Table S3). On-farm interviews of five cranberry producers occurred during 2013–2014. Data collected from these sit-down interviews were used to construct a representative cranberry enterprise budget to calculate net farm income.
For both crops, producer surveys collected data on rented honey bee hive use and rental prices. Producers also were asked about the amount of money that they were willing to invest in wild bee enhancement on their farms as well as the practices they use to conserve and enhance wild bee populations. Farmer socio-demographic data such as age, education, and attendance at extension meetings were also documented.
Our blueberry and cranberry surveys were administered to larger, commercial farmers, which were the producers most likely to have resources for financing pollination alternatives. Many producers in Maine own land containing wild blueberry fields, but they do not actively manage the crop [42]. In Massachusetts, 42% of 205 cranberry producers (48% response rate) surveyed in 2005 managed 0.4–3.6 ha [43]; only 15% of cranberry farmers we surveyed during April 2013 managed bogs of this size. Statistical analyses of field and/or survey data for both crops were conducted with the software packages JMP (SAS Institute, Cary, North Carolina, USA, 2012) and SPSS (IBM SPSS, Armonk, New York, USA, 2013). Comparisons were done using ANOVA. Producer use of honey bee hives was contrasted using logistic regression. We estimated production functions for both crops describing the relationship between average crop yield and honey bee hive use per hectare. We used linear multivariate regression to identify the socio-demographic variables impacting average crop yields. Summary statistics from producer surveys were used in crop enterprise budgets.

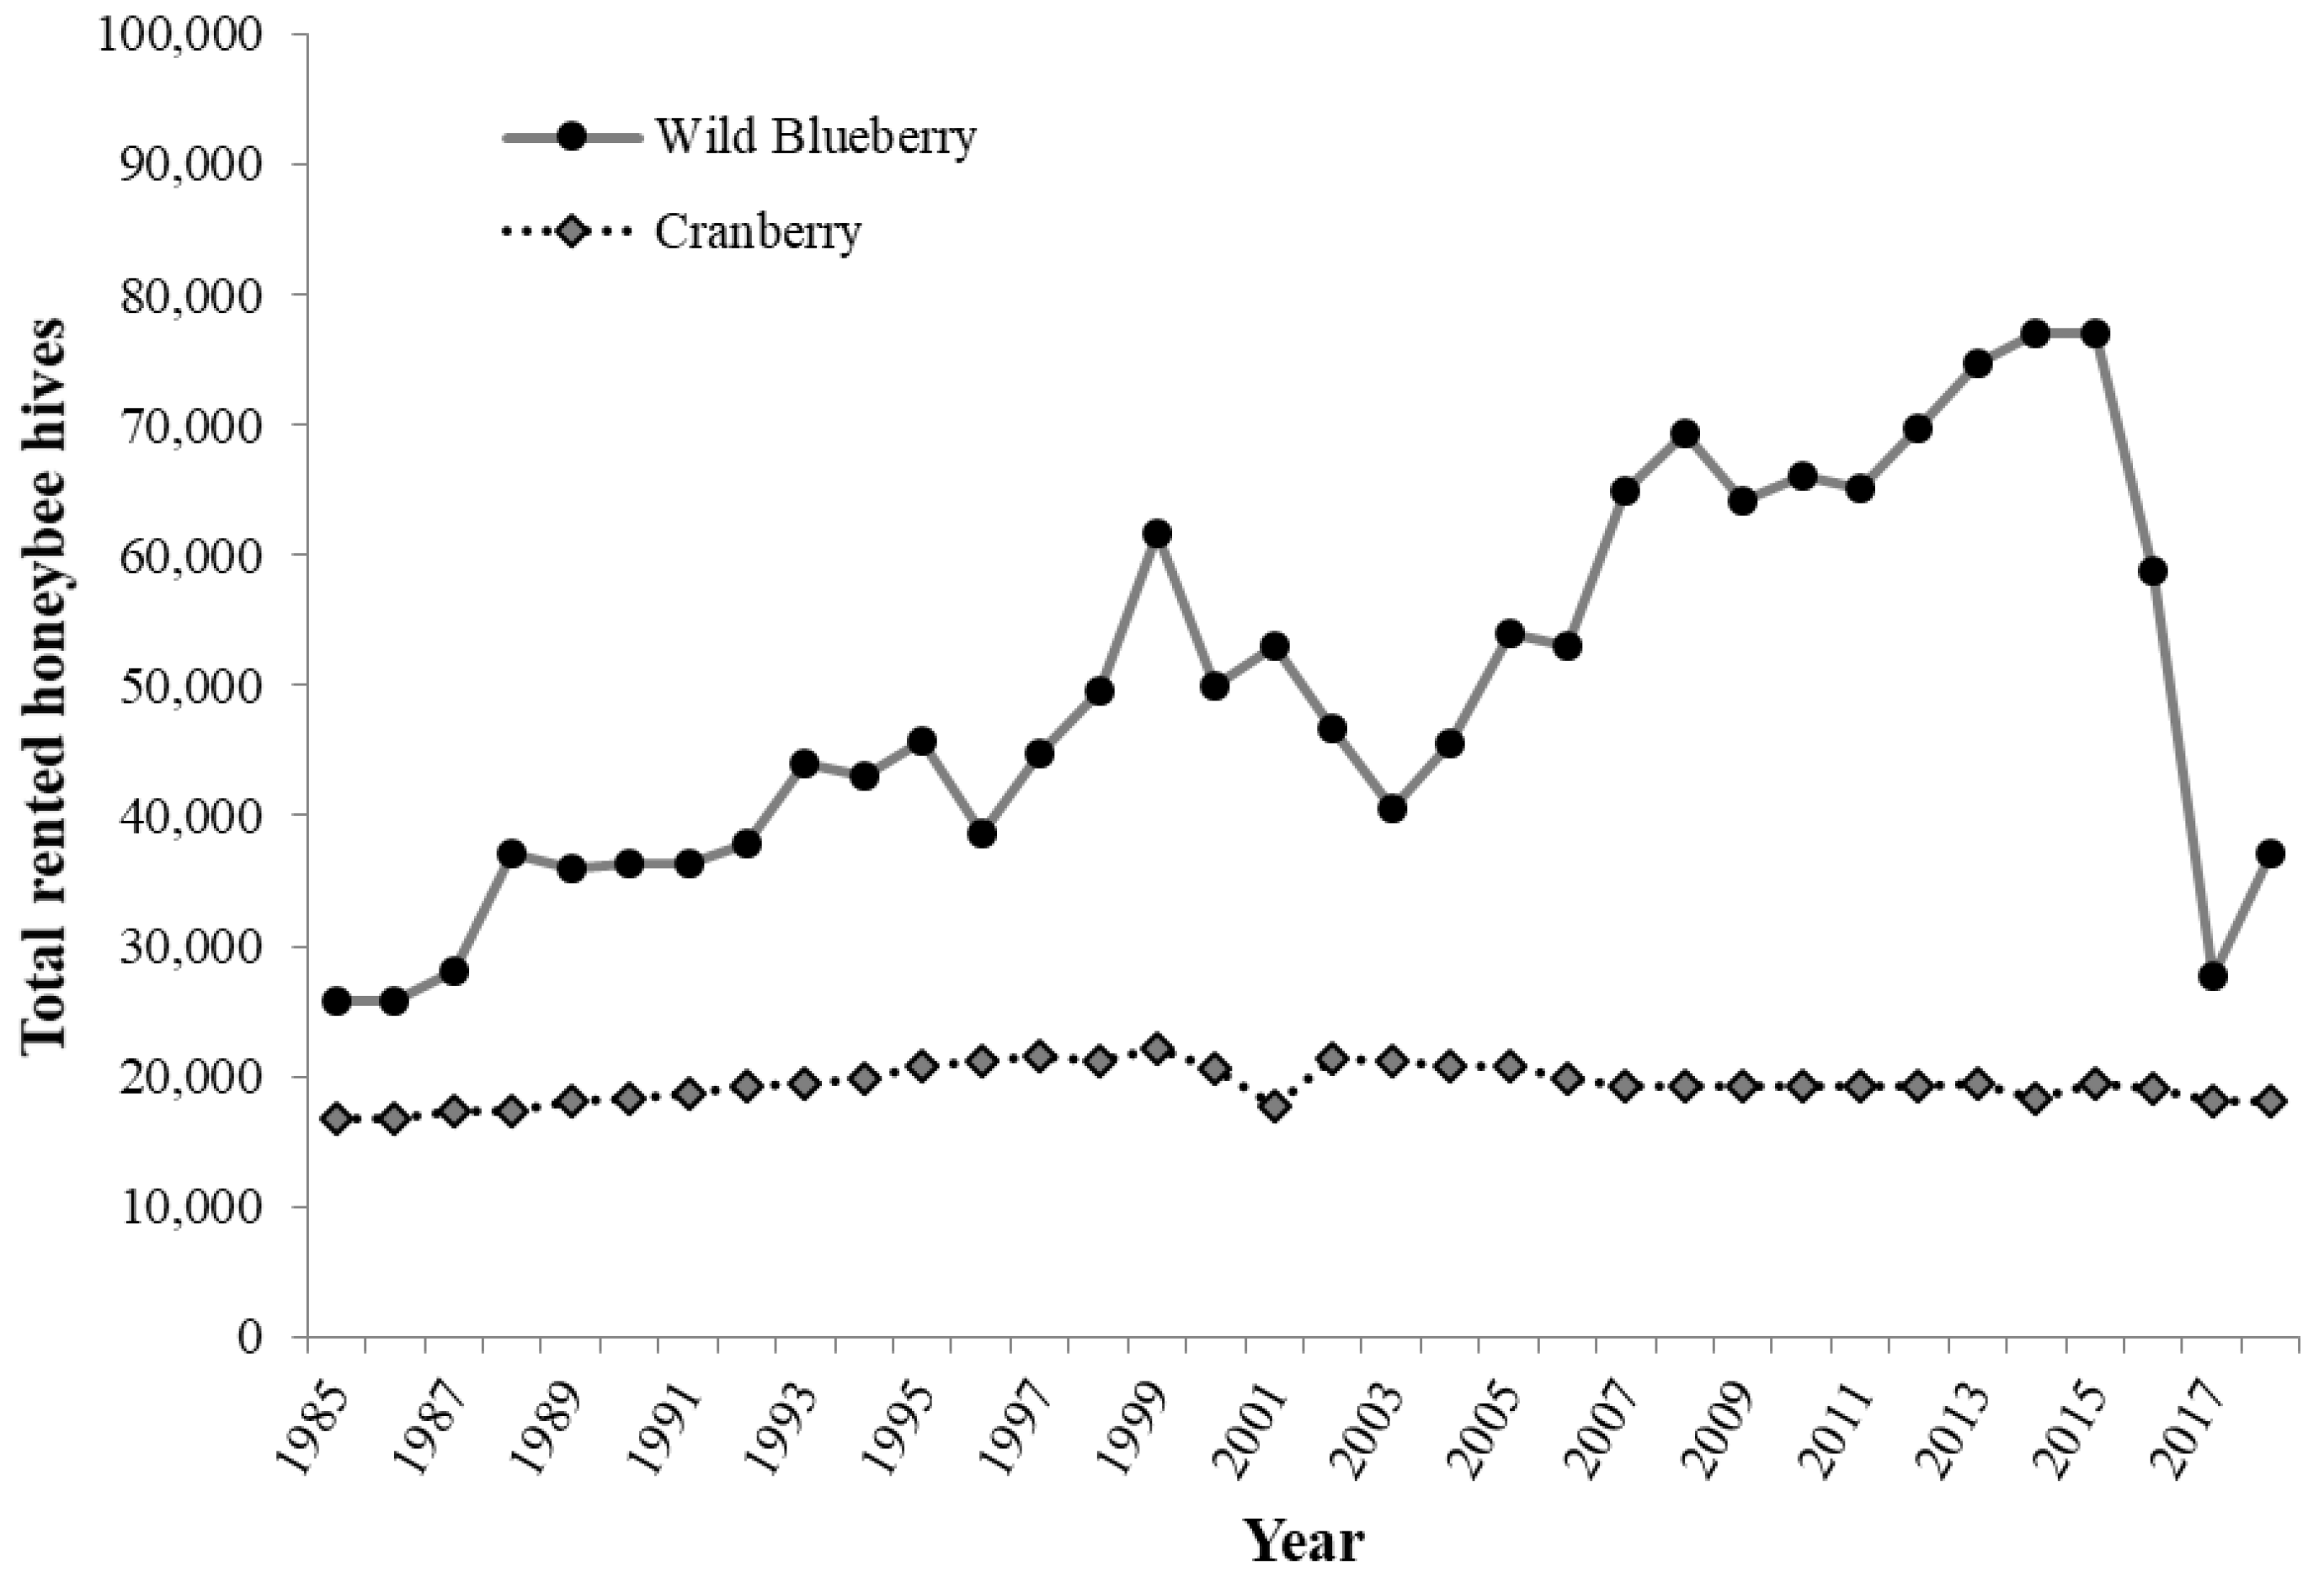
2.3. Rented Honey Bee Hive Use

We compared rented honey bee hive use during 1985–2013 for both crops. Hive imports for Maine wild blueberries were based on 1985–2013 bee keeper records [44], while those for Massachusetts cranberry were estimated from producer surveys. We estimated annual hive stocking densities (hives/ha) by dividing the annual hive rental by estimated Maine wild blueberry harvested crop area linearly interpolated among Census of Agriculture years [33] (1982–2012) owing to a lack of reported annual harvested area. Unlike wild blueberry, cranberry harvested area is tracked annually. We estimated cranberry hive use by multiplying hives per ha interpolated from producer hive use data surveyed on 15 April 2014 by Massachusetts’ crop area [33] (1985–2012). Rented honey bee hive stocking densities in 2012 for both crops were calculated by averaging 2012 stocking densities from surveyed producers that were share-weighted by their farm’s crop area. Honey bee hive stocking densities were multiplied by similarly share-weighted rented hive prices from our surveys to derive the pollination costs per ha.

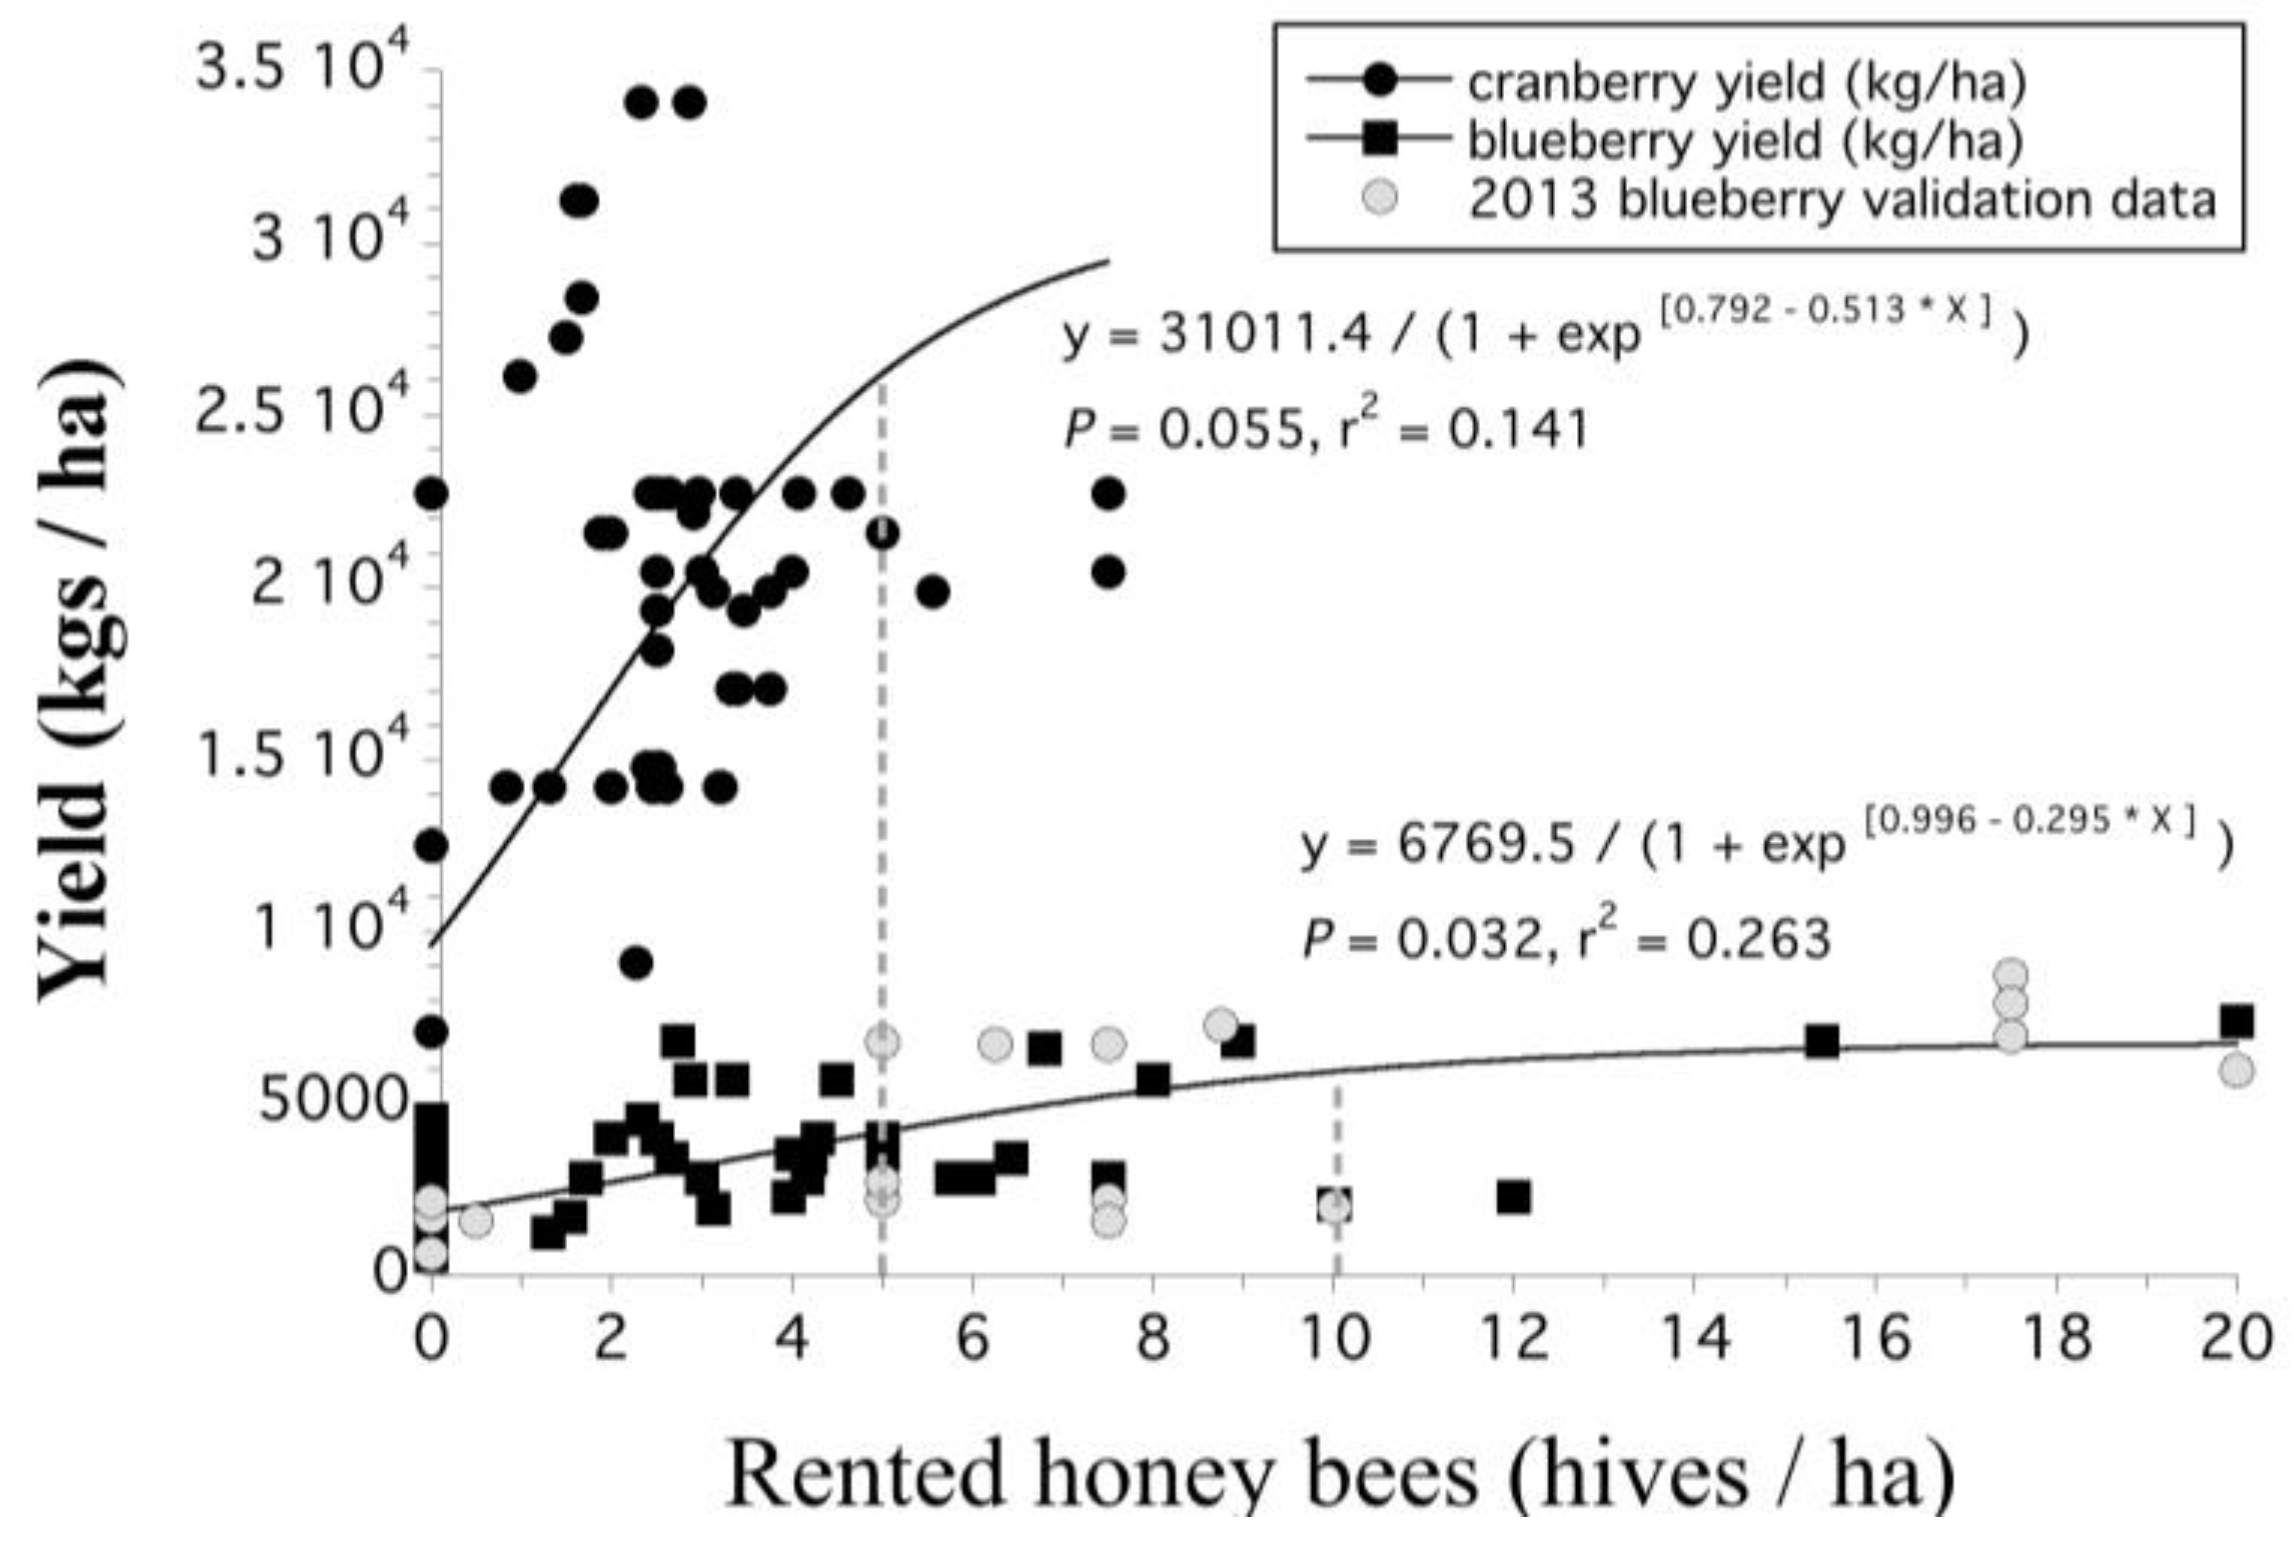
2.4. Value of Wild Bee Pollination

A flowchart of wild bee pollination value metrics (replacement cost, production value, attributable net income for wild bees, value of marginal product, and marginal profit) is provided in Figure 3. We estimated the 2012 pollination replacement cost (RC) for both crops by multiplying total hives used by the average surveyed cost per hive to estimate the total cost of rented honey bee hives (TChb) that serve as a substitute or replacement for relying on wild bees:
RC = TChb
The production value (PV) of pollination for both crops was based on 1998–2012 crop revenue (TR) calculated as the real (inflation adjusted) price multiplied by total crop production for each year [29] (USDA NASS, 1998–2012), which was then multiplied by a honey bee pollination dependency factor (d) = 1 [4,28], indicating complete dependency on animal-mediated pollination:
PV = d × TR
Recent research suggests d < 1 for Wisconsin cranberry, owing to abiotic factors such as wind and agitation [45]. Since biotic contribution to pollination from other insects aside from honey bees was not quantified in their study to determine total animal mediated dependency (d), we used d = 1 [28].
Valuing pollination with attributable net income requires first calculating net farm income (profit) for both crops, which is crop total revenue minus total costs (equal to both variable and fixed production costs). Net farm income (NFI) was calculated with detailed representative enterprise budgets constructed from individual crop budgets engineered in collaboration with 32 wild blueberry and five cranberry farmers surveyed on-farm between July 2012 and July 2014. While there were fewer surveyed cranberry producers than wild blueberry, cranberry has less variability in producer management, in addition to more detailed data regarding crop management and cost of production [46]. The wild blueberry budget was checked with summarized budgets from farmers [47]. Budgets were constructed to have yield-dependent costs such as crop taxes and harvest transport vary with yield changes (Supplementary Materials, Tables S4 and S5).
Attributable net income (ANI) equals net farm income times the percent (P) of NFI attributable to wild bees (wb) versus managed honey bees:
ANIwb = NFI × Pwb
estimations of Pwb for wild blueberry were based on our 2012–2013 producer survey, which was consistent with historical field studies [18,19], while Pwb values for cranberry were solely from our 2013–2014 producer survey, owing to a lack of available field data. Producers drew from direct field experience and past collaborations with university researchers to estimate Pwb. Although our wild blueberry grower estimates of wild bee contribution to pollination were not as reliable as field data, they were consistent with the values reported from these field studies, suggesting that similar estimates from cranberry growers may offer a reasonable estimate for this model.
ANIwb, replacement cost, and production values were calculated as 1998–2012 average values. To estimate the attributable net income on a per-bee basis for both crops, ANI was divided by the typical numbers of observed foraging rented honey bees (Qhb) or typical observed wild bee (Qwb) densities for wild blueberry [19,48] and cranberry [36,49,50]. Each rented honey bee hive for wild blueberry was assumed to have 8000 foraging workers (20% of an average colony population of 40,000 bees [51]); whereas, for Massachusetts cranberry, the number of foraging workers was half as much, owing to the smaller colony size (20,000 bees) for most hives [36].
The incremental (marginal) change in net farm income (or profit) as rented honey bee hives (Hhb) are added to the farm system is another way to value managed pollination. Such marginal profit (MP) was calculated with nonlinear asymptotic sigmoidal production functions fit for both crops based on our producer surveys:
MP = ∆NFI/∆Hhb
crop enterprise budgets were used to calculate profit at each scenario using incrementally more managed honey bee hives. Calculating the difference in NFI between these scenarios derives MP.
Production functions are defined as crop output (kg yield/ha), which is a function of input (hives/ha) and commonly has diminishing returns to input use, at least at the upper end of the input range [52]. A sigmoidal relationship between pollination input and fruit set or yield is both theoretically expected and empirically observed [10,53]. Production function data from our producer surveys were graphed with wild blueberry field study data for sampled yield/ha collected on producers’ farms versus hives/ha stocked during 2013 [37]. For cranberry, similar field study data were not available during the decade that growers were asked to provide their average yield. Another complication was the magnitude of rented honey bee spillover pollination, which was attributable to the geographic concentration of farms in Plymouth County, MA, USA (Figure 1).
Production functions were estimated with nonlinear asymptotic models explaining crop yield (kg/ha) as a nonlinear function of rented honey bee hive density (hives/ha) plus other crop production and grower characteristics surveyed from producers (Supplementary Materials, Tables S1 and S2). Nonlinear asymptotic production function models improved marginal output estimates over initial univariate models using just hives/ha. Linear multivariate production function models were used for greater ease of interpretation of parameter estimates of marginal impacts compared to nonlinear asymptotic model runs. All of the production function models were run in JMP (SAS, 2012).
The fitted production function models were then used to estimate marginal outputs with increasing hive use per area. These incremental changes in crop output were then used in representative crop budgets to estimate marginal product (marginal changes in crop yield with increasing hive use) and subsequent marginal changes to revenues (value of marginal product) and profits (marginal NFI) with increasing hive use. Similar to attributable net income, marginal profits were adjusted for 100% dependency (d = 1) on animal-mediated pollination. Calculating such marginal profit used average crop prices. This marginal measure is driven by incremental changes in yield that are predominantly independent of crop price. Thus, we did not run sensitivity analyses based on crop price. Stocking densities (rented honey bee hives/ha) were identified at our Cooperative Extension recommended rates. Production functions typically flatten out where diminishing returns begin when the successive marginal changes in profit from adding another hive declines. Crop enterprise budgets were modified for each stocking density scenario where yield changes were based on the production function estimated for each crop.

2.5. Consumer Surveys

Methods for assessing consumer willingness to pay for the wild pollination of cranberries was similar to contingent valuation survey methods used for blueberries (n = 498) ([30], Supplementary Materials, Tables S6 and S7). An online Qualtrics (University of Massachusetts, Amherst, MA, USA, 2016) survey (n = 771 viable observations) was administered to United States citizens (≥18 years old) online through Amazon Mechanical Turk (AMT) marketplace (https://www.mturk.com/) for researchers and workers as a human intelligence task completed in return for a $0.45 payment. Each respondent was able to see the payment amount and read a short description of the survey prior to participation. Participants entered a code from the Qualtrics survey back into AMT, allowing us to match survey responses with AMT’s anonymous worker identification numbers.
The online survey had two versions. Both versions began with a short introduction summarizing the study’s objective, which was to determine consumer willingness to pay for the wild pollination of cranberry, along with verifying the age requirements of participants. Unlike the first survey, the second survey asked respondents to sign an oath promising to give honest, accurate answers. Our oath may not be as effective as an oath administered in-person, since respondents were not required to show any form of identification. Survey results improved once people signed an oath with their name or initials. Using surveys with and without an oath allowed us to analyze hypothetical bias where survey respondents’ hypothetical willingness to pay can be double or triple their actual willingness to pay [54].
Consumer survey respondents were then provided with a brief summary of colony collapse disorder, a list of products containing cranberries, and the possible benefits and costs of wild pollination. Surveyed consumers were then asked their willingness to pay as well as the percentage that they were willing to pay more (0%, 5%, 10%, 15%, >15%) for hypothetical sustainable wild pollinated cranberry products priced at $2, $5, or $10. No specific cranberry product was listed due to the diversity of products containing cranberries. Forcing consumers to complete the survey with only one specific cranberry product in mind could bias results. For example, survey participants disliking fresh cranberries may not be willing to pay any more for the wild pollination of the crop, while this answer may be positive for products containing cranberries that they enjoy more (e.g., juice, Craisins®, etc.). The choices of $2, $5, and $10 represent common prices for cranberry products sold in grocery stores.
Next, survey respondents were asked for their level of certainty (0% to 100% in 10% increments) of their responses. Past research suggests that people with 70% to 80% or more certainty tend to provide more accurate contingent valuation responses [55], so this can be used to mitigate hypothetical bias. Respondents were asked to specify their reasons if they were not willing to pay any price increase for wild pollinated cranberries. The survey concluded with socio-demographic questions, including if they read product labels when shopping, prior knowledge of colony collapse disorder (CCD) and commercial honey bee (CHB) keeping, viewing climate change (CC) as a problem, having at least one child, as well as their gender, ethnicity, age, and annual income. These socio-demographic variables were regressed against willingness to pay using ordinary least squares with associated parameters (ßn) and random error (ε):
WTP = ß0 + ß1 Price + ß2 Oath + ß3 Certainty + ß4 Labels + ß5 CCD + ß6 CHB + ß7 CC + ß8 Child + ß9 Gender + ß10 Ethnicity + ß11 Age + ß12 Income + ε
to test for factors significantly influencing respondents’ stated preferences. An ordered logit regression was also run to compare to the ordinary least squares model.

3. Results

3.1. Producers’ Pollination Practices

Although wild blueberry producers in Maine, USA managed slightly more cropland per farm than cranberry producers in Massachusetts, USA (see Table 2), wild blueberry producers are more reliant on the pollination services of wild bees (F(1,142) = 5.731, p = 0.018), and are 3.74 times more likely to not use honey bees than cranberry producers (logistic regression slope = −0.508, χ2(1) = 7.161, p = 0.007). For those wild blueberry producers who do rent honey bee hives, stocking densities are greater than densities used in cranberry (F(1,103) = 12.516, p = 0.006). Honey bee hive density is positively associated with yield for both industries (Slope = 8.923, F(1,84) = 8.473, p = 0.005). The percentage of available crop blossoms pollinated by wild bees (fruit set) was estimated by cranberry farmers to be 34.3%, and by wild blueberry farmers to be 39.9% (Table 2). Wild blueberry and cranberry producers who did not rent honey bee hives attributed more pollination (83.8%) to wild bees than did producers who rented hives (30%). A greater percentage of wild blueberry (36%) than cranberry (18%) producers reported monitoring wild bees.

3.2. Pollination Value

The replacement cost ($7,272,851) for Maine wild blueberry rented honey bee hives at stocking densities weighted by farm size is 13% of the average production value ($55,622,419) of the crop during 1998–2012. The replacement cost for Massachusetts cranberry ($1,508,454) is 2% of the average production value ($76,835,455) of the crop during 1998–2012. This difference in the cost of wild pollinator replacement is attributed to the lower stocking densities and prices of rented honey bees for cranberry (3.66 hives/ha at $78.62/hive) versus wild blueberry (9.46 hives/ha at $104.20/hive). Greater cranberry production value is attributable to greater average cranberry yield (14,996 kg/ha) compared to wild blueberry yield (3704 kg/ha), despite cranberry’s lower (42%) average price per kg (Table 3).
Pollination valuation estimations of net farm income (NFI) and attributable net income (ANI) subtract production costs from total revenue, reflecting farmers’ realized returns. NFI and ANI may be more accurate estimations of pollination value that are between the value of short-run catastrophic crop loss from pollinator collapse and the long-run perfect substitutability of managed pollinator rentals. The estimated total NFI for Maine’s wild blueberry industry ($12,852,054) exceeded the total NFI for Massachusetts’ cranberry ($10,226,073), owing to 71% more harvested average (1998–2012) crop area for wild blueberry (9384 ha) compared to cranberry (5501 ha). Cranberry NFI per ha ($2009) exceeded that for wild blueberry ($1536). This difference is attributable to the greater cranberry yield per ha (305%), which resulted in greater crop total revenues per hectare ($13,991 for cranberry versus $5953 for wild blueberry).
Maine Cooperative Extension recommendations (personal communication, David Yarborough) for honey bee hive rental for wild blueberry (9.88 hives/ha) are a greater portion of variable costs for wild blueberry production (35%), whereas recommended [56] hive rental (4.94 hives/ha) comprises only 7% of the variable costs for cranberry producers. Therefore, replacement cost (or the cost of honey bee hives) for wild blueberry (RC = $992/ha) is greater than its attributable net income from wild bees (ANIwb = $613/ha). Cranberry ANIwb was estimated at $689/ha. Decreasing values for production value, net farm income, and ANIwb were consistent for both crops across the full range of 1998–2012 crop prices (Table 3).
The attributable net income per ha for wild blueberry is divided between rented honey bees (ANIhb = $923/ha) and wild bees (ANIwb = $613/ha). For Massachusetts cranberry, these values are also greater for rented honey bees ($1320/ha) compared with wild bees ($689/ha). Attributable net income was calculated using observed wild bee densities and honey bee hive bee counts [19,48,52]. This is greater for rented honey bees for cranberry ($0.09/bee) compared with wild blueberry ($0.012/bee). Wild bee densities in cranberry are slightly greater than in wild blueberries [18,45,47], so wild bee pollination value per bee is less ($0.26/bee) than for wild blueberry ($0.31/bee). Attributable net income values per wild bee are greater than those for rented honey bees due to wild bees’ greater pollination efficiency [57,58].
Production functions for wild blueberry indicate a lower marginal impact of hive use on yield compared to cranberry, with diminishing returns to rented honey bee hive use for cranberry after two hives per ha compared to four hives per ha for wild blueberry (Figure 4). Cranberry’s greater marginal output is a result of average 1998–2012 crop yields, which are more than three times larger than that of wild blueberry; they are harvested into 18-wheel tractor trailers compared to 10-wheeler flatbeds or the smaller trucks that are typically used to transport wild blueberries out of the field. Fewer cranberry pollen grains per flower are required for cranberry pollination compared with that required for blueberry pollination, and therefore, hive use per ha for Massachusetts cranberry is less than that for Maine wild blueberry, even though cranberry floral density (61.8–98.8 million/ha) exceeds that for wild blueberry (19.8 million/ha) [56,59]. Despite lower cranberry prices, the greater marginal impacts on crop yield for cranberry relative to wild blueberry result in not only greater marginal changes in total revenue per ha, but also greater marginal changes in profit (net farm income) per ha for cranberry ($2440–6206) compared to wild blueberry ($797–1102) when using two to eight hives per ha (Table 4).
Linear multivariate regressions for production functions (Table 5) explained more of the variation in crop yield for both wild blueberry (r2 = 0.555) and cranberry (r2 = 0.508) compared to univariate nonlinear asymptotic models for these same crops (r2 = 0.263 and 0.141 respectively, as seen in Figure 4). For both crops, larger farms had significantly higher yields. For wild blueberry, mid-coast producers in Waldo, Knox, and Lincoln counties in Maine had significantly lower yields compared with those in Maine’s Downeast region in Washington County, which was likely due to the lower intensity systems and smaller fields typically found in this area. Wild blueberry pollination management did not significantly affect yields. Cranberry farmers managing the improved Stevens variety had greater yields than farmers producing traditional Early Blacks and Howes. Cranberry producers tended to have significantly greater yields if they altered pesticide use for bees, left standing dead wood around their bogs, and if they did not change hive stocking densities when they perceived spillover pollination from other producers’ rented honey bees (Supplementary Materials, Tables S1 and S2).

3.3. Consumer and Producer Surveys

There were no significant differences in the willingness-to-pay values between cranberry consumer survey respondents who took the oath versus those who did not for both ordinary least squares and ordered logit models. Higher consumer willingness to pay for wild pollinated cranberries was significantly associated with higher certainty, reading product labels, knowledge about colony collapse disorder, belief that climate change is a problem, women versus men, non-African Americans, and higher income. The price premium that survey respondents were willing to pay for wild bee pollinated cranberries as a percentage of product price declined for $2 (12%), $5 (8.6%), and $10 (7.5%) cranberry products with an average price premium of 8.4%. Cranberry wild pollination price premiums were slightly less than the 14% premium [30] that was found for blueberries. Applying these price premium percentages to the production value of both crops, consumers’ value of wild bee pollination are quantified for both Maine wild blueberry ($888/ha) and Massachusetts cranberry ($1179/ha) in Table 6, which is close to covering the $974/ha annual cost of establishing pastures (a.k.a. pollination reservoirs) for wild bees [60]. For both crops, consumer willingness to pay per ha exceed the attributable net income for wild bees (ANIwb) per ha. The amount that surveyed wild blueberry ($140/ha) and cranberry ($188/ha) producers are willing to invest annually on their farms to enhance wild pollinators is only ≈15% of what consumers are willing to pay for wild bee pollination and ≈25% of ANIwb (Table 6).

4. Discussion

4.1. Improving Valuation Metrics of Wild Bee Pollination

One method of estimating the value of wild bee pollinators is to calculate the cost of replacing the pollination they provide with rented honey bee hives [28]. This is called the replacement cost (RC). Replacement costs are estimated not by the direct replacement of one wild bee to one honey bee, but rather by extrapolating the pollination provided by each honey bee hive to the pollination services required to meet crop pollination demand. That is, if 50% of pollination is done by honey bees in a given crop (e.g., wild blueberries), and honey bees are stocked at two hives per acre, then the cost of replacing the pollination provided by wild bees (50% of total pollination) would be the cost of renting two additional honey bee hives per acre. Honey bees and wild bees (bumble bees, mining bees, etc.) differ in their pollination efficiencies. Bumble bees are as much as 10 times more efficient on a per visit pollen deposition rate than honey bees [57,58]. However, because this valuation estimate is not accounting for the replacement of bees on a one wild bee to one honey bee basis, relative efficiencies are not part of the RC calculation. Instead, RC is based upon hive use in the field [53,61], and the ecological interactions are inherent within the calculations. However, the challenge is that the calculation assumes that these relative efficiencies are static. In the field, efficiencies change based on the relative abundance of different species.
We estimate the replacement cost of wild bee pollination in Maine wild blueberry to be 13.08% of the production value of the crop. In Massachusetts cranberry, replacement cost is only 1.96% of the production value. As a valuation estimate for wild bees, replacement cost assumes that the per-hive value of honey bees to crop pollination in fields with wild bees is equal to their value in fields with no wild bees present. In other words, this assumes that a honey bee in a field with wild bees should be valued the same as a honey bee in a field without wild bees present. This assumption is problematic for a number of reasons. First, it is well established that pollination synergies exist between honey bees and wild bees [62]. In almond orchards in California, USA, honey bee pollination efficiency increased by approximately 66% when wild bees were present [63]. Research in Maine wild blueberry suggests that honey bees are more efficient pollinators when they visit a flower that has been recently visited by a bumble bee, although this was not directly measured [58]. The pollination services provided by honey bees in hybrid sunflower fields in California, USA, increase by as much as five times when wild bees are present [64]. These studies all point toward the conclusion that honey bees are far less effective, and far less valuable on a per-bee or per-hive basis, when wild bees are absent. Thus, replacement cost estimates undervalue the true cost of replacing wild bees with rented honey bee hives. Despite this flaw, replacement cost is still a valuable tool to use not as a direct measure of wild bee pollinator value, but rather as a relative measure for comparing value between crops. This method can also serve to set a low end of the possible ranges of pollination value in a given crop. Here, we find that it would cost Maine wild blueberry growers $992/ha to replace wild bee pollination services with rented honey bee hives. In Massachusetts, cranberry growers would need to pay much less, only $287/ha (Table 6). This discrepancy can be attributed to the greater per-hive cost that wild blueberry growers pay for rented honey bees, and according to our grower surveys, the greater relative contribution that wild bees play in crop pollination in wild blueberries.
A second method for estimating the value of wild bees to crops is to calculate the proportion of net farm income that can be attributed to wild bees (ANIwb) relative to the income that can be attributed to honey bees (ANIhb). Wild blueberry growers in Maine estimate that wild bees contribute approximately 40% of the pollination of their crop, while cranberry growers in Massachusetts estimate the contribution of wild bees at 34%. In both cases, managed bees (primarily honey bees) are perceived to provide the remainder. This valuation method allows us to separately value the contribution of wild versus honey bees in the crop. We relied upon grower survey data to estimate ANIwb. However, in the field, the value of wild bees to ANI is variable. Variation exists between fields and between years. In some cases, variation is caused by abiotic factors. For example, in 2013, pollination in Massachusetts cranberry fields was sufficient; however, unusually hot summer weather stressed vines and contributed to aborted fruit, which reduced crop yield and profits. When crop production decreases, so must ANIwb. Biotic factors also introduce uncertainty to ANI-based estimates. For example, wild bee populations unpredictably vary between years [62], fluctuating from one year to the next due to a combination of factors that include stochastic events [65], floral resources [66], and source-sink dynamics [67].
ANIwb reflects the total contribution to farm profitability from wild bee (wb) pollination, but it, similar to the other measures, has several limitations. These, and other ANI calculations in the literature, do not differentiate between farm profits attributable to pollination from wild (ANIwb) or managed bees (ANIhb) [16] versus other factors (i.e., irrigation, good weather conditions, fertilizers, suppressing weeds) [68], potentially inflating pollination value. The ANI method also has limits as an aggregate measure of pollination value, because it does not show the incremental (marginal) effects of adding pollinators. The additional units for managed bees are standardized and quantifiable, facilitating an estimation of marginal profit from incrementally adding hives [69] or nests [70]. However, determining such marginal impacts of wild bees is challenging, because few surveyed producers monitor wild bees (cranberry, 18%; wild blueberry, 36%), and to our knowledge, no field data exists that assesses the marginal contribution of wild bees to yield in either crop. The reliability of our marginal profit estimates would be enhanced by incorporating a field study-based estimate of the marginal impact of wild pollinators on yield. The accuracy of this method could be enhanced by incorporating the value of other contributors to crop yield in the assignment of ANI.
Production value (PV) offers a third way to value the contribution of pollinators to crop yield. However, PV assumes a catastrophic loss in the absence of pollination, and ascribes the entire value of the crop (PV) to pollination when the crop is 100% reliant on pollination, as is true for both of our focal crops [4]. While it is true that for many crops, production would be zero without pollinators, we cannot ignore the contribution of fertilizer, weed control, pest control, and other factors to yield. The production valuation method is useful in assigning a ceiling to the value of pollination in any given crop. In this study, we can consider the pollination value ceiling in Maine wild blueberry at $5953/ha, and the pollination value ceiling in Massachusetts cranberry at $13,991/ha (Table 6).
None of the three pollination valuation methods (replacement cost, attributable net income, and production value) that were used in the literature measure the incremental contribution, or where diminishing returns exist for each additional pollination unit. In lieu of data on the incremental contribution of wild bees, here we used honey bee hives. By fitting a crop production function (yield/ha as a function of hives/ha) to producer survey data, we estimated the incremental (marginal) increases in the revenue, yield, and profit of each pollination unit (honey bee hives). This is a fourth method to value pollination.
The University of Massachusetts Cooperative Extension currently recommends stocking no more than ≈5 honey bee hives per ha for cranberry. This recommendation does not align with the marginal increases in revenue per hive according to our production function (Table 4) or economic theory, which posits producing where there are intermediate diminishing returns (i.e., for insurance) [52]. In fact, the marginal value of increasing from eight hives per ha to 10 hives per ha in cranberry is $1131, or an additional 1398 kg/ha. Gaines-Day and Gratton (2016) [69] reported an even greater marginal yield increase between eight and 10 hives per hectare (≈3000 kg/ha) in Wisconsin cranberry fields, albeit this marginal increase becomes much smaller as the proportion of forest in the surrounding landscape increases. The landscapes around Massachusetts cranberry bogs are typified by thin forest strips and suburbs that have limited floral resources for wild pollinators. Forests around Wisconsin cranberries appear to draw honey bees out of cranberry fields during pollination, which is due to the more rewarding bee forage in Wisconsin hardwood forests [69]. Whether or not this is true in Massachusetts is undetermined, but studies to elucidate this in Massachusetts could help growers make decisions on pollination strategy. The wild blueberry barrens of Maine have large fields surrounded by more extensive patches of forest [71] than Massachusetts cranberry, but the forest is predominantly softwood, which is a generally poor habitat for crop pollinators [72], and is unlikely to pull honey bees from the crop field in most wild blueberry landscapes.
According to our grower surveys, Massachusetts cranberry growers assigned greater importance to wild bees (data not shown) compared with Maine blueberry growers, even though they consider wild bees to contribute less to their crop fruit set (≈34%) than wild blueberry growers (≈40%) (Table 2). This difference is most likely due to the greater marginal value of pollination in cranberry. In poor pollination years, or when rental honey bee hives are less available, cranberry producers are more immediately threatened with a greater loss of yield, revenue, and profit at the margin compared to wild blueberry producers. The economics of pollination create a greater incentive for cranberry producers to seek additional pollination units, whether from honey bees or wild bees.
Estimating production functions from producer surveys can enhance the understanding of incremental effects of pollination on yield. The accurate calculation of net farm income and attributable net income requires robust economic budgets with a specification of yield-dependent variable costs as well as fixed costs such as depreciation. In this analysis, the pollination value of wild bees was estimated based on allocating attributable net income between rented honey and wild bees based on producers’ estimates of the percent fruit set from wild bees. While for wild blueberry these estimates were consistent with measured field data [61,73,74], we have no similar data for cranberry to validate producers’ estimates (Figure 4), so caution should be taken when interpreting the results for cranberry. While grower estimates of crop yield, managed bee stocking densities, and wild bee contribution to fruit is subject to bias and inaccuracies, previous work has shown that such data can be very reliable, and at times more accurate than concurrent government farm census data [75]. Further, socio-economic data collected from surveys (Supplementary Materials, Tables S1–S3) and in-depth producer interviews can complement field-based data. As demonstrated by Massachusetts cranberry in our study, grower interviews may provide the only data currently available to estimate the production function relationship between crop yield and managed bee use per area. Similarly for Wisconsin cranberry, records kept by producers may be the only source of historical time-series data on crop yields [69].
The wild bee pollination of crops can be valued in terms of some proportion of the crop value (PV) or profit (ANIwb), or in terms of the costs of procuring pollination services (RC), as described above. In today’s consumer-conscious market, growers should also consider the value of wild bee-pollinated foods to the consumers themselves. We assessed this value to Massachusetts cranberries and Maine wild blueberries through consumer willingness-to-pay surveys. Consumers are willing to pay 14% more for Maine wild blueberries that have been pollinated by wild bees, and 8.35% more for Massachusetts cranberries that have been pollinated by wild bees. Using our survey-based production value estimates for each crop, this means that wild bee-pollinated cranberries are worth an additional $1179/ha, and Maine wild blueberries pollinated by wild bees are worth an additional $888/ha.
Considering the three production and producer-based valuation methods, RC sets the low end estimate, and PV sets the high end estimate. Then, in Massachusetts cranberry, the value of pollinators (managed and wild) to the crop is between $287 and $13,991/ha. ANIwb is in between, at $689/ha for Massachusetts cranberry. Our consumer-based willingness-to-pay offers a fifth way to value the worth of wild bees to crop production ($1179/ha), and also falls within the range we present above. In Maine wild blueberry, the value of managed and wild bees to the crop is between $992–$5953/ha. Unlike cranberry, ANIwb for wild blueberry at $613/ha is less than RC ($992/ha) due to the greater honey bee hive stocking density required and the higher price of honey bee hive rentals. However, consumer willingness to pay for wild bee-pollinated Maine wild blueberries is $888/ha, which is within the range we present (Table 6).

4.2. Implications for Policy and Pollination Security

Our surveys found that many cranberry and wild blueberry growers in the northeastern United States of America are not yet willing to significantly invest in wild bee pollination strategies. In fact, consumers are willing to pay more for wild bee-pollinated crops than growers are willing to invest in wild bee pollination strategies. In both crops, berry prices are currently following a steep downward trajectory, and producers may have only limited capital from variable profits [65] to make an investment in wild bee pollination. However, these decreasing profit margins, the greater availability of government cost-share programs, the regulatory predictability of the Endangered Species Act for listed pollinators, and the possibility of added-value for wild bee-pollinated food through the new Bee Better Certified program [76] all may bring USA growers closer to adoption of wild bee pollination strategies.
In Maine, eligible producers are increasingly taking advantage of USDA-NRCS (United States Department of Agriculture—Natural Resources Conservation Service) cost-share programs. Similar to Europe’s Agri-Environmental schemes [77], these USA government assistance programs provide technical and financial assistance to growers to manage farm habitats that support greater populations of wild pollinators. In theory, this will increase the abundance and diversity of wild crop pollinators, and decrease growers’ expenditures for honey bee hive rentals as more abundant wild bee populations supplant honey bees [78]. In practice, the research supports the idea that creating habitats for pollinators on-farm can increase pollinator diversity [79], abundance [80,81], population stability [82], and measures of pollination service that include fruit quality, fruit set, and yield [62,83,84].
In 2018, USA government support for pollinator-focused USDA-NRCS practices (e.g., pollinator hedgerows, pollinator conservation cover) increased significantly. Cost-share payments are made to growers as a percentage (approximately 60–75%) of the total estimated cost of the practice. In 2017, the estimated cost of planting one hectare of wildflowers through government cost-share programs ranged between $1119 and $1989. Across the USA in 2018, this rate increased by 174–221%, to $1945–4411/ha [85]. In the state of Maine, as a direct result of this increased payment rate, an initiative program (the Maine Pollinator Initiative), and increased outreach and capacity for technical support, the number of producers planting habitat for pollinators increased by approximately 600% [86]. However, this estimate is across sectors, and includes mixed vegetable growers, forestry producers, apple growers, and blueberry growers.
On 21 March 2017, the United States Fish and Wildlife Service (USFWS) declared the rusty-patched bumble bee (Bombus affinis) a federally endangered species. Listing as an endangered species comes with stringent protections for the species [87]. The rusty-patched bumble bee was once common in both Maine’s wild blueberry fields and also in Massachusetts cranberry bogs. The USFWS is set to make a determination on a second species, the yellow-banded bumble bee (Bombus terricola), in September 2018. These listings have growers concerned that changes in management could be prescribed by the USFWS to help recover these species. To alleviate concern and protect the species, the Maine USDA-NRCS has spearheaded a regional proposal across six northeastern USA states to create a Working Lands for Wildlife program. This program would further incentivize pollinator conservation by producers, provide guidance to protect pollinators on farmland, and in turn, provide participating producers with some level of liability protection from take. This program, if enacted, could provide growers with an additional justification for creating pollinator habitat on farmland.
Market prices for both cranberry and wild blueberries have declined sharply in the last several years. Some Maine blueberry growers are leaving fields unharvested because their return from the product no longer pays for the cost of harvesting. Cranberry producers are exploring options to restore commercial cranberry bogs back to native bogs; in some cases, the cost of harvesting is no longer economically justified. These drops in processed berry prices on one hand make cash-strapped growers less likely to invest the capital required to shift from honey bee to wild bee pollination systems. On the other hand, honey bee hive rental can comprise a significant part (35% for wild blueberry; 7% for cranberry) of growers’ variable costs. Once growers do make the shift to a wild bee-centric crop pollination model, annual honey bee rental numbers should decline, saving growers’ money and time.
Finally, the Xerces Society for Invertebrate Conservation’s new Bee Better Certified program offers those growers that conserve pollinators through adaptive management and habitat creation an opportunity to increase the value of their product through labeling. As this certification standard grows in popularity, it will add one more factor entering into growers’ decisions on whether or not to adopt a wild bee-centric pollination model. According to this study, consumers are willing to pay a ≈10% premium for blueberries and cranberries pollinated by wild bees—a premium that may be realized through eco-labeling. Our consumer willingness-to-pay surveys may be biased toward those more likely to participate in online marketplaces (higher income, more education), and may not be exactly representative of wild blueberry and cranberry consumers. So, better quantification of wild bee-pollinated eco-label price premiums using additional surveys and/or focus groups of these crop-specific consumers is warranted.

5. Conclusions

Pollination valuation metrics each have limitations, but when evaluated together, they can be insightful. Pollination hive rental data is available to calculate replacement cost; however, the perfect substitution of rented honey bees for wild bees is not always valid. Production value and net farm income capture catastrophic pollinator collapse and subsequent crop losses; however, both indicators may not be attributable exclusively to wild pollinators. The attributable net income from wild bees can be calculated from the contribution to crop pollination from wild bees versus managed honey bees using both entomological field surveys in addition to producer surveys; however, the responsiveness of a crop to wild bee pollination is not distinguished. Marginal profit using production functions can be used to determine the optimal level of pollination services, and when estimated from producer surveys, rented honey bee hives serve as a proxy for wild pollination until field data for the incremental marginal value of wild bees exists. We propose using marginal profit to distinguish the greater value of optimal pollinator input use from diminishing returns from higher pollinator densities.
Between 83% of Massachusetts, USA, cranberry and 93% of Maine, USA, wild blueberry producers rated wild bees as being very important or important in our surveys. Despite this recognition of the critical role of wild pollinators in their crop’s production, surveyed producers were less able to invest in wild bee conservation practices on their farms. Producers’ level of investment of $140–188/ha was only ≈15% of what consumers of these crops were willing to pay for wild bee pollination, and only ≈25% of the attributable net income from wild bees per hectare. Government cost share and the federal protection of endangered pollinators can continue to encourage more agricultural producers to install pollinator habitats on their farms. Additional support can come from higher prices that consumers are willing to pay for eco-labeled wild bee pollinated crops.

Supplementary Materials

The following are available online at https://www.mdpi.com/2076-3298/5/9/98/s1, Table S1: Producer survey questions for Maine, USA, wild blueberry, Table S2: Producer survey questions for Massachusetts, USA, cranberry, Table S3: Supplemental producer survey questions for Massachusetts, USA, cranberry, Table S4: Representative enterprise budget for 40.4686 hectare Maine, USA, wild blueberry farm selling berries for frozen processing, Table S5: Representative enterprise budget or 40.4686 hectare Massachusetts, USA, cranberry farm selling berries for processing, Table S6: Consumer willingness to pay survey for USA blueberry showing example scenario options A, B, C, and D, Table S7: Consumer willingness to pay survey for USA cranberry.

Author Contributions

Conceptualization, A.K.H., F.A.D., T.H.S.; Methodology, Software, & Formal Analysis, A.K.H., F.A.D., T.H.S.; C.S.L.; Validation, F.A.D.; Investigation, A.K.H, S.P.H. and M.M.S.; Resources, E.M.V., C.S.L. and D.E.Y.; Data Acquisition, A.K.H., F.A.D., T.H.S., S.P.H., M.M.S., C.S.L. and D.E.Y.; Writing-Original Draft Preparation, A.K.H., E.M.V., T.H.S. and F.A.D.; Writing-Review & Editing, All co-authors; Visualization, C.S.L.; Supervision, Project Administration, & Funding Acquisition, F.A.D. and A.L.A.

Funding

This research was made possible through support from a U.S. Department of Agriculture, National Institute for Food and Agriculture, Specialty Crop Research Initiative Grant #2011-01389. The survey was conducted under University of Maine Human Subjects protocol #2012-06-09. Mention of trade names and commercial parts does not constitute endorsement or recommendation for use by the U.S. Government. This is Maine Agricultural and Forestry Experiment Station Journal No. 3618.

Acknowledgments

The authors would first and foremost thank cooperating Maine wild blueberry and Massachusetts cranberry producers for surveys and on-farm interviews. We also thank Eric Asare and Kourtney Collum for entering survey data, Michael Pizzi for running consumer survey statistical analyses, Carolyn DeMoranville, Hilary Sandler and Tony Jadczak for their input, and Robb Freeman and Alison Dibble as well as two anonymous reviewers for helpful clarification, comments and edits.

Conflicts of Interest

The authors declare no conflict of interest. The funders had no role in the design of the study; in the collection, analyses, or interpretation of data; in the writing of the manuscript, and in the decision to publish the results.

References

  1. NRC (National Resource Council) of the National Academies. Status of Pollinators in North America; Committee on the Status of Pollinators in North America, Board of Life Sciences, Board of Agriculture and Natural Resources, Division on Earth and Life Studies, National Research Council of the National Academies, National Academies Press: Washington, DC, USA, 2007; pp. 1–307. ISBN 13 978-0-309-10289-6. [Google Scholar]
  2. Allen-Wardell, G.; Bernhardt, P.; Bitner, R.; Burquez, A.; Buchmann, S.; Cane, J.; Cox, P.A.; Dalton, V.; Feinsinger, P.; Ingram, M.; et al. The potential consequences of pollinator declines on the conservation of biodiversity and stability of food crop yields. Conserv. Biol. 1998, 12, 8–17. [Google Scholar] [CrossRef]
  3. Jones, M.S.; Vanhanen, H.; Peltola, R.; Drummond, F.A. A global review of arthropod-mediated ecosystem-services in Vaccinium berry agroecosystems. Terrestrial Arthopod Rev. 2014, 7, 41–78. [Google Scholar] [CrossRef]
  4. Aizen, M.A.; Garibaldi, L.A.; Cunningham, S.A.; Klein, A.-M. How much does agriculture depend on pollinators? Lessons from long-term trends in crop production. Ann. Bot. 2009, 103, 1579–1588. [Google Scholar] [CrossRef] [PubMed] [Green Version]
  5. Van Engelsdorp, D.; Meixner, M.D. A historical review of managed honey bee populations in Europe and the United States and the factors that may affect them. J. Inverteb. Path. 2010, 103, S80–S95. [Google Scholar] [CrossRef] [PubMed]
  6. De Guzman, L.I.; Rinderer, T.E.; Stelzer, J.A. DNA evidence of the origin of Varroa jacobsoni Oudemans in the Americas. Biochem. Genet. 1997, 35, 327–335. [Google Scholar] [CrossRef] [PubMed]
  7. Johnson, R. Recent Honey Bee Declines; CRS Report for Congress; Library of Congress: Washington, DC, USA, 2007; pp. 1–17. [Google Scholar]
  8. Cox-Foster, D.; Conlan, S.; Holmes, E.C.; Palacios, G.; Evans, J.D.; Moran, N.A.; Quan, P.-L.; Briese, T.; Hornig, M.; Geiser, D.M.; et al. A metagenomic survey of microbes in honey bee Colony Collapse Disorder. Science 2007, 318, 283–287. [Google Scholar] [CrossRef] [PubMed]
  9. VanEngelsdorp, D.; Speybroeck, N.; Evans, J.D.; Nguyen, B.K.; Mullin, C.; Frazer, M.; Frazier, J.; Cox-Foster, D.; Chen, Y.; Tarpy, D.R.; et al. Weighing risk factors associated with bee Colony Collapse Disorder by classification and regression tree analysis. J. Econ. Entomol. 2010, 103, 1517–1523. [Google Scholar] [CrossRef] [PubMed]
  10. Garibaldi, L.A.; Stefan-Dewenter, I.; Winfree, R.; Aizen, M.A.; Bommarco, R.; Cunningham, S.A.; Kremen, C.; Carvalheiro, L.G.; Harder, L.D.; Afik, O.; et al. Wild pollinators enhance fruit set of crops regardless of honey bee abundance. Science 2013, 339, 1608–1611. [Google Scholar] [CrossRef] [PubMed]
  11. Koh, I.; Lonsdorf, E.V.; Williams, N.M.; Brittain, C.; Isaacs, R.; Gibbs, J.; Ricketts, T.H. Modeling the status, trends, and impacts of wild bee abundance in the United States. Proc. Natl. Acad. Sci. USA 2016, 113, 140–145. [Google Scholar] [CrossRef] [PubMed]
  12. Colla, S.R.; Packer, L. Evidence for decline in eastern North American bumblebees (Hymenoptera: Apidae), with special focus on Bombus affinis Cresson. Biodiv. Conserv. 2008, 17, 1379–1391. [Google Scholar] [CrossRef]
  13. Goulson, D.; Lye, G.C.; Darvill, B. Decline and conservation of bumble bees. Ann. Rev. Entomol. 2008, 53, 191–208. [Google Scholar] [CrossRef] [PubMed]
  14. Lebuhn, G.; Droege, S.; Connor, E.F.; Gemmill-Herren, B.; Potts, S.G.; Minckley, R.L.; Griswold, T.; Jean, R.; Kula, E.; Roubik, D.W.; et al. Detecting insect pollinator declines on regional and global scales. Conserv. Biol. 2013, 27, 113–120. [Google Scholar] [CrossRef] [PubMed]
  15. Obama, B. Presidential Memorandum—Creating a Federal Strategy to Promote the Health of Honey Bees and Other Pollinators; The White House: Washington, DC, USA, 2014. [Google Scholar]
  16. Winfree, R.; Gross, B.J.; Kremen, C. Valuing pollination services to agriculture. Ecol. Econ. 2011, 71, 80–88. [Google Scholar] [CrossRef]
  17. Garibaldi, L.A.; Carvalheiro, L.G.; Vaissière, B.E.; Gemmill-Herren, B.; Hipólito, J.; Freitas, B.M.; Ngo, H.T.; Azzu, N.; Sáez, A.; Åström, J.; et al. Mutually beneficial pollinator diversity and crop yield outcomes in small and large farms. Science 2016, 351, 388–391. [Google Scholar] [CrossRef] [PubMed]
  18. Stubbs, C.S.; Drummond, F.A. Management of the alfalfa leafcutter bee, Megachile rotundata (Hymenoptera: Megachilidae), for pollination of wild lowbush blueberry. J. Kansas Entomol. Soc. 1997, 70, 81–93. [Google Scholar]
  19. Drummond, F.A. Commercial bumble bee pollination of lowbush blueberry. Int. J. Fruit Sci. 2012, 12, 54–64. [Google Scholar] [CrossRef]
  20. Bushmann, S.L. Wild Bee (Hymenoptera: Apoidea) Communities Associated with the Lowbush Blueberry Agroecosystem of Maine. Ph.D. Thesis, University of Maine, Orono, ME, USA, 2013; 146p. [Google Scholar]
  21. Rucker, R.R.; Thurman, W.N.; Burgett, M. Honey bee pollination markets and the internalization of reciprocal benefits. Am. J. Agric. Econ. 2012, 94, 956–977. [Google Scholar] [CrossRef]
  22. Caron, D.M. Bee Colony Pollination Rental Prices, Eastern US with Comparison to West Coast; University of Delaware: Newark, DE, USA, 2011; p. 4. [Google Scholar]
  23. Kasina, J.M.; Mburu, J.; Kraemer, M.; Holm-Mueller, K. Economic benefit of crop pollination by bees: A case of Kakamega small-holder farming in western Kenya. J. Econ. Entomol. 2009, 102, 467–473. [Google Scholar] [CrossRef] [PubMed]
  24. Ricketts, T.H.; Daily, G.C.; Ehrlich, P.R.; Michener, C.D. Economic value of tropical forest to coffee production. Proc. Natl. Acad. Sci. USA 2004, 101, 12579–12582. [Google Scholar] [CrossRef] [PubMed] [Green Version]
  25. Allsopp, M.H.; de Lange, W.J.; Veldtman, R. Valuing insect pollination services with cost of replacement. PLoS ONE 2008, 3, e3128. [Google Scholar] [CrossRef] [PubMed]
  26. Mburu, J.; Hein, L.G.; Gemmill, B.; Collette, L. Economic Valuation of Pollination Services: Review of Methods; Food and Agriculture Organization of the United Nations: Rome, Italy, 2006; p. 43. [Google Scholar]
  27. Southwick, E.E.; Southwick, L., Jr. Estimating the economic value of honey bees (Hymenoptera: Apidae) as agricultural pollinators in the United States. J. Econ. Entomol. 1992, 85, 621–633. [Google Scholar] [CrossRef]
  28. Morse, R.A.; Calderone, N.W. The Value of Honey Bees as Pollinators of U.S. Crops. Pollination 2000; Cornell University: Ithaca, NY, USA, 2000; p. 15. [Google Scholar]
  29. Olschewski, R.; Tscharntke, T.; Benitez, P.C.; Schwarze, S.; Klein, A.-M. Economic evaluation of pollination services comparing coffee landscapes in Ecuador and Indonesia. Ecol. Soc. 2006, 11, 7:1–7:14. [Google Scholar] [CrossRef]
  30. Stevens, T.H.; Hoshide, A.K.; Drummond, F.A. Willingness to pay for native pollination of blueberries: A conjoint analysis. Int. J. Agric. Mark. 2015, 2, 68–77. [Google Scholar]
  31. Breeze, T.D.; Bailey, A.; Potts, S.G.; Balcombe, K. A stated preference valuation of the non-market benefits of pollination services in the UK. Ecol. Econ. 2015, 111, 76–85. [Google Scholar] [CrossRef]
  32. Kasina, J. Bee Pollinators and Economic Importance of Pollination in Crop Production: Case of Kakamega, Western Kenya. Ph.D. Thesis, University of Bonn, Bonn, Germany, 2007; p. 152. [Google Scholar]
  33. USDA NASS (U.S. Department of Agriculture, National Agricultural Statistics Service). 1982–2012. Statistics by State; Census of Agriculture; Honey. NASS, Agricultural Statistics Board, USDA. Available online: https://www.nass.usda.gov/ (accessed on 30 June 2018).
  34. Yarborough, D.E.; University of Maine, Orono, ME, USA. Personal communication, 2015.
  35. Seeley, T.D.; Tarpy, D.R.; Griffin, S.R.; Carcione, A.; Delaney, D.A. A survivor population of wild colonies of European honeybees in the northeastern United States: Investigating its genetic structure. Apidologie 2015, 46, 654–666. [Google Scholar] [CrossRef]
  36. Averill, A.; University of Massachusetts, Amherst, MA, USA. Personal communication, unpublished data. 2015.
  37. Drummond, F.A.; University of Maine, Orono, ME, USA. Personal communication, unpublished data. 2018.
  38. Loose, J.L.; Drummond, F.A.; Stubbs, C.; Woods, S.; Hoffmann, S. Conservation and Management of Native bees in Cranberry, MAFES Technical Bulletin 191; University of Maine: Orono, ME, USA, 2005; p. 43. [Google Scholar]
  39. Bushmann, S.L.; Drummond, F.A.; Beers, L.A.; Groden, E. Wild bumblebee (Bombus) diversity and Nosema (Microsporidia: Nosematidae) infection levels associated with lowbush blueberry (Vaccinium angustifolium) production and commercial bumblebee pollinators. Psyche 2012, 2012, 429398:1–429398:11. [Google Scholar] [CrossRef]
  40. Chapin, S. The Application of Spatial Modeling Tools to Predict Native Bee Abundance in Maine’s Lowbush Blueberries. Master Thesis, Ecology and Environmental Science, The University of Maine, Orono, ME, USA, 2014. [Google Scholar]
  41. Massachusetts Land Use Dataset. Available online: www.mass.gov/ (accessed on 15 March 2015).
  42. Rose, A.; Drummond, F.A.; Yarborough, D.E.; Asare, E. Maine Wild Blueberry Growers: A 2010 Economic and Sociological Analysis of a Traditional Downeast Crop in Transition; Maine Agricultural & Forest Experiment Station Miscellaneous Report 445; University of Maine: Orono, ME, USA, 2013. [Google Scholar]
  43. Constantine, P.; Faidell, K.; Pereira, D. The Grower Study II: Innovations, Viability, and the Future of the Massachusetts Cranberry Bogs; University of Massachusetts Dartmouth Center for Marketing Research: Dartmouth, MA, USA, 2006. [Google Scholar]
  44. Jadczak, T.; Maine Department of Agriculture, Augusta, ME, USA. Personal communication, 2014.
  45. Gaines-Day, H.R.; Gratton, C. Biotic and abiotic factors contribute to cranberry pollination. J. Poll. Ecol. 2015, 15, 15–22. [Google Scholar]
  46. FCE (Farm Credit East). Massachusetts Cranberry Cost of Production Study: 2010 Crop Year; Farm Credit East: Enfield, CT, USA, 2010; 22p. [Google Scholar]
  47. Yarborough, D.E.; DeGomez, T.; Hoelper, A.L. Marketing and Business Management–260–Blueberry Enterprise Budget; Fact Sheet No. 260; University of Maine Extension No. 201; University of Maine: Orono, ME, USA, 2011. [Google Scholar]
  48. Asare, E. The Economic Impacts of Bee Pollination on the Profitability of the Lowbush Blueberry Industry in Maine. Master’s Thesis, The University of Maine, Orono, ME, USA, 2013. [Google Scholar]
  49. MacKenzie, K.E.; Averill, A.L. Bee (Hymenoptera: Apoidea) diversity and abundance on cranberry in southeastern Massachusetts. Ann. Entomol. Soc. Am. 1995, 88, 334–341. [Google Scholar] [CrossRef]
  50. Notestine, M.M. Pollinator Population in Massachusetts Cranberry, 1990 to 2009: Changes in Diversity and Abundance, Effects of Agricultural Intensification, and a Contribution to the North American Population Survey. Master’s Thesis, Plant and Soil Science, University of Massachusetts, Amherst, MA, USA, 2010; 63p. [Google Scholar]
  51. Drummond, F.A. Honeybees and Lowbush Blueberry Pollination; Fact Sheet No. 629; University of Maine Extension No. 2079; University of Maine: Orono, ME, USA, 2002. [Google Scholar]
  52. Beattie, B.R.; Taylor, C.R. The Economics of Production; Krieger Publishing Company: Malabar, FL, USA, 1985; ISBN 0-89464-534-X. [Google Scholar]
  53. Eaton, L.J.; Nams, V.O. Honey bee stocking numbers and wild blueberry production in Nova Scotia. Can. J. Plant Sci. 2012, 92, 1305–1310. [Google Scholar] [CrossRef]
  54. Stevens, T.H.; Tabatabaei, M.; Lass, D. Oaths and hypothetical bias. J. Environ. Manag. 2013, 127, 135–141. [Google Scholar] [CrossRef] [PubMed]
  55. Poe, G.L.; Clark, J.E.; Rondeau, D.; Schulze, W.D. Provision point mechanisms and field validity tests of contingent valuation. Environ. Res. Econ. 2002, 23, 105–131. [Google Scholar] [CrossRef]
  56. DeMoranville, C.; UMass Cranberry Station, East Wareham, MA, USA. Personal communication, 2015.
  57. Javoreck, S.K.; Mackenzie, K.E.; Vander Kloet, S.P. Comparative pollination effectiveness among bees (Hymenoptera: Apoidea) on lowbush blueberry (Ericaeae: Vaccinium angustifolium). Ann. Entomol. Soc. Am. 2002, 95, 345–351. [Google Scholar] [CrossRef]
  58. Drummond, F.A. Behavior of Bees Associated with the Wild Blueberry Agro-ecosystem in the USA. Int. Entomol. Nematol. 2016, 2, 27–41. [Google Scholar]
  59. Bell, D.J. Spatial and Genetic Factors Influencing Yield in Lowbush Blueberry (Vaccinium angustifolium Ait.) in Maine. Ph.D. Thesis, School of Biological Sciences, University of Maine, Orono, ME, USA, 2009. [Google Scholar]
  60. Venturini, E.M.; Drummond, F.A.; Hoshide, A.K. Organic establishment of pollination reservoirs in lowbush blueberry (Ericales: Ericaceae). Open Agric. 2018. under review. [Google Scholar]
  61. Asare, E.; Hoshide, A.K.; Drummond, F.A.; Criner, G.K.; Chen, X. Economic risks of bee pollination in Maine wild blueberry, Vaccinium angustifolium Aiton. J. Econ. Entomol. 2017, 110, 1980–1992. [Google Scholar] [CrossRef] [PubMed]
  62. Venturini, E.M.; Drummond, F.A.; Hoshide, A.K.; Dibble, A.C.; Stack, L.B. Pollination reservoirs for wild bee habitat enhancement in cropping systems: A review. Agroecol. Sust. Food Syst. 2017, 41, 101–142. [Google Scholar] [CrossRef]
  63. Brittain, C.; Williams, N.; Kremen, C.; Klein, A.-M. Synergistic effects of non-Apis bees and honey bees for pollination services. Proceed. R. Soc. B 2013, 280, 20122767. [Google Scholar] [CrossRef] [PubMed]
  64. Greenleaf, S.S.; Kremen, C. Wild bees enhance honey bees’ pollination of hybrid sunflower. Proc. Natl. Acad. Sci. USA 2006, 103, 13890–13895. [Google Scholar] [CrossRef] [PubMed]
  65. Richards, K.W.; Kevan, P.G. Aspects of bee biodiversity, crop pollination, and conservation in Canada. In Pollinating Bees—The Conservation Link between Agriculture and Nature; Kevan, P., Fonseca, I., Eds.; Ministry of Environment: Brasilia, Brazil, 2002; pp. 77–94. [Google Scholar]
  66. Riedinger, V.; Mitesser, O.; Hovestadt, T.; Steffan-Dewenter, I.; Holzschuh, A. Annual dynamics of wild bee densities: Attractiveness and productivity effects of oilseed rape. Ecology 2015, 96, 1351–1360. [Google Scholar] [CrossRef] [PubMed]
  67. Franzén, M.; Nilsson, S.G. High population variability and source-sink dynamics in a solitary bee species. Ecology 2013, 94, 1400–1408. [Google Scholar] [CrossRef] [PubMed]
  68. Winfree, R. The conservation and restoration of wild bees. Ann. N. Y. Acad. Sci. 2010, 1195, 169–197. [Google Scholar] [CrossRef] [PubMed]
  69. Gaines-Day, H.R.; Gratton, C. Crop yield is correlated with honey bee hive density but not in high-woodland landscapes. Agric. Ecosys. Environ. 2016, 218, 53–57. [Google Scholar] [CrossRef]
  70. Koh, I.; Lonsdorf, E.V.; Atrz, D.R.; Pitts-Singer, T.L.; Ricketts, T.H. Ecology and economics of using native managed bees for almond pollination. J. Econ. Entomol. 2018, 111, 16–25. [Google Scholar] [CrossRef] [PubMed]
  71. Groff, S.C.; Loftin, C.S.; Drummond, F.A.; Bushmann, S.; McGill, B. Spatial prediction of lowbush blueberry native bee pollinators in Maine, USA. Environ. Modell. Softw. 2016, 79, 1–9. [Google Scholar] [CrossRef]
  72. Dibble, A.C.; Drummond, F.A.; Averill, A.L.; Bickerman-Martens, K.; Bosworth, S.C.; Bushmann, S.L.; Hoshide, A.K.; Leach, M.E.; Skyrm, K.; Venturini, E.; et al. Bees and Their Habitats in Four New England States; Miscellaneous Report 448; Maine Agricultural and Forest Experiment Station, The University of Maine: Orono, ME, USA, 2018. [Google Scholar]
  73. Hanes, S.P.; Collum, K.; Hoshide, A.K.; Asare, E. Grower perceptions of native pollinators and pollination strategies in the lowbush blueberry industry. Renew. Agric. Food Syst. 2013, 28, 1–8. [Google Scholar] [CrossRef]
  74. Drummond, F.A.; Dibble, A.C.; Stubbs, C.; Bushmann, S.; Ascher, J.; Ryan, J. A Natural History of Change in Native Bees Associated with Lowbush Blueberry in Maine. Northeast. Nat. 2017, 24, 49–68. [Google Scholar] [CrossRef] [Green Version]
  75. Jessen, R.J. Statistical Investigation of a Sample Survey for Obtaining Farm Facts. Ph.D. Thesis, Iowa State University, Ames, IA, USA, 1943. [Google Scholar]
  76. U.S. Bee Better Certified program. Available online: www.beebettercertified.org/ (accessed on 17 June 2018).
  77. Carvell, C.; Meek, W.R.; Pywell, R.F.; Goulson, D.; Nowakowski, M. Comparing the efficacy of agri-environmental schemes to enhance bumble bee abundance and diversity on arable field margins. J. Appl. Ecol. 2007, 44, 29–40. [Google Scholar] [CrossRef]
  78. Garibaldi, L.A.; Carvalheiro, L.G.; Leonhardt, S.D.; Aizen, M.A.; Blaauw, B.R.; Isaacs, R.; Kuhlmann, M.; Kleijn, D.; Klein, A.-M.; Kremen, C.; et al. From research to action: Enhancing crop yield through wild pollinators. Front. Ecol. Environ. 2014, 12, 439–447. [Google Scholar] [CrossRef]
  79. Williams, N.M.; Ward, K.L.; Pope, N.; Isaacs, R.; Wilson, J.; May, E.A.; Ellis, J.; Daniels, J.; Pence, A.; Ullmann, K.; et al. Native wildflower plantings support wild bee abundance and diversity in agricultural landscapes across the United States. Ecol. Appl. 2015, 25, 2119–2131. [Google Scholar] [CrossRef] [PubMed]
  80. Morandin, L.A.; Kremen, C. Hedgerow restoration promotes pollinator populations and exports native bees to adjacent fields. Ecol. Appl. 2013, 23, 829–839. [Google Scholar] [CrossRef] [PubMed] [Green Version]
  81. Wood, T.J.; Holland, J.M.; Hughes, W.O.; Goulson, D. Targeted agri-environmental schemes significantly improve the population size of common farmland bumblebee species. Mol. Ecol. 2015, 24, 1668–1680. [Google Scholar] [CrossRef] [PubMed]
  82. M’Gonigle, L.K.; Ponisio, L.C.; Cutler, K.; Kremen, C. Habitat restoration promotes pollinator persistence and colonization in intensively managed agriculture. Ecol. Appl. 2015, 25, 1557–1565. [Google Scholar] [CrossRef] [PubMed] [Green Version]
  83. Venturini, E.M.; Drummond, F.A.; Hoshide, A.K.; Dibble, A.C.; Stack, L.B. Pollination reservoirs in lowbush blueberry (Ericales: Ericaceae). J. Econ. Entomol. 2017, 110, 333–346. [Google Scholar] [CrossRef] [PubMed]
  84. Blaauw, B.R.; Isaacs, R. Flower plantings increase wild bee abundance and the pollination services they provided to a pollination-dependent crop. J. Appl. Ecol. 2014, 51, 890–898. [Google Scholar] [CrossRef]
  85. United States Department of Agriculture—Natural Resources Conservation Service. Available online: www.usda.nrcs.gov/ (accessed on 16 June 2018).
  86. Venturini, E.; The Xerces Society for Invertebrate Conservation, Bangor, ME, USA. Personal communication, 2018.
  87. USFWS DOI (United States Fish and Wildlife Service, Department of the Interior). Endangered Species Act of 1973, as Amended through the 108th Congress; Department of the Interior, U.S. Fish and Wildlife Service: Washington, DC, USA, 1973.
Figure 1. Production areas and regions for Massachusetts, United States (USA) cranberries (red) and Maine, USA, wild blueberries (blue).
Environments 05 00098 g001
Figure 2. Annual rented honey bee hive use during 1985–2018 for wild blueberries in Maine, USA, and cranberries in Massachusetts, USA.
Environments 05 00098 g002
Figure 3. Flowchart diagramming relationships between wild bee pollination value metrics.
Environments 05 00098 g003
Figure 4. Production function of crop yield versus hive density for Maine, USA, wild blueberries and Massachusetts, USA, cranberries.
Environments 05 00098 g004
Table 1. Glossary of key economic terms for economic budgeting and valuing wild bee pollination.
Topic:Economic termDefinition
Economic Budgets:
Enterprise budgetSchedule of revenue minus itemized costs calculating farm profit for an enterprise such as a crop.
Total revenueMoney received from farm enterprise sale(s) such as crop yield times price received per yield unit.
Variable costA cost that changes with the annual level of production (e.g., labor, fertilizer, fuel).
Fixed costA cost that does not change with the annual level of production (e.g., capital depreciation, insurance, taxes).
Return over variable costsShort-run profit for a farm or farm enterprise equal to revenue(s) minus variable costs.
Net farm income (NFI)Long-run profit for a farm equal to revenue(s) minus both variable and fixed costs.
Valuing wild bee pollination:
Replacement costValue of wild bee pollination substitute such as managed honey bee hives or bumble bee quads.
Attributable net income wild bees (ANIwb)NFI multiplied by percent of pollination from wild (vs. managed) bees.
Marginal productIncremental change in crop yield from adding more of a production input (e.g., managed hives).
Value of marginal productMarginal product or incremental crop yield change times unit price received for crop.
Marginal profitIncremental change in NFI from adding more of a production input (e.g., honey bee hives).
Production valueTotal crop value multiplied by dependency (d = 0 to 1) on animal-mediated pollination.
Table 2. Comparisons of use and characteristics of pollinators by wild blueberry (BB) producers in Maine, USA and cranberry (CB) growers in Massachusetts, USA using ANOVA and chi-squared tests.
Dependent VariableCrop/EffectMean (Standard Error)Statisticp-Value
(1) Hectares (ha) managed aCrop: BB184.17 (59.50)F(1,143) = 2.6910.103
Crop: CB39.55 (66.01)
(2) Hectares pollinated by wild beesCrop: BB3.05 (0.72)F(1,142) = 5.7310.018
Crop: CB0.51 (0.80)
Hectares managed NS
Hectares × crop NS
(3) Use of honey bee hives by growers (predicts probability not to use hives)Crop-χ2(1) = 7.1610.007
Hectares managed-χ2(1) = 24.757<0.0001
Hectares × crop NS-
(4) Hives/ha of those renting hivesCrop: BB5.31 (0.42)F(1,103) = 12.5160.006
Crop: CB2.92 (0.40)
Hectares managed F(1,103) = 11.6180.0009
Hectares × crop NS
(5) Rental cost of honey bee coloniesCrop: BB$98.44 ($2.40)F(1,77) = 22.261<0.0001
Crop: CB$77.90 ($3.11)
Hectares managed NS
Hectares × crop NS
(6) Expected fruit set by wild beesCrop NS; Crop: BB39.89% (3.34%)
    Crop: CB34.30% (4.04%)
Hectares managed−0.511 X (sqrt ha)F(1,124) = 8.1250.005
Hectares × crop NS
Use of HBno HB = 83.81% (5.02%)F(1,124) = 127.707<0.0001
Use of HB × crop NSHB = 26.96% (1.97%)
a Square root (SQRT) transformed, but means are untransformed.
Table 3. 1998–2012 Maine, USA, wild blueberry (BB) and Massachusetts, USA, cranberry (CB) crop production values of pollination.
2012 Rented Hives aAverage for 1998–2012 Crop Years
MeasureCrop# HB HivesHive Rental CostCost of Replacing Wild Bees with HB (RC)Attributable Net Income Wild Bees aNet Farm Income aProduction Value bPrice/kg bProduction (Million kg) bHarvested Area (ha) b
TotalBB69,800$104.20$7,272,851$5,126,684$12,852,054$55,622,419$1.60734.7199384
CB19,048$78.62$1,508,454$3,507,543$10,226,073$76,835,455$0.93382.0645501
Per haBB9.46$984.91$992 c$613$1536$5953-3704-
CB3.66$286.72$287$689$2009$13,991-14,996-
a From 2012–2013 wild blueberry (n = 80) and 2013–2014 cranberry (n = 66) grower surveys for honey bee (HB) use. b From U.S. Department of Agriculture National Agricultural Statistics Service (1998–2012) and Census of Agriculture [33] (1997, 2002, 2007, 2012). c Estimated by dividing 2012 rented hive value from Maine beekeepers [44] by 2012 harvested wild blueberry cropland from Census of Agriculture [33] (2012).
Table 4. Total and marginal output, revenue, and profit per hectare from adding more rented hives for Maine, USA, wild blueberry and Massachusetts, USA, cranberry.
CropHives/haCrop Yield (kg/ha)Marginal Yield a (kg/ha/hives)Crop Price b ($/kg)Total Revenue ($/ha)Value Marginal Product ($/ha)Variable Costs (VC, $/ha)Hive Rental % of VCFixed Costs ($/ha)Net Farm Income (NFI, $/ha)Marginal Profit (NFI) a ($/ha)
Wild blueberry02396-1.6073851-156501655631-
232368401.60752011350185611.23165516901059
441058691.60765971396215019.39165527921102
649078021.60778861289243825.64165537931002
855756681.60789601074271430.7116554591797
1060855101.6079779819297735.0016555147556
Cranberry010,790-0.93310,070-508906583−1602-
217,69469040.93316,515644553272.95658346056206
424,52068260.93322,885637055655.65658310,7376133
629,45449340.93327,491460557808.16658315,1284390
8 c32,27228180.93330,1212631597110.53658317,5672440
10 c33,67013980.93331,4261305614512.79658318,6981131
a Marginal yield is the incremental change in yield from adding additional rented hives calculated from estimated production function equations in Figure 3. Marginal profit (MP) is the change in NFI for wild bees from incrementally adding hives. b Crop prices are the 1998–2012 average real prices adjusted for inflation using a crop-specific producer price index. c Only one cranberry grower surveyed on 9 April 2013 (n = 66) in East Wareham, Massachusetts stocked 7.41 hives per hectare. University of Massachusetts Cooperative Extension recommendation is to not exceed stocking density of 4.94 hives per hectare.
Table 5. Linear multivariate regression estimates for Maine, USA, wild blueberry (BB) and Massachusetts, USA, cranberry (CB) production functions.
Dependent Variable F-Test & Significance aIndependent VariablesCoefficientStandard Errort-Statistic & Significance aModel It (r2)
BB crop yield (hg/ha)Intercept1822.76242.087.529 ***0.555
F(5,72) = 16.683 ***Hives/acre2038.37434.494.691 ***
Hives/acre2−651.27190.09−3.429 ***
Hives/acre359.5118.103.287 ***
Acres pollinated0.250.092.674 ***
Midcoast growers−869.89402.86−2.159 **
CB crop yield (kg/ha)Intercept12,273.212720.754.511 ***0.508
F(9,60) = 5.863 ***Hives/acre6632.646089.581.089
Hives/acre2−4598.855469.64−0.846
Hives/acre3817.551274.300.642
Acres pollinated10.092.474.176 ***
Early Blacks/Howes b−3187.481475.82−2.160 **
Stevens b4016.681584.322.535 **
Alter pesticide use4531.261832.482.473 **
Leave dead wood3519.361283.492.742 ***
Rent fewer hives−5399.921653.48−3.266 ***
(spillover)
a Significance at p = 0.10 (*), p = 0.05 (**), and p = 0.01 (***). b Cranberry cultivars that are traditional (Early Blacks and Howes) and improved (Stevens).
Table 6. Maine, USA, wild blueberry and Massachusetts, USA, cranberry pollination valuation comparisons.
CropCrop Production Valuations ($/ha)Willing to Pay ($/ha)
Production Value aNet Farm Income (NFI) bAttributable Net Income Wild Bees bReplacement Cost bMarginal NFI for 2 to 4 hives/ha bConsumer cProducer b
Wild blueberry59531536613992 d1102888140
Cranberry13,991200968928761331179188
a From Census of Agriculture [33] (1998–2012) and Census of Agriculture [33] (1997, 2002, 2007, 2012). b From 2012–2013 wild blueberry (n = 80) and cranberry (n = 66) grower surveys of crop production, wild bee pollination, hive use, and amount willing to annually invest in wild bee habitat on-farm. c From 2013 blueberry (n = 498) [30] and 2016 cranberry (n = 771) consumer willingness to pay surveys with 14% (wild blueberry) and 8.4% (cranberry) price premium paid over production value. d Estimated by dividing 2012 rented hive value from Maine beekeepers [44] by 2012 harvested wild blueberry cropland from Census of Agriculture [33] (2012).

