Article

Voltammetric and Spectroscopic Determination of Rare Earth Elements in Fresh and Surface Water Samples

1
Chemistry Department, Faculty of Applied Sciences, Cape Peninsula University of Technology, Bellville 7535, South Africa
2
Scientific Services Consulting Analytical Laboratory, Cape Town 8001, South Africa
3
SensorLab, Department of Chemistry, University of the Western Cape, Bellville 7535, South Africa
*
Author to whom correspondence should be addressed.
Environments 2018, 5(10), 112; https://doi.org/10.3390/environments5100112
Submission received: 5 July 2018 / Revised: 21 August 2018 / Accepted: 22 August 2018 / Published: 9 October 2018
(This article belongs to the Special Issue Environmental Toxicology of Trace Metals)

Abstract

:
The increasing demand for rare earth elements in green technology, electronic components, petroleum refining, and agricultural activities has resulted in their scattering and accumulation in the environment. This study determined cerium, lanthanum and praseodymium in environmental water samples with the help of adsorptive differential pulse stripping voltammetry (AdDPSV) and inductive coupled plasma-optical emission spectroscopy (ICP-OES). A comparison of the results of these two analytical techniques was also made. The accuracy and precision of the methods were evaluated by spiking water samples with a known amount of REEs. The detection limit obtained for the stripping analysis was 0.10 μg/L for Ce(III), and 2.10 μg/L for combined La(III) and Pr(III). The spectroscopic method of determination by ICP-OES was applied to the same samples to evaluate the effectiveness of the voltammetry procedure. The ICP-OES detection limit obtained was 2.45, 3.12 and 3.90 μg/L for Ce(III), La(III) and Pr(III), respectively. The results obtained from the two techniques showed low detection limits in voltammetry; the ICP-OES method achieved better simultaneous analysis. This sensor has been successfully applied for the determination of cerium, lanthanum, and praseodymium in environmental water samples, offering good results.

1. Introduction

Rare earth elements (REEs) make possible the high-tech world we live in today—from the miniaturization of electronics, to the enabling of green energy and medical technologies, to supporting a myriad of essential telecommunication and defense systems. These elements have become irreplaceable in the world of technology, owing to their unique magnetic, phosphorescent, and catalytic properties [1]. They have also gained enormous attention due to their spectroscopic characteristics for advanced new materials. The main environmental risk posed by these elements are tailings, which are a mixture of small-sized particles, wastewater, and floatation chemicals used in the processing stages [2]. Most rare earth elements also consist of radioactive materials, which impose the risk of radioactive dust and water emissions [3]. The abundance of electrical gadgets around us, and agricultural and industrial use of rare earth elements also pose environmental hazards if not properly monitored [4]. Innovations in crop quality after the 1970s were a result of the use of rare earth micro fertilizers. This led to largescale application of the fertilizers for crops such as wheat, rice, maize and mungbean [5], resulting in a large amount of REEs entering the environment. Thus, more attention is now being paid to understanding their environmental and ecological effects. Determining the REE concentrations in different soil profiles and different plant parts is of great value to environmental ecology [6,7].
Excessive amounts of REEs in the environment can have devastating effects on humans, aquatic life, vegetation, and micro fauna. The increased use of REEs in agriculture in some countries has led to their scattering and bioaccumulation in the environment [8,9,10,11]. Soil fauna, which is an important component of the terrestrial ecosystem, plays an important role. While precautionary measures are being put in place to reduce the threats to human health and the environment from radionuclides, little attention is being paid to REEs as another source of radionuclides. The toxicology of REEs to humans, plants, aquatic and other terrestrial organisms is also not well understood [7]. Mining and exploration of REEs are a major source of their scattering in the environment. Studies carried out in China and Spain show that areas near mining activities are heavily polluted with REEs [6,12,13,14]. The geology and chemistry of rare earth elements make their processing after mining a huge task. Their separation and purifying requires several industrial processes and the use of dangerous chemicals such as sulphuric acid and hydrofluoric acid [15]. Huge amounts of wastewater and industrial waste carry radioactive elements, including REEs. In a study, Jinxial et al. [16] revealed that the production of REEs in the Baotau region in China has caused the surface and ground water to be affected by radioactive substances and light rare earth elements (LREEs).
The distribution of REEs in fresh water and sediments differ from place to place, depending on contaminant sources. In normal circumstances, unpolluted fresh water systems should contain minimum traces of REEs. Wood and Shannon [17] carried out a study analyzing REEs to picogram levels in natural waters. They established that REEs can be found in very low concentrations or may need pre-concentration steps to be determined. Several researches on REE determination in sediments and natural waters have found that each source of environmental matrice is different [14,18,19]. The sources of contamination—industrial, mining or agriculture—have different impacts.
Electrochemical techniques, which use sensors to combine selectivity, sensitivity, simplicity and rapidity, offer quick monitoring. However, the chemical complexity of REEs make it difficult for researchers to analyze some RREs using these techniques. The modification of carbon electrodes with metals such as antimony (Sb) [20,21], bismuth (Bi) [22,23] and organic materials [24] have helped to move away from mercury, which is poisonous and an environmental hazard. Technologies used in modification of sensors, conducting polymers, and nanotechnology can be explored to bridge the gap between the problem and the solution.
On the other hand, spectroscopic techniques, such as inductive coupled plasma mass spectrometry (ICP-MS), inductive coupled plasma-optical emission spectrometry (ICP-OES), instrumental neutron activation analysis (INAA), and x-ray fluorescence (XRF) have been applied for REE determination [25,26]. Although they offer good detection capabilities, analysis and capital costs are high. Thus, in order to ensure better research, these techniques should complement each other. According to a review by Zawisa et al. [25], the concentrations of REEs in natural waters normally range from ppb to ppt levels. Two general approaches to analysis of REE in water are employed: separation or enrichment prior to quantification, and direct sample analysis without removing matrix (with or without dilution) [25]. The latter approach was used in this study to evaluate both voltammetry and spectroscopic techniques.
The aim of the present study is to quantify trace amounts of cerium, lanthanum and praseodymium, using a glassy carbon antimony film electrode (GC/SbFE) and ICP-OES analysis of fresh and surface water samples, obtained from an area rich with REE deposits in Northern Cape Province, South Africa. In order to compare our results with the established spectroscopic method, we used Spectro Arcos, a high resolution ICP-OES spectrometer for quantification of the rare earth elements.

2. Materials and Methods

2.1. Water Sampling

The water samples were collected from streams and boreholes that are in close proximity to the rare earth mining activities at the Zandkopsdrift rare earth project in the Namaqualand region of Northern Cape Province, South Africa. Sampling protocols were employed to minimize contamination, retard hydrolysis of chemical compounds and complexes, and reduce volatility of constituents. Proper preservation techniques are paramount to avoid erroneous results [27]. The polyethylene bottles were first rinsed three times at the site with water before each sample was collected [28]. The sampling bottles were filled to the top to remove any air, acidified with HCl solution, placed inside double ziplock bags, and transported in ice to the laboratory [29]. For the blank and recovery test, deionized ultrapure reagent water produced in the laboratory was used. The samples were transported to the laboratory at Scientific Services Consulting Laboratory (Cape Town, South Africa) for spectroscopic analysis. For voltammetric analysis, the same samples were transported to the laboratory at Council for Scientific and Industrial Research (CSIR) Stellenbosch, South Africa, where they were analyzed within 7 days. The samples were stored in a refrigerator at 2–4 °C.

2.2. Analysis of REEs in Water Samples

The prepared solutions were kept in 10 mL glass vials for ICP analysis. During the analysis, an auto sampler (CETAC) was used in the instrument automate mode, where sample sequence including controls are programmed. A fitted peristaltic pump with four channels functioned as a sample inlet system. A segmented flow of liquid was achieved by setting the pump speed. Rinsing between the samples was achieved with a wash solution of 10% HNO3 solution.
The Spectro Arcos ICP-OES, equipped with smart analyzer software, was initialized for about 20 min before analysis, in order to get stable plasma. The ICP-OES measure conditions shown in Table 1 were optimized to get the best conditions for analysis of Ce, La and Pr in water samples. All standards solutions were prepared from high purity 1000 ppm ICP grade standards. The Spectro Arcos ICP-OES is equipped with a side on plasma interface (SPI), commonly known as radial [30]. The sample injection mode was by continuous nebulization and signal processing or line measurement was based on peak height. Polynomial plotting corrected the background. Physical interference, which includes sample nebulization, viscosity and surface tension of sample, was avoided by carefully filtering the sample to clear the solution before analysis. The ICP-OES analyses were carried out in a controlled room of 20 ± 2 °C. The ICP-OES detection limits for Ce, La and Pr were 2.45, 3.12 and 3.90 μg/L, respectively.
The voltammetry determination of Ce(III), La(III) and Pr(III) were performed with an Epsilon electrochemical analyzer (BASI instruments, 2701 Kent Ave., West Lafayette, IN, USA) (https://www.basinc.com/products/ec/Epsilon). Voltammograms were recorded with a UBM PC model, loaded with epsilon chem station software. The three-electrode cell assembly consisted of a substrate glass carbon as the working electrode, a platinum wire as the counter electrode and an Ag/AgCl (3.0 mol/L) as the reference electrode (saturated with NaCl for the voltammetry experiments). All the potentials are reported versus the above-specified reference electrode. Stirring was carried out with a magnetic bar, rotated at approximately 100 rpm. The measurement of pH values during the experiments was carried out by means of a microprocessor pH meter with custom buffers (the model HI 221 series, Hanna, instruments). All weights were measured on a 5-digit analytical balance (Metler model). The differential pulse adsorptive stripping voltammetric (DPAdSV) measurements were carried out in one compartment 20 mL voltammetric cell at controlled temperature of 22 ± 2 °C. It was observed that the reduction potential (Ed) of Ce(III) was −0.2 V (vs. Ag/AgCl) and −0.1 V (vs. Ag/AgCl) for La(III) and Pr(III). The other optimized conditions such as reduction time, complexing agent (Alizarin, ALC) concentration, supporting electrolyte and potential window remained the same for Ce(III), La(III) and Pr(III) throughout the study [20]. The optimized conditions of the differential pulse adsorptive stripping voltammetry (DPAdSV) evaluation of Ce(III), La(III) and Pr(III), applying the GCE/SbF sensor, are displayed in Table 2.
An aliquot of 1 mL of the water sample was added to 9 mL of 0.08 M acetate (pH = 5.8) solution, containing 2 × 10⁻⁶ M ALC and 1 mg L−1 Sb(III) to give a final volume of 10 mL, which was transferred into a voltammetric cell. Subsequently, the analyte was pre-concentrated for 360 s at −0.2 V (vs. Ag/AgCl) for Ce(III) and −0.1V (vs. Ag/AgCl) for La(III) and Pr(III), whilst stirring the solution; a 10 s rest period was applied. All the DPAdSV experiments were performed in the presence of oxygen at room temperature [22,23]. The standards solutions of the REEs were measured in the same manner as the unknown samples. To determine the redox electrochemical signal, the potential was scanned from −0.1 V to 1.1 V (vs. Ag/AgCl). The detection limits (LODs) obtained for the adsorptive stripping analysis was 0.06, 0.42 and 0.71 μg/L for Ce(III), La(III) and Pr(III), respectively. The small sample volume used was to counter the effect of some of the interference that incurred mainly due to competitive accumulation on the electrode surface. The light rare earth elements (LREEs) are usually enriched with both middle rare earth elements (MREEs) and heavy (HREEs) elements of the group [31].

3. Results and Discussion

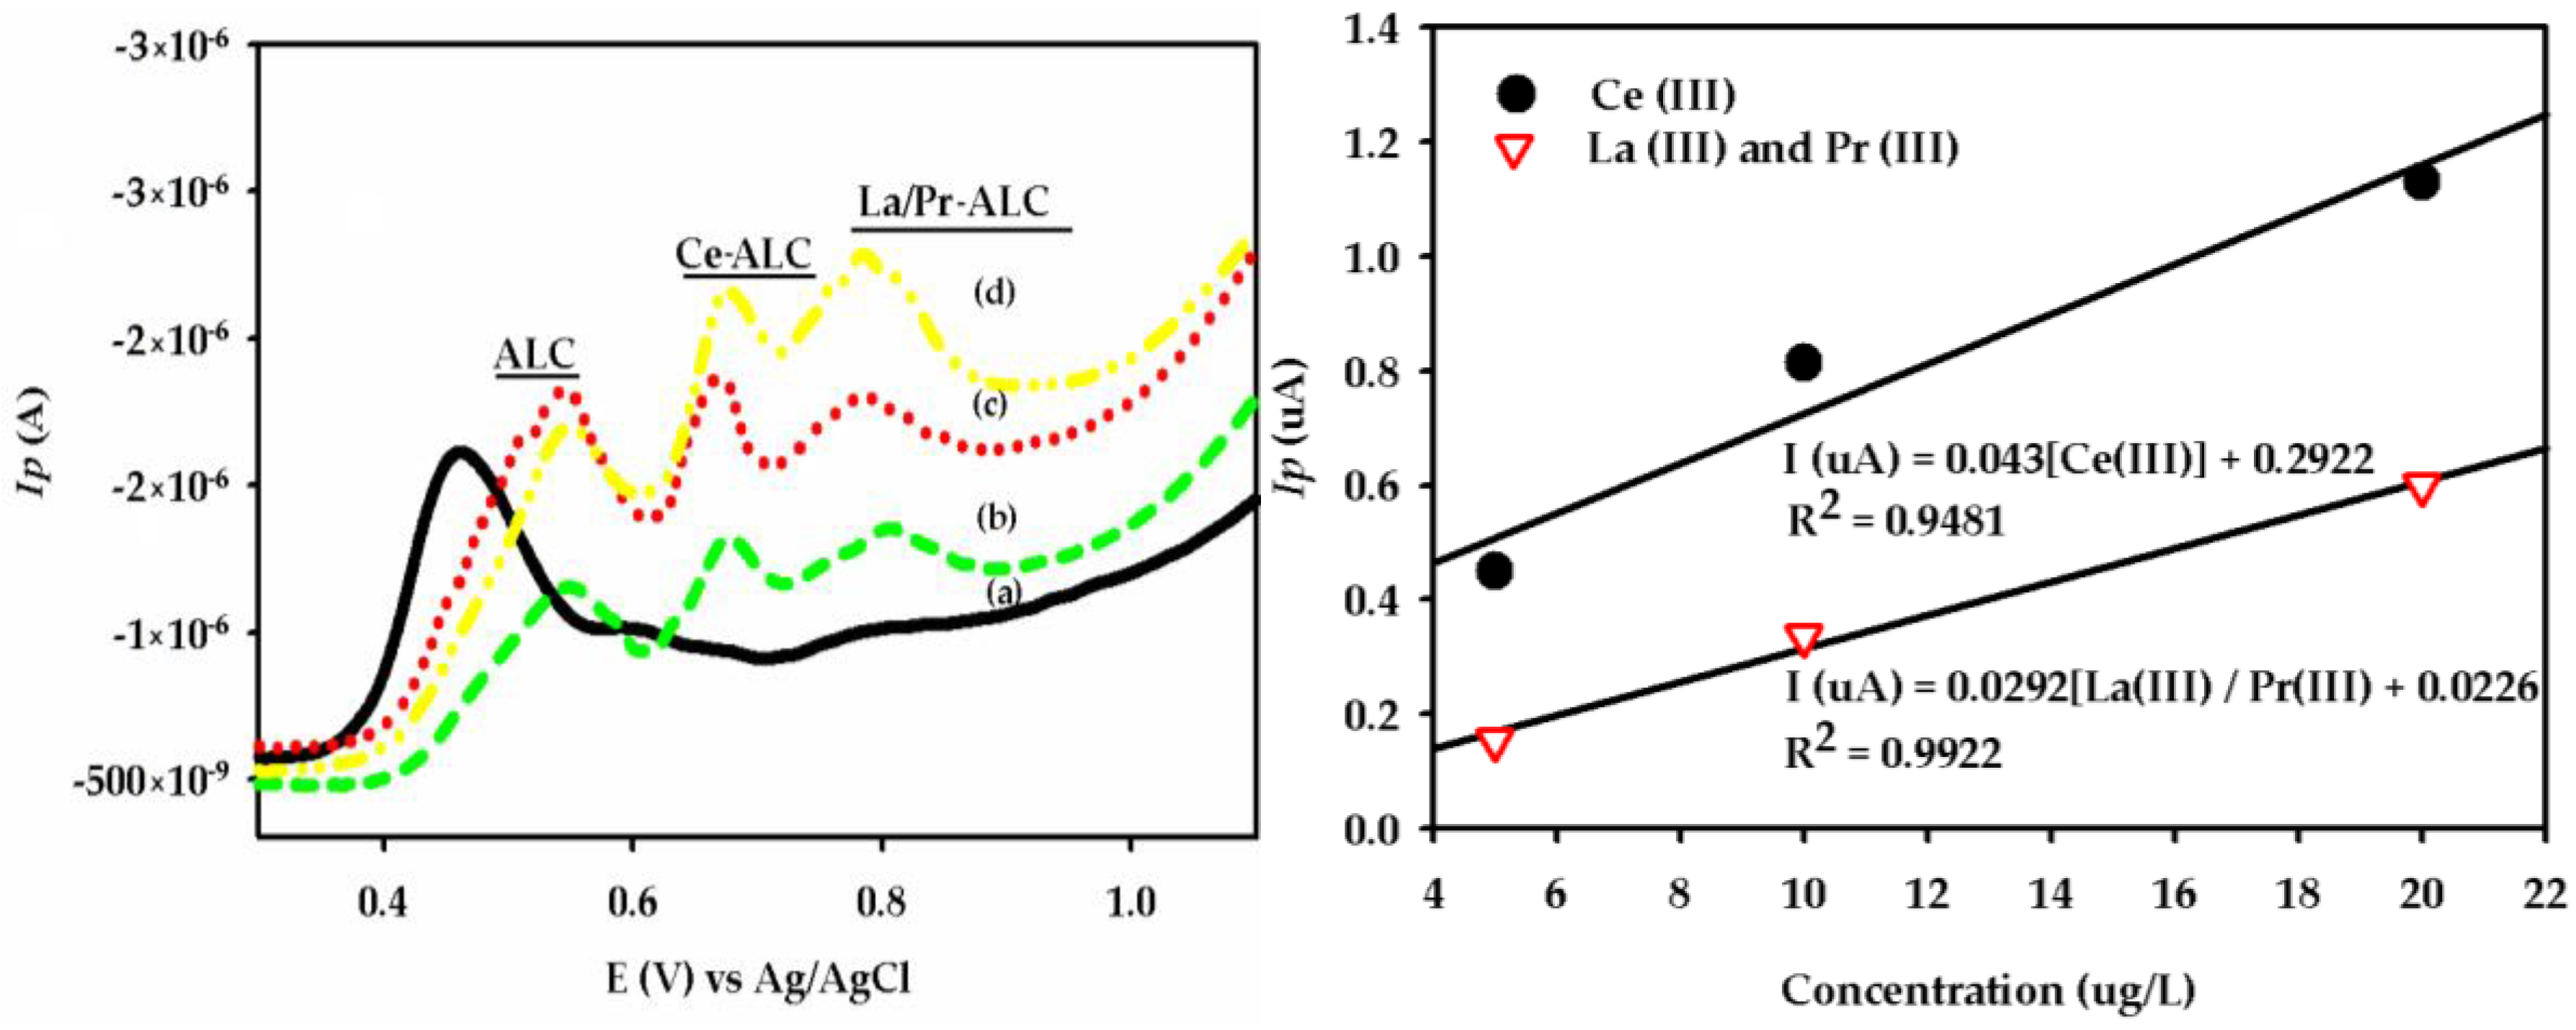
3.1. DPAdSV Analysis

For quantitative determination of the REEs, calibration curves were obtained from the linear relationship between the stripping peak current and the concentration of the REEs. Systematic studies of the various experimental and instrumental parameters that affect the AdSV response were carried out in order to optimize the experimental conditions. The analytical results of Ce(III), La(III) and Pr(III) on the three water samples obtained by the proposed method are illustrated in Table 3. Though the three light rare earth elements (LREE) showed some significant difference in their oxidation potential, it was difficult to analyze La(III) and Pr(III) simultaneously as their peak potentials are separated by only 0.02 V. A single peak was obtained for La(III) and Pr(III); hence, the sum of the two elements was recorded as illustrated by the voltammogram in Figure 1. The combined La(III) and Pr(III) calibration curve was used to calculate the results obtained for La(III) and Pr(III) analysis. The current response for the two elements showed a similar 1:1 ratio under the optimized conditions.
When the experimental recovery test was conducted on tap water and de ionized water, it was found that when La(III) and Pr(III) were combined in a 1:1 ratio, there was one peak; recoveries were low as compared to individual elemental analysis. This showed that these two metals interfere with each other’s adsorption on the glass carbon electrode surface. Furthermore, interference studies were carried out by adding select metal ions and anions, which include Ni(II), Mn(II), Co(II), Pb(II), Zn(II), PO4, NO3 and SO4, to the standard solution and evaluating the results. It was observed that at magnitude twice the concentration of the metal ion under investigation, the cations showed no interference effect. However, NO3 interfered significantly with the REEs than PO4 and SO4. Separation techniques before voltammetric analysis may overcome this problem, as reported elsewhere [32].
Table 3 and Table 4 show the results obtained from the voltammetry and ICP-OES techniques, respectively. Table 3 shows that REEs were not detected for the W-M (work mill) sample. The water from the work mill was purified and hence contained no metal residues. The Ce(III) and combined result of La(III) and Pr(III) in sample CW-H (borehole water) was 142.72 ± 5.65 µg/L and 721.8 ± 16.74 µg/L, respectively. The GRV-AV (stream water) had 36.54 ± 0.62 µg/L Ce(III) and the combined result of La(III) and Pr(III) was 195.32 ± 1.49 µg/L. These results reveal the presence of the metal ions, both in stream and underground water. The borehole water (CW-H) contained more metal ions because of its proximity to a REE rich area and mineralogy and rock formations underground.
Interference studies performed using a GCE/SbF sensor in voltammetric studies revealed that the remaining light rare earth and heavy rare earth elements are oxidized at ALC oxidation peak potential or very close to the ALC peak at approximately 0.50 V (vs. Ag/AgCl). Hence, it can be postulated that the neodymium (Nd(III)), a light rare earth element interferes with La(III) and Pr(III) peaks. No individual standard was available to verify the AdDPSV analysis, although ICP-OES results showed the presence of Nd(III) and traces of samarium (Sm(III)).

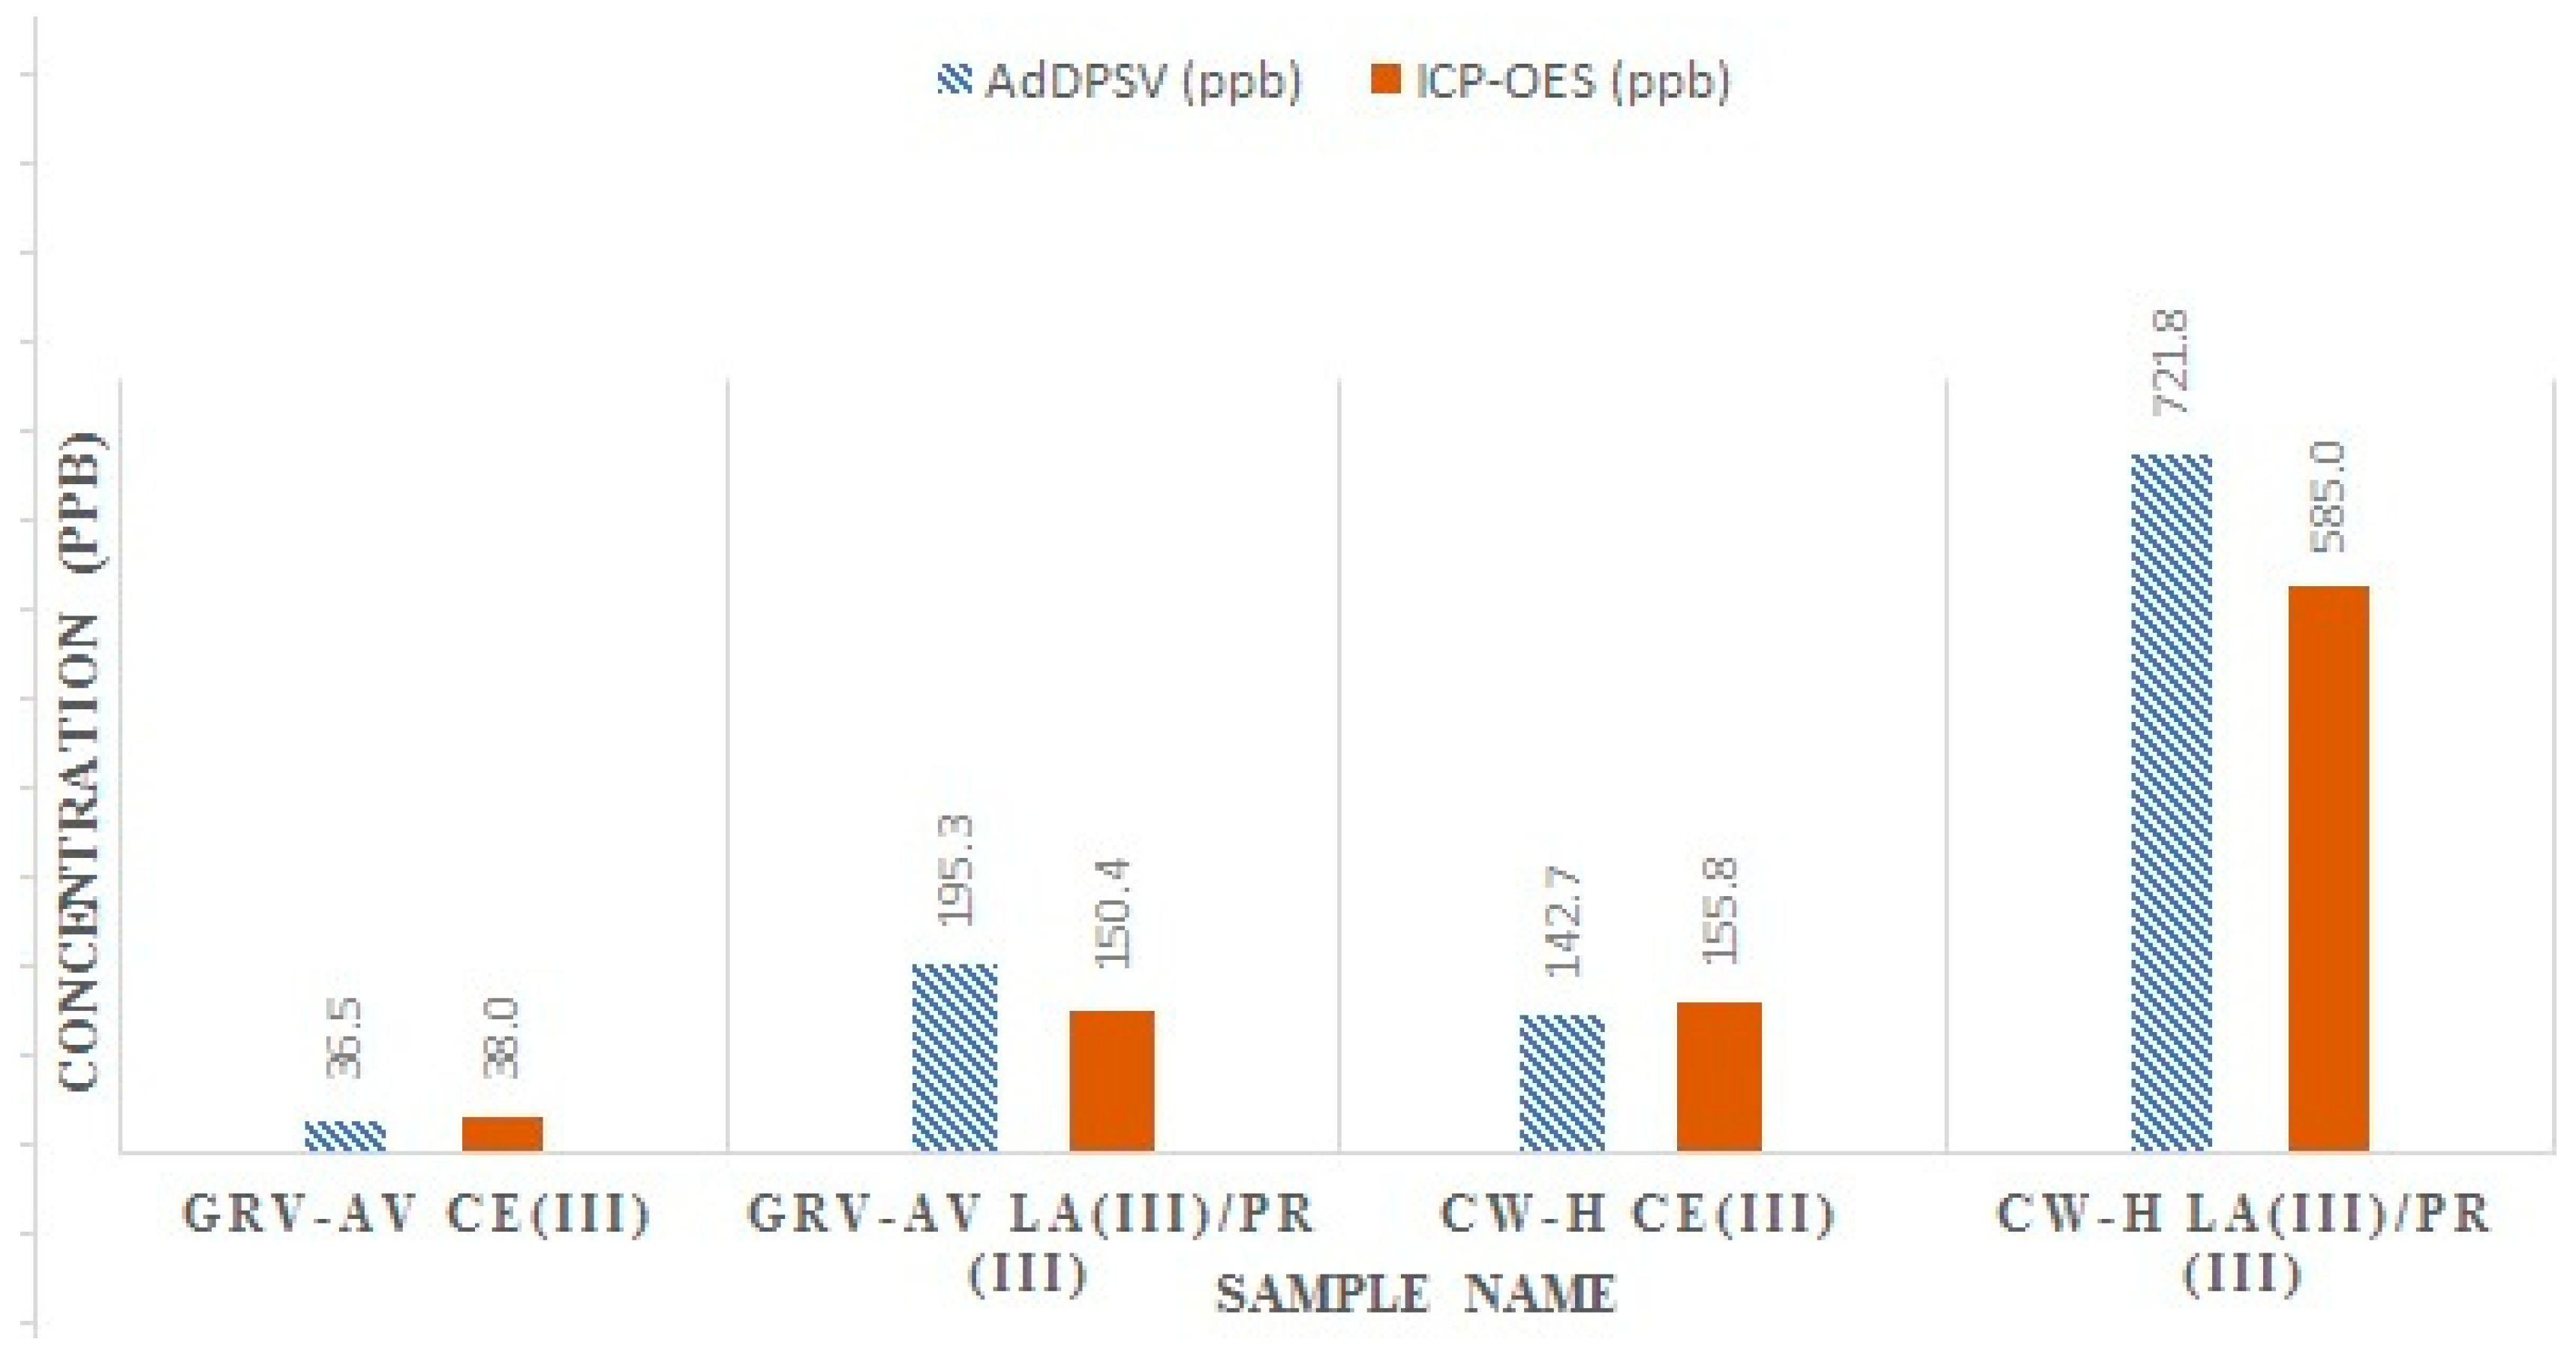
3.2. ICP-OES Analysis

Table 4 shows the Ce, La and Pr concentrations in water samples using ICP-OES analysis. The results obtained for Ce(III) compared well to the voltammetry results obtained in Table 3, though the GCE/SbF sensor results were slightly less and it proved that no significant interference affected the Ce(III) analysis in this determination. The results obtained from ICP-OES spectroscopy analysis might have been enhanced by possible spectral interferences or the GCE/SbF sensor might be more sensitive than ICP-OES spectroscopy for cerium determination. The work mill sample (W-M) again showed no REEs in the ICP-OES spectroscopy analysis.
The combined results of La(III) and Pr(III) in sample CW-H was 721.8 µg/L against the ICP-OES total of 585 µg/L In sample GRV-AV, the combined value of La(III) and Pr(III) in GCE/SbF sensor analysis was 195.3 µg/L, against 150.4 µg/L for ICP-OES analysis. In both the samples, the GCE/SbF sensor showed much higher results, compared to the ICP-OES analysis. The enhancement of the results from voltammetry has been attributed to interfering ions, as has been discussed earlier in Section 3.1. Figure 2 epitomizes the results of the two techniques.
The regression equations obtained from the selected emission lines showed good linearity of the calibrated standards. The limits of detection and quantification were not as sensitive as in voltammetric analysis, with respect to ICP-OES on REE determination [25]. The instrument detection limit in ICP-OES was calculated from the sensitivity and two principal noises that contribute to standard deviation of the blank [33,34,35]. To evaluate the precision, accuracy and applicability of the analytical procedure, it is worthwhile to analyze the certified reference materials (CRM) of natural water with the certified values of the REE concentrations. However, it was difficult to obtain such material and hence a spike recovery test was performed. Tap water and real water samples were spiked at and 50 µg/L for each analyte. The recoveries obtained for each metal were Ce (97.28%), La (93.84%) and 81.98 % for Pr in tap water analysis.
Comparing the results by different researchers on different platforms and conditions was not easy; however, we have done so and the results are shown in Table 5. The results obtained in this study looked promising for determination of La and Pr, since it was found that it is possible to determine La(III) and Pr(III) by voltammetric analysis, applying the same method to environmental sample analysis. The stripping peaks and detection limits for Ce(III) were very good, when compared with other voltammetric methods in existence. The detection limits compared well with studies obtained elsewhere [32,36,37]. Most researchers have found it difficult to produce discrete La(III) and Pr(III) analysis by voltammetric methods [38,39]. Excellent detection limits of 0.03 µg/L were obtained on glass carbon electrode, modified with poly(catechol) (GCE/PC) for cerium determination after 10 min accumulation time by differential pulse anodic stripping voltammetry. In another study, Javanbakht et al. [32] developed a sensor by modification of carbon paste with N′-[(2-hydroxyphenyl)methylidene]-2-furohydrazide (NHMF). A detection limit of 0.11 µg/L for cerium was obtained after 350 s. Li et al. (2006) used a carbon paste electrode modified with alizarin complexone to obtain 0.27 µg/L (2 × 10⁻⁹ M) for cerium after accumulation for 120 s. For this current study, the modified glassy carbon electrode (GCE) used showed peaks for the three elements, with Ce(III) offering the best response on both individual and simultaneous determination. Though the resolution of La(III) and Pr(III) peaks were problematic, the DPAdSV analysis using the GCE/SbF sensor was successfully applied to detect the elements at a ppb level, even in the presence of other interfering ions. However, it is also noted that higher analyte concentrations are not ideal, as they will saturate the antimony film (SbF) on the electrode. For the DPAdSV analysis, it was found that the limit of detection (LOD) and limit of quantification (LOQ) obtained in this study are marginally higher than those obtained in our earlier studies [20]. This can be attributed to the simultaneous determination, which gives rise to higher baseline and inter-element interferences on the GCE/SbF sensor. Other analytical features such as relative standard deviations (RSD), LOQ and LOD compare well with other voltammetric studies, but the electrochemical response of the GCE/SbF sensor to other REEs is well noted.

4. Conclusions

Electroanalytical techniques, such as differential pulse adsorptive striping voltammetry, offer relative simplicity, low-equipment cost, sensitivity, and low-detection limits in environmental matrices. This has been explored in this study, which aimed at monitoring traces of rare earth elements. The chemistry of the rare earth elements and their group’s natural occurrence posed a challenge to selectivity. Although the selectivity of the method has shown limited but satisfactory results, huge progress has been made to determine La(III) and Pr(III) on carbon electrodes, a step that was unsuccessful in previous studies. The ICP-OES spectrometry analysis was able to separate and analyze all the three REEs simultaneously, compared to stripping voltammetric determination by a GCE/SbF sensor. Further optimization or employing of pre-concentration and separation techniques of elements before the stripping analysis may be employed to enhance sensitivity and selectivity in the future. The results obtained by the GCE/SbF sensor platform were in agreement with the results achieved by the established ICP-OES method. The results obtained by both techniques were good, despite the limitations encountered for Pr(III) analysis at low concentrations. The LOD obtained for the stripping analysis was 0.06, 0.42 and 0.71 µg/L for Ce(III), La(III) and Pr(III), respectively. For ICP-OES, the detection limit obtained was 2.45, 3.12 and 3.90 µg/L for Ce(III), La(III) and Pr(III), respectively. The method was found to be accurate and fast and can be an alternative low-cost technique to determine REEs in environmental samples. It can also be used to complement spectroscopy analysis.

Author Contributions

M.M. did the sampling of the samples and did the analysis of samples with the helped of C.v.d.H. and B.S.; M.M. wrote the paper with the help of all co-authors; V.S. and E.I. supervise the study.

Funding

This research received no external funding.

Acknowledgments

This work was supported by the Council for Scientific and Industrial Research (CSIR), Stellenbosch, South Africa. The support provided by the research laboratory at Scientific Services consulting analytical laboratory (Cape Town) and the SensorLab, Chemistry Department, University of the Western Cape, Bellville, South Africa is greatly appreciated. This work was also supported by the National Research Foundation (NRF), South Africa.

Conflicts of Interest

The authors declare no conflict of interest.

References

  1. Iwashita, M.; Saito, A.; Arai, M.; Furusho, Y.; Shimamura, T. Determination of rare earth elements in water collected in suburban Tokyo. Geochem. J. 2011, 45, 187–197. [Google Scholar] [CrossRef]
  2. Norgate, T.E.; Jahanshahi, S.; Rankin, W.J. Assessing the environmental impact of metal production processes. J. Clean. Prod. 2007, 15, 838–848. [Google Scholar] [CrossRef]
  3. Castor, S.B.; Hedrick, J.B. Rare Earth Elements. In Industrial Minerals and Rocks—Commodities Markets and Uses, 7th ed.; Kogel, J.E., Trivedi, N.C., Barker, J.M., Krukowski, S.T., Eds.; Society for Mining, Metallurgy and Exploration, Inc. (SME): Englewood, CO, USA, 2006; pp. 769–792. [Google Scholar]
  4. Ali, S.H. Social and Environmental Impact of the Rare Earth Industries. Resources 2014, 3, 123–134. [Google Scholar] [CrossRef]
  5. Shyam, I.R.; Aery, I.C. Effect of cerium on growth, dry matter production, biochemical constituents and enzymatic activities of cowpea plants [Vigna unguiculata (L.) Walp]. J. Soil Sci. Plant Nutr. 2012, 12, 1–14. [Google Scholar] [CrossRef]
  6. Zhenggui, W.; Ming, Y.; Xun, Z.; Fashui, H.; Bing, L.; Ye, T.; Guiwen, Z.; Chunhua, Y. Rare earth elements in naturally grown fern-Dicranopteris linearis in relation to their variation in soils in South-Jiangxi region (Southern China). Environ. Pollut. 2001, 114, 345–355. [Google Scholar] [CrossRef]
  7. Paul, J.; Campbell, G. Investigating Rare Earth Element Mine, Development in EPA Region 8 and Potential Environmental Impacts; United States Environmental Protection Agency, (USEPA): Washington, DC, USA, 2011; pp. 1–8.
  8. Pang, X.; Li, D.; Peng, A. Application of rare earth elements in the agriculture of China and its environment behaviour in soil. J. Soils Sediments 2001, 1, 124–129. [Google Scholar] [CrossRef]
  9. Emmanuel, E.C.; Ananthi, T.; Anandkumar, B.; Maruthamuthu, S. Accumulation of rare earth elements by Siderophore forming Arthrobacter lutecolus isolated from rare earth environment of Chavara India. J. Biosci. 2012, 37, 25–31. [Google Scholar] [CrossRef] [PubMed]
  10. Turra, C.; Fernandes, E.A.N.; Bacchi, M.A. Evaluation on rare earth elements of Brazilian agricultural supplies. J. Environ. Chem. Ecotoxicol. 2011, 3, 86–92. [Google Scholar]
  11. Cheng, H.; Hao, F.; Ouyang, W.; Liu, S.; Chunye, L.I.N.; Wenjing, Y. Vertical distribution of rare earth elements in a wetland soil core from the Sanjiang Plain in China. J. Rare Earths 2012, 30, 731–738. [Google Scholar] [CrossRef]
  12. Chunye, L.; Mengchang, H.; Yanxia, L.; Linsheng, Y.; Ruimin, L.; Zhifeng, Y. Rare earth element content in the SPM of Daliao river system and its comparison with that in the sediments, loess and soils in China. J. Rare Earths 2008, 26, 414–420. [Google Scholar]
  13. Tao, L.; Shiming, D.; Wenchong, S.; Zhongyi, C.; Chaosheng, Z. A review of fractionations of rare earth elements in plants. J. Rare Earths 2008, 26, 7–15. [Google Scholar]
  14. Fernandez-Caliani, J.C.; Barba-Brioso, C.; De La Rosa, J.D. Mobility and separation of rare earth elements in acid mine soils and geochemical implications for river waters in the southwestern Iberian margin. Geoderma 2009, 149, 393–401. [Google Scholar] [CrossRef]
  15. Border, P. Postnote, POST-PN-392, Livestock Diseases, October 2011, London, UK. Available online: https://www.slideshare.net/isidorimasalu/livestock-diseases-post-pn392 (accessed on 5 July 2018).
  16. Jinxia, L.; Mei, H.; Xiuqin, Y.; Jiliang, L. Effects of the accumulation of the rare earth elements on soil macrofauna community. J. Rare Earths 2010, 28, 657–964. [Google Scholar]
  17. Wood, S.A.; Shannon, W.M. Rare-earth elements in geothermal waters from Oregon, Nevada, and California. J. Solid State Chem. 2003, 171, 246–253. [Google Scholar] [CrossRef]
  18. Tranchida, G.; Oliveri, E.; Angelone, M.; Bellanca, A.; Gensi, P.; D’Elia, M.; Neri, R.; Placenti, F.; Sprovieri, M.; Mazzola, S. Distribution of rare earth elements in marine sediments from the strait of Sicily (Western Mediterranean Sea): Evidence of phosphogypsum waste contamination. Mar. Pollut. Bull. 2011, 62, 182–191. [Google Scholar] [CrossRef] [PubMed]
  19. Tighe, M.; Lockwood, P.; Wilson, S.; Lisle, L. Comparison of digestion methods for ICP-OES analysis of wide range of analytes in heavy metal contaminated soil samples with specific reference to Arsenic and Antimony. Commun. Soil Sci. Plant Anal. 2004, 35, 1369–1385. [Google Scholar] [CrossRef]
  20. Makombe, M.; Van der Horst, C.; Silwana, B.; Iwuoha, E.; Somerset, V. Antimony film sensor for sensitive rare earth metal analysis in environmental samples. J. Environ. Sci. Health Part A 2016, 51, 597–606. [Google Scholar] [CrossRef] [PubMed]
  21. Makombe, M.; Van der Horst, C.; Silwana, B.; Iwuoha, E.; Somerset, V. Optimisation of Parameters for Spectroscopic Analysis of Rare Earth Elements in Sediment Samples. In Rare Earth Element; Orjuela, J.E.A., Ed.; INTECH: Rijeka, Croatia, 2017; pp. 63–81. [Google Scholar]
  22. Van der Horst, C.; Silwana, B.; Iwuoha, E.; Somerset, V. Stripping voltammetric determination of palladium, platinum and rhodium in South African water resources. J. Environ. Sci. Health Part A 2012, 47, 2084–2093. [Google Scholar] [CrossRef] [PubMed]
  23. Silwana, B.; Van der Horst, C.; Iwuoha, E.; Somerset, V. Screen-printed electrodes modified with a bismuth film for stripping voltammetric analysis of platinum group metals in environmental samples. Electrochim. Acta 2014, 128, 119–127. [Google Scholar] [CrossRef]
  24. Somerset, V.; Silwana, B.; Van der Horst, C.; Iwuoha, E. Construction and Evaluation of a Carbon Paste Electrode Modified with Polyaniline-co-poly(dithiodianiline) for Enhanced Stripping Voltammetric Determination of Metals Ions. In Sensing Electroanalysis; Kalcher, K., Metelka, R., Švancara, I., Vytřas, K., Eds.; University Press Centre Pardubice: Pardubice, Czech Republic, 2014; pp. 143–154. [Google Scholar]
  25. Zawisza, B.; Pytlakowska, K.; Feist, B.; Polowniak, M.; Kita, A.; Sitko, R. Determination of rare earth elements by spectroscopic techniques: A review. J. Anal. At. Spectrom. 2011, 26, 2373–2390. [Google Scholar] [CrossRef]
  26. Brown, R.J.C.; Milton, M.J. Analytical techniques for trace element analysis: An overview. Trends Anal. Chem. 2005, 24, 266–274. [Google Scholar] [CrossRef]
  27. Somerset, V.; Van der Horst, C.; Silwana, B.; Iwuoha, E. Biomonitoring and evaluation of metal concentrations in sediment and crab samples from the North-West Province of South Africa. Water Air Soil Pollut. 2015, 226, 43. [Google Scholar] [CrossRef]
  28. Greaves, M.J.; Elderfield, H.; Klinkhammer, G.P. Determination of the rare earth elements in natural waters by isotope-dilution mass spectrometry. Anal. Chim. Acta 1989, 218, 265–280. [Google Scholar] [CrossRef]
  29. Whitely, J.D.; Murray, F. Anthropogenic platinum group element (Pt, Pd and Rh) concentrations in road dusts and roadside soils from Perth, Western Australia. Sci. Total Environ. 2003, 317, 121–135. [Google Scholar] [CrossRef]
  30. Elemental Analysis—Spectrometers. Available online: www.spectro.com (accessed on 18 May 2017).
  31. Protano, G.; Riccobono, F. High contents of rare earth elements (REEs) in stream waters of a Cu-Pb-Zn mining area. Environ. Pollut. 2002, 117, 499–514. [Google Scholar] [CrossRef]
  32. Javanbakht, M.; Khoshafar, A.; Ganjali, M.R.; Norouzi, P.; Adib, M. Adsorptive stripping voltammetric determination of nanomolar concentration of cerium(III) at carbon paste modified by N′-[(2-Hydroxyphenyl) Methylidene]-2-Furohydrazide. Electroanalysis 2009, 21, 1605–1610. [Google Scholar] [CrossRef]
  33. Boumans, P.W.J.M. Measuring detection limits in inductively coupled plasma emission spectrometry using the SBR—RSDB approach: I. A tutorial discussion of the theory. Spectrochim. Acta B 1991, 46, 431–445. [Google Scholar] [CrossRef]
  34. Boumans, P.W.J.M.; Tielrooy, J.A.; Maessen, F.J.M.J. Mutual spectral interferences of rare earth elements in inductively coupled plasma atomic emission spectrometry: I. Rational line selection and correction procedure. Spectrochimica Acta B 1998, 43, 173–199. [Google Scholar] [CrossRef]
  35. Sturman, B.T.; Doidge, P.S. Semi–empirical approach to the calculation of instrumental detection limits in inductively coupled plasma atomic emission spectrometry. J. Anal. At. Spectrom. 1998, 13, 69–74. [Google Scholar] [CrossRef]
  36. Khoo, S.B.; Zhu, J. Poly(catechol) film modified glassy carbon electrode for ultra-trace determination of cerium (III) by differential pulse anodic stripping voltammetry. Electroanalysis 1999, 11, 546–552. [Google Scholar] [CrossRef]
  37. Li, J.; Liu, S.; Yan, Z.; Mao, X.; Gao, P. Adsorptive Voltammetric Studies on the Cerium(III)–Alizarin Complexon Complex at a Carbon Paste Electrode. Microchim. Acta 2006, 154, 241–251. [Google Scholar] [CrossRef]
  38. Li, J.; Liu, S.; Mao, X.; Gao, P.; Yan, Z. Trace determination of rare earths by adsorption voltammetry at carbon paste electrode. J. Electroanal. Chem. 2004, 561, 137–142. [Google Scholar] [CrossRef]
  39. Lee, S.K.; Chung, T.D.; Kim, H. Indirect voltammetric determination of lanthanides in the presence of mordant Red 19. Electroanalysis 1997, 9, 527–532. [Google Scholar] [CrossRef]
Figure 1. AdDPSV results for increased concentration of mixed Ce(III), La(III) and Pr(III) at the GCE/SbF sensor with Ed = −0.1V (vs. Ag/AgCl) and td = 360 s. The solution consisted of 0.08 M NaOAc buffer (pH = 5.8) solution, containing (a) (blank), (b) (5 μg/L), (c) (10 μg/L) and (d) (20 μg/L)) of all elements with 2 × 10⁻⁶ M ALC. The Linear regression analysis of Ce(III) and Combined La(III) and Pr(III) is exposed.
Environments 05 00112 g001
Figure 2. DPAdSV and ICP-OES results for REE concentrations in surface and underground water from the Northern Cape Province near an REE deposit.
Environments 05 00112 g002
Table 1. ICP-OES operating conditions for rare earth elements (REEs) analysis.
Instrument ParameterCondition
Plasma power (W)1400
Pump speed (rpm)30
Coolant flow (L/min)14.00
Auxiliary flow(L/min)2.10
Nebuliser flow (L/min)0.80
NebuliserCrossflow
Torch Position0
Table 2. Summary of optimum stripping voltammetry conditions for determination of REEs with the constructed GCE/SbF sensor platform and ALC as a complexing agent.
Stripping StepCondition REE [Ce(III), La(III) and Pr(III)]
pH5.8
Reduction potential (V)−0.1
Deposition time (s)360
Supporting electrolyte0.08 M NaOAc
Measurement techniqueDPAdSV
Potential window−0.2 to +1.2 V
Complexing agentAlizarin Complexione (ALC)
Table 3. Adsorptive differential pulse stripping voltammetry (AdDPSV) results for REE concentrations in water samples.
SiteMetal Ions
Ce(III) (µg/L)La(III) (µg/L) + Pr(III) (µg/L)
W-MNDND
CW-H142.7 ± 5.7721.8 ± 16.7
GRV-AV36.5 ± 0.6195.3 ± 1.5
Table 4. Spectroscopy (ICP-OES) results for REE concentrations in water samples.
Site IDMetal Ions
Ce(III) (µg/L)La(III) (µg/L)Pr(III) (µg/L)
W-MNDNDND
CW-H155.8 ± 1.5298.0 ± 1.6287.0 ± 5.5
GRV-AV38.0 ± 1.268.0 ± 1.982.4 ± 5.2
Table 5. Comparison of the present study’s results with other voltammetric and spectroscopic procedures for the determination of REEs in environmental samples.
MethodMetal IonR2RSD (%)LOQ (µg/L)LOD (µg/L)References
GCE/PCCe(III) 3.4 0.03[36]
CPE/NHMFCe(III)0.99825.6 0.11[32]
CPE/ALCCe(III) 3.5 0.27[37]
GCE/SbFCe(III)0.99384.00.190.06[20]
La(III)0.99285.01.420.42
Pr(III)0.98885.02.430.71
GCE/SbFCe(III)0.94815.22.120.10This work
La(III) + Pr(III)0.99224.410.422.10
ICP-OESCe1.00002.97.612.45This work
La1.00005.34.633.12
Pr0.99984.716.233.90

