Article

Industrial Symbiosis and Waste Management Under a Circular Economy Management Standard in the Water Sector


by
Germán Arana-Landin
1,*,
Naiara Uriarte-Gallastegi
2,
Beñat Landeta-Manzano
2,* and
Waleska Sigüenza-Tamayo
3
1
Department of Business Management, Faculty of Engineering of Gipuzkoa, University of the Basque Country, Europe Plaza, 1, 20018 San Sebastián, Gipuzkoa, Spain
2
Department of Business Management, Faculty of Engineering of Bilbao, University of the Basque Country, Ingeniero Torres Quevedo Plaza, 1, 48013 Bilbao, Biscay, Spain
3
Department of Public Policy and Economic History, Faculty of Economics and Business, University of the Basque Country, 23 Comandante Izarduy Street, 01006 Vitoria-Gasteiz, Araba, Spain
*
Authors to whom correspondence should be addressed.
Environments 2026, 13(9), 472; https://doi.org/10.3390/environments13090472
Submission received: 2 July 2026 / Revised: 16 August 2026 / Accepted: 18 August 2026 / Published: 25 August 2026

Abstract

Industrial symbiosis is one of the main routes for turning waste streams into useful materials and energy within a circular economy. Little empirical evidence exists, however, on how symbiosis projects are managed within a circular economy project management standard. This exploratory single-case study examines the motivations, implementation, and outcomes of symbiosis initiatives in the water sector, developed by an organisation certified under the XP X30-901 standard and covering treated water, biomethane, thermal energy, and fertiliser recovery. An externally assured indicator series for 2016 to 2025 compares the years before the portfolio was formalised in 2019 with those after certification in 2021. Sludge sent to landfill fell from 16.4% of the total managed in 2016 to zero from 2022, the share sent to agriculture and fertiliser production rose from 46.0% to 64.1% between 2019 and 2023, and the average transfer cost fell from EUR 134.34 to EUR 107.15 per tonne. The standard supported the identification, prioritisation, and monitoring of circular projects, although these outcomes cannot be attributed to it alone. Indicators exposed to hydrological, market, and regulatory conditions proved less stable than those that the organisation controls directly, suggesting that standardisation consolidates controllable outcomes rather than improving overall performance.

1. Introduction

Industry worldwide is under growing pressure to reconcile economic growth with environmental sustainability, and this calls for a critical review of current patterns of production and consumption [1]. Projections indicate that, by 2050, energy and water supplies will have to grow by roughly 50%, while carbon dioxide (CO2) emissions will have to fall by between 50% and 80%, if social, political, and climate stability are to be maintained [2,3]. Meeting these demands requires more efficient and more circular models of production, supported by the recovery of resources and by better use of materials and energy in industrial systems. It also requires an integrated circular perspective at the social, business, and governmental levels [4,5].
Moving towards a circular economy (CE) requires organisations to combine technological and management tools with different kinds of knowledge, so that materials, water, and energy are used more efficiently [6,7,8]. ISO and national standards bodies have therefore developed a set of management tools to support companies through this transition [9]. Some standards, such as ISO 14001 [10], ISO 50001 [11], and ISO 14006 [12], offer complementary frameworks that each address a particular area. ISO 14001 sets out an environmental management system that helps organisations reduce their environmental impact, use resources more efficiently, and improve continuously [10]. ISO 50001 addresses energy performance, enabling organisations to optimise energy use, cut consumption, and improve energy efficiency across their operations [11]. ISO 14006 brings eco-design principles into product development, encouraging organisations to consider environmental impacts across the whole product life cycle [12].
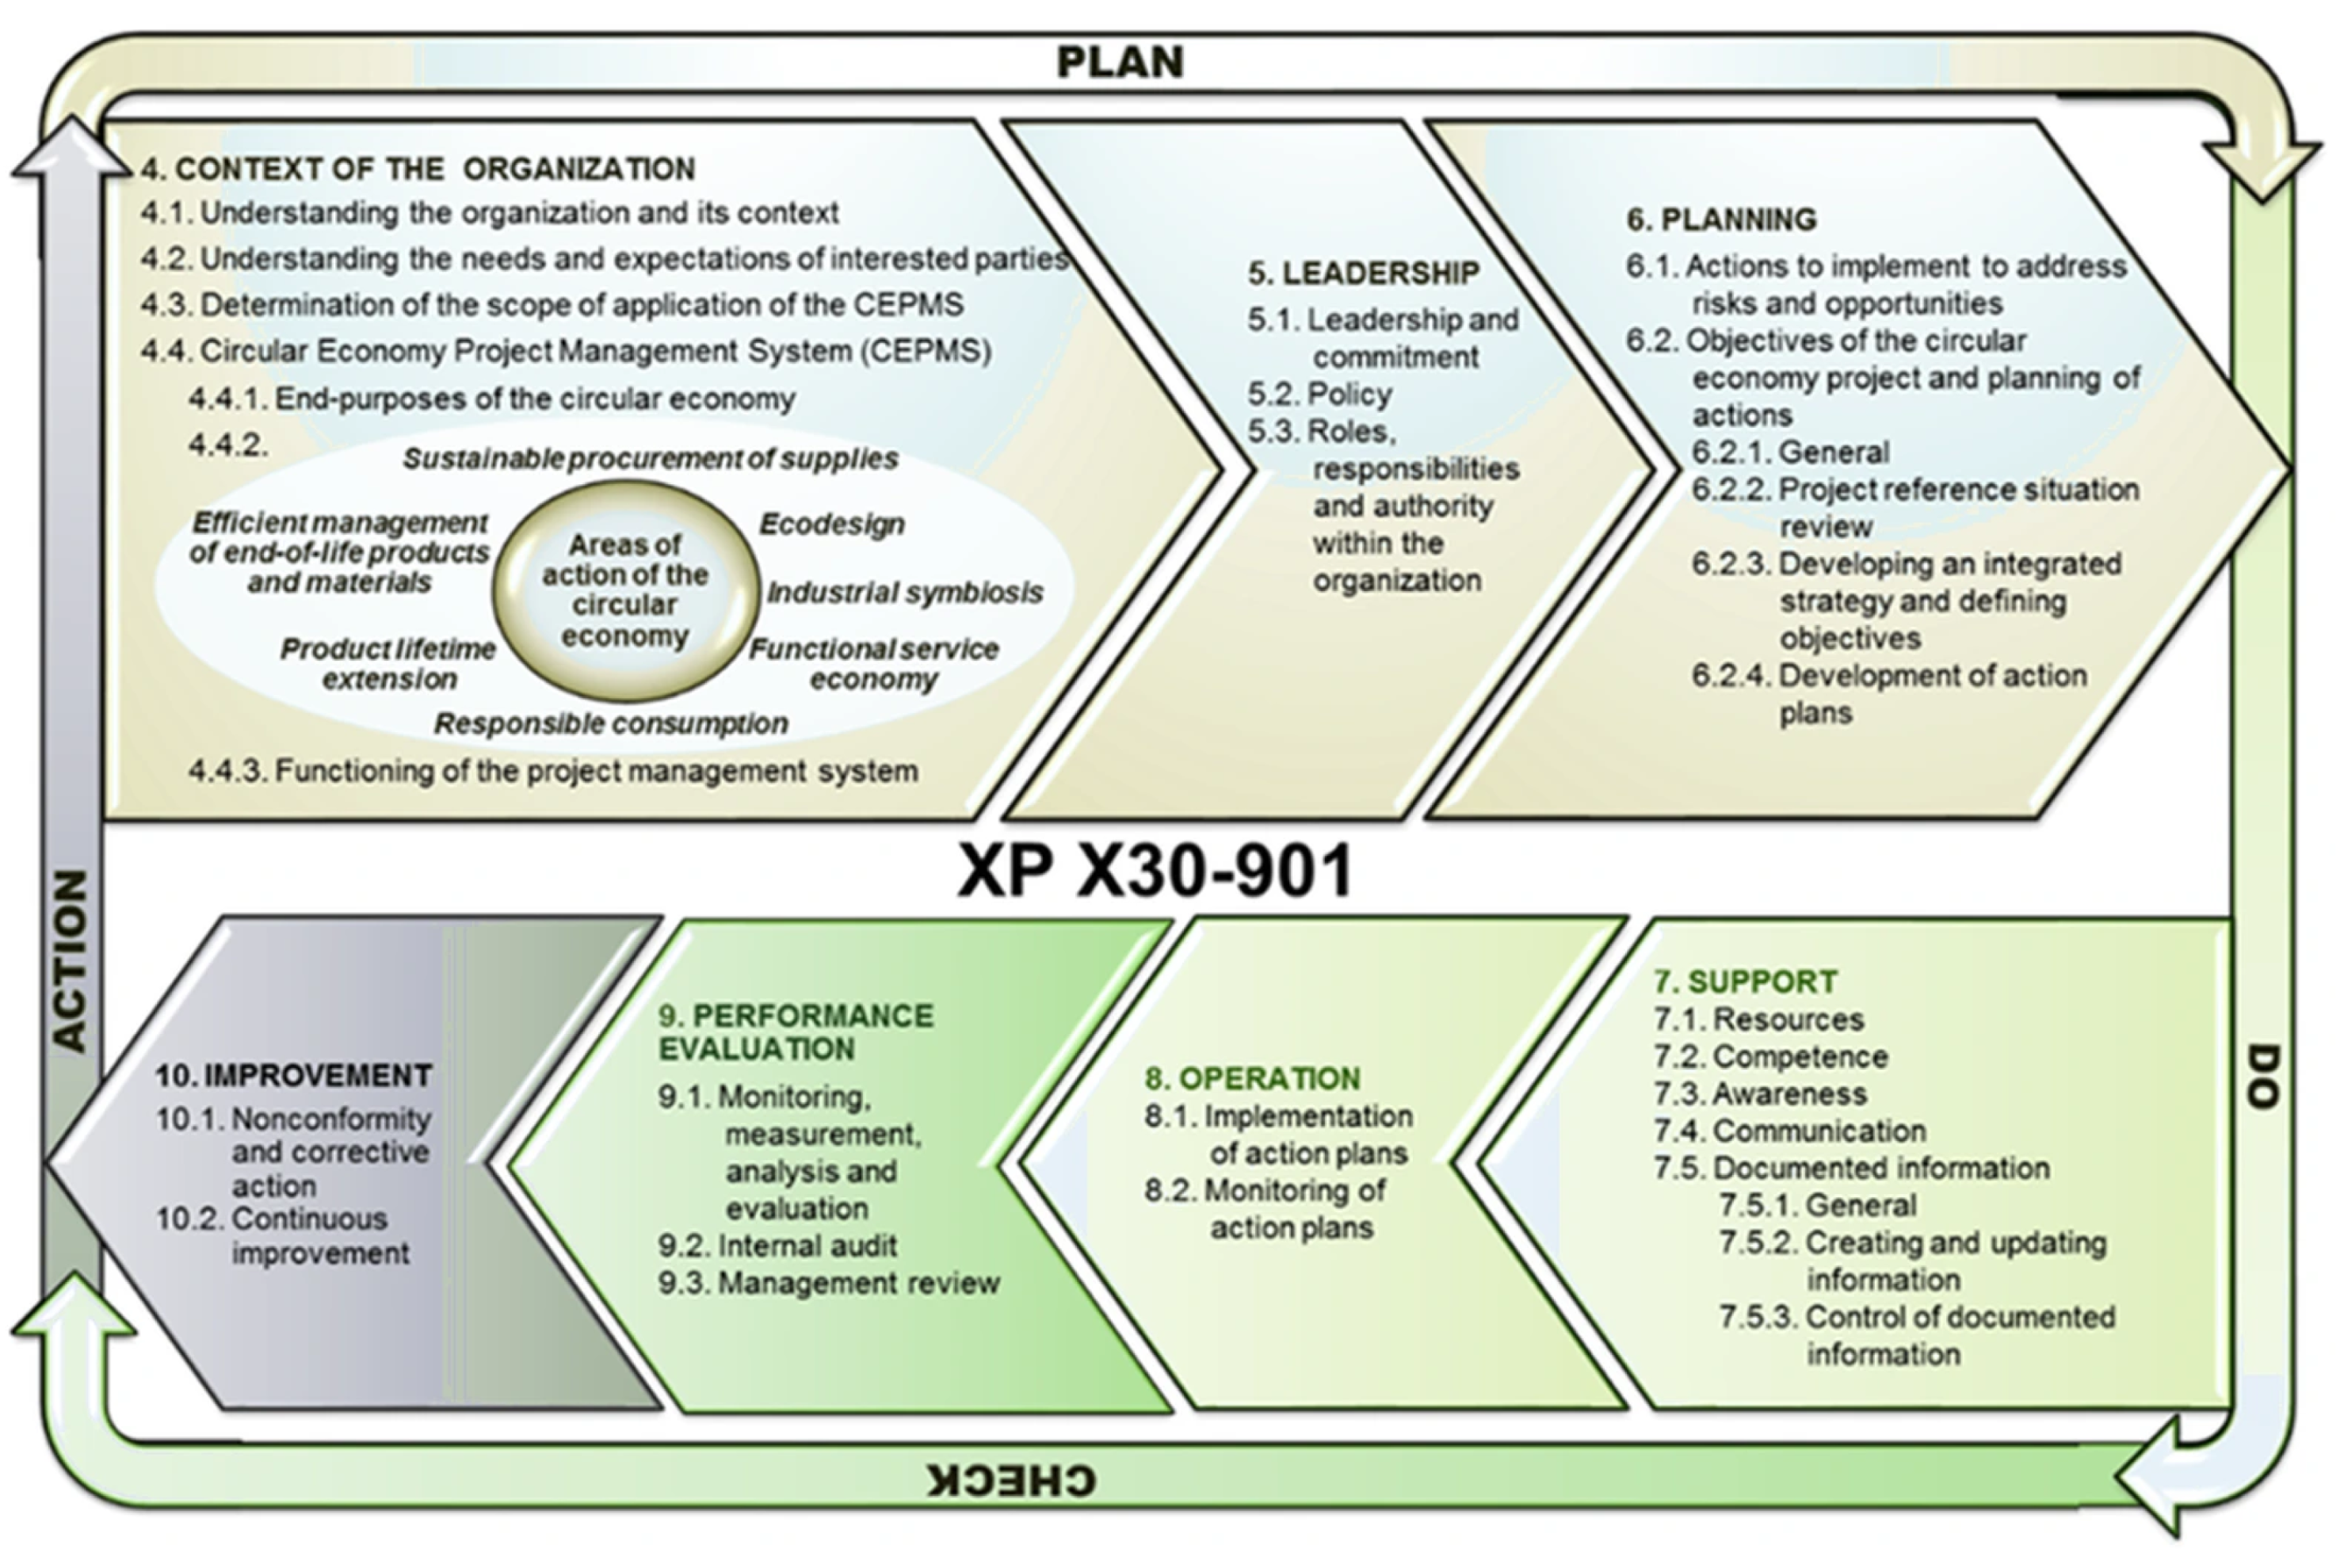
The XP X30-901 standard takes a different approach: it integrates circular economy perspectives into project management systems by systematising the continuous improvement cycle, as shown in Figure 1 [13]. It is regarded as the key reference standard within the ISO 59000 family [14]. The standard applies this cycle across the seven areas of the circular economy and the three perspectives of sustainability [13,14]. The seven areas are (1) sustainable supply, (2) eco-design, (3) industrial symbiosis (IS), (4) functional economics, (5) responsible consumption, (6) extension of useful life, and (7) effective management of end-of-life materials and products; the three perspectives are economic, social, and environmental [13]. In practice, the actions that a company takes rarely affect a single area and usually produce linked effects across several. The relationship between industrial symbiosis, efficient energy management, and end-of-life management is particularly close [14]. In this respect, the standard differs from ISO 14001, ISO 50001, and ISO 14006, which contain principles that support industrial symbiosis but set no specific requirements for it [10,11,12].
By meeting the requirements of the XP X30-901 standard, an organisation forms a circular economy project management system (CEPMS). This makes it possible to examine how particular waste streams can become new raw materials for production, which reduces the consumption of primary resources and improves recovery rates, and so supports the move towards more sustainable systems of production [2,15]. Building on this idea, the present study examines how systematising industrial symbiosis can help companies manage waste, materials, and energy flows, and thereby reduce the final impact of the products that they make [16,17].
On industrial symbiosis, the XP X30-901 standard states that it “is materialised by the grouping and/or interrelation of different production phases, of several processes for the manufacture of specific goods or services, with the aim of the shared management of certain functions, goods and stocks” [13]. Symbiosis therefore works best when different economic agents create synergies that allow resources—materials, energy, water, infrastructure, goods, and services—to be used more efficiently [18]. Waste and by-products from one agent become raw materials or energy for another, reducing the use of natural resources, the demand for primary energy, and the environmental impacts of production. Where a company cannot reuse its own waste internally, that waste can still become a resource for others, closing material and energy cycles within the industrial system [19,20].
This improves the ways in which products, materials, and energy flows are managed, extends their useful life, and delays the point at which they become final waste [6]. The XP X30-901 and ISO 59004 standards [13,21] both state that effective end-of-life management involves transforming post-consumer waste, including through recycling, into substances, materials, or products that serve their original function or a new one. Standardised industrial symbiosis can therefore be understood as a circular management tool with energy implications, since it allows waste either to retain its original function or to be recovered as new materials and energy within networks of organisations [14,22].
Systematising industrial symbiosis can make waste management easier and generate economic, social, and environmental benefits [17,23]. However, although the literature covers the application of CEPMSs [14], symbiosis processes [19], and the optimisation of resource management [6] separately, we have found no study examining symbiosis aimed at optimising waste, materials, and energy flows within a CEPMS. That is the contribution of this article. It analyses a case in which an organisation adopted a CEPMS and used it to develop symbiosis projects, so that certain wastes and by-products became recoverable resources and the demand for primary raw materials fell. The question is timely, given the consolidation of the ISO 59000 family, which builds on the approach first developed in the XP X30-901 standard.
The rest of this article is organised as follows: Section 2 presents the theoretical framework and Section 3 the research methodology. Section 4 sets out the results of the case study, Section 5 discusses the main findings, and Section 6 presents the conclusions, limitations, and implications for future research.

2. Theoretical Frameworks

2.1. CE Management Standards

Common terms, methods, and interfaces improve communication between national and international actors, ease access to global markets, encourage collaboration, and avoid the duplication of tests and effort. International standards also build trust along the value chain and reduce the risk of greenwashing, because they encourage practices that are more transparent and easier to verify [24]. Standard-setting therefore supports the transition directly and helps in meeting the United Nations Sustainable Development Goals (SDGs) and policies based on the ‘R’ principles [24]. By September 2022, some 2101 standards related to the circular economy had been identified within the CE Roadmap [25].
These standards take two broad approaches: standardising products to meet circular economy objectives, and addressing organisational and managerial matters [26]. The second group is not tied to a particular product or sector and can therefore be regarded as horizontal standards describing the general features of business circularity [27]. They help organisations set objectives, define measurable targets and indicators, and establish the processes needed to reach them.
BS 8001:2017, published by the British Standards Institution, is one of the first significant references in the field. It appeared as global and European policy turned towards sustainability, as the Paris Agreement [28] and the European Union’s CE Package [29] illustrate, and set out six guiding principles ranging from systems thinking to life-cycle management [30]. It imposes no mandatory requirements but offers a flexible framework for organisations of any sector and size [31].
Drawing on BS 8001:2017 [30], the French standards body AFNOR published XP X30-901:2018, which adapted those principles to a more operational approach centred on circular economy project management systems and built on the Plan–Do–Check–Act (PDCA) cycle [32]. The ISO subsequently created technical committee ISO/TC 323, originally proposed by AFNOR, which developed ISO 59004:2024 [21]. Part of the ISO 59000 family, it establishes a framework applicable to organisations of any sector and size and draws together the lessons of earlier initiatives, alongside ISO 59010:2024 on value networks [22] and ISO 59020:2024 on measuring circularity performance [33].
Table 1 sets out the main differences and similarities between these standards in relation to circular economy project management. XP X30-901 is the only one with a third-party conformity assessment scheme: once deployed, the management system can be audited externally and recognised through the AFAQ Économie Circulaire mark [13]. It is an experimental standard (norme expérimentale), and it gives weight to industrial symbiosis and end-of-life management as areas of action.
The development of these standards reflects growing demand for circular economic models, driven by the environmental limits of the linear model, resource scarcity, and the need for more energy-efficient production. Making this shift requires producers, consumers, policymakers, and researchers to act together [34], and requires organisational and institutional strategies to adapt to new frameworks of sustainability, competitiveness, and energy transition [35,36] spanning socio-political, financial, economic, and technological dimensions [37,38].

2.2. IS: Application to Waste and Energy Management Processes

Industrial symbiosis appears in several circular economy management standards as an area of action that brings economic, social, and environmental benefits [13]. However, although symbiosis projects are seen as a way of moving towards more circular management, by minimising waste and generating synergies between organisations through exchanges of materials, water, infrastructure, services, and energy [39,40,41], few sources address how symbiosis is applied within circular economy management standards [13].
Waste recovery lies at the heart of symbiosis projects: it cuts costs, creates new sources of income, and turns waste streams into materials or energy [23]. This matters most in resource-, waste-, and energy-intensive sectors. Construction and urban development, for example, consumes more than half of the world’s raw materials, generates roughly 30% of global solid waste, and accounts for 36% of global energy consumption [42], which is why strategies such as material reuse are now being applied there [43]. In the energy sector, Brazil has 140 thermoelectric plants using forest biomass; the same source reports that 91.3% of the forest residues generated in the studied region go to energy recovery [44]. In the water sector, wastewater treatment plants are increasingly seen as resource recovery facilities [45,46], and decentralised recycling widens these possibilities by supporting local reuse [47] and involving local communities in solutions adapted to their territory [48].
Many innovative businesses now seek to recover value from by-products through new lines of activity that, while not always part of the core business, improve economic, environmental, and energy performance [49,50,51,52]. This is particularly valuable when waste or by-products can return to the production system as secondary raw materials or become heat, biogas, biomethane, or another useful form of energy.
Symbiosis can make waste and resource management easier, especially when waste streams can be used internally or externally after relatively simple processing [17]. Such waste often becomes a new material or energy input, which reduces the volume sent for disposal and improves resource efficiency. A company may carry out these processes itself or through partnerships with other organisations, and partnerships make it considerably easier to manage waste, materials, and energy across a production network [53,54,55,56,57,58]. Partnerships are therefore essential: they allow waste and by-products to become inputs within the supply chain, closing material cycles and, in some cases, enabling energy recovery [58,59].
Symbiosis projects also depend on overcoming several obstacles faced by companies moving towards more circular, efficient, and sustainable models [60,61,62]. These obstacles fall into four main categories:

2.2.1. First Category: Economic and Financial Challenges

Symbiosis projects often require substantial upfront investment, particular technical capabilities, and mechanisms for co-ordinating between organisations, all of which can limit take-up where support frameworks are weak. A shortage of funds for the necessary investment [63,64] and the high costs of production [65] are among the main barriers that companies face. Recent work indicates that although symbiosis can generate economic, environmental, and energy benefits by turning waste into resources, its spread is held back by inconsistent regulation and by the need to build trust between the agents involved [66].
A related and comparatively under-explored question is whether circular configurations are also economically efficient. The literature on municipal solid waste offers the most developed evidence on this point, and it is not uniformly favourable. Studies of Spanish local governments show that the cost of the service depends heavily on how it is delivered, on population size, and on the degree of inter-municipal co-operation, so that similar environmental outcomes can be achieved at very different costs [67]. Data envelopment analysis of 5516 Italian municipalities identifies a clear trade-off: higher separate-collection rates often come with higher unit costs, so gains in eco-efficiency cannot be assumed to follow from gains in circularity [68]. Related work using cost data from Milan links the organisation of the service, economies of scale, and market structure to production costs [69], while single-operator models show how transaction costs and procurement arrangements shape economic efficiency [70]. Dynamic productivity analyses point the same way over time [71]. Finally, the literature on circularity indicators indicates that economic efficiency can be measured together with environmental impact and resource use [72,73].
From an energy point of view, these constraints matter most in projects involving energy recovery, bioenergy integration, or the substitution of conventional resources, since such initiatives require rigorous technical, economic, and environmental assessment if they are to remain viable in the long term [74].

2.2.2. Second Category: Human Resources and Technological Barriers

Symbiosis depends not only on the availability of recoverable waste but on whether organisations can spot opportunities, co-ordinate with other agents, and adapt their own processes. A shortage of specialist staff and gaps in training are significant barriers [52,75], and the transition calls for dynamic capabilities in identifying circular opportunities, mobilising resources, and reconfiguring processes [42]—capabilities closely linked to the environmental awareness and leadership of the managers who drive them [76]. Digital technologies, traceability systems, resource-sharing platforms, and data analysis tools are the corresponding enablers: they reveal synergies between companies, make material and energy flows visible, and improve the design of circular products [77,78,79,80], and Industry 4.0 architectures have been shown to support smart waste management systems oriented towards the SDGs [81]. Real-time data infrastructure is decisive in accelerating symbiosis [66], and integrated approaches combining symbiosis, bioenergy, and the circular economy are gaining ground in energy-intensive sectors [74,82].

2.2.3. Third Category: Challenges in the Management of Material and Energy Resources

The availability of materials and energy is critical in projects aimed at improving waste management, and scarcity can act either as an operational constraint or as an incentive to find alternatives to primary resources [83,84]. Companies sometimes form strategic alliances to develop projects of this kind, sharing both tangible and intangible resources. The literature notes that such collaboration improves operational efficiency and generates benefits shared among the agents involved [85,86].
Consistent with this, recent research on resource recovery in the water sector shows wastewater treatment plants evolving from infrastructure devoted solely to treatment into integrated platforms for recovering water, nutrients, secondary raw materials, and bioenergy [87]. This shift matters here because it makes the water sector a strategic setting in which waste management, resource efficiency, and energy recovery converge.
Beyond these barriers, symbiosis offers real opportunities to improve economic, environmental, and energy performance. Recent studies highlight its potential to turn waste and by-products into valuable resources, reduce the use of virgin raw materials, conserve energy, and support more circular industrial models [66,82]. Symbiosis should therefore be understood not only as a waste management strategy but also as a means of improving energy efficiency, reducing environmental impacts, and creating shared value across production networks.
Although the literature confirms growing interest in symbiosis, waste recovery, and resource recovery in energy-intensive sectors, few studies analyse these processes when they take place within a standardised CEPMS. An open question is whether such systems help organisations overcome technical, organisational, and relational barriers, and whether they support the identification, co-ordination, and monitoring of symbiosis initiatives in a systematic way. The question is particularly relevant in resource-intensive sectors such as water management, where material, energy, and water flows converge and require co-ordinated governance. This study therefore addresses the following research question:
RQ: How are waste, material resources, and energy flows managed through IS projects within a certified CEPMS, and how do the associated indicators evolve before and after its adoption?

3. Methodology

The research began with a review of the literature, aimed at identifying earlier studies on industrial symbiosis projects managed systematically within a CEPMS. The initial search showed how little work had examined industrial symbiosis, standardised circular economy management systems, and energy recovery from waste together. This review was therefore reorganised along two complementary lines: the literature on industrial symbiosis and resource recovery, and the literature on circular economy project management systems. This made it possible to define the research problem and to justify an exploratory study of a complex and changing phenomenon that has not yet been examined empirically. The review preceded the empirical work and was independent of it; it was narrative and exploratory rather than systematic.

3.1. Research Design and Case Selection

A case study was the most suitable method for the phenomenon examined here, because this strategy suits complex organisational processes in which business decisions, the interactions between agents, and the institutional context all matter. According to Yin [88] and Eisenhardt [89], a single case is justified when the phenomenon is revelatory, extreme, or hard to reach. The organisation examined here was treated as a revelatory case: certified circular economy management systems that structure industrial symbiosis projects are still uncommon, and researchers rarely gain simultaneous access to internal documentation, to several years of operational indicators, and to the people who designed and ran the projects.
The case was selected in 2022 by purposive sampling against three criteria, none of which refers to the outcomes later observed: First, the organisation had to have adopted and certified a CEPMS in accordance with XP X30-901. Second, it had to have carried out industrial symbiosis projects involving materials, water, and energy. Third, it had to give access to informants, to internal documentation, and to several years of operational indicators, so that the evidence could be triangulated across sources [89,90]. The water sector was of particular interest because materials, energy, and water flow all converge within it. The case was chosen from among organisations that had already completed certification, and Section 6 discusses what this implies for the interpretation of the findings.
The organisation did not require a confidentiality agreement. During the exchange of information, however, the research team understood that it preferred not to be identified, and the case is therefore described in anonymised terms.

3.2. Data Collection

The empirical work was carried out in two phases: The first ran from September 2022 to December 2025 and set out to establish why the industrial symbiosis projects were undertaken, how they were implemented, and what they achieved. Between September and December 2022, the case was selected and the case study protocol and interview guide were prepared. Data collection combined semi-structured interviews with a review of internal and external documentary sources. Table 2 summarises the sources, the periods they cover, and the purpose each served.
Interviews were held with two people: a technician responsible for the operational and environmental management of the projects, and a manager responsible for strategic co-ordination and decision-making. Two rounds took place between 2022 and 2023; the technician took part in both, and the manager in the first. Both rounds followed a common written guide covering the origin of each initiative, the CEPMS procedures applied, the actors involved, the resource flows exchanged, the criteria used to select initiatives, the barriers encountered, the expected benefits, the indicators used, and the outcomes perceived. Choosing these two informants made it possible to gather evidence on the technical side of the initiatives and on their place in the organisation’s strategy. Both informants also reviewed a draft of the case description, and their comments were incorporated before the analysis was finalised.
The review of internal documentation covered January 2023 to December 2025 and comprised six project-related documents: technical and sustainability reports, indicator records, investment plans, and certification documentation. A document was included where it referred directly to at least one of the projects and contained information on design, implementation, monitoring, indicators, or outcomes. All of the material used, both internal and external, was supplied to the authors by the organisation as part of the case documentation. It comprised the six internal documents described above, together with the annual reports published by the organisation for the years 2016 to 2025, which are subject to independent third-party assurance. The quantitative figures reported in Section 4 are drawn from the annual reports and were cross-checked against the internal indicator records; where the two differ, the assured annual reports have been followed. This is the only statement of provenance in this article, and the tables and figures are not annotated individually.
The quantitative indicators cover 2016 to 2025, although not every indicator spans the whole period: the reporting framework changed in 2024, when the organisation moved from the GRI Standards to the European Sustainability Reporting Standards, and this altered the definition of some indicators and ended the publication of others. Section 4.5 states, for each series, the years for which comparable figures exist. Information on facilities due to enter service after 2025 is reported in Section 4.7 as prospective and is not treated as evidence of outcomes.
The second phase was carried out in 2026 and consisted of re-examining the evidence, with particular attention to what the CEPMS contributed to the process. The results were first considered from the economic, social, and environmental perspectives, and then in relation to the main aim of the article—namely, their contribution to waste recovery, energy recovery, resource reuse, and material and energy efficiency.

3.3. Data Analysis

The evidence was examined project by project and then compared across projects. For each project, the material was organised in a matrix of seven analytical categories following the interview guide: the origin of the project and its link to the CEPMS, the procedures applied, the actors involved, the resource flows exchanged, the barriers encountered, the expected benefits and indicators, and the outcomes observed. The first four were derived deductively from the areas of action and sustainability perspectives of XP X30-901; the rest emerged from the interviews. Two researchers coded the material independently and resolved discrepancies by discussion before applying the agreed definitions to the whole corpus [88,90].
The quantitative indicators were analysed descriptively, through annual values, percentages, and changes over time. Because the data are operational figures from a single organisation rather than observations from a probabilistic sample, no inferential tests were applied. The findings are therefore read as case-specific variations, distinguishing persistent patterns from indicators that fluctuate from year to year. To make that distinction systematic rather than impressionistic, each indicator was classified on two criteria: how far the organisation controls it, and what drives its variation from year to year. The resulting classification is presented and discussed in Section 5.1.

3.4. Research Quality

As described by Yin [88], the four tests usually applied to case study research were addressed. Construct validity was pursued using multiple sources of evidence, through a chain of evidence linking the research question, the sources, the analytical categories, and the findings, as well as through the review of a draft of the case description by both informants. Internal validity was addressed through pattern matching and explanation building, without assuming that the CEPMS was the sole cause of the outcomes observed. External validity rests on analytical rather than statistical generalisation, so the findings are offered as transferable to organisations working under comparable conditions rather than as statistically representative. Reliability was supported by a written protocol setting out the research questions, the data collection procedures, and the interview guide, as well as by a case study database holding the interview material and the documentary sources.

4. Results

4.1. Context of the Case

The case study was carried out in a company with long experience in water management. It leads its industry both for the innovative nature of its management model and for the scale of its operations: it provides water supply, distribution, and treatment services to an area of more than two million inhabitants and manages the associated network assets and treatment facilities.
The chronology of adoption matters for the reading of the results and is therefore set out explicitly. In 2019, the organisation created a dedicated circular economy category within its environmental investment plan, and from that point circular projects were programmed, budgeted, and monitored separately from the rest of the investment portfolio. Third-party certification of the CEPMS against XP X30-901 followed in 2021. The analysis therefore distinguishes three periods: 2016–2018, before the circular economy project portfolio was formalised; 2019–2020, when it was formalised; and 2021–2025, after certification. This does not imply that changes observed after 2021 are attributable to certification alone, but it allows the indicators to be read against a documented baseline.
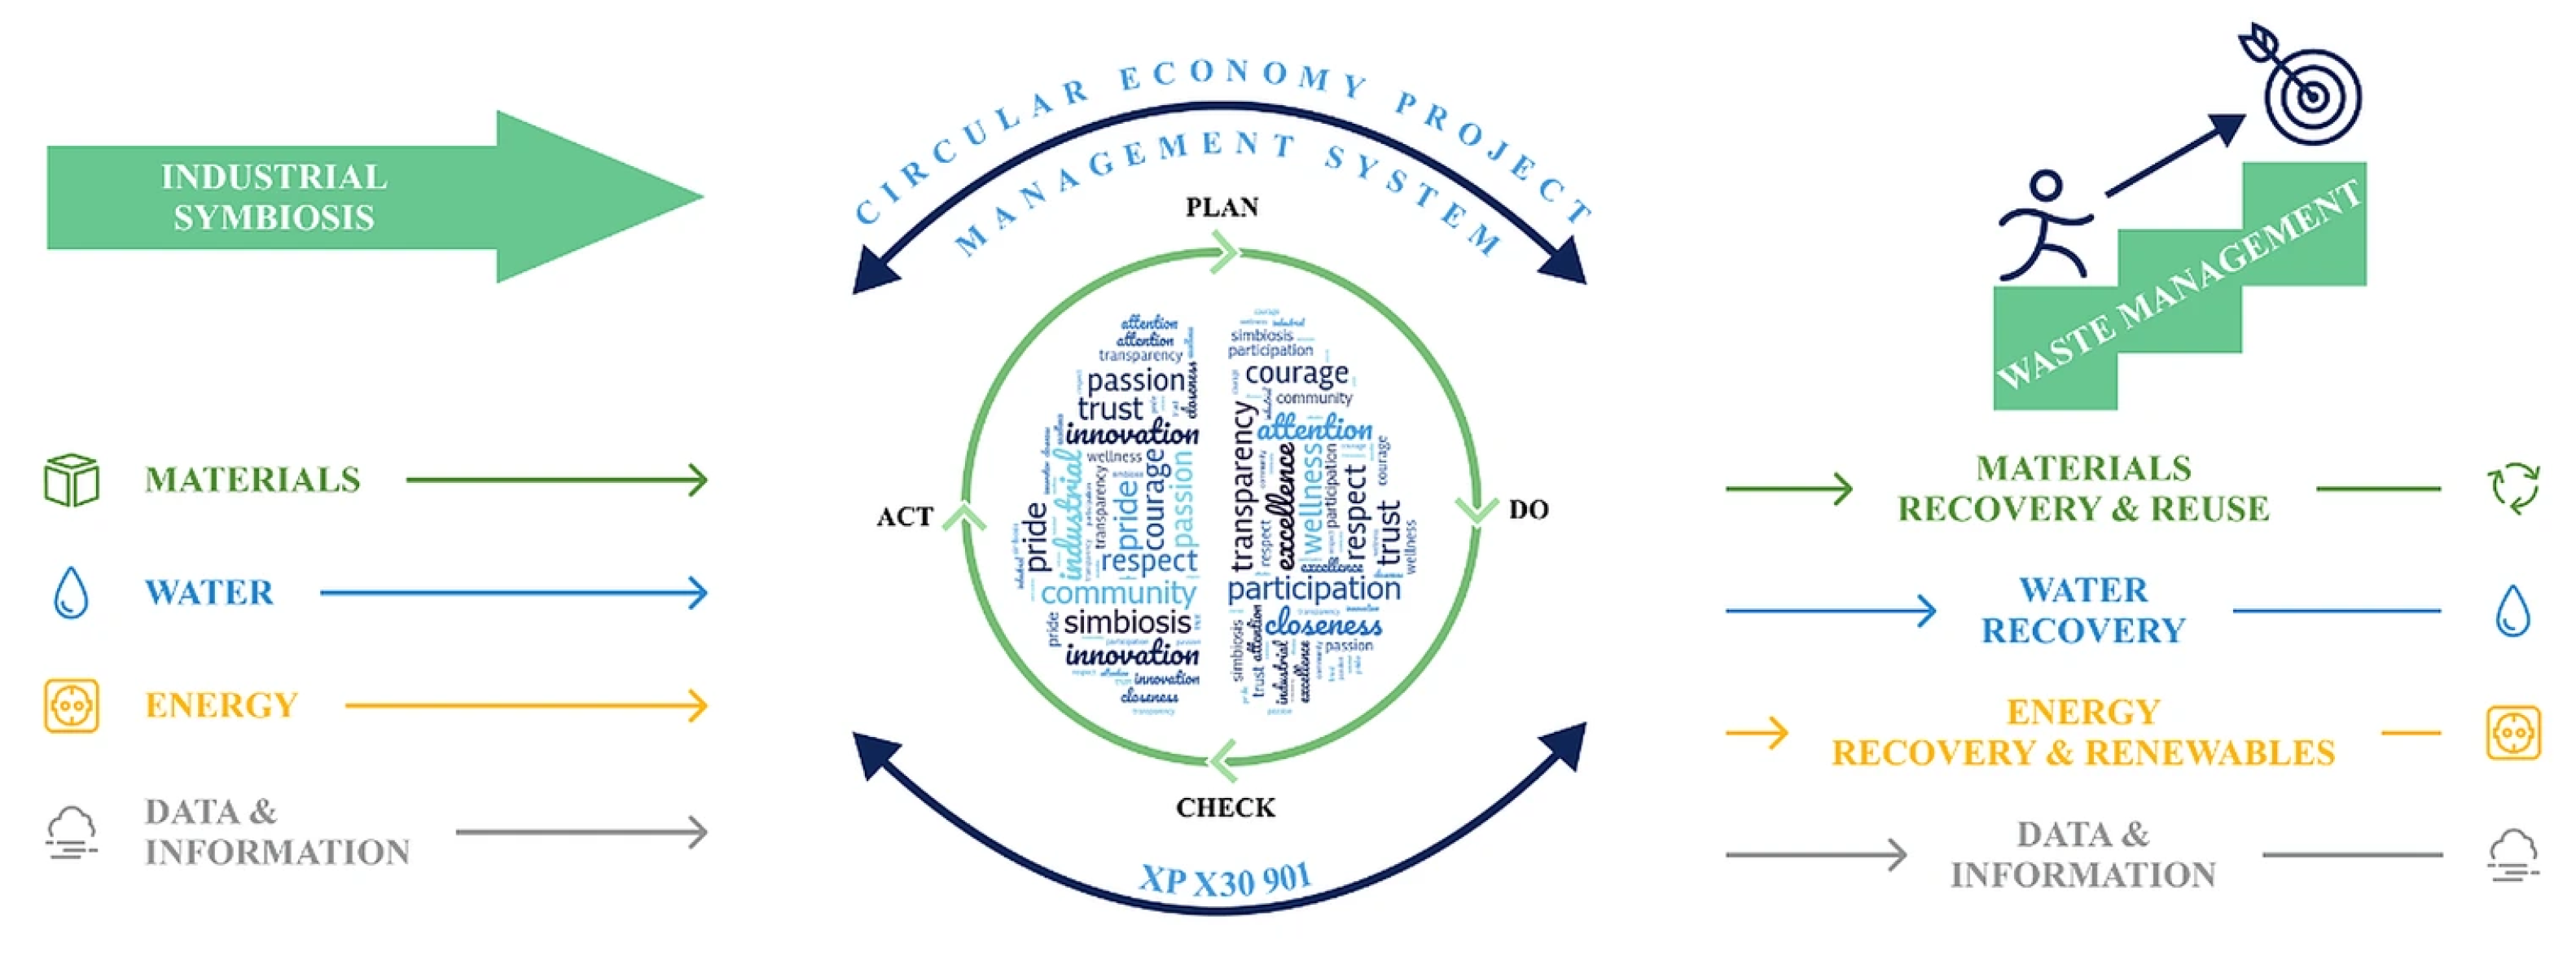
The company’s vision rests on a daily commitment to excellence and transparency. Its values, shown in Figure 2, reflect the weight that it gives to sustainability, efficient use of resources, innovation, and collaboration with stakeholders—all of which matter for industrial symbiosis projects in the water sector.

4.2. The Situation Before the Adoption of the CEPMS

Before the circular economy project portfolio was formalised, the organisation already managed sludge and waste and already reported where they went, but it did so without a dedicated project structure, without a separate investment category for circular initiatives, and without project-level circularity indicators. Sludge management was governed by the general environmental management system and by regulatory compliance, and the destination of each batch depended largely on which outlets were available and what they cost. Two features of that period stand out:
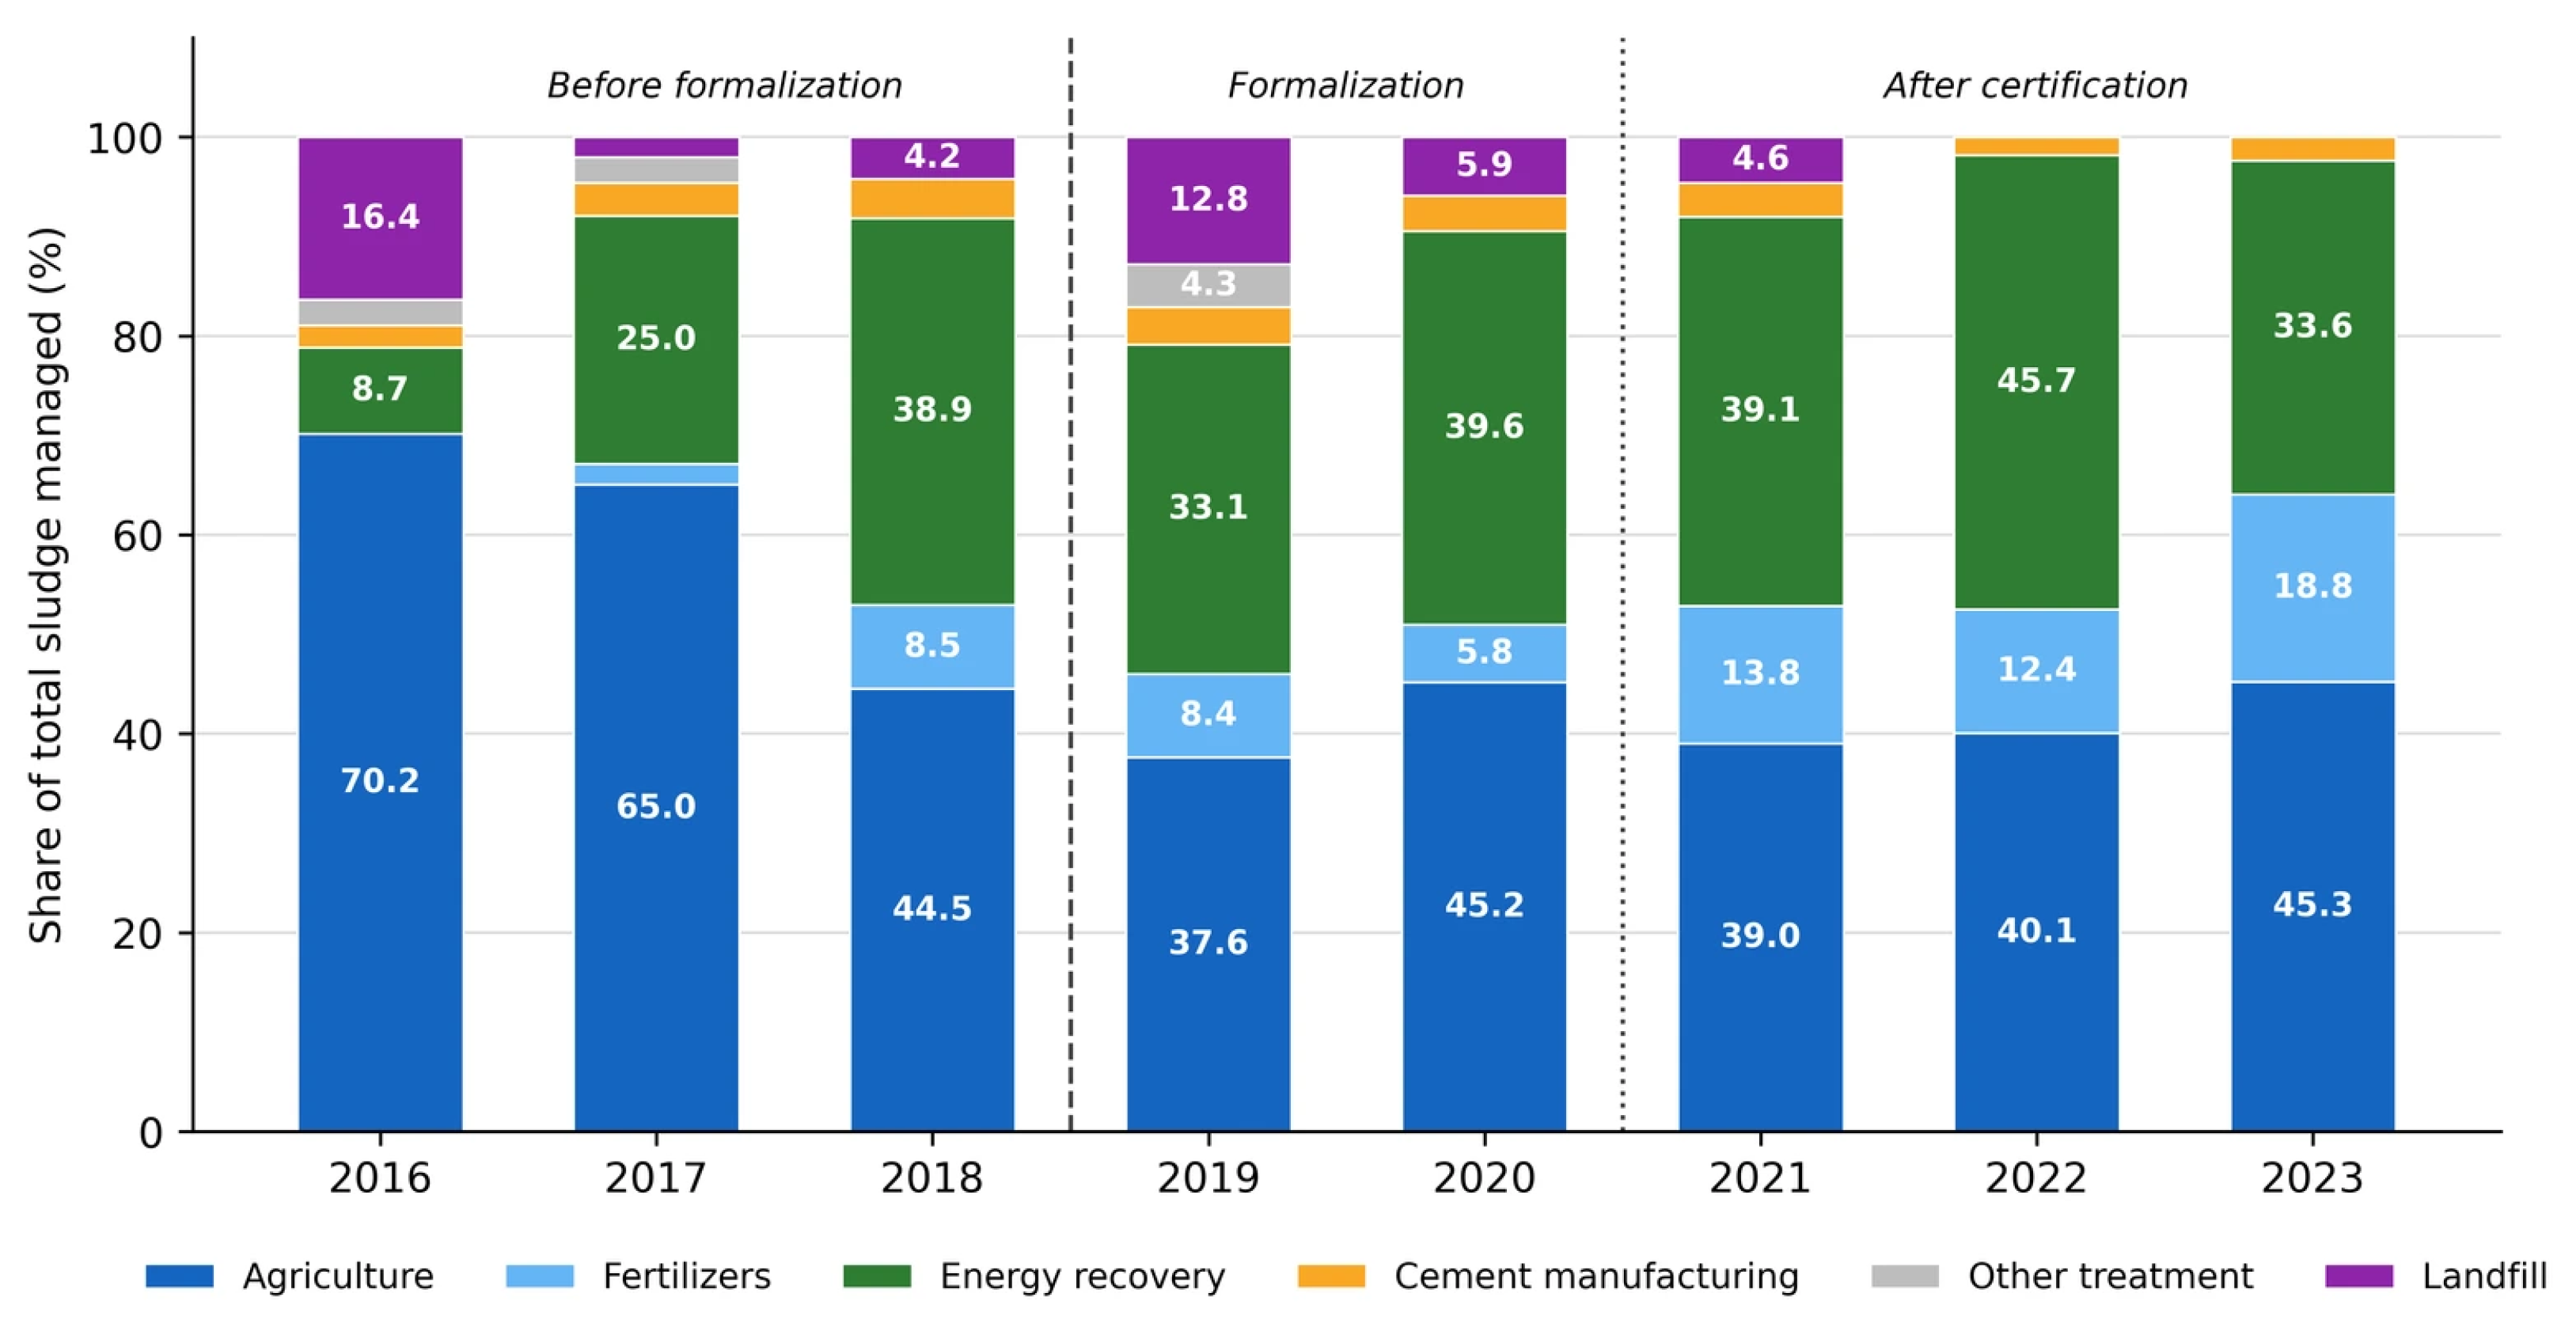
The first is that the destination of sludge was volatile. As Figure 3 shows, the share sent to landfill moved from 16.4% in 2016 to 2.0% in 2017, and then back up to 4.2% in 2018 and 12.8% in 2019, with no clear trend. Agricultural use, including fertiliser production, fell from 70.2% in 2016 to 46.0% in 2019. The pattern of these years is therefore one of substitution between outlets rather than of steady elimination of disposal, which fits a management logic driven by the destinations available rather than by an explicit circularity objective.
The second is that circular projects were not identified separately in the investment plan. The dedicated category for complementary circular economy projects appears only from 2019, with €168,483 committed that year, €1,626,544 in 2020, and €870,092 in 2021; from 2021, the organisation also programmed a five-year circular economy investment plan of €26 million for 2021–2025. No equivalent budget line existed before 2019, and circular initiatives were not planned, reported, or monitored as a distinct portfolio.
Figure 3 reports the destination of the sludge managed across the three periods. It forms the baseline against which the results in Section 4.5 and Section 4.6 should be read: an organisation that already recovered material but did not yet plan that recovery as a portfolio of projects with its own indicators, its own budget line, and its own review cycle.

4.3. Motivations for Undertaking IS Projects

The company’s revenues depend heavily on contracts and services linked to the public sector, and this weighed on its decision to adopt values aligned with sustainability: respect for the environment, involvement with the community, and social welfare. It was also keen to present itself to external stakeholders as environmentally responsible, which encouraged it to certify a CEPMS.
During implementation, and following clause 4.4.2.4 of XP X30-901 [13], the company identified resources and waste that were of no use to it but could create synergies with other companies and become useful to them. This revealed opportunities that it had not previously considered and began a wider strategic reflection on possible circular economy projects. Within the industrial symbiosis area of action, the standard offered guidance for identifying initiatives capable of producing benefits across all three dimensions of sustainability. That guidance led the company to work more systematically, and to find new business opportunities and operational improvements. The process was reinforced by the guidance on end-of-life management, which helped identify solutions to waste management problems that the company regarded as critical in economic, environmental, and social terms.
Bringing new circular economy indicators into the management system was essential to support decision-making, to set priorities, and to quantify potential improvements.
Finally, to certify its CEPMS and meet the requirements of Section 4.4.2.7 of the standard, the company followed the guidance in Annex A and analysed the scope for recovering value from its existing waste. Industrial symbiosis allowed that waste not only to generate new income but also to improve waste management, reduce dependence on primary resources, and anticipate changes in legislation. From an energy point of view, this mattered because some of the streams identified could become biomethane, thermal energy, or other resources useful to the network of agents involved.

4.4. Implementation of IS Projects

Annex A of the XP X30-901 standard sets out the role of local ecosystems in creating synergies between organisations and in recovering resources locally. Key partnerships were selected as the circular economy project portfolio was being formalised and were consolidated later under the certified CEPMS. The starting point was to identify the waste and by-products available, after which different ways of turning these flows into new materials or energy were examined. The standard’s requirement to analyse the depollution of waste ensured that the resources generated through exchange were safe and sustainable.
Four types of action followed, each applying to a different product: treated water, which is not potable but can be reused for street cleaning and irrigation; biomethane, for transport and urban cleaning services; thermal energy, obtained from the heat generated in purification and incineration; and fertilisers rich in phosphorus. Table 3 summarises the main waste streams identified, what each contributes to circular economy strategies, the local actors involved, and the associated impacts.
Once the circular economy project portfolio had been formalised, and after a systematic analysis using economic, social, and environmental indicators, the company decided to build a bio-platform and a treatment plant, which together form the basis of the projects examined here. It assessed the interests of internal staff, local public authorities, local companies, and agricultural associations, and estimated how much waste and how many by-products could be recovered.
The bio-platform, which replaced an earlier municipal incinerator and entered service in 2023, runs two lines:
Sludge Treatment Line: Processes sewage sludge, recovering thermal energy and phosphorus for use in fertiliser. Its design capacity is 65,000 t of wet sludge a year, equivalent to 14,100 t of dry sludge, and 11,120 MWh of heat a year for the district heating network.
Anaerobic Digestion Line: Recovers the organic fraction of municipal solid waste, producing biomethane from wet waste. Its design capacity is 30,000 t a year, and it serves six municipalities.
Once the outputs of the recovery processes had been defined, and taking account of the location of the plant and the guidance in the XP X30-901 standard on local ecosystems, the company established partnerships with local cleaning and transport companies, local agricultural associations, and the public administration, supported by local authorities.
Cleaning and transport companies receive treated water and biomethane, agricultural associations receive fertilisers and treated water for irrigation, and the public administration receives thermal energy to heat public buildings. Together, these relationships form a symbiosis network in which the waste and by-products of one process become useful resources for other agents, closing the material, water, and energy cycles.
The company also aligned its communications with clause 7.4 of XP X30-901 [13]. Its website, for instance, presents it as a model of environmental management, emphasising its limited local impact, its support for local economic development, and its educational work with stakeholders.

4.5. Material, Energy, and Environmental Results

Progress was measured through indicators consistent with the CEPMS and with the guidance of the standard, and chosen so that the organisation could follow its strategy over time. The subsections below set out the main results for each of the resources and projects examined.

4.5.1. Sludge Destination

Figure 3 reports where the sludge managed by the organisation went across the three periods identified in Section 4.1. The trajectory is not a straight line. Landfill took 16.4% of the sludge managed in 2016 and 2.0% in 2017, rose again to 4.2% in 2018 and 12.8% in 2019, then fell to 5.9% in 2020 and 4.6% in 2021, and has been zero since 2022. The combined share going to agriculture and to fertiliser production fell from 70.2% in 2016 to 46.0% in 2019, and then recovered to 51.0% in 2020, 52.9% in 2021, 52.5% in 2022, and 64.1% in 2023. Energy recovery moved the other way over the earlier years, rising from 8.7% in 2016 to 38.9% in 2018, and thereafter fluctuating between 33.1% and 45.7%.
Two points follow: The first is that the end of landfill disposal—the most visible change in the series—was achieved in 2022 and has held since, whereas in the years before the portfolio was formalised the same indicator moved in both directions. The second is that agricultural and fertiliser outlets recovered after 2019, during the period in which these flows were managed as a portfolio with their own indicators, but the 2016 and 2017 figures show that comparable shares had been reached earlier under different market conditions. The series therefore supports a claim about the stability of the outcome rather than about its size.

4.5.2. Waste Generated and Its Destination

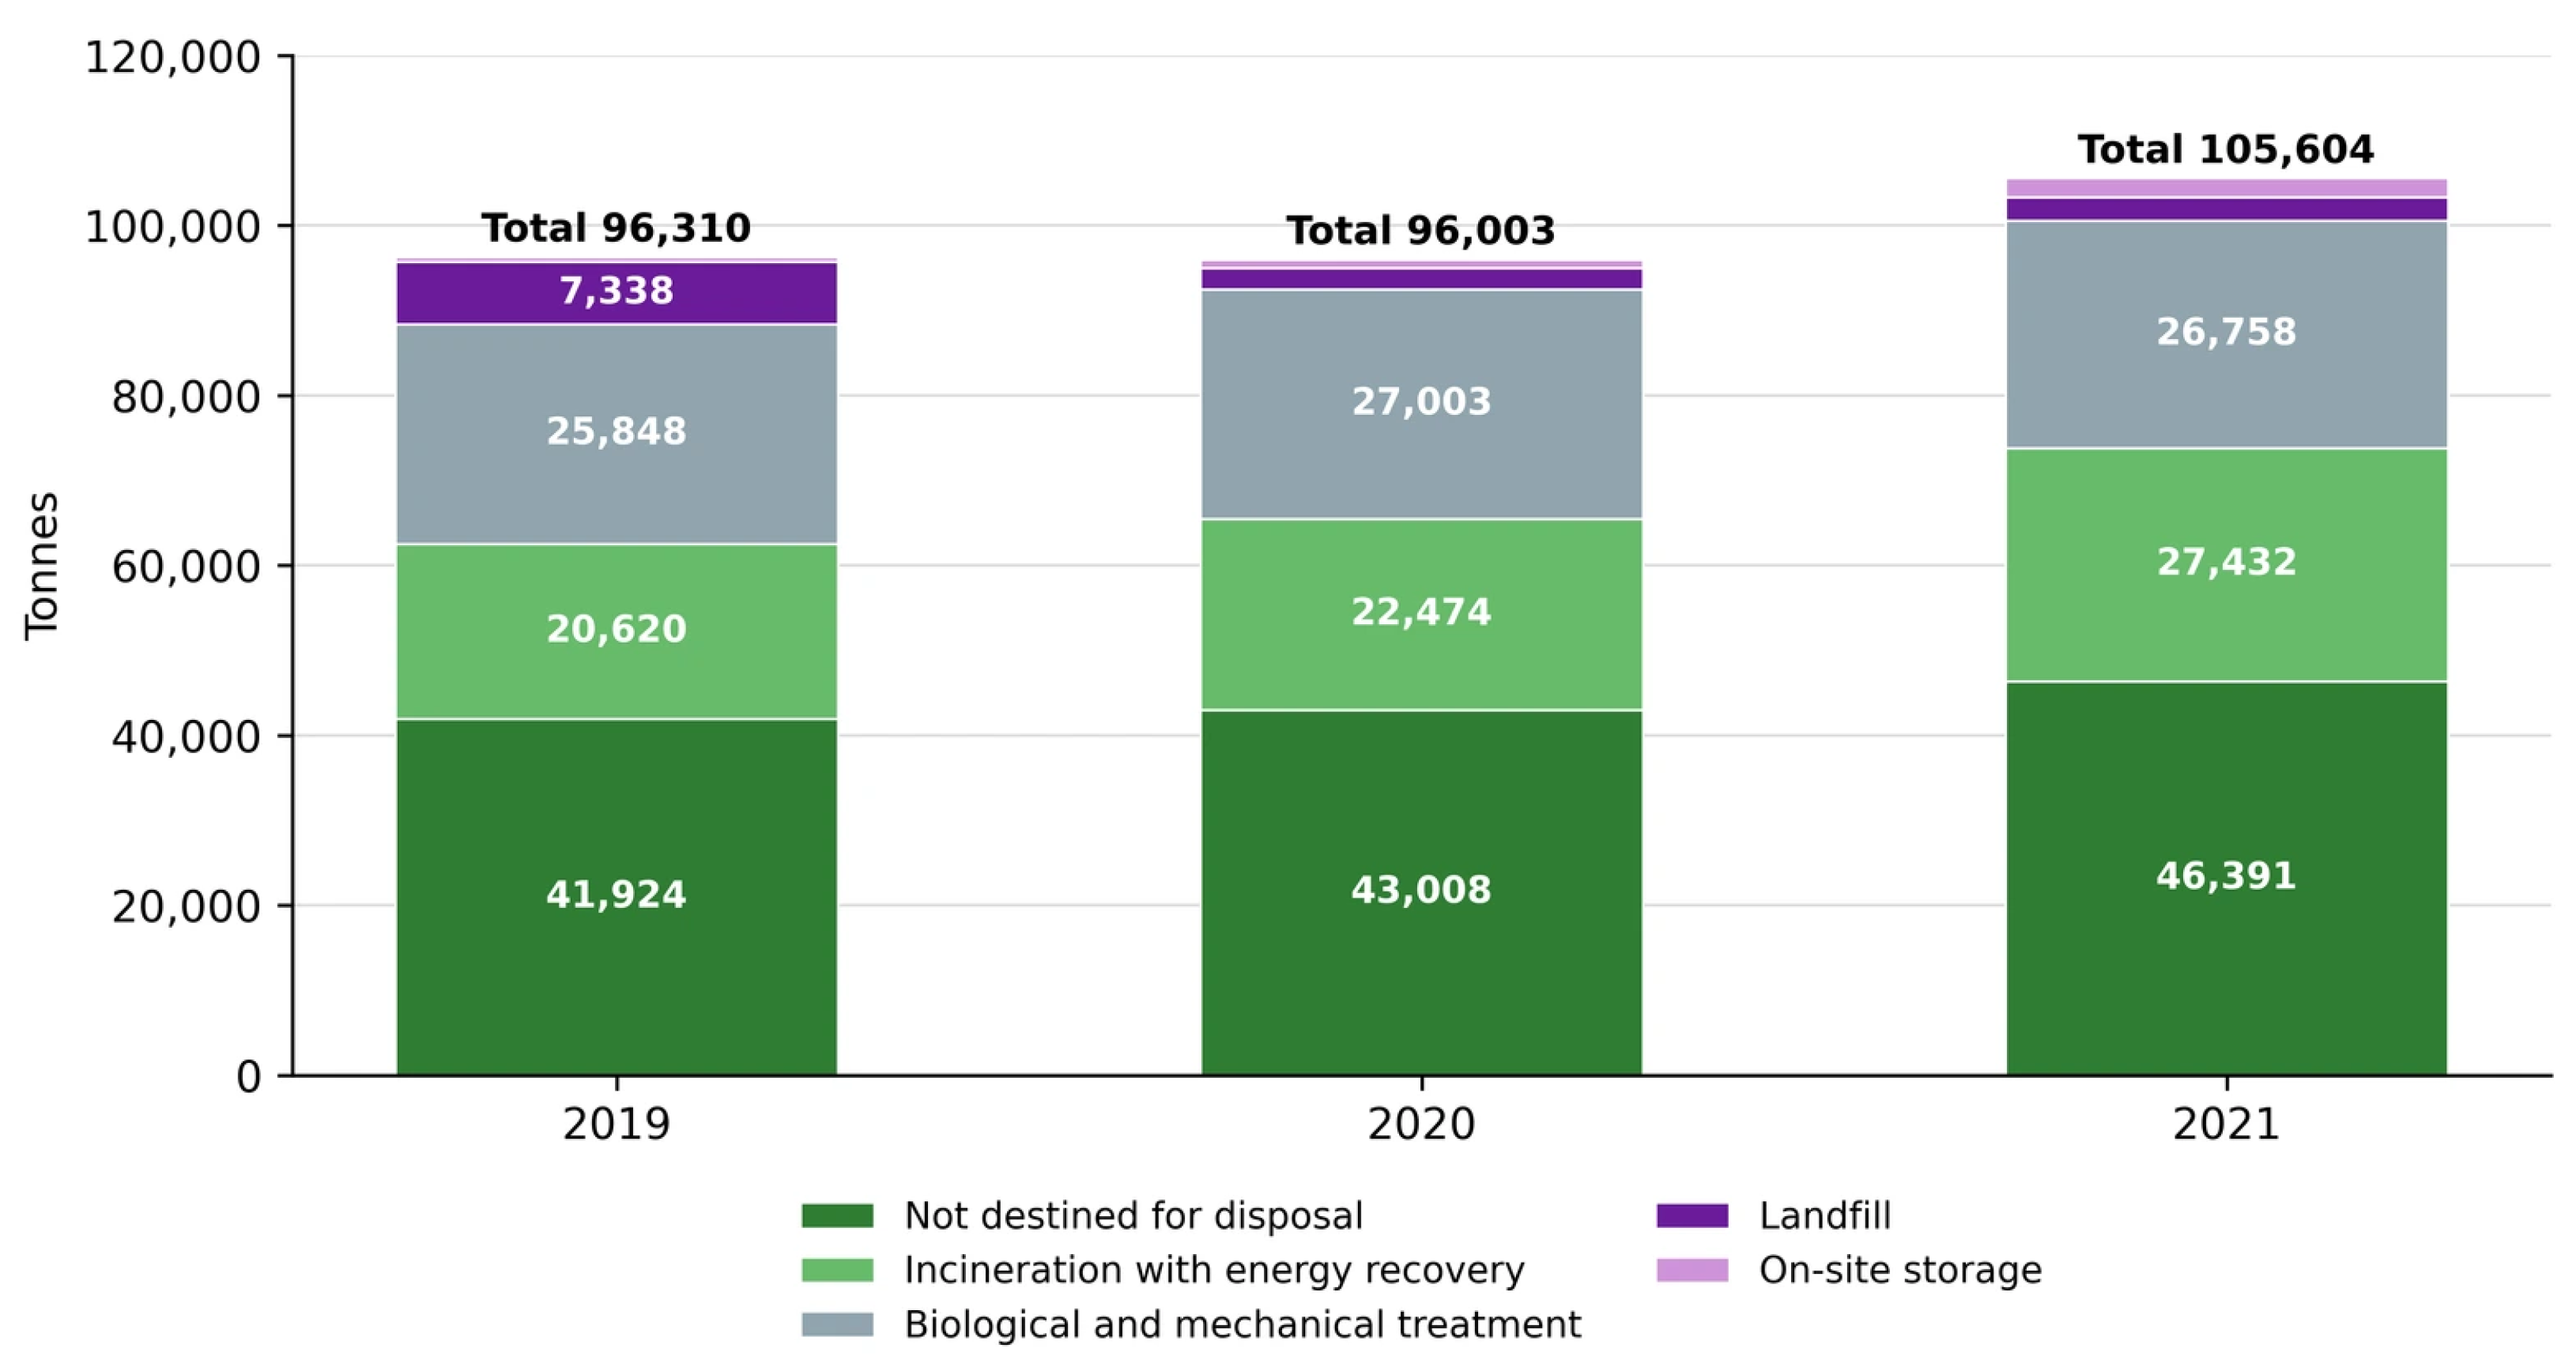
The total waste generated rose from 96,310 t in 2019 to 96,003 t in 2020 and 105,604 t in 2021, an increase of 9.7% over the period. What changed more than the total was the mix of destinations. Waste routed to non-disposal pathways and to incineration with energy recovery rose from 62,544 t in 2019 to 65,483 t in 2020 and 73,823 t in 2021, an increase of 18.0%, taking its share of the total from 64.9% to 69.9%. Within that figure, incineration with energy recovery rose by 33.0%, from 20,620 t to 27,432 t. Waste sent to landfill or to on-site storage fell from 7919 t in 2019 to 3517 t in 2020 and 5023 t in 2021, a reduction of 36.6% over the period, with its share falling from 8.2% to 4.8%. Biological and mechanical treatment stayed broadly flat at 25,848 t in 2019 and 26,758 t in 2021. Figure 4 shows the full breakdown.
These figures show that the improvement in waste management came not from generating less waste, since the volume rose, but from changing where it went. They also show that the fall in landfill and storage was not steady, since the 2021 figure is higher than that for 2020.

4.5.3. Water Reuse

The volume of treated water reused for agricultural irrigation rose from 109.0 million m3 in 2019 to 120.3 million in 2020 and 128.6 million in 2021, fell to 115.3 million in 2022, and rose again to 139.7 million in 2023. As a share of the water treated, the indicator moved from 34.3% in 2019 to 34.7% in 2020 and 36.7% in 2021, reaching roughly 45% in 2023. The series cannot be extended beyond 2023 on a comparable basis, because under the framework adopted in 2024 the organisation assessed recycled and reused water as not material and stopped publishing it. That discontinuity is itself informative: an indicator reported every year under the previous framework disappeared when the materiality criteria changed, which shows how far the comparability of circularity indicators depends on reporting frameworks that lie outside the management system.
This indicator varies more than the sludge destination series, and what drives it is largely external: the volume reused depends on rainfall, on how much irrigation the agricultural consortia downstream of the plants require, and on the authorisations in force. In 2024, the organisation launched a project to maximise agricultural reuse in co-operation with irrigation consortia and channel operators.

4.5.4. Energy Recovery

Thermal energy produced by the biogas upgrading plant rose from 3162 MWh in 2019 to 5814 MWh in 2020 and 6567 MWh in 2021, and then fell to 5558 MWh in 2022 and 4409 MWh in 2023. Energy transferred to other systems followed the same shape, moving from 4773 MWh in 2020 to 5514 MWh in 2021, 4774 MWh in 2022, and 3991 MWh in 2023. Biomethane produced from municipal sewage sludge and fed into the national grid came to 648,529 standard cubic metres (Sm3) in 2021 and 533,073 Sm3 in 2024; the plant concerned has been running since 2019.
Total renewable energy generation, measured on the basis used from 2024 onwards, was 37,803 MWh in 2024 and 48,650 MWh in 2025, the latter covering 87.9% of total energy consumption. No equivalent figure is published for 2023 under the same label; the closest comparable magnitude for that year is 98,304,317 MJ of direct energy consumption from renewable sources, or roughly 27,300 MWh. Because the underlying definition changed with the reporting framework, the 2023 figure and those for 2024 and 2025 are reported separately rather than as one continuous series.

4.5.5. Nutrient Recovery

Sludge applied to land also supplies nutrients directly to local agricultural associations. Each tonne of sludge is estimated to provide 117 kg of organic matter, 11.4 kg of nitrogen, 10.8 kg of phosphorus, and 1.03 kg of potassium. These are the nutrients contained in the sludge applied to land and should not be confused with phosphorus recovered as a concentrated product, which requires a separate extraction process. The projects therefore contribute not only to energy recovery but also to nutrient recovery and to the partial substitution of conventional raw materials.
Phosphorus, which the European Union lists as a critical raw material, is the subject of a dedicated line of work within the portfolio. Throughout the period examined, this line remained at the research and pilot stage. It comprised a research contract on the design and management of temporary ash deposits intended for phosphorus extraction, a pilot plant developed with a technical university, and participation in a collaborative project on the removal and recovery of phosphorus from wastewater and sludge. No annual tonnage of recovered phosphorus is reported for the period, and the line is therefore presented here as a project under development rather than as a quantified outcome.
In parallel, the organisation set a target of raising the share of fertilisers produced from sewage sludge from 5.0% in 2024 to 20.0% in 2025, which indicates that nutrient recovery is managed as an objective with a defined baseline and horizon rather than as a by-product of treatment.

4.6. The Economic Dimension of the Valorisation Routes

A full cost–benefit analysis was not possible, for the reasons given in Section 6. However, the unit costs of transport are available for each sludge disposal destination, allowing for an indicative assessment of the economic performance of the recovery options. These figures are set out in Table 4.
Three patterns stand out: First, the average unit cost rose between 2020 and 2022, from €114.22 to €134.34 per tonne, and then fell to €107.15 in 2025. The organisation attributes the fall from 2024 onwards to the deflation of a price bubble that had affected the agricultural outlet over the preceding three years, which suggests that much of the cost trajectory reflects market conditions rather than the management system. Second, the two cheapest routes throughout the period were agriculture and fertiliser production—precisely the destinations whose combined share rose to 64.1% in 2023—so in this case the environmentally preferred route was also the least costly. Third, the cost of sending semi-solid sludge to external energy recovery moved the other way, rising from €160.34 per tonne in 2020 to €174.11 in 2025. The organisation links this to lower-quality sludge and presents it as part of the reason for bringing sludge mono-incineration in-house at the bio-platform.
In aggregate, total sludge disposal costs fell from €11,502,099 in 2023 to €10,057,209 in 2024, a reduction of 13%. On the investment side, the dedicated circular economy category within the environmental investment plan grew from €168,483 in 2019 to €1,626,544 in 2020 and €870,092 in 2021, and was then programmed as a five-year plan of €26 million for 2021–2025.
These figures are indicative rather than a measure of efficiency. They capture the unit cost of each destination and the aggregate cost of disposal, but they exclude the capital cost of the assets, the revenue from the resources recovered, and the avoided cost of the alternatives not used. They are nonetheless consistent with a recurring finding in the economics of waste management: that gains in circularity and gains in cost do not necessarily move together, and that where they do coincide, as in the agricultural and fertiliser routes here, the coincidence owes something to relative prices that the operator does not control [67,68,69]. The case therefore neither confirms nor contradicts the trade-off between recovery rates and unit costs reported in that literature. It shows a configuration in which, over the period examined, the two moved together for the dominant route and in opposite directions for external energy recovery.

4.7. New Sustainability Actions

Investment rose in 2025, and further investment is planned for 2026, directed at a new bio-platform. This became partially operational in December 2025 and awaits a further sludge treatment plant, due by the end of 2026, and a laboratory for analysing per- and polyfluoroalkyl substances (PFAS), due in 2027. Monitoring these pollutants is becoming a condition of using recovered materials on land, as European rules on water reuse and urban wastewater treatment have tightened the requirements for sludge and its derived products.
These commitments follow the patterns that produced the earlier results: a cascade of indicators distributed across the areas of action, among which industrial symbiosis and waste management are the most closely integrated, and continued reliance on public–private partnerships. The new bio-platform is to be run through a jointly owned vehicle in which the organisation holds the majority stake and local public bodies hold the remainder.

4.8. Contribution to the Sustainable Development Goals

Industrial symbiosis carried out within the CEPMS also advanced several indicators linked to the Sustainable Development Goals. The clearest is SDG 6, with 128.6 million m3 of treated water reused for agricultural irrigation in 2021, or 36.7% of the water treated. SDG 7 is reflected in the 6567 MWh of thermal energy and the 648,529 Sm3 of biomethane of that same year, and SDG 12 in the 73,823 t of waste routed to non-disposal and energy-recovery pathways and in the end of landfill disposal for sludge from 2022. For SDG 17, the organisation reports a shared-value indicator of 11.5% for 2021, defined as the depreciation of investments generating a social and environmental benefit over total investments; this covers the whole portfolio and is not the share devoted to the partnerships examined here.
The CEPMS framework therefore proved a useful tool for supporting waste recovery, energy recovery, the reuse of water and nutrients, and the reduction in waste sent to landfill. The results should nonetheless be read with care: it is not known what the company would have achieved had it pursued a circular economy strategy without adopting a CEPMS, and Section 4.5 and Section 4.6 show that several indicators depend on hydrological, market, and regulatory factors beyond the reach of the management system.

5. Discussion

Industrial symbiosis initiatives within the circular economy have grown in importance between 2020 and 2025, both in the figures recorded over the period and in the investment planned for the years ahead [15]. The results here show that symbiosis projects developed within a CEPMS can improve the management of waste, materials, and energy in the water sector. In this case, applying the XP X30-901 standard gave structure to the identification of opportunities, the setting of priorities, the definition of indicators, and the monitoring of results. That matters, and it is consistent with earlier work, because it shows that symbiosis need not be an isolated collaborative practice: it can be a management process that is planned, monitored, and improved within a standardised framework [18].

5.1. Which Outcomes the Management System Stabilises, and Which It Does Not

Comparing the pre-adoption baseline with the later period allows a more precise reading of what the CEPMS contributed than a general claim of improved performance. Table 5 classifies the indicators examined by how far the organisation controls them and by what drives their variation from year to year.
Read this way, the evidence suggests that the CEPMS is associated with the stabilisation of outcomes that depend on decisions internal to the organisation, rather than with uniform improvement across all indicators. The end of landfill disposal, sustained since 2022, is the clearest instance: the same indicator had moved in both directions between 2016 and 2019, and it settled once internal treatment capacity and contracted destinations were managed within a project portfolio with its own review cycle. The volume of water reused, by contrast, depends on rainfall and on the demand of agricultural consortia, and it continued to fluctuate throughout, while the unit cost of the destinations tracked the relevant markets. This distinction matters because it marks out what can reasonably be claimed for a management standard: it appears to consolidate what the organisation controls, and to leave largely untouched what it does not.
A second and less expected finding concerns the indicators themselves. When the reporting framework changed in 2024 and the water reuse indicator was discontinued, it became clear that the long-term replicability of these trends depends not only on operational performance but also on the stability of the disclosure regime. A management system can sustain an outcome and still lose the means of demonstrating it. This is a practical limitation for any longitudinal assessment of circularity, and one that the literature on circularity indicators has tended to treat as a measurement problem rather than a governance problem [72,73].
From an energy point of view, the results are mixed. Turning organic waste into biomethane confirms the potential of symbiosis projects to convert waste streams into useful energy [17]. This is consistent with the work of Neves et al. [20], who found energy exchanges to be among the most durable synergies in symbiosis networks, and with the emphasis that Domenech et al. [23] place on anchor tenants. It differs in one respect that the case makes visible: biomethane fed into the grid fell between 2021 and 2024, and thermal energy declined after 2021, even as total renewable generation rose. The explanation lies in how the assets were reconfigured rather than in any loss of performance. Individual exchange flows can therefore contract precisely when the network is being strengthened, so flow-level indicators may misrepresent the direction of change unless read alongside the configuration of the assets.
On water, the case underlines the importance of the sector as a setting for resource recovery. As the literature notes, wastewater treatment plants are no longer seen only as treatment infrastructure but increasingly as platforms for recovering water, energy, nutrients, and secondary raw materials [13,45,48]. The case supports that view for water and energy but qualifies it for nutrients. Where the literature on resource recovery facilities often presents phosphorus recovery as an established output [87], here it remained at the pilot stage throughout, held back by technological readiness and by the regulatory admissibility of the recovered product. This gap is not a shortcoming of the case but an indication that recovery routes within a single facility can differ in maturity by several years, which matters for designing realistic project portfolios.
Organisationally, adopting the standard changed the company’s management logic. The CEPMS prompted a strategic reflection on which available waste and by-products were treated not as operational burdens but as potentially recoverable resources [23,26,31]. That reflection produced the four main lines of action, with economic, environmental, social, and energy benefits. The standard therefore acted as a tool for organisational learning, helping the company turn waste management problems into opportunities for innovation, collaboration, and value creation [13,35]. This is consistent with the argument of Boiral et al. [76] that the environmental performance associated with formal management systems depends substantially on the awareness and leadership of those who operate them—reflected here in the fact that the separate investment category preceded certification by two years.
On inter-organisational alliances, the collaboration network played the role that the European Commission report describes [24]: it allowed waste and by-products from one process to be used by other agents, closing the material, water, and energy cycles. The case confirms that symbiosis requires not only technical capability but also mechanisms for co-ordination, trust, information exchange, and the alignment of interests [35,36,38,41].
On waste management, the results show that improvement depends not only on generating less waste but on recovering more of it. The final environmental impact can fall even as waste generation rises, provided effective mechanisms for material and energy recovery are in place [45,46,54]. The CEPMS helped steer management towards more circular outcomes, favouring value recovery over disposal [13].

5.2. Circularity and Cost: A Comparison with the Economics of Waste Management

The economic evidence in Section 4.6 allows a limited but explicit comparison with the literature on cost efficiency in waste management. That literature identifies a recurring trade-off: higher recovery rates often come with higher unit costs, so eco-efficiency does not follow automatically from circularity [68]. Studies of Spanish local governments show that the relationship is mediated by how the service is delivered and by scale [67], and analyses based on production costs and on single-operator models point to organisational structure and transaction costs as decisive [69,70].
In this case, the relationship differs in one respect and coincides in another: It differs because the route whose share grew most—agriculture and fertiliser production—was also the cheapest throughout, so no trade-off appears for the dominant flow. It coincides because the most expensive route—external energy recovery of semi-solid sludge—became more expensive as its use continued, which is what the literature would predict. Two features of the case may explain the difference: The first is that the operator is a vertically integrated utility rather than a purchaser of municipal services, so bringing treatment capacity in-house is available to it as a cost lever, as the decision to build the bio-platform shows. The second is that the low cost of the agricultural route here reflects a regional demand for sludge-derived fertiliser that does not exist everywhere, which limits how far this particular result travels. The comparison therefore suggests that the trade-off found in the municipal waste literature depends on the structure of the service and on local demand for the recovered material, rather than being a general property of circular configurations.
The case also shows how symbiosis contributes to several SDGs. Water recovery and reuse relate directly to SDG 6; thermal energy and biogas production contribute to SDG 7; the recovery of sludge, waste, and nutrients supports SDG 12; and collaboration between companies, public administrations, and local agents relates to SDG 17. This spread reinforces the cross-cutting character of symbiosis projects and shows that circular economy standards can work as governance tools linking environmental, energy, economic, and social objectives—a link that Fatimah et al. [81] also identified where smart waste management systems are designed explicitly against the SDGs.
Taken together, the findings suggest that standardising circular economy project management has a part to play in the shift towards more circular and energy-efficient production [6,7]. Unlike informal or isolated approaches, a CEPMS allows opportunities to be identified systematically, indicators to be set, agents to be co-ordinated, results to be evaluated, and improvement to be pursued continuously [9,13].
This matters as the ISO 59000 family consolidates, because it provides empirical evidence on how a CEPMS can support the practical implementation of symbiosis projects in waste recovery, energy recovery, and resource efficiency, together with an indication of which associated indicators can reasonably be expected to remain stable over time and which cannot.

6. Conclusions

The main contribution of this article is empirical evidence that, in the case examined, industrial symbiosis developed within a standardised circular economy project management framework was associated with tangible results in resource recovery and energy efficiency. Waste streams can be converted into materials and energy, reducing the need for final disposal and supporting more circular management of production systems. Internal or external recovery projects can therefore reduce dependence on primary resources and offer a useful route towards more sustainable models in resource-intensive sectors. Comparison with the period before the circular economy project portfolio was formalised suggests that the most durable change concerns the stability of the outcomes rather than their size: shares comparable to the current ones had been reached before 2019 for some destinations, but they had not been sustained.
The case also underlines the importance of the CEPMS itself. It acted as a facilitating tool, giving structure to decision-making, defining priorities, establishing indicators, and encouraging continuous improvement. For industrial symbiosis, it was critical in defining partnerships between organisations. Collaboration with public administrations, local companies, agricultural associations, and other environmental stakeholders was essential in turning waste and by-products into useful resources. Symbiosis therefore requires a combination of technical, organisational, and relational skills.
In practical terms, and within the limits of this case, the standard helped the organisation to identify opportunities for resource recovery, open new lines of business, improve operational efficiency, and anticipate regulatory change. The results also suggest that policies supporting the circular economy should promote not only waste reduction but the creation of circular networks, particularly in sectors with strong potential for recovering water, energy, nutrients, and materials. Co-ordinating initiatives within a sector may help organisations to address new challenges, using indicators from earlier years as a reference while keeping longer-term goals in view.
This research has several limitations. It rests on a single case in a particular sector, so the results cannot be generalised statistically. The case was also chosen from among organisations that had already certified a CEPMS and developed symbiosis projects, which is appropriate for a revelatory case but means that unsuccessful implementations cannot be observed; the outcomes reported here should therefore not be read as what adopting a CEPMS can be expected to deliver. Small businesses and organisations without a developed network of symbiosis partners may find them harder to reproduce.
Second, the economic assessment in Section 4.6 is indicative and not a cost–benefit analysis. It rests on unit transfer costs and aggregate disposal costs, and it excludes the capital cost of the assets, the revenue from the resources recovered, and the counterfactual cost of the destinations not used. A full assessment would require project-level accounting data that are not available. Third, the comparability of the series is limited by the change of reporting framework in 2024, which altered the definition of some indicators and ended others; the water reuse and sludge destination series therefore both end in 2023. Fourth, the qualitative evidence rests on a small number of informants, which limits the range of internal perspectives represented. Certain indicators, such as greenhouse gas emissions, have been excluded from this study because they are calculated at the organisational level and cannot be attributed to individual symbiosis projects. Fifth, although this case yields relevant quantifiable results, future research could widen the analysis through comparisons between sectors, companies, or countries, and through longitudinal studies tracking how results evolve.
Future research should examine the relationship between circular economy standards, waste management, and the generation of new resources more closely, comparing adopters and non-adopters across sectors and countries, using harmonised functional units, and validating project-level circularity indicators aligned with ISO 59020. Longitudinal work should separate the effects of adopting a management system from those of capital investment, regulation, and energy prices. Economic efficiency deserves particular attention, applying to certified CEPMS adopters the data envelopment and productivity methods already established in the municipal waste literature [68,71].

Author Contributions

Conceptualization, G.A.-L. and B.L.-M.; methodology, G.A.-L. and N.U.-G.; formal analysis, N.U.-G. and W.S.-T.; investigation, N.U.-G. and W.S.-T.; data curation, W.S.-T.; writing—original draft preparation, N.U.-G. and B.L.-M.; writing—review and editing, G.A.-L. and B.L.-M.; visualization, W.S.-T.; supervision, G.A.-L.; project administration, B.L.-M. All authors have read and agreed to the published version of the manuscript.

Funding

This research received no external funding.

Data Availability Statement

Restrictions apply to the availability of the data analysed in this study. The internal project documents and the interview material were provided to the authors by the organisation and are not publicly available, because they contain information that would identify the case and were shared on the understanding that the organisation would not be named. The derived datasets underlying the tables and figures are available from the corresponding author on reasonable request.

Acknowledgments

The authors thank the staff of the case organisation for the time they gave to this research and for granting access to the documentation on which the study is based. All individuals named in this section have consented to the acknowledgment. The authors also thank the T4BSS research group at the University of the Basque Country, to which G.A.-L., N.U.-G. and B.L.-M. belong, for its support throughout the work.

Conflicts of Interest

The authors declare no conflict of interest.

Abbreviations

AbbreviationMeaning
CECircular Economy
DEAData Envelopment Analysis
ESRSEuropean Sustainability Reporting Standards
GRIGlobal Reporting Initiative
ISIndustrial Symbiosis
CEPMSCircular Economy Project Management System
KPIKey Performance Indicator
PDCAPlan–Do–Check–Act
PFASPer- and Polyfluoroalkyl Substances
SDGSustainable Development Goal

References

  1. Khan, M.I.; Yasmeen, T.; Khan, M.; Hadi, N.U.; Asif, M.; Farooq, M.; Al-Ghamdi, S.G. Integrating industry 4.0 for enhanced sustainability: Pathways and prospects. Sustain. Prod. Consum. 2025, 54, 149–189. [Google Scholar] [CrossRef] [Scilit]
  2. Konyannik, B.Y.; Lavie, J.D. Valorization techniques for biomass waste in energy generation: A systematic review. Bioresour. Technol. 2025, 435, 132973. [Google Scholar] [CrossRef] [Scilit] [PubMed]
  3. Neves, F.; Soares, A.A.; Rouboa, A. Systematic review of biomass supercritical water gasification for energy production. Energies 2025, 18, 5374. [Google Scholar] [CrossRef] [Scilit]
  4. Bjørnbet, M.M.; Skaar, C.; Fet, A.M.; Schulte, K.Ø. Circular economy in manufacturing companies: A review of case study literature. J. Clean. Prod. 2021, 294, 126268. [Google Scholar] [CrossRef] [Scilit]
  5. Sarquah, K.; Narra, S.; Beck, G.; Derkyi, N.S.A.; Awafo, E.; Hartmann, M.; Nelles, M. Evaluating opportunities of refuse-derived fuel for energy-based industrial symbiosis towards a circular economy-a case study. J. Environ. Manag. 2025, 380, 125126. [Google Scholar] [CrossRef] [Scilit] [PubMed]
  6. Laskurain-Iturbe, I.; Arana-Landín, G.; Landeta-Manzano, B.; Uriarte-Gallastegi, N. Exploring the influence of Industry 4.0 technologies on the circular economy. J. Clean. Prod. 2021, 321, 128944. [Google Scholar] [CrossRef] [Scilit]
  7. Uriarte-Gallastegi, N.; Arana-Landín, G.; Landeta-Manzano, B.; Laskurain-Iturbe, I. The role of AI in improving environmental sustainability: A focus on energy management. Energies 2024, 17, 649. [Google Scholar] [CrossRef] [Scilit]
  8. Chandrawansa, A. From practice to standard: Exploring Finnish companies’ circular economy practices and their relation to ISO 59010 through the lens of new institutional theory. Master’s Thesis, University of Eastern Finland, Kuopio, Finland, May 2026. [Google Scholar]
  9. Heras-Saizarbitoria, I.; Boiral, O.; Testa, F. ISO 59000 standards for the Circular Economy: A call for accuracy. SSRN Electron. J. 2023. [Google Scholar] [CrossRef] [Scilit]
  10. ISO 14001:2026; Environmental Management Systems—Requirements with Guidance for Use. International Organization for Standardization: Geneva, Switzerland, 2026.
  11. ISO 50001:2018; Energy Management Systems—Requirements with Guidance for Use. International Organization for Standardization: Geneva, Switzerland, 2018.
  12. ISO 14006:2020; Environmental Management Systems—Guidelines for Incorporating Ecodesign. International Organization for Standardization: Geneva, Switzerland, 2020.
  13. XP X30-901:2018; Circular Economy—Circular Economy Project Management System—Requirements and Guidelines. Association Française de Normalisation (AFNOR): Saint-Denis, France, 2018.
  14. Arana-Landín, G.; Sigüenza, W.; Landeta-Manzano, B.; Laskurain-Iturbe, I. Circular economy: On the road to ISO 59000 family of standards. Corp. Soc. Responsib. Environ. Manag. 2024, 31, 1977–2009. [Google Scholar] [CrossRef] [Scilit]
  15. Fraccascia, L.; Yazdanpanah, V.; van Capelleveen, G.; Yazan, D.M. Energy-based industrial symbiosis: A literature review for circular energy transition. Environ. Dev. Sustain. 2021, 23, 4791–4825. [Google Scholar] [CrossRef] [Scilit]
  16. Cárcamo, E.A.B.; Peñabaena-Niebles, R. Opportunities and challenges for the waste management in emerging and frontier countries through industrial symbiosis. J. Clean. Prod. 2022, 363, 132607. [Google Scholar] [CrossRef] [Scilit]
  17. Wang, S.; Wan, Z.; Han, Y.; Jiao, Y.; Li, Z.; Fu, P.; Li, N.; Zhang, A.; Yi, W. A review on lignin waste valorization by catalytic pyrolysis: Catalyst, reaction system, and industrial symbiosis mode. J. Environ. Chem. Eng. 2023, 11, 109113. [Google Scholar] [CrossRef] [Scilit]
  18. Namany, S.; Al-Ansari, T.; Govindan, R. Sustainable energy, water and food nexus systems: A focused review of decision-making tools for efficient resource management and governance. J. Clean. Prod. 2019, 225, 610–626. [Google Scholar] [CrossRef] [Scilit]
  19. Doménech, T.; Davies, M. The role of embeddedness in industrial symbiosis networks: Phases in the evolution of industrial symbiosis networks. Bus. Strategy Environ. 2011, 20, 281–296. [Google Scholar] [CrossRef] [Scilit]
  20. Herczeg, G.; Akkerman, R.; Hauschild, M.Z. Supply chain collaboration in industrial symbiosis networks. J. Clean. Prod. 2018, 171, 1058–1067. [Google Scholar] [CrossRef] [Scilit]
  21. ISO 59010:2024; Circular Economy—Guidance on the Transition of Business Models and Value Networks. International Organization for Standardization: Geneva, Switzerland, 2024. Available online: https://www.iso.org/standard/80649.html (accessed on 1 June 2026).
  22. Abu-Bakar, H.; Charnley, F. Developing a strategic methodology for circular economy roadmapping: A theoretical framework. Sustainability 2024, 16, 6682. [Google Scholar] [CrossRef] [Scilit]
  23. European Commission; Directorate-General for Environment. Tools Making Value Chains More Circular and Resource Efficient: Voluntary Agreements, Standardisation & Non-Financial Reporting—Summary Report; Publications Office of the European Union: Luxembourg, 2019. [Google Scholar] [CrossRef] [PubMed]
  24. Deutsches Institut für Normung (DIN). Standards Research on the Circular Economy. Available online: https://www.din.de/en/innovation-and-research/circular-economy/standards-research-on-the-circular-economy (accessed on 30 June 2026).
  25. Morris, K.C.; Ferrero, V.; Hapuwatte, B.; Last, N.; Mathur, N. Standards as Enablers for a Circular Economy. In Technology Innovation for the Circular Economy: Recycling, Remanufacturing, Design, Systems Analysis and Logistics; Nasr, N., Ed.; Scrivener Publishing: Beverly, MA, USA, 2024; pp. 1–16. [Google Scholar] [CrossRef] [Scilit]
  26. Asia-Pacific Economic Cooperation. Implementing Circular Economy Standards in the APEC Region—Guidance and Recommendations Report; APEC Secretariat: Singapore, 2024; Available online: https://research.csiro.au/circulareconomy/wp-content/uploads/sites/303/2024/05/APEC-Circular-Economy-Final-Report-30.4.24.pdf (accessed on 3 June 2026).
  27. United Nations. Transforming Our World: The 2030 Agenda for Sustainable Development; A/RES/70/1; United Nations: New York, NY, USA, 2015; Available online: https://sdgs.un.org/2030agenda (accessed on 3 June 2026).
  28. European Commission. Communication from the Commission to the European Parliament, the Council, the European Economic and Social Committee and the Committee of the Regions: Closing the Loop—An EU Action Plan for the Circular Economy; COM(2015) 614 Final; European Commission: Brussels, Belgium, 2015; Available online: https://eur-lex.europa.eu/legal-content/EN/TXT/?uri=CELEX:52015DC0614 (accessed on 5 June 2026).
  29. BS 8001:2017; Framework for Implementing the Principles of the Circular Economy in Organizations—Guide. British Standards Institution (BSI): London, UK, 2017.
  30. Pomponi, F.; Moncaster, A. Briefing: BS 8001 and the built environment: A review and critique. Proc. Inst. Civ. Eng. Eng. Sustain. 2019, 172, 111–114. [Google Scholar] [CrossRef] [Scilit]
  31. Muradin, M.; Foltynowicz, Z. The circular economy in the standardized management system. Amfiteatru Econ. 2019, 21, 871–883. [Google Scholar] [CrossRef] [Scilit]
  32. ISO 59020:2024; Circular Economy—Measuring and Assessing Circularity Performance. International Organization for Standardization (ISO): Geneva, Switzerland, 2024. Available online: https://www.iso.org/standard/80650.html (accessed on 1 June 2026).
  33. ISO 59004:2024; Circular Economy—Vocabulary, Principles and Guidance for Implementation. International Organization for Standardization (ISO): Geneva, Switzerland, 2024. Available online: https://www.iso.org/standard/80648.html (accessed on 1 June 2026).
  34. Kirchherr, J.; Yang, N.-H.N.; Schulze-Spüntrup, F.; Heerink, M.J.; Hartley, K. Conceptualizing the circular economy (revisited): An analysis of 221 definitions. Resour. Conserv. Recycl. 2023, 194, 107001. [Google Scholar] [CrossRef] [Scilit]
  35. Ghisellini, P.; Cialani, C.; Ulgiati, S. A review on circular economy: The expected transition to a balanced interplay of environmental and economic systems. J. Clean. Prod. 2016, 114, 11–32. [Google Scholar] [CrossRef] [Scilit]
  36. Teixeira, N. Green innovation and national competitiveness: Rethinking economic resilience in the sustainability transition. Sustainability 2025, 17, 7660. [Google Scholar] [CrossRef] [Scilit]
  37. Ababio, B.K.; Lu, W. Barriers and enablers of circular economy in construction: A multi-system perspective towards the development of a practical framework. Constr. Manag. Econ. 2023, 41, 3–21. [Google Scholar] [CrossRef] [Scilit]
  38. Khadim, N.; van Marrewijk, A. Circles of profit: A conceptual framework for economic and financial aspects in circular construction. Sustain. Prod. Consum. 2025, 55, 444–457. [Google Scholar] [CrossRef] [Scilit]
  39. Vallecha, H.; Bhola, P. Prioritization of challenges and enablers associated with community energy projects in Indian context. Energy Procedia 2019, 158, 3886–3892. [Google Scholar] [CrossRef] [Scilit]
  40. Urbinati, A.; Franzò, S.; Chiaroni, D. Enablers and barriers for circular business models: An empirical analysis in the Italian automotive industry. Sustain. Prod. Consum. 2021, 27, 551–566. [Google Scholar] [CrossRef] [Scilit]
  41. Eikelenboom, M.; de Jong, G. The impact of managers and network interactions on the integration of circularity in business strategy. Organ. Environ. 2022, 35, 365–393. [Google Scholar] [CrossRef] [Scilit]
  42. Mazutis, D.; Nubi, A.; Segal, E. Advancing circularity: The dynamic capabilities to drive transformative change. Calif. Manag. Rev. 2026, 68, 63–88. [Google Scholar] [CrossRef] [Scilit]
  43. Victar, H.C.; Waidyasekara, A.S. Optimising construction waste management in Sri Lanka through circular economy strategies: A focus on construction and renovation and use and operate stages. Eng. Constr. Archit. Manag. 2025, 32, 4275–4309. [Google Scholar] [CrossRef] [Scilit]
  44. Simioni, F.J.; Soares, J.F.; Rosário, J.d.A.d.; Sell, L.G.; Bertol, E.; Souza, F.M.P.; Santos Júnior, E.P.; Coelho Junior, L.M. Industrial Symbiosis and Circular Economy Practices Towards Sustainability in Forest-Based Clusters: Case Studies in Southern Brazil. Sustainability 2024, 16, 9258. [Google Scholar] [CrossRef] [Scilit]
  45. Smol, M. Circular Economy in Wastewater Treatment Plant—Water, Energy and Raw Materials Recovery. Energies 2023, 16, 3911. [Google Scholar] [CrossRef] [Scilit]
  46. Ramin, E.; Faria, L.; Gargalo, C.L.; Ramin, P.; Flores-Alsina, X.; Andersen, M.M.; Gernaey, K.V. Water innovation in industrial symbiosis: A global review. J. Environ. Manag. 2024, 350, 119578. [Google Scholar] [CrossRef] [Scilit] [PubMed]
  47. Javan, K.; Altaee, A.; BaniHashemi, S.; Darestani, M.; Zhou, J.; Pignatta, G. A review of interconnected challenges in the water–energy–food nexus: Urban pollution perspective towards sustainable development. Sci. Total Environ. 2024, 912, 169319. [Google Scholar] [CrossRef] [Scilit] [PubMed]
  48. Adom, R.K.; Simatele, M.D. Overcoming systemic and institutional challenges in policy implementation in South Africa’s water sector. Sustain. Water Resour. Manag. 2024, 10, 69. [Google Scholar] [CrossRef] [Scilit]
  49. Alakaş, H.M.; Gür, Ş.; Özcan, E.; Eren, T. Ranking of sustainability criteria for industrial symbiosis applications based on ANP. J. Environ. Eng. Landsc. Manag. 2020, 28, 192–201. [Google Scholar] [CrossRef] [Scilit]
  50. Wang, D.; Zhu, W.; Zhang, C.; Li, H.; Wu, Y. Stakeholder symbiosis in the context of corporate social responsibility. Symmetry 2020, 12, 1897. [Google Scholar] [CrossRef] [Scilit]
  51. Donner, M.; de Vries, H. How to innovate business models for a circular bio-economy? Bus. Strategy Environ. 2021, 30, 1932–1947. [Google Scholar] [CrossRef] [Scilit]
  52. Sitadewi, D.; Yudoko, G.; Okdinawati, L. Bibliographic mapping of post-consumer plastic waste based on hierarchical circular principles across the system perspective. Heliyon 2021, 7, e07154. [Google Scholar] [CrossRef] [Scilit] [PubMed]
  53. Czaplicka-Kotas, A.; Kulczycka, J.; Iwaszczuk, N. Energy clusters as a new urban symbiosis concept for increasing renewable energy production-A case study of Zakopane City. Sustainability 2020, 12, 5634. [Google Scholar] [CrossRef] [Scilit]
  54. Che, C.; Zhang, X.; Chen, Y.; Zhao, L.; Zhang, Z. A model of waste price in a symbiotic supply chain based on Stackelberg algorithm. Sustainability 2021, 13, 1740. [Google Scholar] [CrossRef] [Scilit]
  55. Cioca, L.-I.; Ciomoş, A.-O.; Șeitoar, D.; Druță, R.M.; David, G.M. Industrial Symbiosis through the Use of Biosolids as Fertilizer in Romanian Agriculture. Recycling 2021, 6, 59. [Google Scholar] [CrossRef] [Scilit]
  56. Cáceres, C.R.; Törnroth, S.; Vesterlund, M.; Johansson, A.; Sandberg, M. Data-Center Farming: Exploring the Potential of Industrial Symbiosis in a Subarctic Region. Sustainability 2022, 14, 2774. [Google Scholar] [CrossRef] [Scilit]
  57. Huang, L.; Zhen, L.; Yin, L. Waste material recycling and exchanging decisions for industrial symbiosis network optimization. J. Clean. Prod. 2020, 276, 124073. [Google Scholar] [CrossRef] [Scilit]
  58. Leiva, H.; Julian, I.; Ventura, L.; Wallin, E.; Vendt, M.; Fornell, R.; Galindo Paniagua, F.; Ascaso, S.; Gomez-Perez, M. Advancing Sustainability Through Industrial Symbiosis: A Technoeconomic Approach Using Material Flow Cost Accounting and Cost–Benefit Analysis. Sustainability 2025, 17, 2730. [Google Scholar] [CrossRef] [Scilit]
  59. Vermunt, D.A.; Negro, S.O.; Verweij, P.A.; Kuppens, D.V.; Hekkert, M.P. Exploring barriers to implementing different circular business models. J. Clean. Prod. 2019, 222, 891–902. [Google Scholar] [CrossRef] [Scilit]
  60. Wrålsen, B.; Prieto-Sandoval, V.; Mejia-Villa, A.; O’Born, R.; Hellström, M.; Faessler, B. Circular business models for lithium-ion batteries-Stakeholders, barriers, and drivers. J. Clean. Prod. 2021, 317, 128393. [Google Scholar] [CrossRef] [Scilit]
  61. Kristoffersen, E.; Mikalef, P.; Blomsma, F.; Li, J. The effects of business analytics capability on circular economy implementation, resource orchestration capability, and firm performance. Int. J. Prod. Econ. 2021, 239, 108205. [Google Scholar] [CrossRef] [Scilit]
  62. Yu, H.; Yang, B.; Wang, S.; Wang, Y.; Wang, S.; Wang, Z.; Wang, Z. An effective multi-part dedicated flow-line reconfiguration model considering the optimal selection of machining process path and machines. Proc. Inst. Mech. Eng. B 2023, 237, 154–170. [Google Scholar] [CrossRef] [Scilit]
  63. Kazancoglu, I.; Kazancoglu, Y.; Yarimoglu, E.; Kahraman, A. A conceptual framework for barriers of circular supply chains for sustainability in the textile industry. Sustain. Dev. 2020, 28, 1477–1492. [Google Scholar] [CrossRef] [Scilit]
  64. Pathak, R.; Endayilalu, A. Circular economy: A perspective of Ethiopian textile sector. Int. J. All Res. Writ. 2019, 1, 101–109. [Google Scholar]
  65. Kirchherr, J.; Piscicelli, L.; Bour, R.; Kostense-Smit, E.; Muller, J.; Huibrechtse-Truijens, A.; Hekkert, M. Barriers to the circular economy: Evidence from the European Union (EU). Ecol. Econ. 2018, 150, 264–272. [Google Scholar] [CrossRef] [Scilit]
  66. Munonye, W.C.; Ajonye, G.O.; Akinloye, O.A. Industrial symbiosis in circular economies through policy and practice for waste to resource innovation. Discov. Sustain. 2025, 6, 1371. [Google Scholar] [CrossRef] [Scilit]
  67. Santhappan, J.S.; Winsly, B.W.; Mathimani, T. Integration of bioenergy in industrial symbiosis and the assessment of its environmental and life cycle impact for circular energy transition. Energy Convers. Manag. 2025, 345, 120376. [Google Scholar] [CrossRef] [Scilit]
  68. Hernández-Arzaba, J.C.; Nazir, S.; Leyva-Hernández, S.N.; Muhyaddin, S. Stakeholder pressure engaged with circular economy principles and economic and environmental performance. Sustainability 2022, 14, 16302. [Google Scholar] [CrossRef] [Scilit]
  69. Ellen MacArthur Foundation. Artificial Intelligence and the Circular Economy—AI as a Tool to Accelerate the Transition; Ellen MacArthur Foundation: Cowes, UK, 2019. [Google Scholar]
  70. Cioffi, R.; Travaglioni, M.; Piscitelli, G.; Petrillo, A.; Parmentola, A. Smart Manufacturing Systems and Applied Industrial Technologies for a Sustainable Industry: A Systematic Literature Review. Appl. Sci. 2020, 10, 2897. [Google Scholar] [CrossRef] [Scilit]
  71. Dantas, T.E.T.; de-Souza, E.D.; Destro, I.R.; Hammes, G.; Rodriguez, C.M.T.; Soares, S.R. How the combination of Circular Economy and Industry 4.0 can contribute towards achieving the Sustainable Development Goals. Sustain. Prod. Consum. 2021, 26, 213–227. [Google Scholar] [CrossRef] [Scilit]
  72. Pathan, M.S.; Richardson, E.; Galvan, E.; Mooney, P. The Role of Artificial Intelligence within Circular Economy Activities-A View from Ireland. Sustainability 2023, 15, 9451. [Google Scholar] [CrossRef] [Scilit]
  73. Barathi, A.; Kundu, D.; Pooja, K.; Surya, M.; Jacob, S.; Samanta, P.; Kumar, V.; Kuila, A. Toward sustainable industry: Integrating industrial symbiosis, biorefineries, and circular economy for SDG alignment. Sustain. Energy Fuels 2026, 10, 1816–1844. [Google Scholar] [CrossRef] [Scilit]
  74. Chiappetta Jabbour, C.J.; Seuring, S.; Lopes de Sousa Jabbour, A.B.; Jugend, D.; de Camargo Fiorini, P.; Latan, H.; Izeppi, W.C. Stakeholders, innovative business models for the circular economy and sustainable performance of firms in an emerging economy facing institutional voids. J. Environ. Manag. 2020, 264, 110416. [Google Scholar] [CrossRef] [Scilit] [PubMed]
  75. Cantú, A.; Aguiñaga, E.; Scheel, C. Learning from Failure and Success: The Challenges for Circular Economy Implementation in SMEs in an Emerging Economy. Sustainability 2021, 13, 1529. [Google Scholar] [CrossRef] [Scilit]
  76. Khan, S.; Ali, S.S.; Singh, R. Determinants of Remanufacturing Adoption for Circular Economy: A Causal Relationship Evaluation Framework. Appl. Syst. Innov. 2022, 5, 62. [Google Scholar] [CrossRef] [Scilit]
  77. Tabassum, Z.; Mohan, A.; Mamidi, N.; Khosla, A.; Kumar, A.; Solanki, P.R.; Malik, T.; Girdhar, M. Recent trends in nanocomposite packaging films utilising waste generated biopolymers: Industrial symbiosis and its implication in sustainability. IET Nanobiotechnol. 2023, 17, 127–153. [Google Scholar] [CrossRef] [Scilit] [PubMed]
  78. Bosco, C.; Raspati, G.S.; Maurin, N.; Helness, H. A systematic literature review on resource recovery toward symbiotic circular economy solutions in the water sector. J. Environ. Manag. 2025, 393, 127298. [Google Scholar] [CrossRef] [Scilit] [PubMed]
  79. Yin, R.K. Case Study Research and Applications: Design and Methods, 6th ed.; SAGE Publications: Thousand Oaks, CA, USA, 2018. [Google Scholar]
  80. Eisenhardt, K.M. Building theories from case study research. Acad. Manag. Rev. 1989, 14, 532–550. [Google Scholar] [CrossRef] [Scilit]
  81. Miles, M.B.; Huberman, A.M.; Saldaña, J. Qualitative Data Analysis: A Methods Sourcebook, 4th ed.; SAGE Publications: Thousand Oaks, CA, USA, 2018. [Google Scholar]
  82. Boiral, O.; Baron, C.; Gunnlaugson, O. Environmental leadership and consciousness development: A case study among Canadian SMEs. J. Bus. Ethics 2014, 123, 363–383. [Google Scholar] [CrossRef] [Scilit]
  83. Fatimah, Y.A.; Govindan, K.; Murniningsih, R.; Setiawan, A. Industry 4.0 based sustainable circular economy approach for smart waste management system to achieve sustainable development goals: A case study of Indonesia. J. Clean. Prod. 2020, 269, 122263. [Google Scholar] [CrossRef] [Scilit]
  84. Zafra-Gómez, J.L.; López-Pérez, G.; Garrido-Montañés, M.; Zafra-Gómez, E. Cost efficiency in municipal solid waste (MSW): Different alternatives in service delivery for small and medium sized Spanish local governments. Sustainability 2023, 15, 6198. [Google Scholar] [CrossRef] [Scilit]
  85. Lo Storto, C. Evaluating the eco-efficiency of municipal solid waste management: Determinants, paradoxes, and trade-offs. Urban Sci. 2025, 9, 395. [Google Scholar] [CrossRef] [Scilit]
  86. Beccarello, M.; Di Foggia, G. Defining the organization of municipal solid waste management based on production costs. Urban Sci. 2023, 7, 34. [Google Scholar] [CrossRef] [Scilit]
  87. Di Foggia, G.; Arrigo, U.; Beccarello, M. Policy insights from a single-operator model for municipal solid waste management. Urban Sci. 2025, 9, 145. [Google Scholar] [CrossRef] [Scilit]
  88. Lo Storto, C. Eco-productivity analysis of the municipal solid waste service in the Apulia region from 2010 to 2017. Sustainability 2021, 13, 12008. [Google Scholar] [CrossRef] [Scilit]
  89. Sánchez-Ortiz, J.; Rodríguez-Cornejo, V.; Del Río-Sánchez, R.; García-Valderrama, T. Indicators to measure efficiency in circular economies. Sustainability 2020, 12, 4483. [Google Scholar] [CrossRef] [Scilit]
  90. Jin, B.; Li, W. Spatial effects and driving factors of consumption upgrades on municipal solid waste eco-efficiency, considering emission outputs. Sustainability 2025, 17, 2356. [Google Scholar] [CrossRef] [Scilit]
Figure 1. XP X30-901 standard structure: the colours group the clauses of the standard by stage of the Plan-Do-Check-Act cycle. Adapted from [14].
Environments 13 00472 g001
Figure 2. Key organisational values supporting CEPMS-based IS projects in the water sector. The colours distinguish the groups of flows shown in the legend and carry no quantitative meaning. Elaboration: Prepared by the authors based on the case documentation.
Environments 13 00472 g002
Figure 3. Destination of sludge managed as a share of the total, 2016–2023. The dashed line marks the formalisation of the circular economy project portfolio in 2019 and the dotted line the certification of the CEPMS in 2021, which define the three periods identified in Section 4.1. Colours distinguish the destination routes, as shown in the legend. Elaboration: Prepared by the authors based on the case documentation.
Environments 13 00472 g003
Figure 4. Waste generated and destination pathways, 2019–2021 (tonnes). Elaboration: Prepared by the authors based on the case documentation.
Environments 13 00472 g004
Table 1. Key differences and similarities between CE standards: BS 8001:2017, XP X30-901:2018, ISO 59004:2024, ISO 59010:2024, and ISO 59020:2024.
DimensionBS 8001:2017XP X30-901:2018ISO 59004:2024ISO 59010:2024ISO 59020:2024
Nature and scopeApplying CE principles in organisations of different sectors and sizes.Managing CE projects through a structured project framework.Provides international terminology, principles, and guidance for implementing the CE.Provides international guidance on moving business models and value networks towards the CE.Sets requirements and guidance for measuring and assessing circularity performance.
Methodological structureOffers a flexible, non-prescriptive framework adaptable to different organisations.Follows an operational structure based on the PDCA cycle for CE projects.Sets out principles and guidance for embedding the CE across the organisation.Maps current value networks and designs the transition to circular models.Defines indicators, measures circularity, and evaluates performance.
Resource and energy efficiencyCovers resource efficiency, life-cycle thinking, waste reduction, reuse, and recycling, with indirect implications for energy use.Covers the optimisation of material, water, infrastructure, and energy flows within specific CE projects.Emphasises resource traceability, value retention, and efficient resource use, supporting the energy transition.Guides the redesign of value networks to cut resource and energy consumption.Measures resource and energy efficiency through circularity indicators.
Performance measurementDoes not prescribe specific circularity metrics.Encourages project-level monitoring through KPIs.Supplemented by ISO 59020:2024.Supplemented by ISO 59020:2024.Provides guidance for measuring and assessing circularity.
Industrial symbiosis and collaborationHighlights collaboration and shared value creation among stakeholders and business networks.Treats IS as a specific area of action, enabling synergies through exchange.Promotes IS as a circular strategy for sharing the value of resources.Guides the creation of IS through collaborative value networks.Measures the circularity gains achieved through IS initiatives.
End-of-life and value recoveryIntroduces life-cycle thinking and strategies to minimise waste and retain value.Addresses effective end-of-life management explicitly, as one of the CE areas of action.Uses life-cycle approaches to retain and recover value from materials and resources.Guides recovery loops, reuse, remanufacturing, and recycling in value networks.Measures end-of-life recovery performance and retained material value.
Relevance for energy-oriented CE researchUseful as a general conceptual framework linking circularity, resource efficiency, and sustainability.Shows how a standardised CEPMS can support IS, energy recovery, and waste valorisation.Provides a global framework connecting the CE with resource efficiency and the energy transition.Guides business model transitions that improve energy and resource efficiency.Measures improvements in energy and resource efficiency through circularity indicators.
Note. PDCA = Plan–Do–Check–Act. Elaboration: Prepared by the authors based on the five management standards.
Table 2. Data sources, description, and analytical purpose of the case study.
Data SourceDescriptionAnalytical Purpose
Semi-structured interviewsTechnician (two interviews) and manager (one interview), 2022–2023Establish motivations, implementation process, and perceived outcomes
Internal documentsSix project-related documents, January 2023–December 2025Reconstruct project design, indicators, and operational results
External documentsAnnual reports of the organisation, 2016–2025Triangulate the evidence, build the pre-adoption baseline, and set the case in context
Quantitative indicatorsWaste, sludge, water reuse, biomethane, thermal energy, and unit cost data, 2016–2025Assess material, environmental, economic, and energy-related outcomes
Elaboration: Prepared by the authors.
Table 3. Waste valorisation pathways and CE contributions in IS.
Annual Input Flow to the Valorisation Route (2019)New Valorised ResourceUser or Local AgentContribution to the CESustainable Impact
Municipal organic waste 1 (≈30,000 t, design capacity of the dedicated line)BiomethaneUrban services (transport and cleaning)Energy recovery from organic wasteLess use of fossil fuels and better use of local resources
Sewage sludge (≈20,300 t to energy recovery in 2019)Thermal energyPublic buildings and local administrationsEnergy recovery from sludgeLess landfill disposal and a local supply of heat
Sludge to agriculture and fertiliser (≈28,200 t in 2019) and treated water (≈109 M m3 reused in 2019)Reused water and nutrientsLocal agricultural associations, urban services, non-potable usesNutrient recovery, partial substitution of conventional raw materials, water circularity and reuseClosing water cycles and easing pressure on water resources
Water treatment by-productsRecovered materials and resourcesLocal companies, administration and local stakeholdersIS and collaboration between organisationsShared value creation and stronger territorial networks
Note. Figures are the annual input to each route in 2019, not the total sludge managed (see Figure 3). 1 Design capacity of the anaerobic digestion line, which entered service in 2023. Elaboration: Prepared by the authors based on the case documentation.
Table 4. Sludge transfer cost by destination (€ per tonne), 2020–2025.
Destination202020212022202320242025
Sludge to agriculture104.32105.37112.28118.0488.6982.06
Sludge to landfill202.00
Dried sludge to energy recovery or cement157.34132.08184.93146.67134.30112.17
Semi-solid sludge to energy recovery160.34158.57159.68161.70172.17174.11
Fertilisers75.3095.22117.32117.48112.0586.39
Bio-dried sludge to energy recovery140.00140.00140.00144.90144.90144.90
Average cost114.22120.98134.34127.49110.81107.15
Elaboration: Prepared by the authors based on the case documentation.
Table 5. Classification of the indicators examined by degree of control and drivers of variability.
IndicatorDegree of Organisational ControlIdentified Drivers of VariationBehaviour Observed
Sludge sent to landfillHigh: depends on contracted destinations and internal treatment capacityAvailability of alternative outlets; commissioning of internal capacityVolatile until 2019; zero and stable from 2022
Sludge to agriculture and fertilisersMedium: depends on demand for the agricultural outlet and its priceRelative prices of destinations; sludge quality; agronomic regulationFalls to 46.0% in 2019; recovers to 64.1% in 2023
Waste to non-disposal and energy-recovery pathwaysHigh: depends on internal routing decisionsComposition of the waste generated; contracted capacityRises 18.0% between 2019 and 2021
Treated water reusedLow: depends on downstream demandRainfall; irrigation demand; authorisationsFluctuates markedly; indicator discontinued from 2024
Thermal energy producedMedium: depends on biogas availability and plant operationSludge volume and quality; plant availabilityRises to 2021; declines to 2023
Unit sludge transfer costLow: set by the marketPrices in the destination markets; sludge qualityRises to 2022; falls to 2025
Recovered phosphorusHigh but immature: at pilot stageTechnological readiness; regulatory admissibilityNot quantified in the period examined
Elaboration: Prepared by the authors based on the case documentation.
Disclaimer/Publisher’s Note: The statements, opinions and data contained in all publications are solely those of the individual author(s) and contributor(s) and not of MDPI and/or the editor(s). MDPI and/or the editor(s) disclaim responsibility for any injury to people or property resulting from any ideas, methods, instructions or products referred to in the content.