Article

Geochemical Patterns of Soil and Water in Recently Deglaciated Lands of Peruvian Tropical Glaciers


1
Research Center for Environmental Earth Science and Technology (ESAT-FCAM), Faculty of Environmental Sciences, Universidad Nacional Santiago Antúnez de Mayolo, 200 Centenario Avenue, Huaraz 02002, Peru
2
Departamento de Geografía, Universidad Complutense de Madrid, c/Profesor Aranguren s/n, 28040 Madrid, Spain
3
Faculty of Biological Sciences, Universidad Nacional Mayor de San Marcos, 375 Carlos Germán Amezaga Avenue, Lima 15081, Peru
*
Author to whom correspondence should be addressed.
Environments 2026, 13(8), 423; https://doi.org/10.3390/environments13080423

Submission received: 15 June 2026 / Revised: 13 July 2026 / Accepted: 23 July 2026 / Published: 27 July 2026
(This article belongs to the Section Climate Change and Ecosystems)

Abstract

The shrinking of glaciers is drastically transforming headwater catchments, exposing new land surfaces and forming new water bodies, characterized by marked environmental gradients and the activation of potential geochemical hazards. The aim of this study was to characterize and compare the geochemical patterns of soil and water in areas deglaciated between 1970/1984 and 2025 within the Llaca and Gueshgue valleys of the Cordillera Blanca, Peru. Systematic soil and water sampling was conducted, and data were analyzed using descriptive statistics and multivariate techniques. The analyses revealed a clear and statistically significant geochemical differentiation between the two areas (p ≤ 0.05). Gueshgue was identified as a system in transition, exhibiting geochemical signatures of acid rock drainage (ARD), with loamy soils rich in Fe and Al, and acidic waters featuring high redox potential and elevated concentrations of SO42−, EC, Co, Cu, Mn and Mg. In contrast, Llaca exhibited greater stability, with neutral waters and sandy soils dominated by silicate weathering signatures (SiO2) and trace elements (Al, Li, Ba, K, and Ti). These findings indicate that the impact of glacier retreat on proglacial ecosystems is heterogeneous; identifying these geochemical patterns is fundamental to establishing baseline monitoring and guiding the sustainable management of these climate-change-sensitive ecosystems.

1. Introduction

Tropical glaciers are indicators of past, present, and future climate change [1,2] and key components of high-mountain environmental systems, as they play a fundamental role in hydrological regulation, energy-balance control, and the maintenance of physical, chemical, and biogeochemical processes within ecosystems [3,4,5]. In the high tropical Andes, these glacier systems act as natural water reservoirs, contributing significantly to seasonal water supply and conditioning the dynamics of rivers, lakes, and developing soils [6,7,8]. However, in recent decades, tropical glaciers have undergone accelerated retreat as a consequence of rising temperatures [9,10] and variations in precipitation patterns [10].
Climate change is generating profound impacts on tropical mountain ecosystems [11,12]. Glaciers are among the most affected components because of their high sensitivity [13,14], thereby threatening the sustainability of proglacial and periglacial ecosystems. In this context, Peru, which contains 68% of the world’s tropical glaciers, has lost approximately 56% (1348.75 km2) of its glacier area over the last six decades [15]. In general, mountain ranges with greater glacier cover tend to lose larger areas over time [14]; for example, the Cordillera Blanca has lost 41.5% (301.40 km2) of its glacier area since 1962/1970 [15].
This accelerated deglaciation is driving profound transformations in the landscape and functioning of high-mountain ecosystems [16,17], exposing and reshaping new terrestrial environments, including the expansion of proglacial soils [18,19] as well as aquatic environments, through the formation and expansion of new lakes and streams [6,20]. These environments should be continuously monitored [15,21] as they may trigger future socio-environmental conflicts related to competing uses of water and land resources [4,22,23]. Such ecosystem transformations promote physical and chemical weathering processes, the mobilization of fine sediments, and the release of chemical elements from formerly ice-covered bedrock into aquatic and soil systems [24]. These processes alter their physicochemical properties, quality, and functionality as habitats, with subsequent implications for the primary ecological succession of biological communities [6,25].
These areas recently exposed by glacier retreat constitute major natural laboratories for studying the composition and evolution of abiotic factors, as well as their future ecosystem functions and services. Internationally, several studies have addressed these ecosystems in the Arctic [21,26], Switzerland [27,28,29,30,31], Norway [32,33,34], China [35,36], Poland [37], India [38], and Nepal [39]. However, the information gap for tropical glaciers, such as those of the Cordillera Blanca, remains substantial, given the limited and spatially biased research conducted to date [23,40,41,42,43,44].
In this context, the aim of this study was to comprehensively describe and comparatively analyze the geochemical patterns, including physical and chemical properties, of water and soil in areas recently exposed by the retreat of tropical valley glaciers in Llaca and Gueshgue. The joint assessment of these environmental compartments allows the identification of variability patterns, relationships among parameters, and potential spatial contrasts between both glacier-influenced environmental systems in the context of climate-change-driven transformations. Overall, the results of this study contribute to improving current understanding of the environmental processes associated with glacier retreat in the tropical Andes and provide relevant information for the management and conservation of high-mountain ecosystems in Peru.

2. Materials and Methods

2.1. Study Area

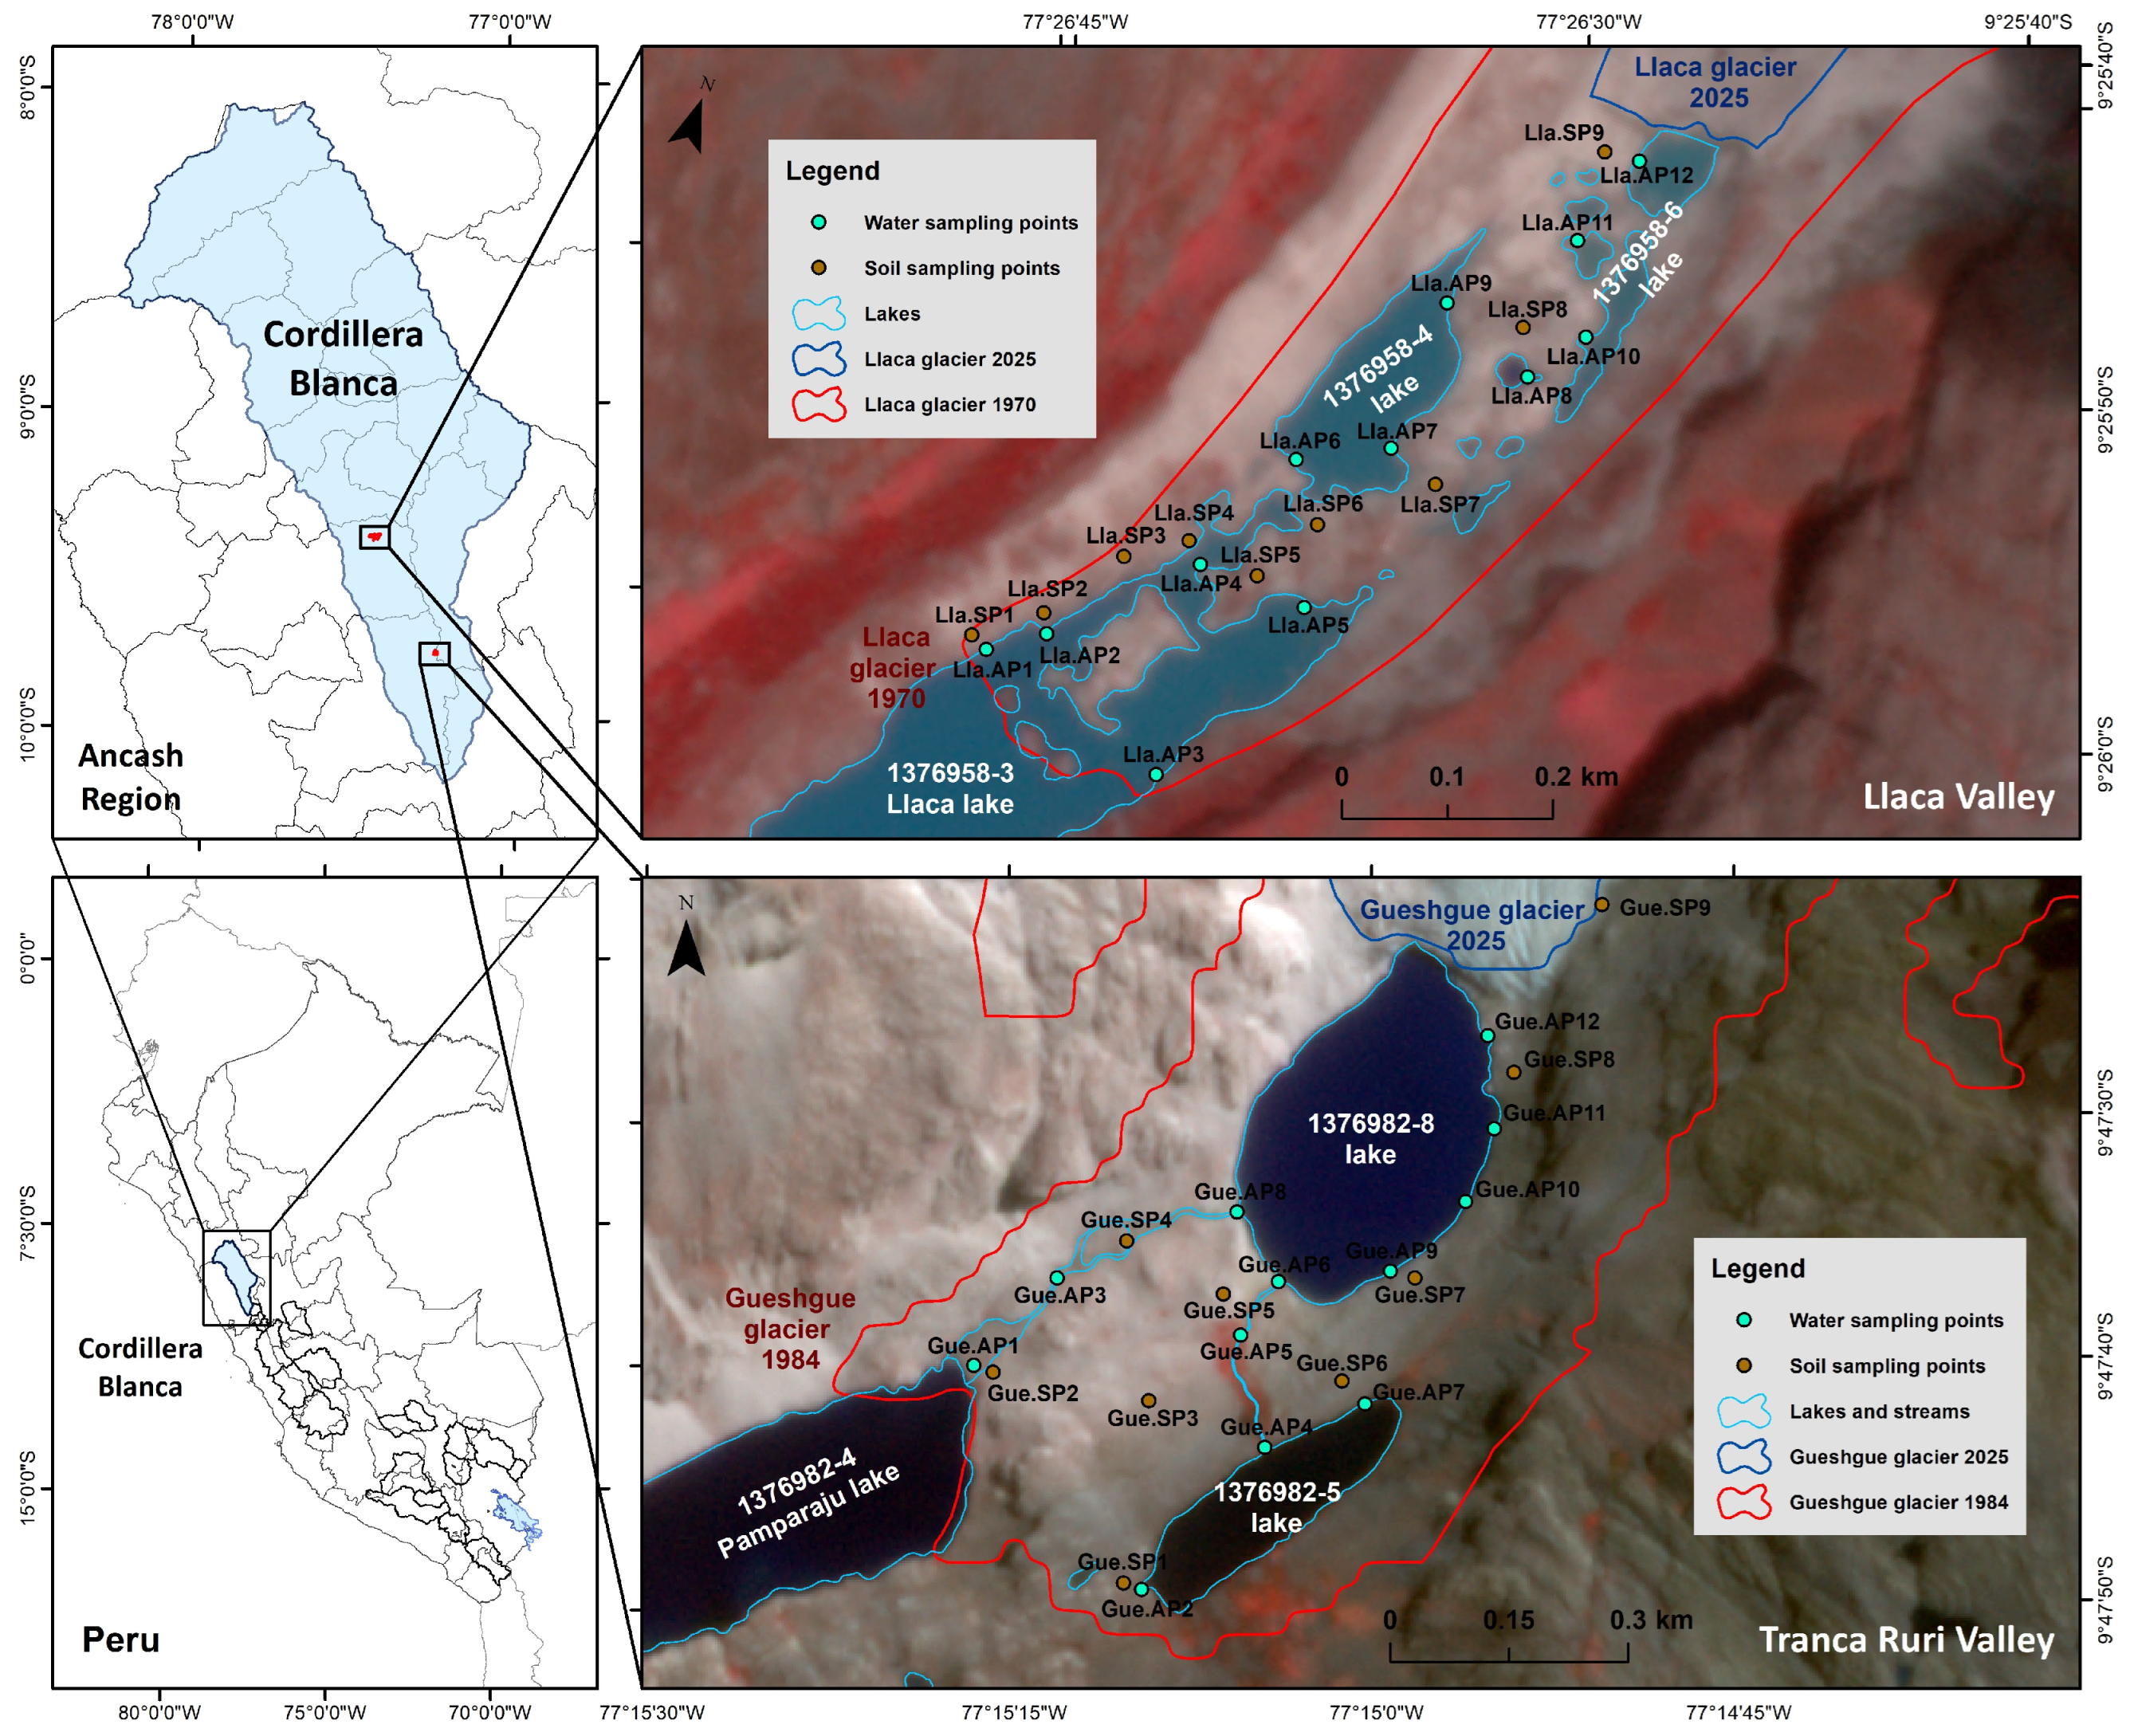
Cordillera Blanca is a mountain range that forms part of the Andes in South America and is located in the department of Áncash, Peru. It hosts the largest concentration of tropical glaciers worldwide [14,15], extends over more than 13,000 km2, and has a glacierized area of 424.86 km2 in 2020 [15,45]. It has also been widely recognized as one of the region’s most sensitive to climate change [46]. Within this mountain range, the tropical valley glaciers of Llaca and Gueshgue (Queshque, in the native Quechua language) were selected as study areas (Figure 1). These glaciers have undergone substantial retreat in recent decades [15,47,48,49], making them systems of particular interest for studying the environmental effects associated with the loss of glacier cover. Despite their relative geographical proximity, both glaciers exhibit differences in their environmental configuration, including geology, geomorphology, hydrological dynamics, and immediate surroundings, suggesting that glacier–water–soil interaction processes may vary significantly between them.
Llaca Glacier is located in the Santa River basin, within the Casca catchment and the Llaca valley, in the central-southern sector of the Cordillera Blanca. In 2020, it covered a glacierized area of 3.76 km2, with elevations ranging from 4512 to 6105 m a.s.l. (hereinafter m) [50]. Its lower ablation zone has historically been covered by debris consisting of a mixture of rocks, boulders, coarse gravel, and fine dust [51]. Over time, glacier retreat has led to the formation of three lakes larger than 5000 m2, arranged in a stepped sequence from the glacier front. These include a proglacial lake (Code 1376958-6, 4505 m) undergoing continuous fragmentation and displacement due to its contact with the active ice margin and dead ice, and two more stable periglacial lakes (Code 1376958-4, 4482 m and Code 1376958-3 [Llaca], 4465 m). In addition, glacier retreat has exposed new proglacial soils around the lakes in the form of mounds and islands, as well as a large latero-frontal moraine extending to the artificial dam [52].
Gueshgue Glacier is located within the same Santa River basin, but in the Yanayacu catchment and the Tranca Ruri valley, in the southern sector of the Cordillera Blanca. In 2020, it covered a glacierized area of 1.62 km2, with elevations ranging from 4802 to 5622 m [50]. Its lower ablation zone is only minimally covered by debris, mainly on the southwestern side, while clean ice is more widespread across its surface. Similar to Llaca, its historical retreat has led to the formation of three inventoried lakes: one proglacial lake (Code 1376982-8, 4791 m), which is currently approaching the end of its expansion phase, and two highly stable periglacial lakes (Code 1376982-5, 4735 m and Code 1376982-4 [Pamparaju], 4677 m). In addition, two main streams have developed, first connecting Lake 1376982-5 with the proglacial lake, which then drains into Pamparaju Lake. The terrain exposed by glacier retreat is characterized by steep lateral slopes near the ice margin and the proglacial lake, followed by an extensive semi-flat area with multiple surface irregularities extending toward Pamparaju Lake.

Bedrock Geology and Lithological Setting

The geological setting of the study areas was characterized using the geological maps and accompanying reports of the Instituto Geológico Minero y Metalúrgico (INGEMMET) of Peru [53]. Llaca Glacier is located within the Huari quadrangle, sheet 19-i3, at a scale of 1:50,000, whereas Gueshgue Glacier is located within the Recuay quadrangle, sheet 20-i. These geological datasets were used to identify the principal lithological units occurring within and surrounding the glacier retreat areas.
In Llaca, the glacier retreat area is predominantly covered by Quaternary glacial deposits (Qh-gl), including lateral and frontal moraine deposits surrounding Llaca Lake. These unconsolidated deposits consist of angular blocks and clasts derived from the surrounding batholithic lithologies embedded within a poorly sorted silty-sandy matrix. The surrounding bedrock is primarily represented by the Cordillera Blanca Batholith granodiorite–monzogranite unit (Nm-bcb-gd,mgr). Monzogranitic lithologies are exposed along the steep rock walls of the valley and are characterized by medium- to coarse-grained plutonic rocks composed mainly of quartz, plagioclase, K-feldspar, biotite, and hornblende. The pronounced fracturing of these rocks also favors the production and accumulation of angular rock debris within the proglacial environment [54].
In Gueshgue, the glacier retreat area is also largely covered by Qh-gl. These unconsolidated deposits consist of angular to subangular clasts of granodiorite, monzogranite, and sandstone within a fine-grained matrix of clay, silt, and sand, corresponding to poorly sorted glacial till. The surrounding geology is more lithologically heterogeneous than in Llaca. Along the northern and western flanks, the bedrock is dominated by granodioritic and tonalitic rocks of the Cordillera Blanca Batholith (Nm-bcb-gd,tn), characterized by phaneritic intrusive lithologies that form steep valley walls and exposed rock faces surrounding the present glacier. In contrast, the southern and eastern flanks include sedimentary rocks assigned to the Chicama Group–Tinajones Formation (JsKi-t), comprising laminated gray-to-black shale and locally slate-like rocks interbedded with medium-grained quartz sandstone and dark-gray limestone. This contrasting intrusive–sedimentary geological setting provides a heterogeneous source of mineral material to the recently deglaciated environment [55].

2.2. Sampling and Laboratory Analyses

2.2.1. Soil and Water Sampling

Soil and water samples were collected within the glacier retreat areas exposed over recent decades. For Llaca Glacier, the sampled area corresponded to the 1970–2025 retreat zone, whereas for Gueshgue Glacier it corresponded to the 1984–2025 retreat zone. Sampling in both areas was conducted in December 2024. The sampling fieldwork was designed as a synchronous comparative assessment of both glacier retreat areas. Therefore, the results represent the geochemical conditions observed during this sampling period and were not intended to characterize seasonal variability.
For soil sampling, nine 1 m2 sampling plots [21] were randomly established within each deglaciated area. In each plot, five soil subsamples were collected from the four corners and the center of the plot [21,56]. These subsamples were then mixed and homogenized to obtain a representative composite soil sample of approximately 3 kg. Sampling was conducted at a depth of 3–15 cm, after previously removing litter, pure organic layers, and any surface vegetation when present [41]. The samples were collected using a small stainless-steel shovel and placed in new, pre-labeled, airtight polyethylene bags.
For water sampling, 12 sampling stations were randomly distributed across the aquatic systems, including proglacial lakes, periglacial lakes, and streams connecting the lakes within the glacier retreat areas. Surface water samples were collected at a depth of 10–30 cm near the margins of the water bodies using white polyethylene or amber glass bottles, depending on the parameter analyzed, following the recommendations of the Autoridad Nacional del Agua (ANA) of Peru [57]. The specific preservation conditions are detailed in Table 1.
Soil and water samples were placed in a thermal cooler with ice packs and transported, stored, and preserved at ≤6 °C in the laboratory of the ESAT-FCAM Research Center at UNASAM until processing in the corresponding laboratories.

2.2.2. Field and Laboratory Physicochemical Analyses

The physicochemical properties evaluated both in the field and in the laboratory are presented and described in Table 1.

2.3. Statistical Analyses

Values below the limit of quantification (<LOQ) were replaced by LOQ/2 when they accounted for less than 25% of the dataset [58,59], and were subsequently used in the descriptive, comparative, and multivariate analyses. Parameters with a higher proportion of <LOQ values were used only for descriptive and exploratory purposes [41,44] and were not included in the statistical comparisons or multivariate analyses.
The descriptive statistical analysis of each parameter measured in the soil and water samples included the mean, standard deviation (SD), minimum (min.), maximum (max.), and coefficient of variation (CV). Boxplots were also prepared to assess the dispersion and central tendency of the physicochemical properties within and between the two study areas. Data normality was evaluated using the Shapiro–Wilk test to select the appropriate statistical methods. Subsequently, either Student’s t-test or the Mann–Whitney U test was applied to compare the parameters between the two study areas and determine whether significant differences were present.
For the analytical and inferential statistical analyses, the integrated dataset was used to perform a Principal Component Analysis (PCA) to identify the most influential physicochemical properties and evaluate joint variability patterns in the characterization of water and soil. In addition, cluster analysis was conducted and represented through a dendrogram based on the similarity level obtained using Ward’s method and Euclidean distance, with the aim of identifying groups of sampling points with similar physicochemical parameters. A permutational multivariate analysis of variance (PERMANOVA) was also included to assess whether the groups defined by the cluster analysis and PCA differed significantly from one another. Finally, Spearman’s correlation analysis (rs) was applied to determine the relationships among the analyzed parameters in the study areas and to identify the existing characterization groups.
All statistical analyses were performed at a significance level of p < 0.05 using R software version 4.4.3.
Table 1. Physicochemical properties analyzed and methodologies applied to soil and water samples from the glacier retreat areas of Llaca and Gueshgue.
Soil Properties
NTestAbbreviationLOQUnitLaboratoryAccreditationAnalysis Methodology and InstrumentQuantityPreservationLifespan
1Coordinates (X and Y)--mIn situ-Garmin GPSMAP 64s handheld GPS navigator (Garmin International, Inc., Olathe, KS, USA), WGS84 UTM Zone 18S coordinate system.---
2Altitude--m a.s.l.In situ-GPS navigator, WGS84 UTM Zone 18S coordinate system.---
3Field slopeSField-°In situ-Direct measurement using a magnetic base digital inclinometer.---
4Temperature at 5 cmT5cm-°CIn situ-Direct measurement at a depth of 5 cm using the Hanna HI 98501 digital penetration thermometer (Hanna Instruments, Woonsocket, RI, USA).---
5Hydrogen potentialpHw-pH unitsESAT-Mexican Official Standard NOM-021-SEMARNAT-2000 [60], item 7.2.5, AS-02 (31 December 2002). Soil pH and EC were measured using a Hanna HI 98129 pH/EC/TDS/temperature tester (Hanna Instruments, Woonsocket, RI, USA) at a soil-to-distilled water ratio of 1:2 (w/v).10 g-30 days
6Electrical conductivityEC-µS/cmESAT-10 g-30 days
7Gravimetric humidityh0.10%SAGIAS-829Mexican Official Standard NOM-021-SEMARNAT-2000 [60], item 7.1.5 AS-05—Gravimetric Method (31 December 2002).100 g-30 days
8Soil bulk densityρb-g/cm3SAGUnaccreditedMexican Official Standard NOM-021-SEMARNAT-2000 [60], item 7.1.3 Method AS-03—Paraffin Method (31 December 2002).>300 g--
9Total Kjeldahl NitrogenTKN0.05%SAGIAS-829SMEWW-APHA-AWWA-WEF [61]. Part 4500-Norg-C, 24th Ed., 2023. Semi-Micro-Kjeldahl Method.300 g-30 days
10Organic matterOM0.22%SAGINACAL-DAMexican Official Standard NOM-021-SEMARNAT-2000 [60], item 7.1.7 AS-07. Walkley and Black Method (31 December 2002).300 g-30 days
11Texture and granulometry--%SGSUnaccreditedNTP 339.128, 1st Ed: 1999 (revised 2019) [62], Soils. Test Method for Granulometric Analysis (Validated—Modified and Applied outside of scope). 2024.500 g-30 days
12Inorganic anionsSee Table 2mg/kgSAGIAS-829EPA Method 300.0:1993 Rev. 2.1. Determination of Inorganic Anions by Ion Chromatography [63].100 g-30 days
13MetalsSee Table 2mg/kgSAGIAS-829EPA 3050-B (1996) Acid Digestion of Sediments, Sludges, and Soils [64]//SW-846 EPA Method 6010D, Rev. 5, 2018. Inductively Coupled Plasma—Optical Emission Spectrometry (ICP-OES) [65].300 g-6 months
Water Properties
NTestAbbreviationLOQUnitLaboratoryAccreditationAnalysis Methodology and InstrumentQuantityPreservationLifespan
1Coordinates (X and Y)--mIn situ-GPS navigator, WGS84 UTM Zone 18S coordinate system.---
2Altitude--m a.s.l.In situ-GPS navigator, WGS84 UTM Zone 18S coordinate system.---
3TemperatureT-°CIn situ-Direct measurement using a Hanna HI 98194 multiparameter (Hanna Instruments, Woonsocket, RI, USA).---
4Hydrogen potentialpH-pH unitsIn situ-Direct measurement using a Hanna HI 98194 multiparameter.---
5Oxidation-Reduction Potential (REDOX)ORP-mVIn situ-Direct measurement using a Hanna HI 98194 multiparameter.---
6Electrical ConductivityEC-µS/cmIn situ-Direct measurement using a Hanna HI 98194 multiparameter.---
7Total Dissolved SolidsTDS-ppmIn situ-Direct measurement using a Hanna HI 98194 multiparameter.---
8Dissolved OxygenDO-mg/LIn situ-Direct measurement using a Hanna HI 98194 multiparameter.---
9Chlorophyll AChl-a0.003mg/LSAGINACAL-DASMEWW-APHA-AWWA-WEF [61]. Part 10150 A. Introduction, Part 10150 B. Spectrophotometric Determination of Chlorophyll A. 24th Ed., 2023.1000 mLKeep in darkness and refrigerate at ≤4 °C48 h
10Total Organic CarbonTOC0.1mg/LSAGIAS-829SMEWW-APHA-AWWA-WEF [61]. Part 5310 C, 24th Ed., 2023. Persulfate-Ultraviolet or Heated-Persulfate Oxidation Method.500 mLKeep in darkness and refrigerate at ≤6 °C. If storage exceeds 48 h, add 20 drops of H2SO448 h
11Inorganic CarbonIC0.1mg/LSAGIAS-829SMEWW-APHA-AWWA-WEF [61]. Part 5310 C, 24th Ed., 2023. Persulfate-Ultraviolet or Heated-Persulfate Oxidation Method.
12Turbidity-0.2NTUSGSUnaccreditedSMEWW-APHA-AWWA-WEF [61]. Part 2130 B, 24th Ed.: 2023. Turbidity. Nephelometric Method.100 mLKeep in darkness and refrigerate at ≤6 °C48 h
13Inorganic anionsSee Table 3mg/LSGSINACAL-DAEPA METHOD 300.0, Rev. 2.1: 1993. Determination of inorganic anions by ion chromatography [63].60 mLRefrigerate to ≤6 °C28 days *
14Total metalsSee Table 3mg/LSGSINACAL-DAEPA-Method 200.8 Rev. 5.4, 1994 [66]. Determination of trace elements in water and waste by Inductively Coupled Plasma-Mass spectrometry (ICP-MS). 2015 (Validated—Applied out of scope).60 mLSix drops (0.3 mL) of HNO3 (1:1) until pH <2 and refrigerate to ≤6 °C30 days **
Note: LOQ is Limit of quantification of the method; SGS is Société Générale de Surveillance del Perú S.A.C.; SAG is Servicios Analíticos Generales S.A.C.; INACAL-DA is Dirección de Acreditación del Instituto Nacional de Calidad del Perú; IAS-829 is International Accreditation Service code TL-829; ESAT is Research Center for Environmental Earth Science and Technology of FCAM-UNASAM. * Lifespan 28 days except for nitrate, nitrite and phosphate which are 48 h. ** Lifespan 30 days, except for Hg which is 28 days.

3. Results

3.1. Characterization of Soil Physicochemical Properties

A total of 18 soil samples from the proglacial ecosystems of Llaca and Gueshgue were analyzed. The summary of the descriptive statistics of the soil physicochemical properties analyzed is presented in Table 2.
A total of 59 soil physicochemical parameters were analyzed, of which seven (~12%) showed values below the quantification limit in both study areas and at all sampling points: TKN, NO2, NO2-N, Ag, Hg, Sb, and Se. Other parameters showed low detectability, with approximately 75% of the sampling points below the QL, including OM, As, B, Be, and W in Llaca, and OM and Cd in Gueshgue. In Gueshgue, Fe and SiO2 concentrations were very high and exceeded the upper quantification limit of the method in at least 30% of the sampling points. For OM, only 3 of the 18 analyzed samples showed quantifiable concentrations: two samples from Llaca (Lla.SP1 and Lla.SP2), with values of 2.1% and 0.69%, respectively, corresponding to the points closest to the 1970 glacier boundary; and one sample from Gueshgue (Gue.SP2), with a value of 1%, corresponding to the area closest to the 1984 glacier boundary.
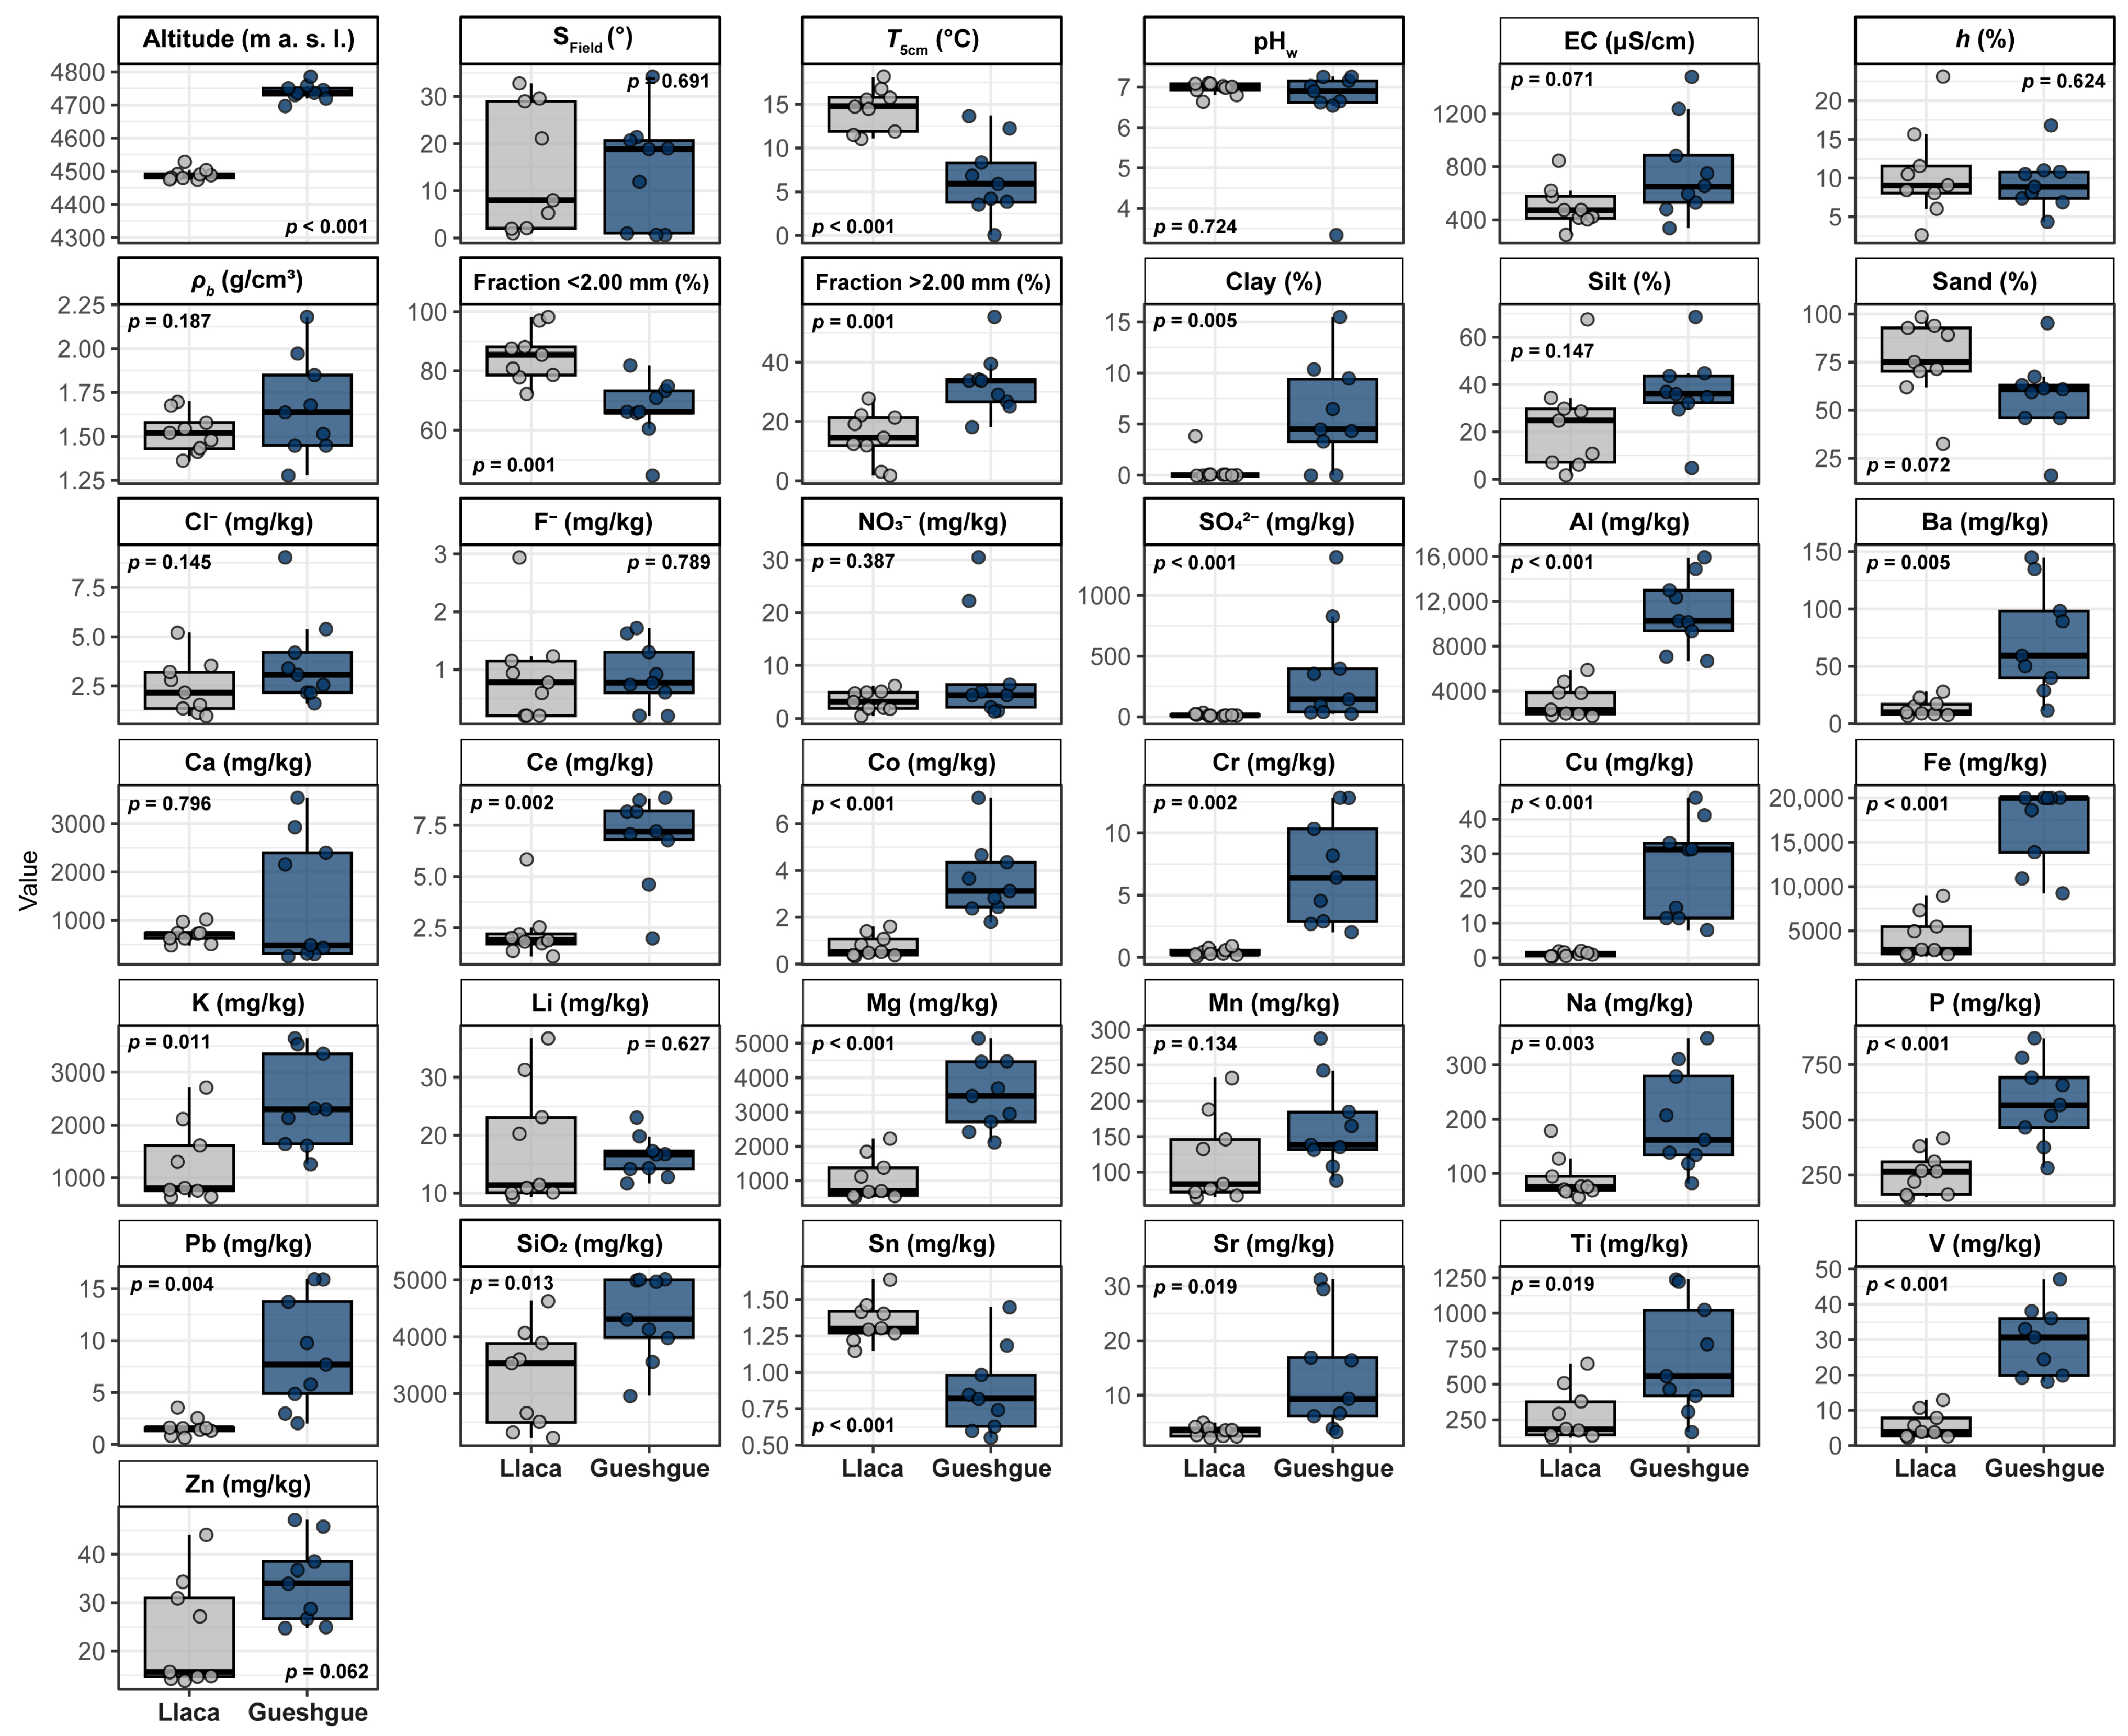
While Table 2 provides the complete numerical summary of the analyzed soil properties, Figure 2 complements these data by showing the distribution, central tendency, dispersion, and individual observations of the common quantifiable parameters between the two glacier retreat areas, together with the statistical significance (p) of the between-area comparisons.
Elevations in the study areas were homogeneous (CV < 1%), ranging from 4474 to 4528 m in Llaca and from 4697 to 4786 m in Gueshgue, with the latter exhibiting a much higher mean elevation (4740 ± 25 m). Regarding slope, both glacier retreat areas showed moderate mean slopes (~14°); however, the terrain was highly irregular (CV > 80%). Soil temperature at 5 cm depth (T5cm) was significantly higher in Llaca (14.42 ± 2.42 °C), whereas Gueshgue showed a greater thermal range and variability (CV > 60%), associated with its higher elevation.
Soils from both areas showed relatively neutral to slightly acidic values, with a mean pHw of 6.96 ± 0.15 in Llaca and 6.53 ± 1.23 in Gueshgue. Values ranged from 6.64 to 7.09 in Llaca and from 3.34 to 7.26 in Gueshgue, showing a relatively uniform pattern across the glacier retreat area, except for point Gue.SP9, which exhibited a strongly acidic value of 3.34 and corresponded to the sampling point closest to the 2025 glacierized area. Electrical conductivity (EC) was higher in Gueshgue (772.22 ± 372.26 µS/cm) than in Llaca (501.33 ± 163.11 µS/cm), with greater variability among Gueshgue sampling points due to the high EC recorded at Gue.SP9 (1481 µS/cm). On average, soil humidity (h) was low (<11%) in both areas, falling within the permanent wilting point range at most sampling points and showing high overall data dispersion (CV > 35%). Bulk density (ρb) showed mean values of 1.52 ± 0.12 g/cm3 in Llaca and 1.67 ± 0.29 g/cm3 in Gueshgue, with the latter presenting more compact soils, reaching up to 2.18 g/cm3 at Gue.SP8. No statistically significant differences were observed between the two study areas for these parameters.
Soil granulometry and texture showed that fragments >2.00 mm exhibited high variability among sampling points (CV > 30%), accounting for 1.78% to 55.29% of soil composition. In contrast, fragments <2.00 mm showed moderate variability (CV < 16%) and were predominant in the soils, with mean values of 85.1 ± 8.70% in Llaca and 67.12 ± 10.48% in Gueshgue. Within this particle-size fraction, only clay content differed statistically between the two areas. Llaca was characterized, on average, by high sand content (~76.18%), moderate silt content (~23.40%), and very low clay content; only point Lla.SP4 showed a clay content of 3.81%, whereas the remaining points had 0.01%. In contrast, Gueshgue showed moderate sand (~57.21%) and silt (~36.81%) contents, with low clay content (~5.99%). The highest sand contents (>95%) were recorded at Lla.SP9 and Gue.SP9, which were located near the current glacier margins. However, no systematic distance-based gradient was evaluated in this study.
Among the inorganic anions, SO42− was predominant in both areas, with particularly high concentrations in Gueshgue, reaching up to 1313.50 mg/kg at Gue.SP9. Gueshgue showed a significantly higher mean concentration (359.10 ± 442.01 mg/kg) than Llaca (15.21 ± 8.50 mg/kg). NO2 was absent, whereas NO3 showed higher and more variable concentrations in Gueshgue, reaching up to 30.47 mg/kg at Gue.SP3. In contrast, Cl and F exhibited relatively moderate concentrations for this type of proglacial ecosystem, ranging from 0.40 to 9.03 mg/kg. In Gueshgue, PO43− concentrations were below the quantification limit, whereas in Llaca, concentrations of up to 6.63 mg/kg were detected at Lla.SP2, with a mean value of 1.86 ± 2.10 mg/kg. However, the two sampling points closest to the glacier had no quantifiable values. No statistically significant differences were found between the study areas for NO3, Cl, and F.
Soil elemental composition was dominated by Fe, Al, SiO2, Mg, K, and Ca in both areas. The mean concentrations of these elements were higher in Gueshgue than in Llaca, ranging from 24% to 74% higher, and showed significant differences between the two study areas, except for Ca. In particular, Fe was the most abundant element, with Gueshgue showing the highest values, including concentrations >20,000 mg/kg at five sampling points and a minimum value of 9255.30 mg/kg at Gue.SP4. Elements occurring at lower concentrations, which also differed significantly between areas, including Ba, Cu, Na, P, Sr, Ti, V, and Zn. For these elements, Gueshgue again showed higher mean concentrations, ranging from 28% to 81% higher, except for Li. Trace elements generally occurred at low concentrations in both areas, reaching up to 12.00 mg/kg of U in Llaca and up to 15.91 mg/kg of Pb in Gueshgue. However, As in Gueshgue was an exception, showing markedly elevated concentrations and exceeding 200 mg/kg at Gue.SP6, Gue.SP7, and Gue.SP8.

3.2. Multivariate Analysis of Soil Physicochemical Properties

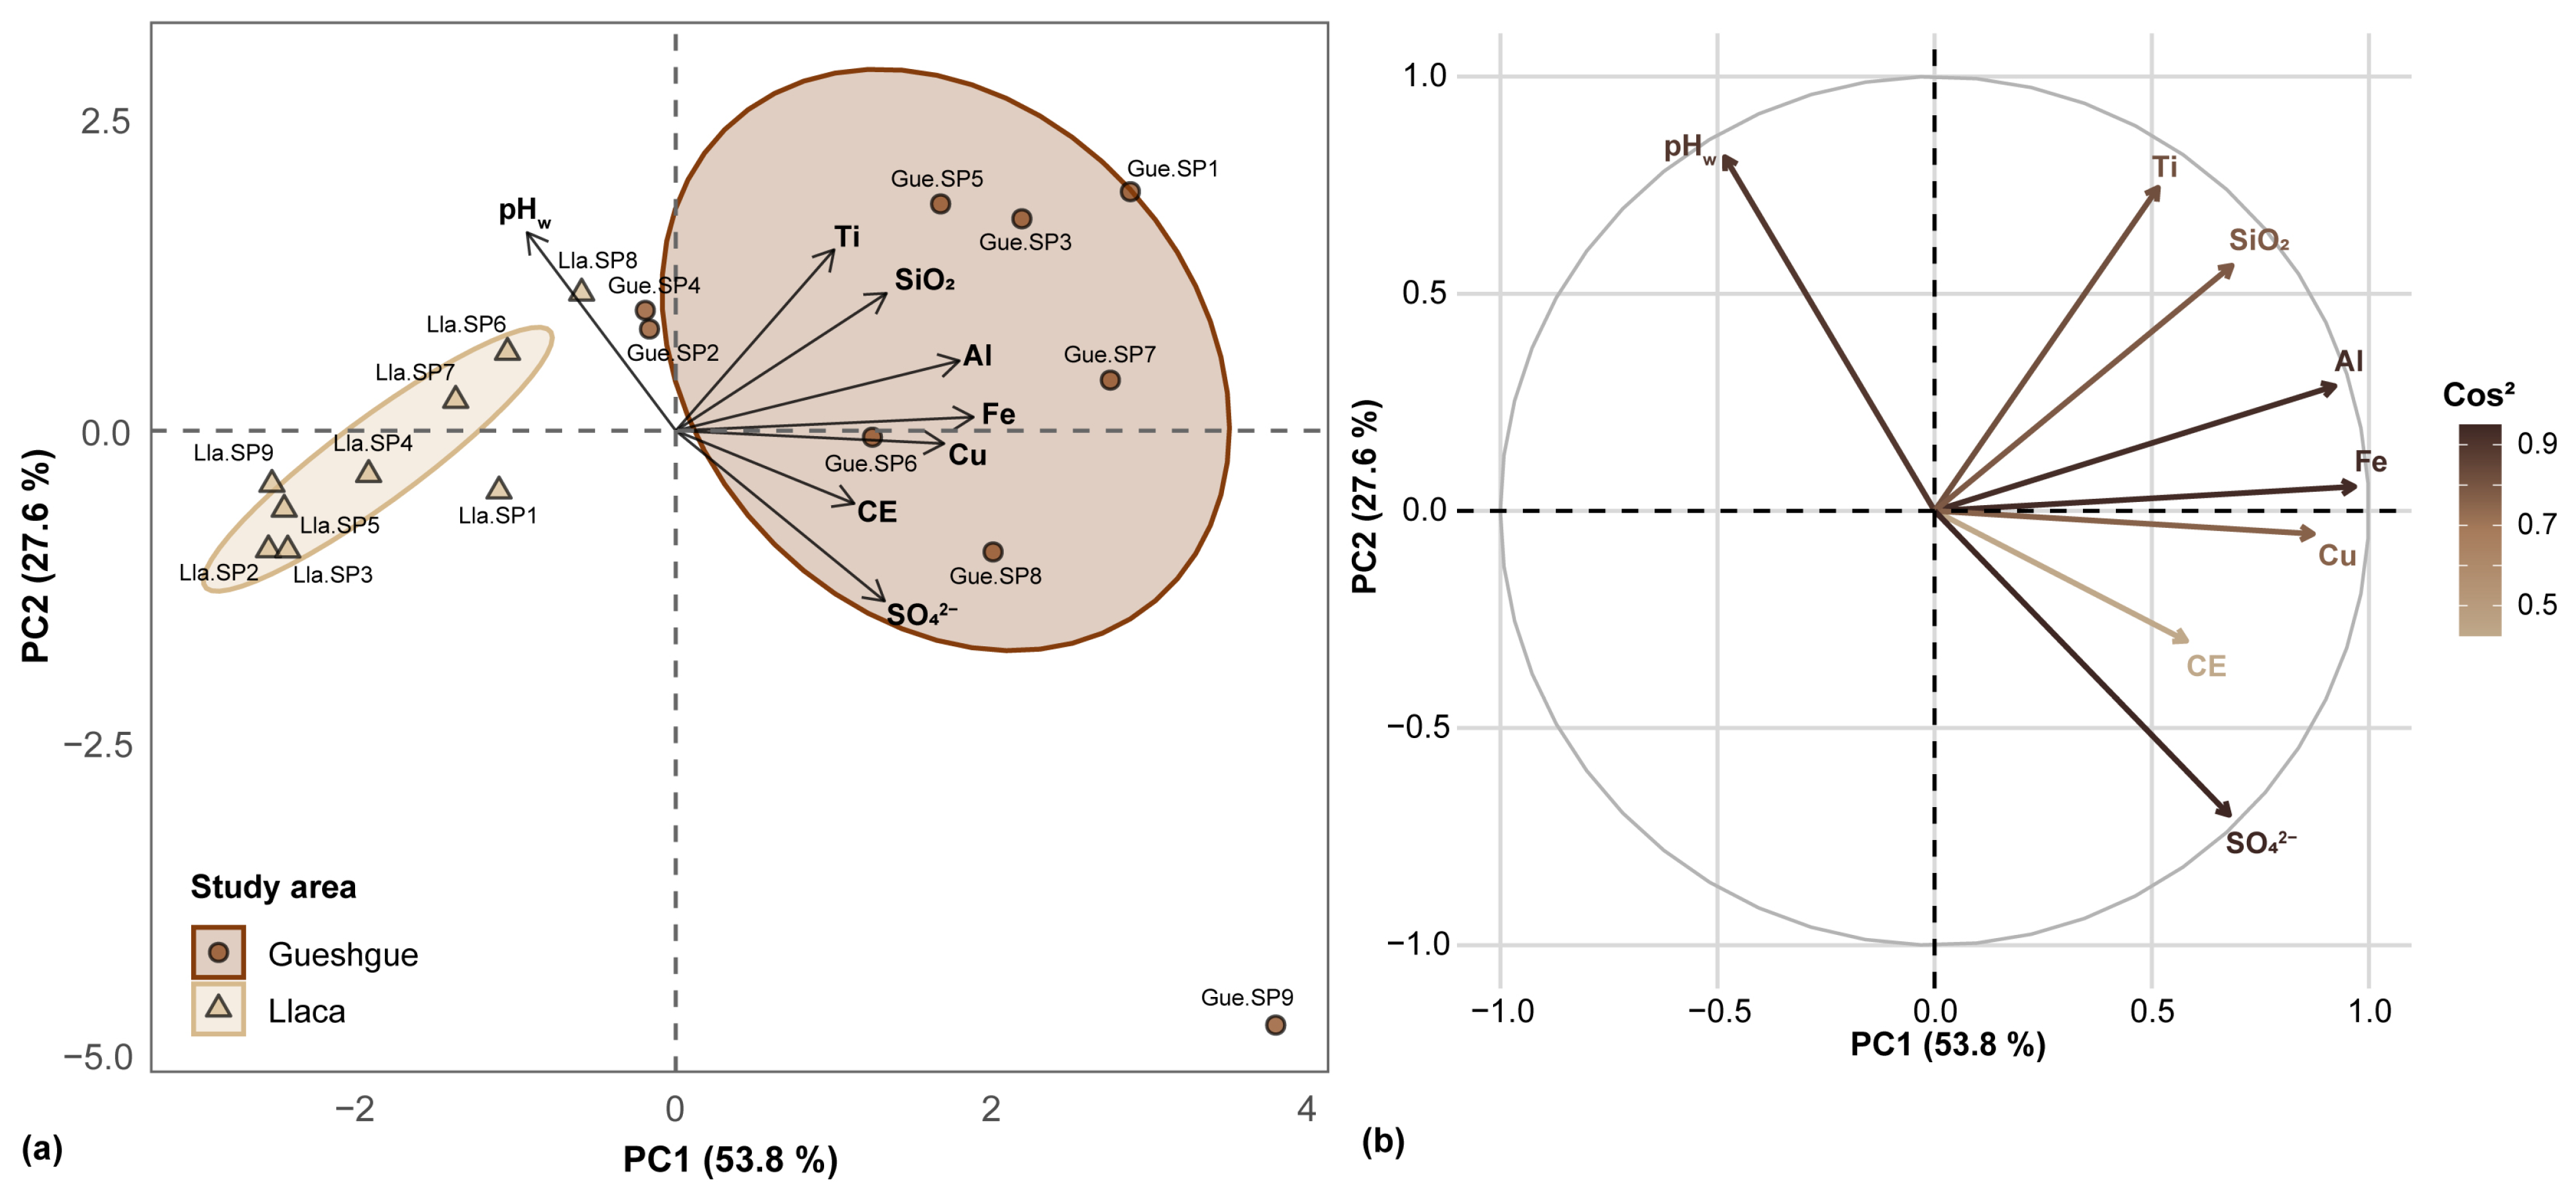
PCA applied to the selected soil physicochemical properties explained 81.4% of the total variance in the first two principal components (Figure 3a). PC1 explained 53.8% of the variance and revealed a clear differentiation between the study areas, placing the Gueshgue samples in the positive sector and the Llaca samples in the negative sector. This component was defined by Fe (21.7%), Al (19.7%), Cu (17.6%), and SiO2 (10.9%), which showed strong positive correlations with one another (Figure 3b). In contrast, PC2 explained 27.6% of the variance and was associated with pH (30.1%), Ti (25.1%), and SO42− (22.2%), contributing to the internal variability of the samples. A strong negative correlation was also observed between pHw and SO42− concentration, as well as with most metals, including Fe, Al, Ti, and Cu. The PCA revealed a clear geochemical differentiation between the two study areas, consistent with the PERMANOVA results (p < 0.05). Gueshgue samples were associated with higher concentrations of metallic elements, as described by PC1, and also showed elevated EC and SO42− values. In contrast, Llaca samples tended to be associated with higher pHw values (Figure 3b).
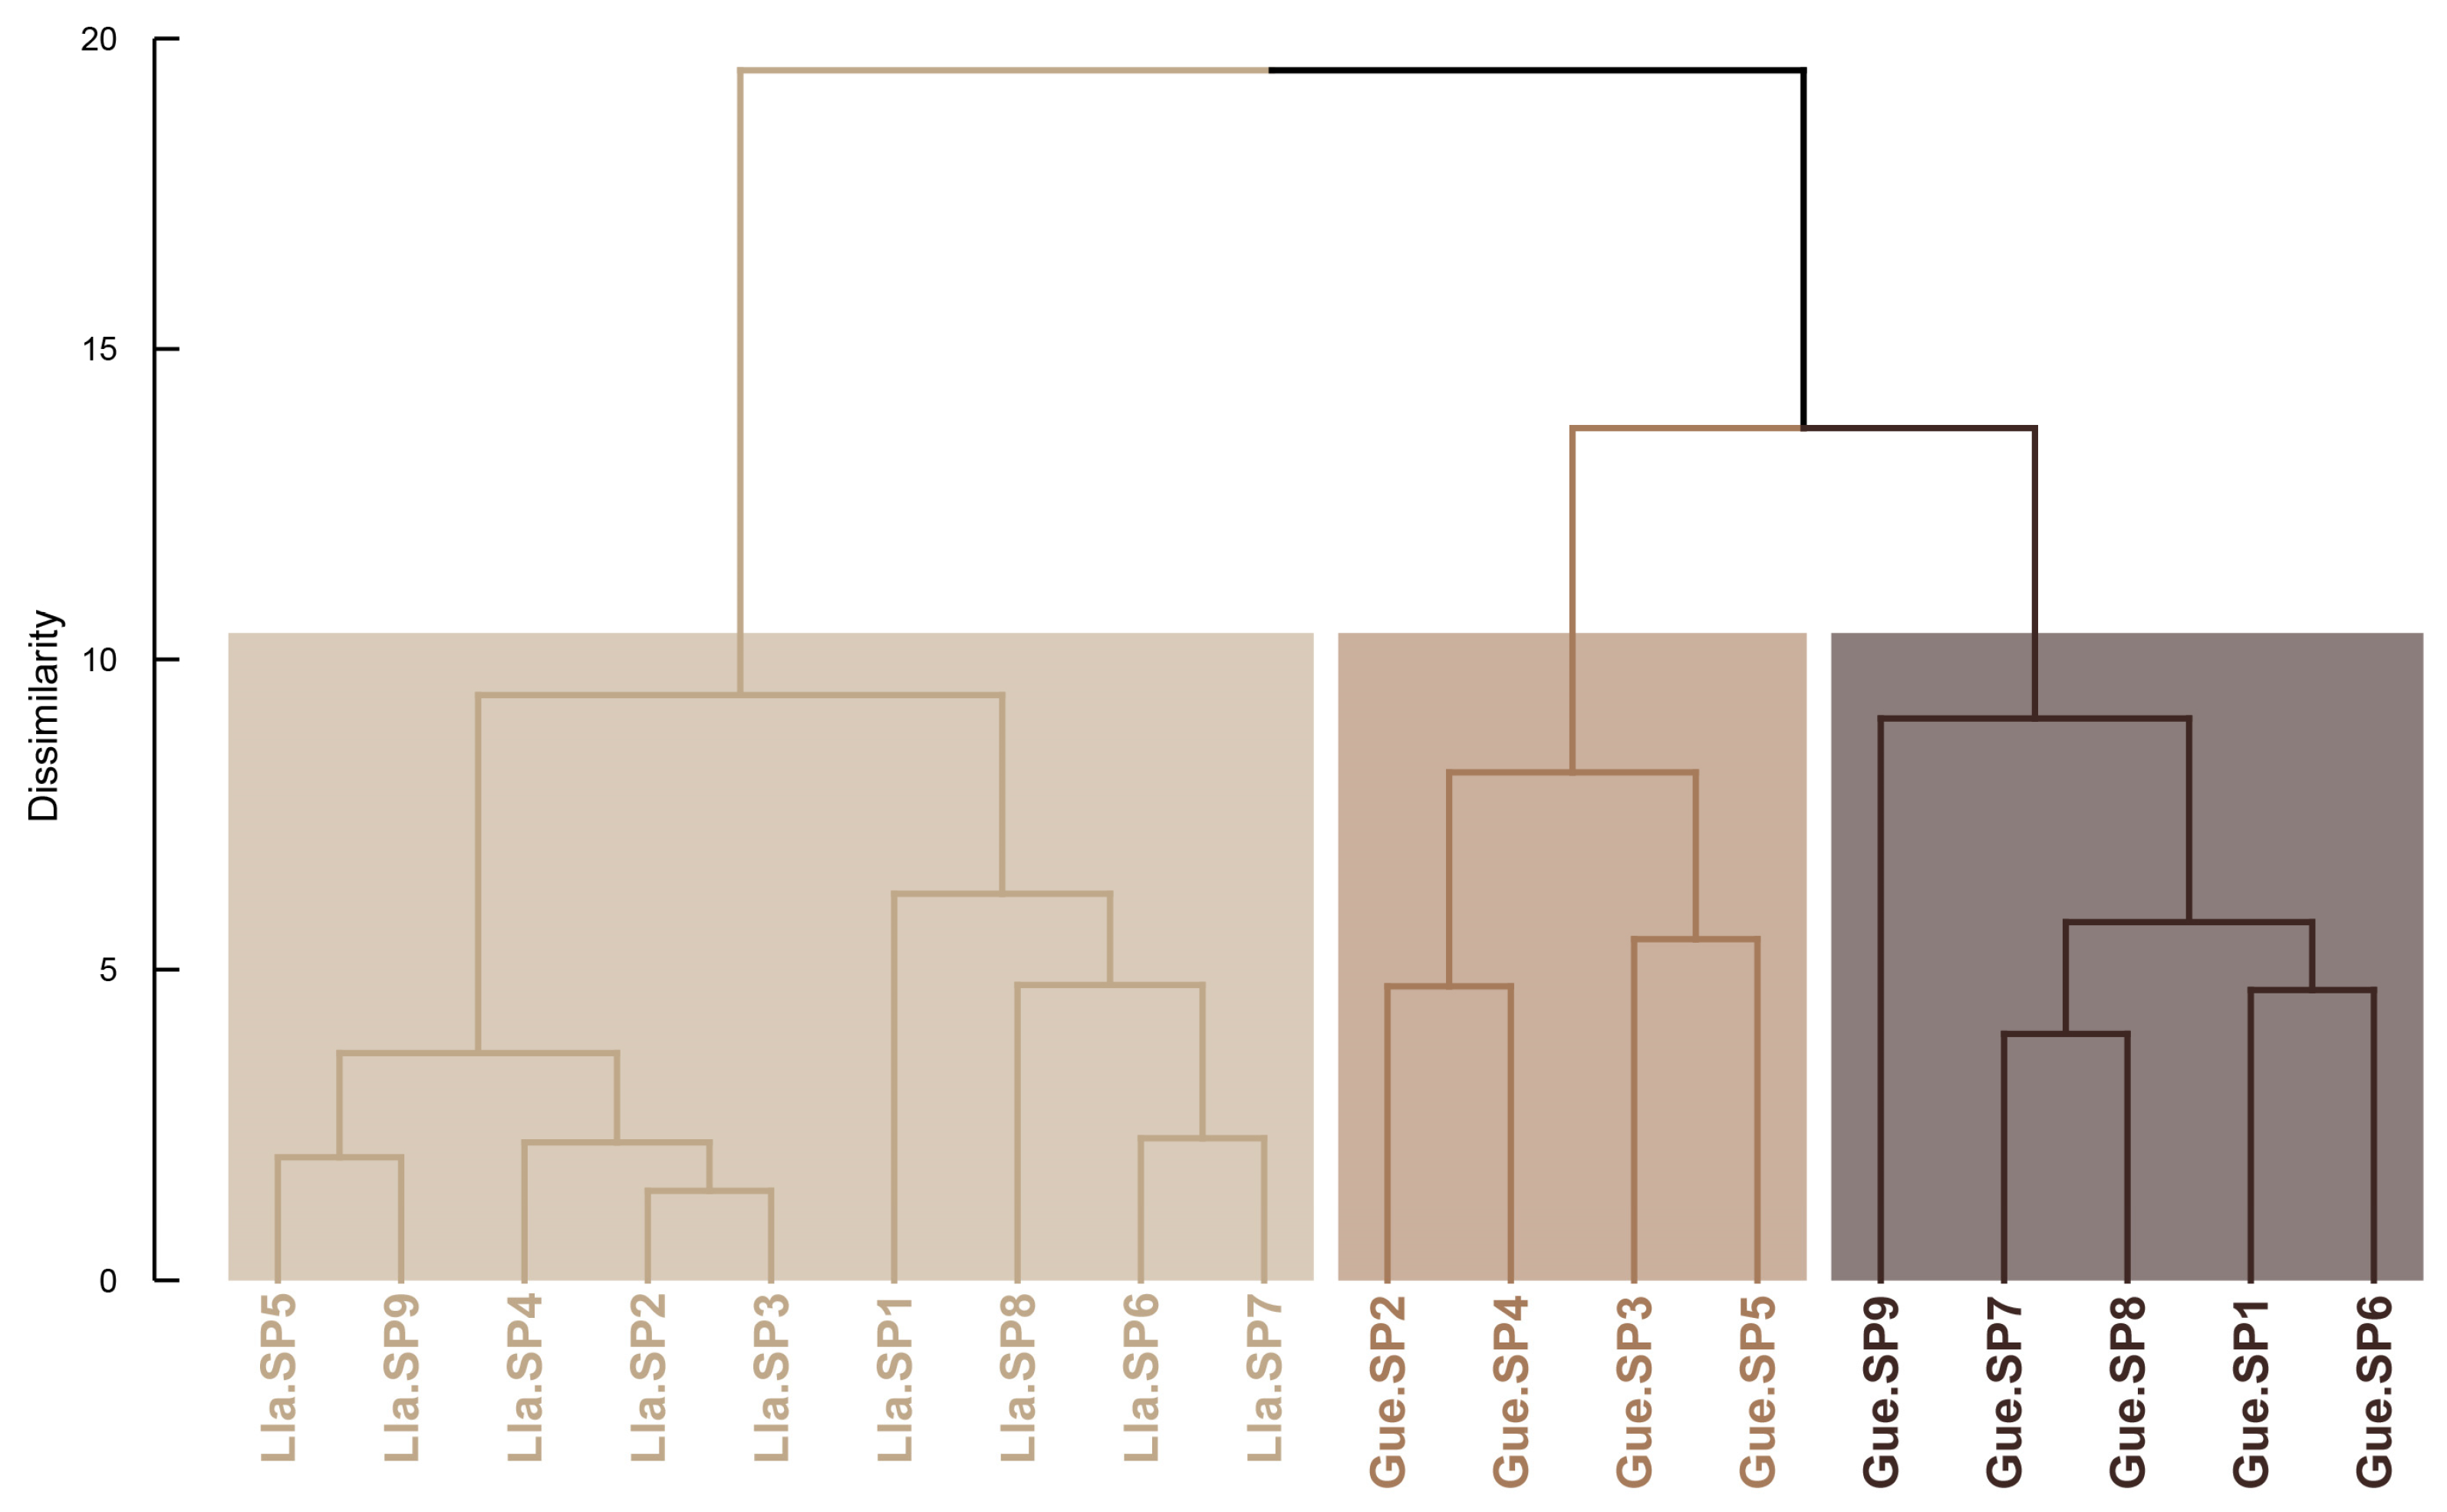
Hierarchical clustering of soil samples identified three main groups at a dissimilarity level of approximately 10 among sampling points and approximately 20 between the study areas (Figure 4). The statistical significance of these groupings was evaluated using PERMANOVA, which showed significant differences among the defined groups (R2 = 0.56, pseudo-F = 9.43, p = 0.001).
The first group comprised all Llaca samples, indicating a relatively homogeneous soil geochemical pattern within this glacier retreat area. In contrast, Gueshgue samples were divided into two internal subgroups. The first subgroup, composed of Gue.SP2, Gue.SP4, Gue.SP3, and Gue.SP5, is spatially associated with the sector dominated by granodioritic–tonalitic lithologies of the Cordillera Blanca Batholith. The second subgroup, composed of Gue.SP9, Gue.SP7, Gue.SP8, Gue.SP1, and Gue.SP6, is associated with the sector influenced by sedimentary rocks of the Chicama Group–Tinajones Formation. This internal subdivision suggests that the greater geochemical heterogeneity observed in Gueshgue may be partly related to its more complex lithological setting, although direct mineralogical analyses were not performed in this study.
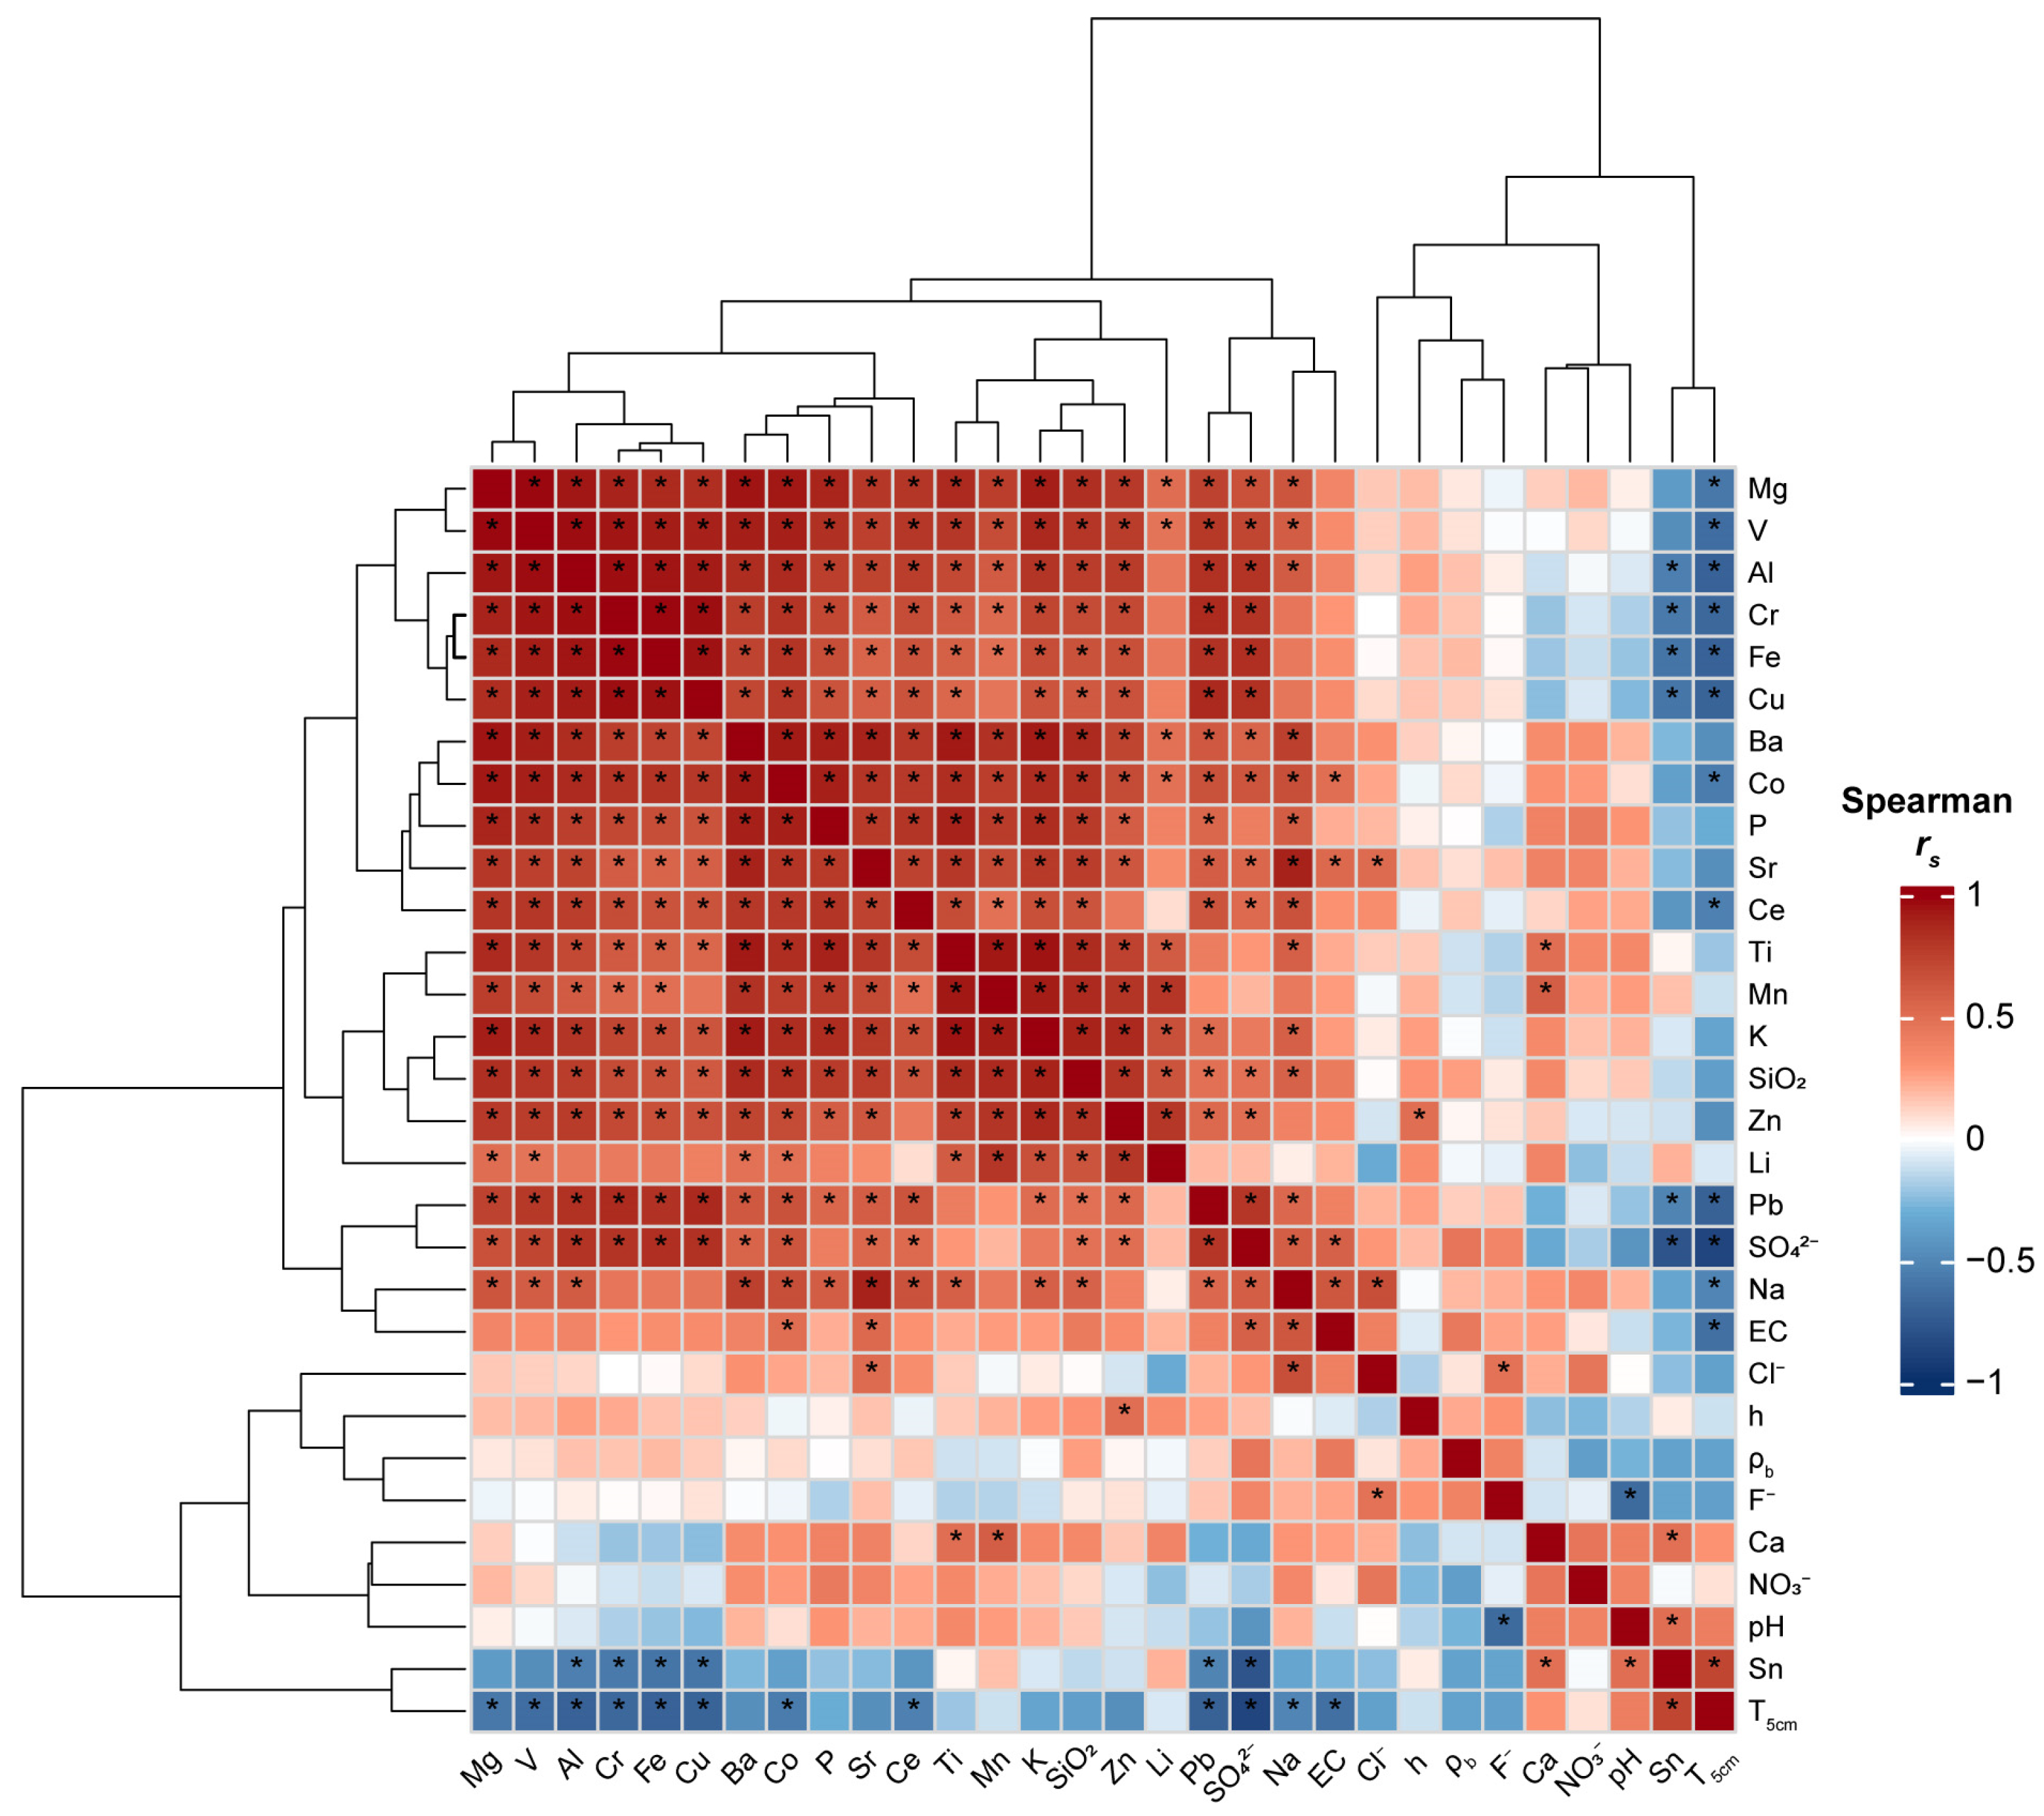
Figure 5 summarizes the Spearman correlations among the soil physicochemical properties measured in Llaca and Gueshgue. The analysis identified groups of covarying variables, with the strongest positive associations occurring among several major and trace elements. These correlation structures are used here as an exploratory tool to identify shared geochemical patterns rather than to infer spatial or temporal gradients within the glacier retreat areas.
Group 1: Major and trace element associations. This is the largest group and shows very strong positive correlations, indicated by dark red colors and statistical significance, including both metallic and non-metallic chemical elements: Mg, V, Al, Cr, Fe, Cu, Ba, Co, P, Sr, Ce, Ti, Mn, K, SiO2, Zn, and Li. The extremely high correlations among these elements (rs > 0.8) reflect a common origin associated with the weathering of primary parent rock, or local lithology, where structural elements such as SiO2, Al, and Fe are mobilized together with trace elements contained in silicate minerals. The significant presence of P within this block indicates that, during early soil-development stages, this element is predominantly of mineral and apatite origin and is strongly correlated with the abundance of structural components from recently exposed bedrock.
Group 2: Associations among mobile ions and EC. This group shows moderate to strong correlations (rs = 0.4–0.8) and includes Pb, SO42−, Na, EC, and Cl. The strong positive correlation among Na, Cl, and EC indicates that these ions are the main contributors to the detected salinity. The inclusion of SO42− and Pb suggests that the source of these mobile ions may be related to the oxidation of sulfide minerals.
Group3: Other physicochemical associations. This block shows the relationships needed to understand the physicochemical elements associated with F, Ca, NO3, pHw, Sn, and T5cm. The positive correlation between pHw and nitrates is commonly attributed to the fact that neutral pH conditions favor the activity of nitrifying bacteria. In contrast, T5cm was significantly and negatively correlated with several elements, indicating that soil thermal conditions covary with part of the observed geochemical structure.
Overall, h, ρb, F, NO3, and pHw do not appear to be statistically relevant variables for explaining the relationships of change among the physicochemical parameters analyzed in Llaca and Gueshgue. However, the spatial and temporal drivers underlying these associations were not directly evaluated in the present analysis.

3.3. Characterization of Water Physicochemical Properties

A total of 24 water samples from lakes and watercourses in the areas recently exposed by glacier retreat in Llaca and Gueshgue were analyzed. A summary of the descriptive statistics of the analyzed water physicochemical properties is presented in Table 3.
A total of 70 water physicochemical parameters were analyzed, of which 22 (~31%) showed values below the quantification limit in both study areas and at all sampling points. These parameters were Chl-a, PO43−, PO43−-P, NO2, NO2-N, Bi, B, P, Ge, Hf, La, Lu, Hg, Nb, Ag, Se, Tl, Ta, Te, Th, W, and Zr. In addition, some parameters showed low detectability, with approximately 75% of the sampling points below the quantification limit, including Sn and Yb in Llaca, and TOC, Cr, Sn, Pb, V, and Yb in Gueshgue.
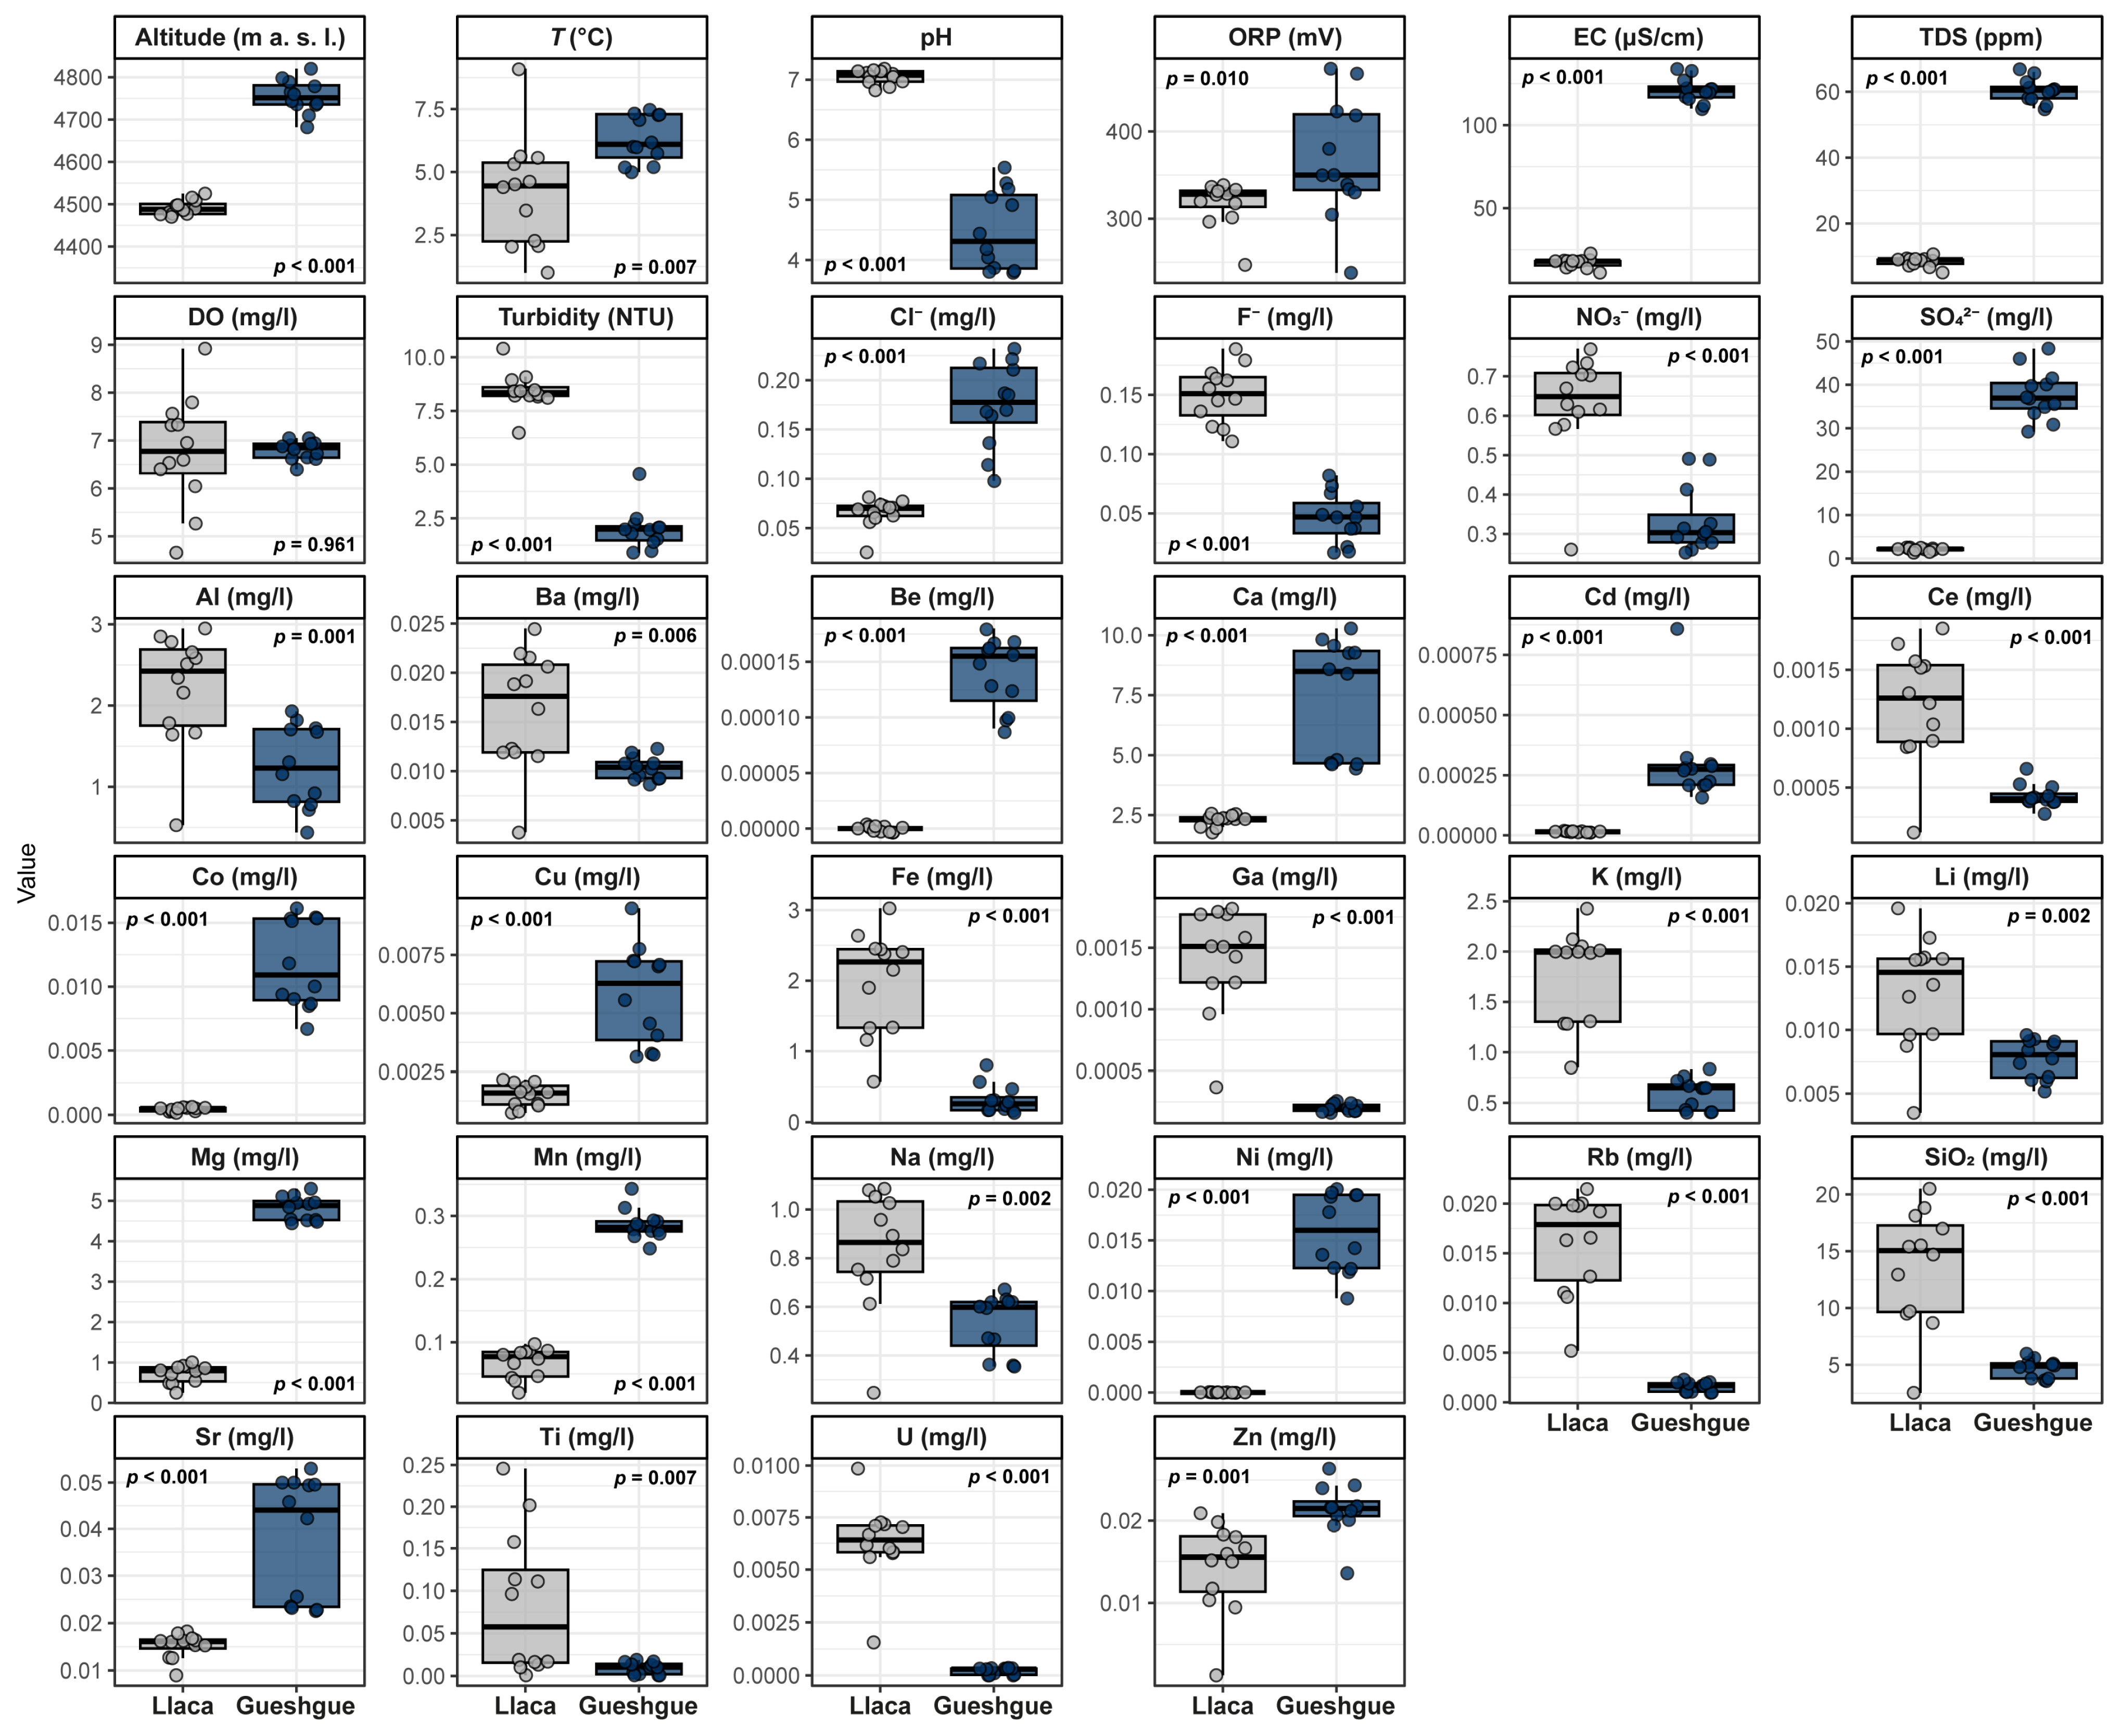
While Table 3 provides the complete numerical summary of the analyzed water properties, Figure 6 complements these data by showing the distributions, individual observations, within-area variability, and between-area statistical comparisons of the common quantifiable physicochemical parameters. All parameters shown differed significantly between Llaca and Gueshgue, except dissolved oxygen (DO).
Elevations within each study area were homogeneous (CV < 1%), ranging from 4470 to 4525 m in Llaca and from 4682 to 4820 m in Gueshgue, with the latter showing a much higher mean elevation (4755 ± 39 m). Regarding water temperature (T), very cold waters were recorded, with the mean temperature in Llaca (4.17 ± 2.20 °C) being lower than that in Gueshgue (6.32 ± 0.94 °C). In both cases, the proglacial lakes showed the lowest point temperatures, reaching up to 1.0 °C.
In contrast, pH showed markedly differentiated patterns between the two study areas. Gueshgue was characterized by moderately to slightly acidic conditions, with a mean pH of 4.49 ± 0.66 and values ranging from 3.79 to 5.54. This contrasted with Llaca, where neutral pH conditions were recorded, with a mean value of 7.05 ± 0.12 and a range of 6.82 to 7.18. The acidity observed in Gueshgue coincided with high ORP values, reaching up to 472.0 mV at Gue.AP6, and significantly higher EC and TDS values (121.17 ± 7.38 µS/cm and 60.50 ± 3.61 ppm, respectively). In comparison, Llaca showed a mean ORP of 317.41 ± 25.87 mV, EC of 17.08 ± 3.03 µS/cm, and TDS values ranging from 5 to 11 ppm. The DO showed considerable concentrations in both study areas (>6 mg/L), except at point Lla.AP8 (4.66 mg/L) in Llaca, which was sampled in a small, very shallow water body with limited flow.
Chl-a was absent, and carbon concentrations were very low, which is consistent with this type of proglacial ecosystem that is still undergoing formation. IC generally showed higher concentrations, with the highest values recorded at the points closest to the 2025 glacierized area (3 mg/L, Lla.AP10). In the case of TOC, the detected concentrations were notably low; Llaca was characterized by higher concentrations, ranging from 0.2 to 0.6 mg/L, compared with Gueshgue, where only two points, Gue.AP7 and Gue.AP12, showed detectable concentrations (0.1 mg/L). Turbidity values were generally low, with the water bodies in Llaca being more turbid (8.43 ± 0.88 NTU), associated with the movement dynamics of its slopes and lakes, compared with the hydrological stability observed in Gueshgue (2.01 ± 0.95 NTU), although the latter showed high variability among sampling points (CV > 47%).
The inorganic anion profile revealed that, as in the soils, SO42− was the dominant ion in the lakes of Llaca and Gueshgue. In the water bodies of Gueshgue, SO42− showed a mean concentration of 37.79 ± 5.69 mg/L, with values reaching up to 48.33 mg/L at Gue.AP12. In contrast, the mean concentration in Llaca was 2.11 ± 0.38 mg/L, approximately 18 times lower than that recorded in Gueshgue. For NO3 and F, Llaca showed higher mean concentrations than Gueshgue, approximately twofold and fourfold higher, respectively. Cl showed very low concentrations in Llaca (0.07 ± 0.01 mg/L) and higher concentrations in Gueshgue (0.18 ± 0.04 mg/L), although both remained within concentration ranges typical of this type of environment.
The elemental composition of water, expressed as total metals, was dominated by Si, Al, Ca, Mg, Fe, and K in both study areas. The mean concentrations of these elements were higher in Llaca than in Gueshgue, ranging from 76% to 525% higher, except for Ca and Mg, which were 69% and 85% higher in Gueshgue, respectively. In Llaca, the metal with the highest mean concentration was Si (6.366 ± 2.42 mg/L), followed by Ca (2.29 ± 0.25 mg/L). In contrast, Ca dominated in Gueshgue (7.36 ± 2.46 mg/L), followed by Mg (4.811 ± 0.298 mg/L). The presence of Fe and Al in both study areas can be considered relevant; in Llaca, Fe ranged from 0.574 to 3.025 mg/L and Al from 0.530 to 2.948 mg/L, whereas in Gueshgue, Fe ranged from 0.131 to 0.801 mg/L and Al from 0.440 to 1.930 mg/L.
Elements occurring at moderate concentrations included Ba, Cu, Li, Mn, Na, Sr, Ti, and Zn. In these cases, Gueshgue showed higher concentrations of Cu, Mn, Sr, and Zn, ranging from 32% to 77% higher, whereas Llaca showed higher concentrations of Ba, Li, Na, and Ti, ranging from 56% to 826% higher. Trace elements generally occurred at low concentrations in both areas (<0.02 mg/L), with Rb in Llaca standing out at 0.0215 mg/L at point Lla.AP11, and Cr in Gueshgue at 0.04 mg/L at point Gue.AP10, which was the only sampling point where Cr was detectable.

3.4. Multivariate Analysis of Water Physicochemical Properties

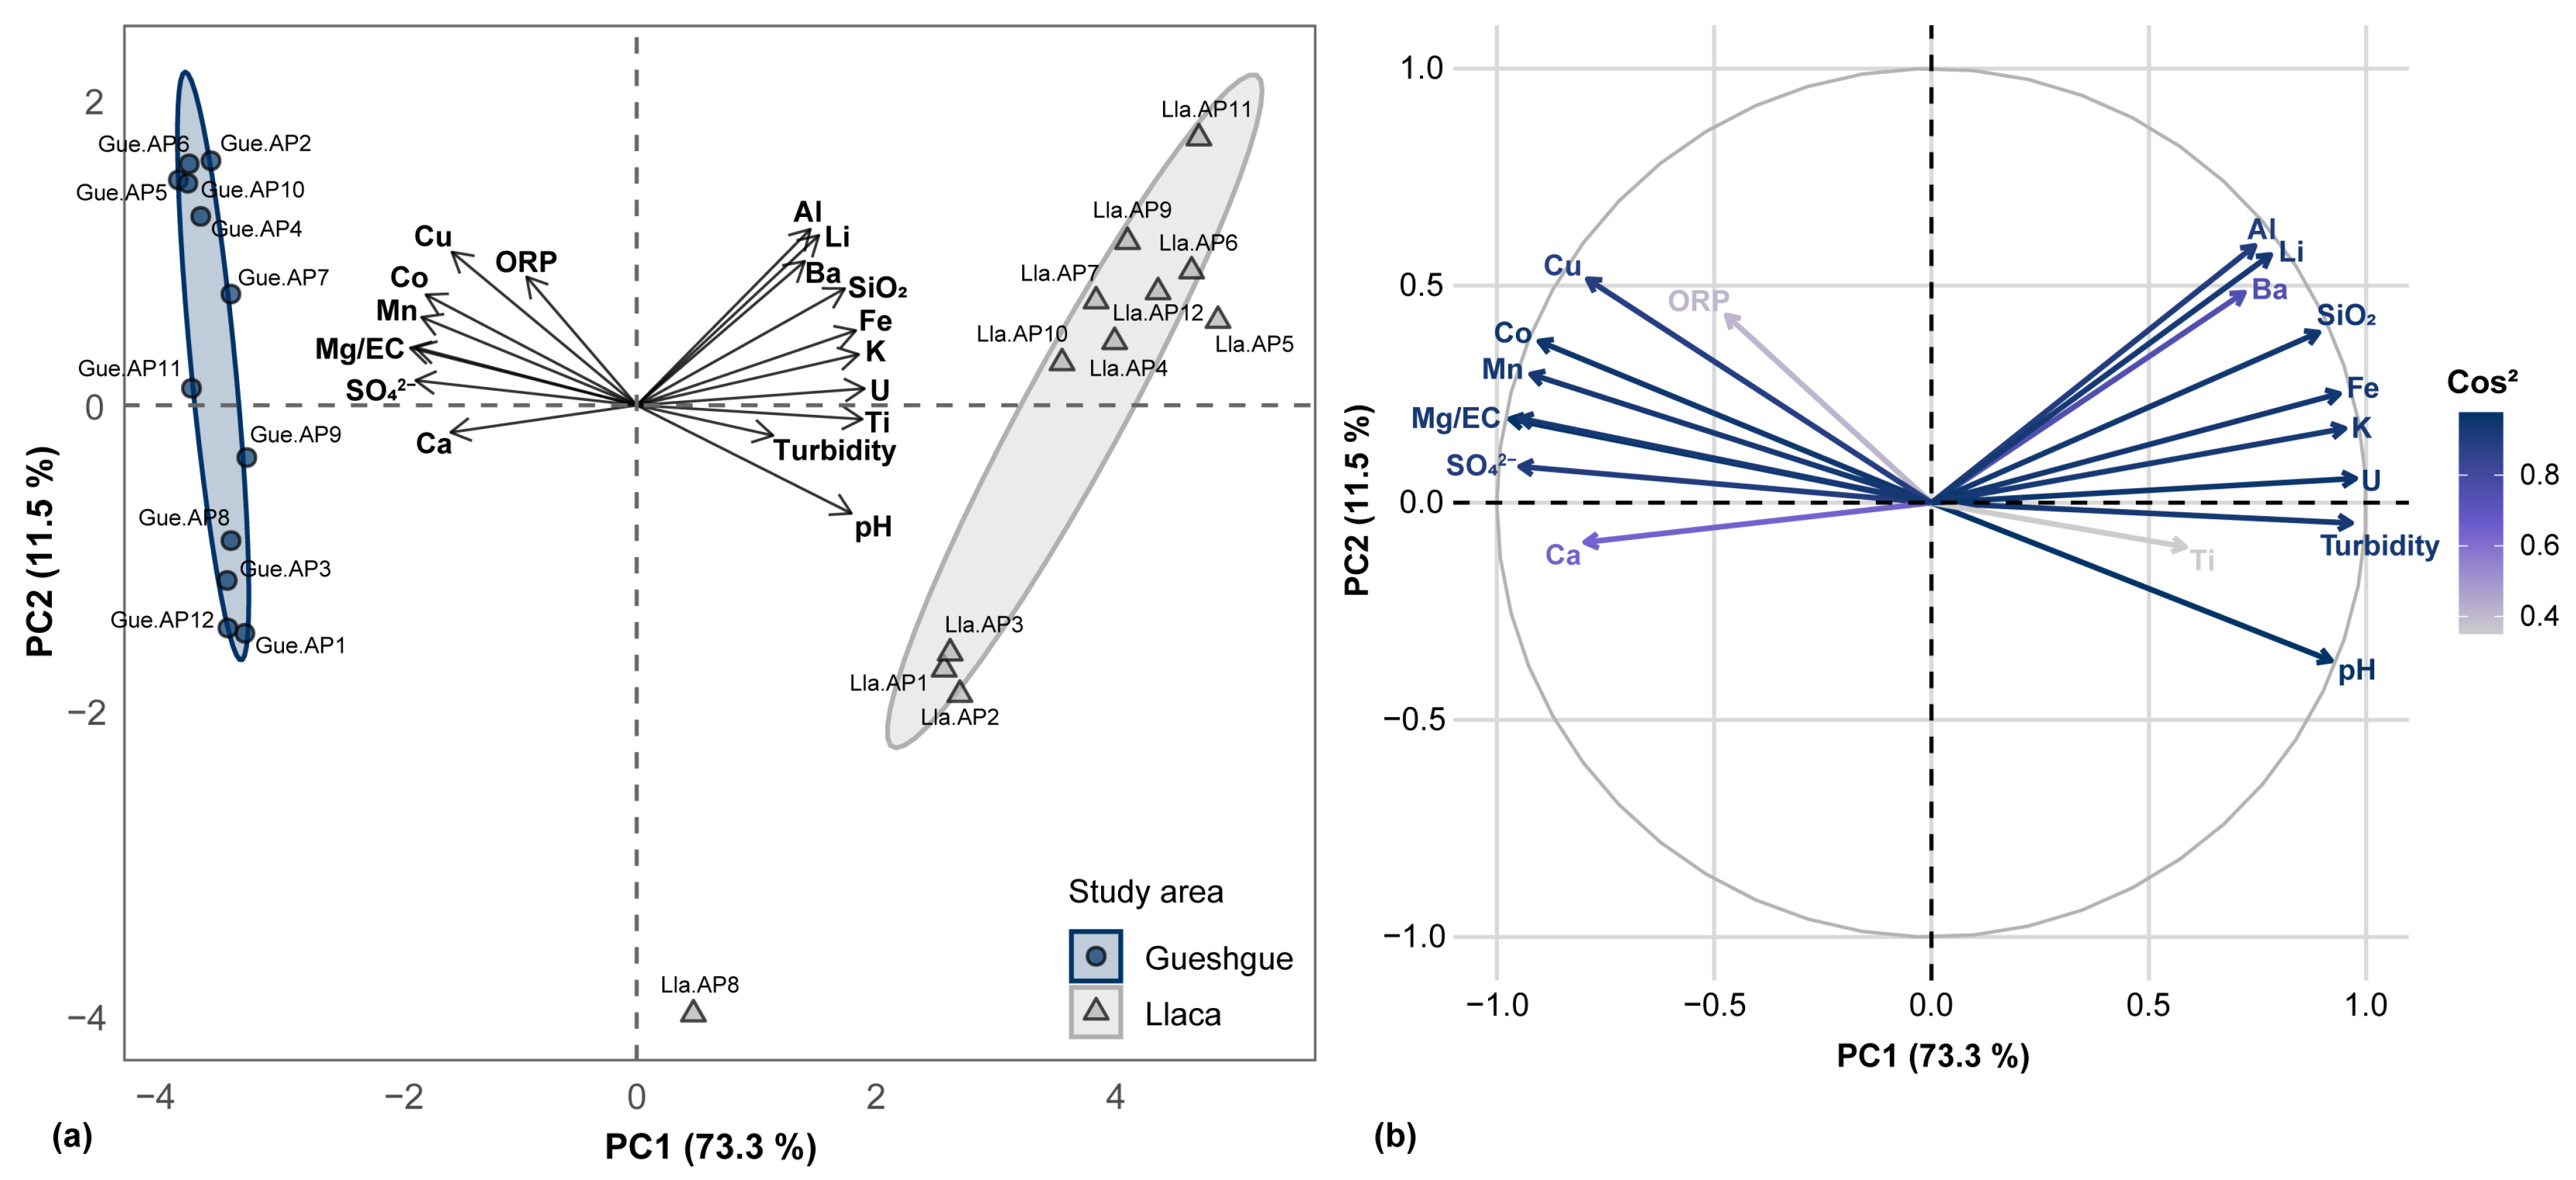
PCA applied to 18 physicochemical properties of the water bodies explained 84.8% of the cumulative total variance in the first two principal components, revealing a clearly defined hydrochemical spatial segregation between the two study areas (Figure 7).
PC1 explained 73.3% of the variance and was mainly influenced by U (7.2%), EC (7.1%), turbidity (7.1%), K (6.8%), SO42− (6.8%), Mg (6.8%), and Fe (6.7%). A clear differentiation between the study areas was observed, with Gueshgue samples located in the negative sector and associated with high EC levels and elevated concentrations of Mg, Mn, Co, Cu, and SO42−. In contrast, Llaca samples were mainly positioned toward the positive sector and were related to higher concentrations of Al, Li, Ba, SiO2, Fe, K, and U. PC2 explained 11.5% of the variance and was driven by a metal-loading gradient, with the main contributions from Al (16.9%), Li (15.7%), Cu (12.8%), and Ba (11.3%). Unlike the pattern observed in soils, Gueshgue showed greater homogeneity in its water bodies, whereas Llaca exhibited marked internal heterogeneity. The PCA revealed a differentiated hydrochemistry between the two study areas, which was statistically significant (p < 0.05) according to the PERMANOVA analysis.
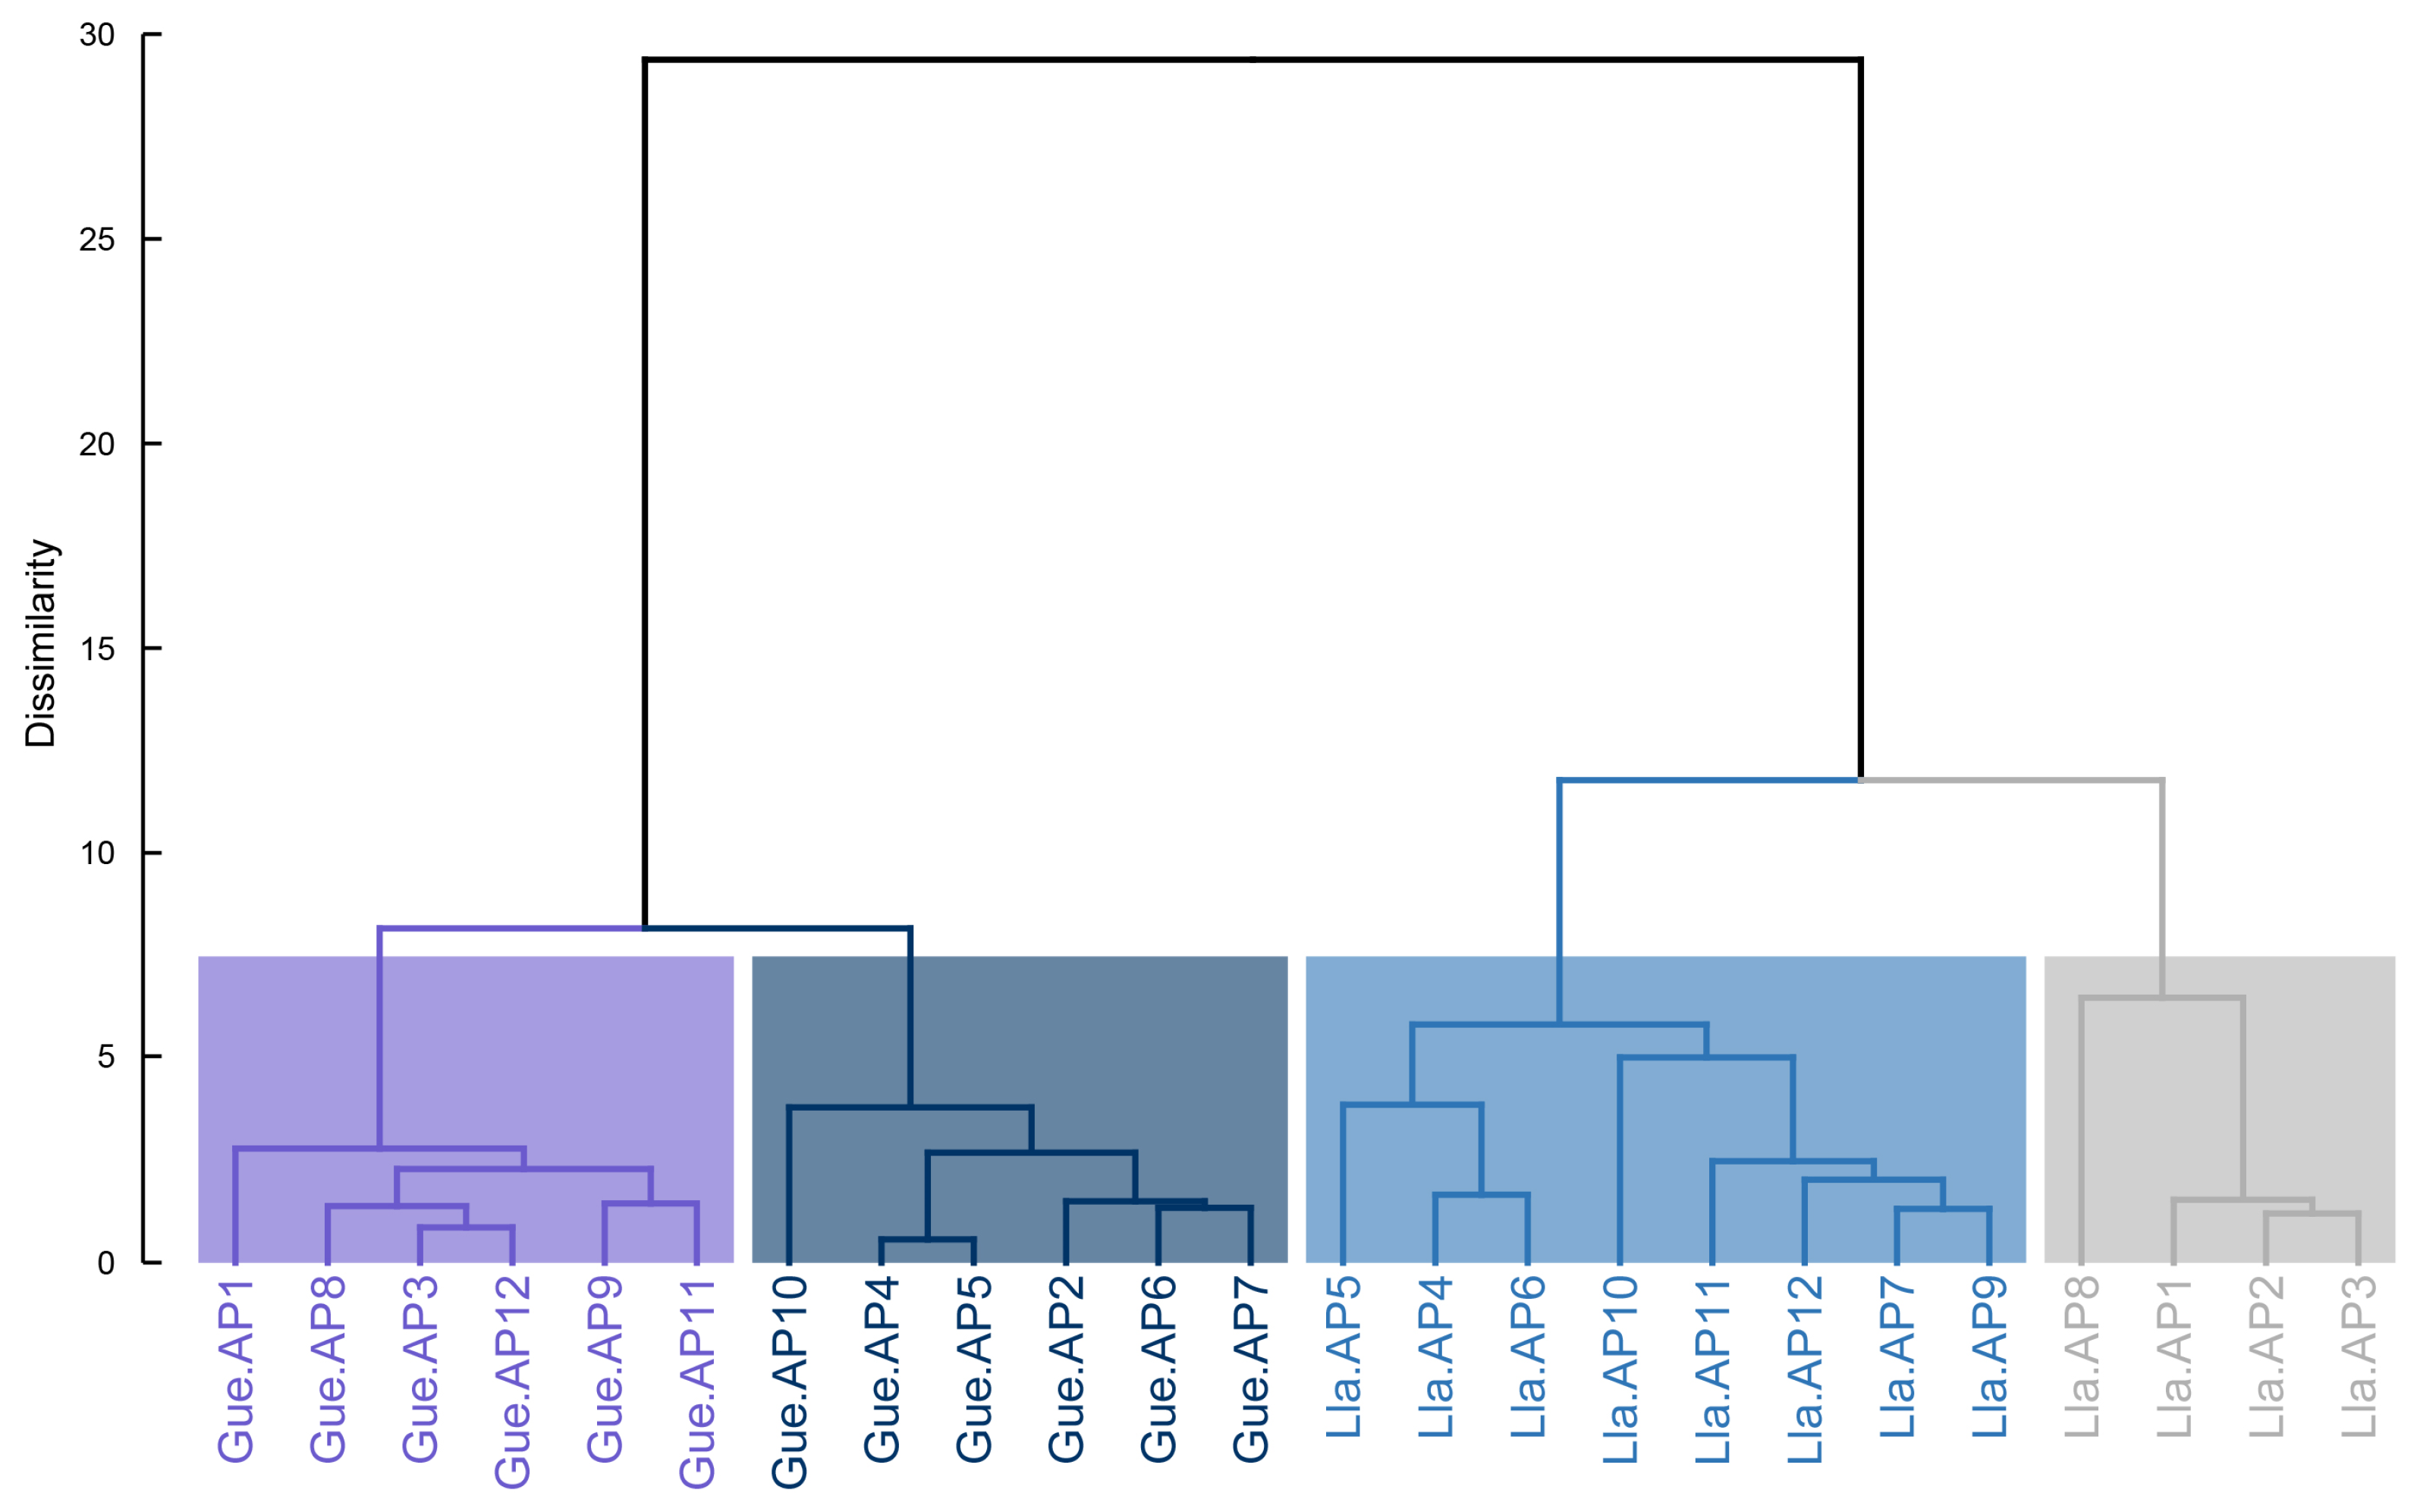
Hierarchical clustering of the water samples identified four main groups at a dissimilarity level of approximately 7 among sampling points and approximately 30 between the two study areas (Figure 8). The statistical significance of these groupings, evaluated using PERMANOVA, showed differences among the defined groups (R2 = 0.86, pseudo-F = 40.67, p = 0.001).
In Gueshgue, the samples were divided into two subgroups that broadly reflect differences in hydrological setting and connectivity. The first subgroup included samples mainly associated with stream-influenced sectors and Lake 1376982-8, whereas the second subgroup was associated with Lake 1376982-5 and the stream connecting this lake to the proglacial lake. In Llaca, the samples were also divided into two subgroups. One subgroup was associated with the upper and more dynamic lakes, which are influenced by glacier proximity, debris-covered ice, and/or contact with ice-marginal conditions. The other subgroup was mainly associated with the older and more stable Lake 1376958-3, although Lla.AP8 formed a distinct branch, consistent with its occurrence in a small, shallow water body with limited flow and distinct physicochemical conditions. These subdivisions suggest that, within each glacier retreat area, water geochemistry is influenced by local hydrological connectivity, lake stability, and ice/sediment interaction rather than by a single homogeneous lake-water signal.
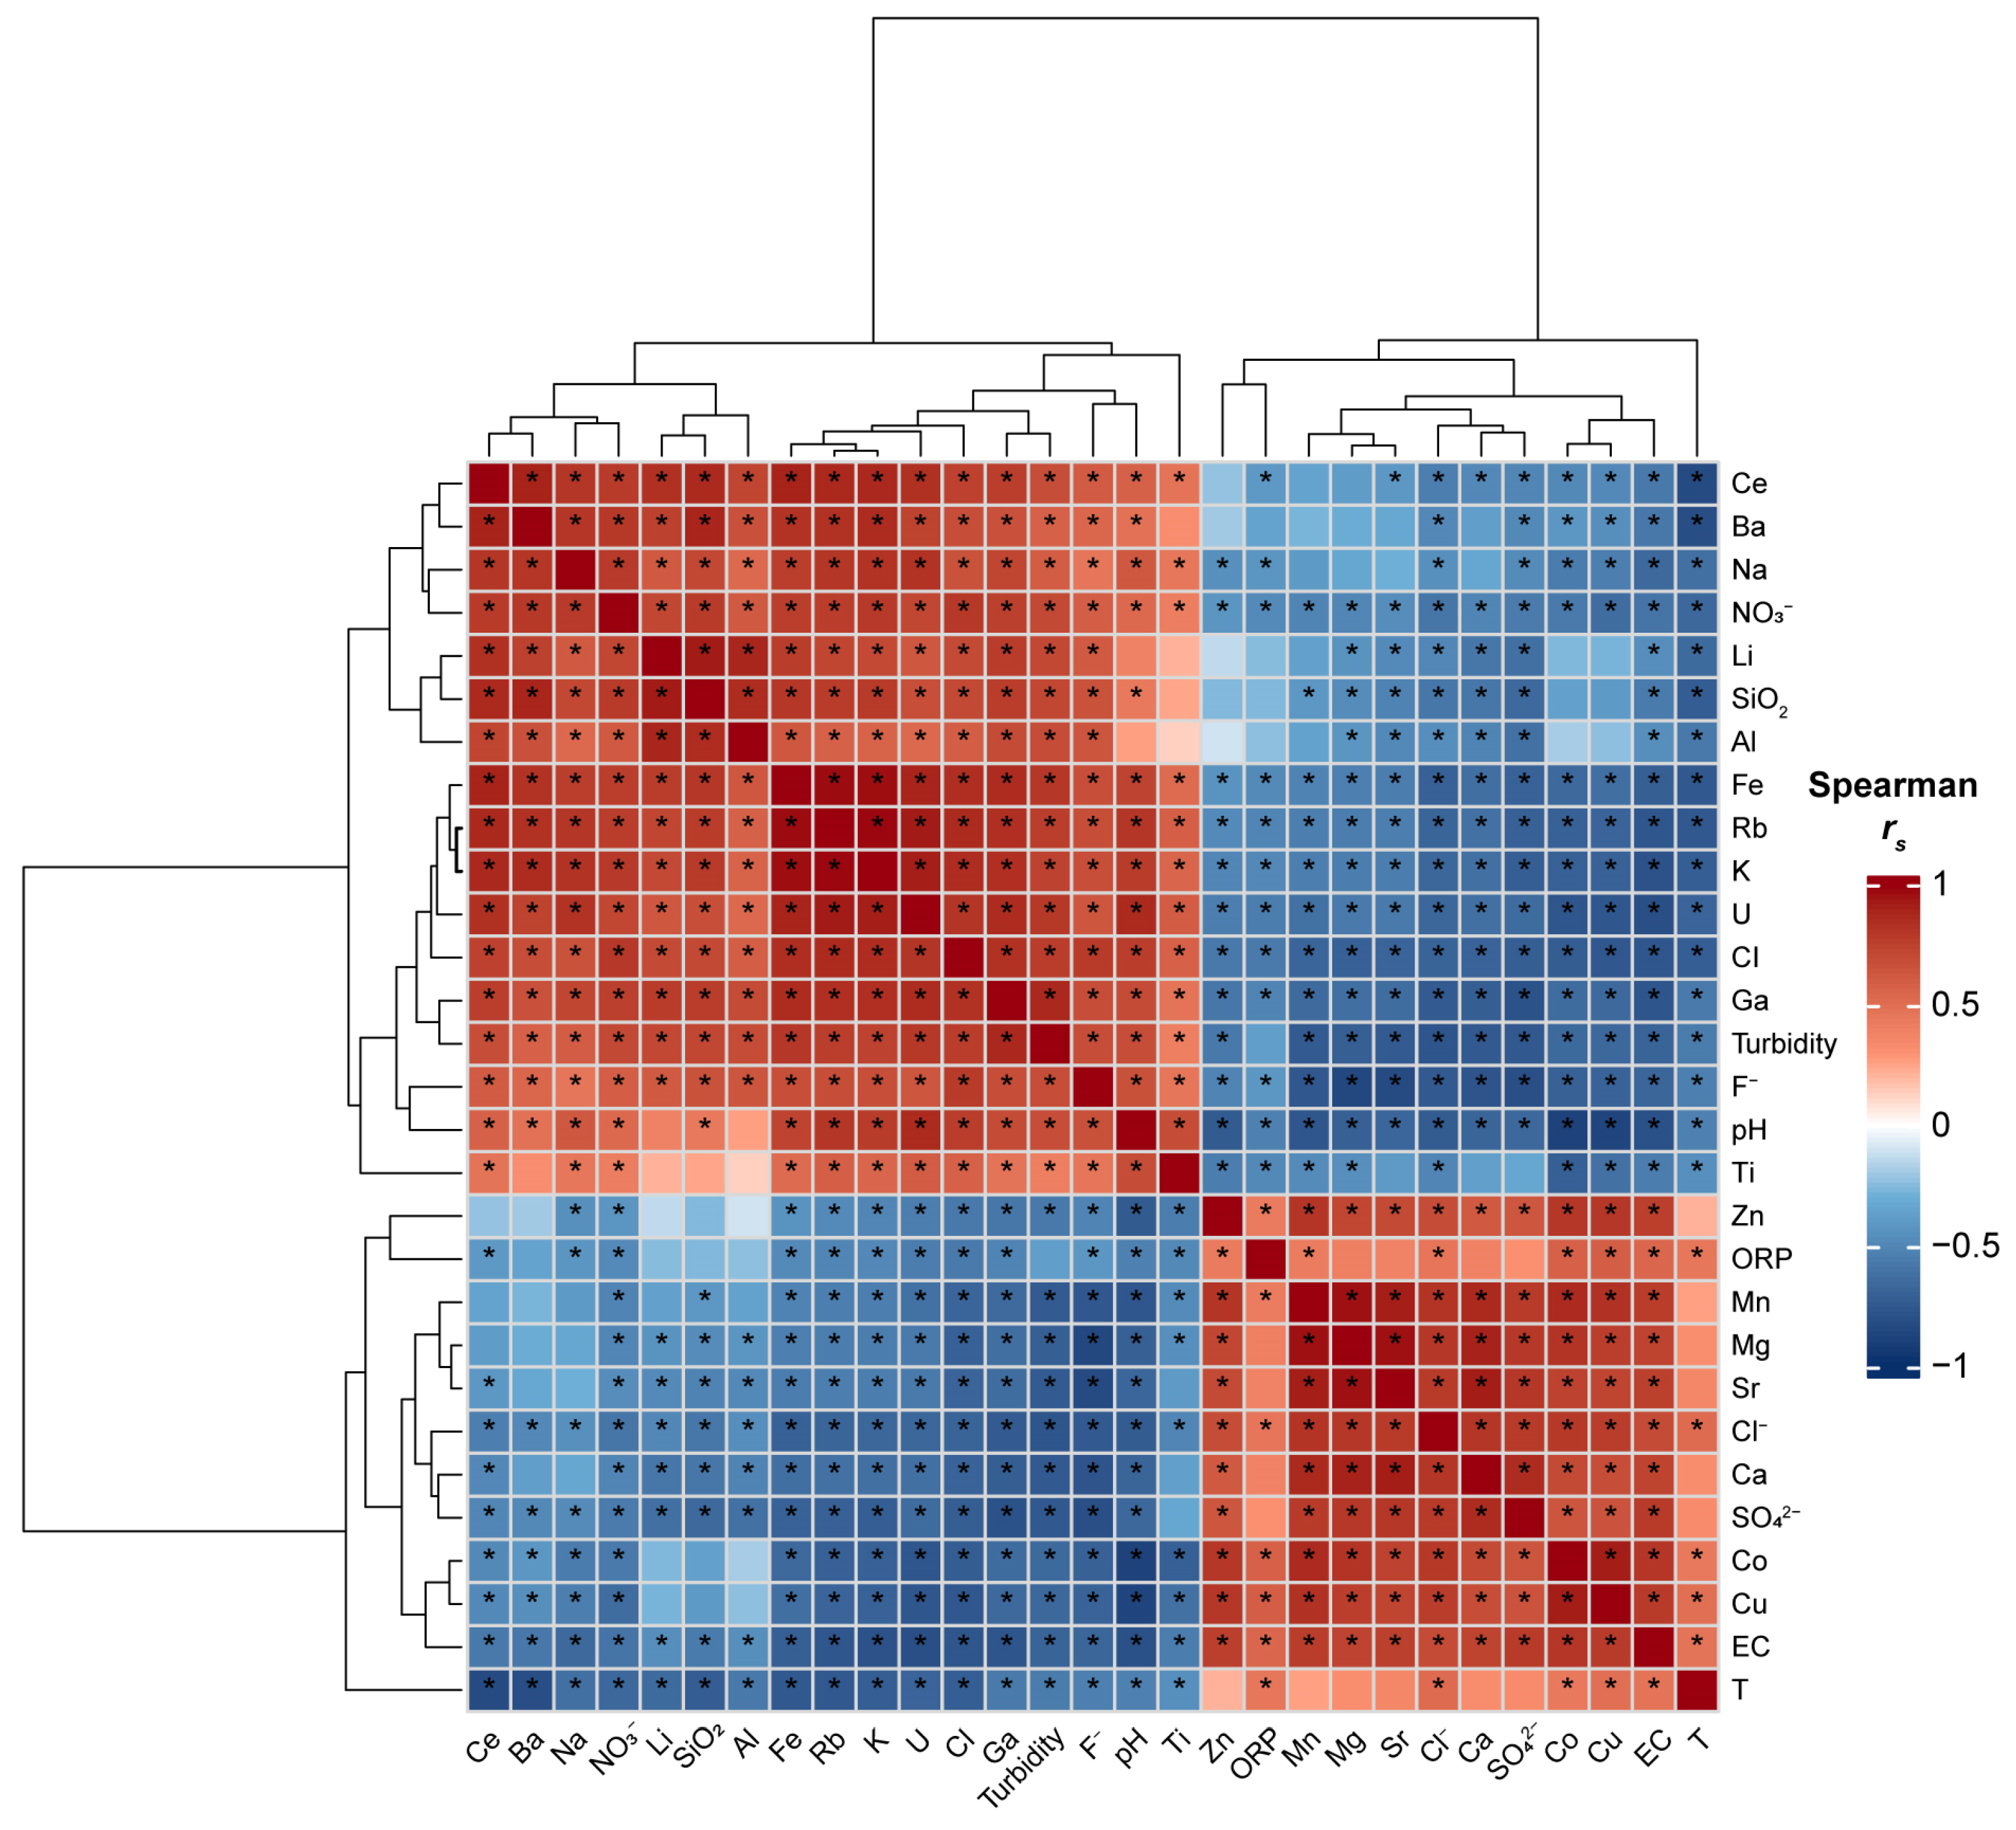
Figure 9 summarizes the Spearman correlations among the water physicochemical properties measured in Llaca and Gueshgue. The analysis revealed two broad groups of covarying variables characterized by predominantly positive within-group correlations and negative correlations between groups. These correlation structures provide an exploratory representation of the contrasting hydrochemical patterns observed across the two study areas and should not be interpreted as evidence of proportional or causal relationships among variables.
Group 1: Associations among turbidity, major elements, and silicate-related variables. This group includes Ce, Ba, Na, NO3, Li, SiO2, Al, Fe, Rb, K, U, IC, Ga, turbidity, F, pH, and Ti. Strong positive correlations were observed between turbidity and IC, SiO2, Al, and Fe (rs > 0.70), indicating that these variables covary within the analyzed water samples. This pattern is consistent with the influence of mineral particles and fine glacial sediments derived from physical erosion and water–rock interaction, although sediment sources and transport pathways were not directly quantified in this study. The associations of K, Rb, SiO2, and other lithogenic elements may also reflect inputs from silicate-bearing materials within the local geological setting.
Group 2: Associations among EC, SO42−, ORP, and metal-related variables. This group includes ORP, EC, Zn, Mn, Mg, Sr, Cl, Ca, SO42−, Co, and Cu. The strong positive correlation between EC and SO42− (rs = 0.79) indicates that sulfate covaries closely with the greater ionic content observed in the more mineralized waters. Likewise, the associations of ORP with Co, Cu, Mn, and other elements are consistent with oxidizing geochemical conditions and possible oxidative weathering of sulfide-bearing materials. However, the specific mineral phases and redox-controlled mobilization mechanisms were not directly determined. The associations of Ca and Mg may reflect contributions from weathering of local lithological materials and possible buffering reactions within the catchment.

4. Discussion

4.1. Geochemical Patterns of Proglacial Soils

A total of 59 parameters were analyzed to comprehensively evaluate the physicochemical characteristics of proglacial soils within the glacier retreat period from 1970/1984 to 2025, considering that these properties play a fundamental role in soil evolution and influence the behavior of the overall system.
The results show that the soils of Llaca and Gueshgue exhibit physicochemical characteristics consistent with young proglacial environments [27,41], including low nutrient and organic matter contents, marked geochemical variability, and elevated concentrations of some potentially toxic elements [41,67,68]. Previous studies have shown that soil development following deglaciation can be relatively slow and that young proglacial soils are often characterized by low nutrient availability [27,41]. The time elapsed since glacier-front retreat is the main driver of soil development [69], although geomorphological processes and rapid climate change are also considered key conditioning [35,70].
Very few local studies have characterized in detail the physical and chemical composition of proglacial soils. As demonstrated in this study, each parameter may exhibit a distinct behavioral pattern in each area. Slope is considered one of the critical physical factors in our study areas, given its high variability, with flat, gentle, and moderate slopes ranging from 1° to 35°. This variability may act as either an accelerator or a decelerator of the geochemical and geomorphological processes occurring in these environments [31,71]. Regarding temperature, the soils are cold, reaching values as low as 1 °C, but tend to improve their heat-retention capacity across the study area [67]. In terms of pH, Gueshgue showed acidification trends at the sampling points closest to the glacier, indicating active sulfide and Fe oxidation [29]. In contrast, Llaca appears to be evolving toward a more basic system, consistent with a chemically stable young proglacial soil. In both cases, however, pH tends to decrease over time [34,41,72,73]. The high EC levels, regardless of pH, suggest that they are mainly controlled by weathering processes associated primarily with increased Na and SO42− concentrations (rs = ~0.6) [74,75].
Within the study areas, some physical factors, such as h, ρb, granulometry and texture, and chemical parameters, such as Cl, F, Ca, NO3, and pHw, may not be considered relevant for explaining the behavior of the parameters studied, given their weak and statistically non-significant relationships, in contrast to findings reported in other studies [27,36,41]. However, the high concentration of SO42−, particularly in Gueshgue (~359.10 mg/kg), and their associations with several major and trace elements (Mg, V, Al, Cr, Fe, Cu, Ba, Co, Sr, Ce, Zn, and Pb; rs = 0.51–0.85), are consistent with the oxidative weathering of sulfide-bearing materials and the mobilization of associated elements. However, the specific sulfide mineral phases responsible for these geochemical patterns were not directly identified in this study.
Nitrogen and organic matter are key constraints on early ecosystem development in recently deglaciated soils [40]. In this study, all or most values were below the quantification limit (0.05% and 0.22%, respectively), conditioning the interconnection among several of the parameters analyzed. These elements showed very low concentrations, even lower than those reported in other studies of young proglacial soils in the Andes, such as Artesonraju, Uruashraju, Yanamarey, Broggi, Charquini, and Zongo [40,42,76]. Therefore, future studies are recommended to use more sensitive methods that allow lower concentrations to be quantified in this type of ecosystem [34,42].
The elemental composition of the soils is consistent with inputs from the local lithological setting, particularly the granodioritic, monzogranitic, and tonalitic rocks of the Cordillera Blanca Batholith, as well as locally associated sedimentary units [77]. These lithologies can contribute to the observed concentrations of Al, Ca, Fe, K, Mg, Ti, and SiO2, similar to patterns reported for other proglacial soils in the Cordillera Blanca [41]. They may also contain relatively unusual elements, such as U, Tl, and Th, which also derive from the mineralogy of the parent material. For example, U is frequently found in minerals such as uraninite and torbernite, which are common in granitic geological formations in high-mountain environments [41,78]. In the case of P, the high concentrations recorded, reaching up to 869.60 mg/kg, indicate that it remains trapped in mineral and apatite forms as primary minerals [36]. Among trace elements, the high concentrations of Cr, reaching up to 12.81 mg/kg, stand out and are associated with the weathering of Cr-rich minerals and the release of minerals previously trapped in glaciers [79]. Similarly, As, reaching up to 278.81 mg/kg, appears to be strongly influenced by sulfide-rich sedimentary rocks of the Chicama Group–Tinajones Formation [44,77].

4.2. Geochemical Patterns of Glacier-Fed Water Bodies

A total of 70 parameters were analyzed to comprehensively evaluate the physicochemical characteristics of the water bodies present in deglaciated areas from 1970/1984 to 2025. These characteristics of the upper catchment areas often influence the behavior of the entire system and, in many cases, may generate social and environmental conflicts downstream [4,22].
Glacier retreat is driving the expansion of water bodies, establishing new ecosystems that require further study and pose numerous analytical challenges [4,80]. In this context, and in association with climate change, the dissolution of geological substrates is altering the physicochemical properties of water bodies in the Andes [81,82]. In many cases, the physical and chemical properties of these waters were previously assumed to remain constant over time, and little was known about their natural evolution [83]. However, this set of characteristics is being conditioned by rock debris and fine abrasion-derived sediments, or glacial rock flour [84], which are transported by glacier dynamics and lateral moraine processes [85].
In our study, the dynamics of the water bodies differed between the two areas. Gueshgue contains hydrologically stable lakes, including a proglacial lake that had been continuously expanding since 2007 but is now in the terminal phase of growth, which will likely influence its future physicochemical properties. In contrast, Llaca contains two lakes that are still undergoing stabilization and exhibit high dynamism due to steep slopes and poorly consolidated hillsides. In addition, the proglacial lake shows fragility in its lakebed, which has driven changes in its size, volume, and fragmentation since 2020 [15]. The young age of these ecosystems, together with other factors such as sediment exposure time and microhydrological conditions, may play a more decisive role and could explain these differences [80,86]. Likewise, during the deglaciation process, elements previously accumulated within glacier ice are being released into these newly forming water bodies [87,88], which remains an issue requiring further study.
Regarding the results, field parameters such as T, pH, ORP, EC, TDS, and DO reflect the conditions at the time of sampling and can provide insight into how the water body develops through continuous monitoring. Llaca and Gueshgue exhibit both similar and contrasting characteristics. The low water temperatures recorded, ranging from 1 to 9 °C, are typical of meltwater from high-Andean environments, particularly proglacial lakes [89,90]. The measured pH and EC showed good statistical correlations (rs > 0.5) with the other physicochemical properties and also differed significantly between the two study areas. Gueshgue is characterized by acidic pH values, ranging from 3.79 to 5.54, which represents a geochemical warning signal and indicates the development of conditions consistent with natural acid rock drainage (ARD), likely associated with the oxidative weathering of sulfide-bearing materials and the release of acidity and sulfate [23,43,91,92]. In contrast, Llaca exhibits neutral conditions, with pH values ranging from 6.82 to 7.18, indicating a high buffering capacity of the surrounding environment. The high ORP in Gueshgue may indicate that most heavy metals, such as Fe, Al, Mn, Cr, and Cu, remain in soluble ionic forms. In Llaca, although oxidized minerals may be present due to high ORP, the alkaline pH would act as a geochemical barrier [93].
EC and TDS levels were within the typical ranges associated with weathering and water–rock interaction. Llaca falls within the range of relatively pure meltwater, with EC values between 11 and 23 µS/cm, whereas Gueshgue shows moderate values, ranging from 110 to 134 µS/cm. Dissolved oxygen concentrations were optimal and even high, reaching up to 8.92 mg/L in Llaca, as gases such as oxygen are more soluble at low temperatures [94]. However, these conditions are also favorable for the continued generation of ARD, since oxygen is the main reactant involved in sulfide weathering [91,95]. The non-detectable Chl-a levels indicate an ultra-oligotrophic system, characterized by highly transparent, extremely cold, and nutrient-poor waters, which limits algal development [96,97,98,99]. Turbidity in Gueshgue was very low (<5 NTU), reflecting its hydrological stability, whereas Llaca showed higher turbidity values, reaching up to 10.40 NTU, associated with slope dynamics and the input of glacial rock flour.
Carbon pools provide information on biological activity, organic matter inputs, and water–rock interactions within glacier-fed aquatic systems. The behavior and low concentration of IC (<3 mg/L) suggest, in both areas, a strong influence of carbonate dissolution processes associated with the geochemical composition of sediments and glacier-melt processes [100,101] rather than biological activity. Regarding TOC, concentrations were very low at most sampling points (<0.2 mg/L), with a maximum value of 0.6 mg/L at Lla.AP8. This pattern is characteristic of recently exposed glacier-fed ecosystems, where low biological productivity is driven by factors such as sparse vegetation cover, poorly developed soils, and short water residence times [86,89,102]. In Gueshgue, the extremely low carbon levels may indicate carbon depletion due to its reaction in neutralizing the ongoing ARD process, which could create a future risk of complete loss of buffering capacity. The carbon concentrations obtained in this study were lower than those reported in other studies from the Cordillera Blanca [102] and Greenland [103,104], but similar to those reported in Iceland and Canada [105,106].
Regarding anions, this is the first report analyzing Cl and F in Gueshgue, whereas in Llaca their concentrations are similar to those reported by Bain [107]. These elements generally occur at low concentrations in such environments; however, they should be monitored in future studies. PO43− was absent, confirming its role as the primary limiting nutrient in these high-Andean oligotrophic ecosystems [108,109]. The presence of SO42− was relevant in both study areas, with Gueshgue showing the highest concentration (~37.79 mg/L), consistent with the geochemical signature of sulfide oxidation [110,111]. In Llaca, its presence may be related to glacier meltwater flowing over stable granitic or silicate bedrock without sulfide-bearing minerals [112]. NO3 concentrations were typically low [107], as in these high proglacial zones they mainly originate from atmospheric deposition or from the melting of old snow layers that concentrate aerosols [113,114,115].
Regarding total metals, the relatively high concentrations of Al, Ca, Fe, K, Mg, and Si likely reflect mineral inputs associated with the weathering of local lithological materials and the mobilization of glacial sediments within the study catchments [81,92,116,117,118]. This interpretation is consistent with the geological setting described in Section Bedrock Geology and Lithological Setting, although the specific mineral phases contributing to the observed elemental concentrations were not directly analyzed in this study. These elements are also characteristic of other sectors of the Cordillera Blanca, such as Quillcayhuanca and Shallap, where higher concentrations of Al, Mn, Pb, and Zn have been reported [119], and Pastoruri, where high concentrations of SiO2, Al, Co, Fe, Mg, Ni, and Zn have been found [92]. These areas are also ecosystems associated with ARD-related problems. Proglacial lakes have been found to contain higher metal concentrations overall [120]. In surface waters, further spatial and temporal monitoring of Al and Fe in Llaca and of Al, Fe, and Cd in Gueshgue is warranted to assess their mobility, persistence, and potential downstream environmental relevance.

4.3. Study Limitations and Environmental Implications

The results of this study should be interpreted within the spatial and temporal scope of the sampling design. The geochemical patterns identified represent a synchronized sampling fieldwork conducted in December 2024 and therefore do not quantify seasonal variability or interannual changes. Although the composite soil sampling and distribution of water stations allowed a comparative assessment of Llaca and Gueshgue, a denser spatial network and repeated sampling under contrasting seasonal hydrological conditions would improve the assessment of within-site variability and the temporal persistence of the observed patterns.
From an environmental perspective, the contrasting geochemical conditions identified in Llaca and Gueshgue highlight the importance of continued monitoring of recently deglaciated headwater systems [4,5,21]. In particular, the acidic conditions, elevated SO42− concentrations, and associations with trace elements (such as As, Pb, Cr, and U) observed in Gueshgue may influence downstream water chemistry and the ecological conditions of connected aquatic environments [23,44,92]. Likewise, the elevated concentrations of some potentially toxic elements detected in soils and waters warrant further spatial and temporal assessment to determine their mobility, persistence, and transfer across environmental compartments [21,68,81]. However, the present study did not evaluate human exposure, water-consumption pathways, bioavailability, or toxicological risk; therefore, no direct conclusions regarding human health risk can be drawn from these results. Dedicated environmental and human health risk assessments would be required to address these issues.

5. Conclusions

This study highlights the importance of describing and interpreting patterns of change in abiotic components, such as soil and water, within tropical proglacial ecosystems, which evolve differently under the influence of glacier shrinkage and climate change. Based on the analysis of 18 soil samples and 24 water samples, 59 and 70 physicochemical properties, respectively, were evaluated in glacier retreat areas corresponding to the 1970/1984–2025 period in the Llaca and Gueshgue glaciers of the Cordillera Blanca, Peru. Our results indicate significant differences (p < 0.05) in most of the analyzed parameters, which define contrasting geochemical patterns of these recently exposed areas by tropical glacier retreat.
The integrated geochemical patterns indicate that Gueshgue exhibits ARD-like conditions consistent with the oxidative weathering of sulfide-bearing materials, whereas Llaca behaves as a predominantly neutral system characterized by stronger signals of physical erosion and the mobilization of fine glacial sediments. These contrasting geochemical patterns may also be influenced by differences in the geological setting of the two study areas. In Llaca, granodioritic and monzogranitic lithologies of the Cordillera Blanca Batholith dominate the surrounding bedrock, whereas Gueshgue is characterized by a more heterogeneous geological setting that includes granodioritic–tonalitic intrusive rocks and sedimentary units of the Chicama Group–Tinajones Formation. The contrasting lithological settings, together with glacier retreat and sediment mobilization processes, may therefore contribute to the differentiated elemental patterns observed in the soils and water bodies of both study areas. The multivariate analyses further showed that the degree of within-area heterogeneity differed between environmental compartments: Gueshgue exhibited greater internal variability in soil geochemistry, whereas Llaca showed greater heterogeneity among its sampled water bodies.
This study provides an opportunity to deepen the understanding of the effects of glacier retreat on high-mountain environments and of how existing physicochemical properties may condition other abiotic and biotic factors during ecosystem evolution. Likewise, it should be regarded as an opportunity to better understand these rugged and difficult-to-study ecosystems, with a view toward continuous and sustained monitoring, given that this characterization may change in the future and trigger a series of reactions capable of modifying the entire system.
Future studies should investigate the mechanisms and interconnections among additional ecosystem components, including sediments, groundwater, geological setting, and hydrological connectivity, through expanded spatial sampling and repeated monitoring under contrasting seasonal conditions. Aqueous speciation and mineral saturation modeling, supported by dedicated hydrogeochemical and mineralogical datasets, would also help identify potential mineral dissolution and precipitation processes. Spatial gradients related to distance from the glacier margin, topography, and reconstructed terrain exposure time should be explicitly evaluated. Distinguishing simple spatial distance from the actual time elapsed since ice retreat, together with assessing seasonal and interannual variability, will be particularly important for determining the temporal stability and evolution of soil and water geochemistry in tropical proglacial ecosystems.

Author Contributions

Conceptualization, F.C.-V. and S.R.-V.; methodology, F.C.-V. and S.R.-V.; validation, E.L., K.M. and J.Ú.; formal analysis, S.R.-V.; investigation, F.C.-V., S.R.-V. and E.T.; resources, F.C.-V.; data curation, F.C.-V. and S.R.-V.; writing—original draft preparation, F.C.-V. and S.R.-V.; writing—review and editing, E.L., K.M. and J.Ú.; supervision, E.L. and J.Ú.; project administration, F.C.-V.; funding acquisition, F.C.-V. All authors have read and agreed to the published version of the manuscript.

Funding

This research was funded by CONCYTEC through the PROCIENCIA program within the framework of the “Basic Research Projects 2024-03” competition, under contract [PE501088551-2024-PROCIENCIA], project “Analysis of chronosequences of glacier retreat areas and their relationship with the emergence of terrestrial and aquatic ecosystems in Cordillera Blanca, Peru (CronoEco-Glaciar)”.

Data Availability Statement

The data supporting the findings of this study are available from the corresponding author upon reasonable request.

Acknowledgments

We thank GOM Beto Navarro Pinto Toledo and the Peruvian Mountain Guides Association (AGMP) for facilitating the use of the Llaca Mountain Refuge during the fieldwork. We thank Brenda Castro, Jean Velasquez, Ebert Giraldo, Mayté Ramirez, Alessa Méndez, Madeli Quito, Daniella Padilla, Lolly Ramirez, Milton Quesada, Noemí Guerrero, Edinson Jara, Jhon Salas, Yesenia Castro, Karen Vega, and Yordy Vergara for their support in the collection and transport of the study samples. This research was conducted at the EcoBIOTEM Research Group. We also thank Planet Teams for providing free access to PlanetScope satellite imagery through their Education and Research Program.

Conflicts of Interest

The authors declare no conflicts of interest. Soil and water sample collection was carried out within the protected natural area of Huascarán National Park, Peru, with authorization from Head Resolution No. 000026-2024-SERNANP/PNHUA-SGD, guaranteeing compliance with all applicable national regulations and institutional guidelines.

References

  1. Oerlemans, J. Glaciers and Climate Change, 1st ed.; A. A. Balkema Publishers: Rotterdam, The Netherlands, 2001. [Google Scholar]
  2. Roe, G.H.; Baker, M.B.; Herla, F. Centennial glacier retreat as categorical evidence of regional climate change. Nat. Geosci. 2016, 10, 95–99. [Google Scholar] [CrossRef]
  3. Caro, A.; Condom, T.; Rabatel, A.; Champollion, N.; García, N.; Saavedra, F. Hydrological response of Andean catchments to recent glacier mass loss. Cryosphere 2024, 18, 2487–2507. [Google Scholar] [CrossRef]
  4. Milner, A.M.; Khamis, K.; Battin, T.J.; Brittain, J.E.; Barrand, N.E.; Füreder, L.; Cauvy-Fraunié, S.; Gíslason, G.M.; Jacobsen, D.; Hannah, D.M.; et al. Glacier shrinkage driving global changes in downstream systems. Proc. Natl. Acad. Sci. USA 2017, 114, 9770–9778. [Google Scholar] [CrossRef] [PubMed]
  5. Hawkings, J.R.; Bradley, J.A.; Doting, E.L.; Hassan, N.; Hendry, K.R.; Holt, A.D.; Hood, E.; Spencer, R.G.M.; Stibal, M.; Tranter, M.; et al. Glacier biogeochemical cycling and downstream impacts. Nat. Rev. Earth Environ. 2025, 7, 124–143. [Google Scholar] [CrossRef]
  6. Huss, M.; Bookhagen, B.; Huggel, C.; Jacobsen, D.; Bradley, R.S.; Clague, J.J.; Vuille, M.; Buytaert, W.; Cayan, D.R.; Greenwood, G.; et al. Toward mountains without permanent snow and ice. Earth’s Futur. 2017, 5, 418–435. [Google Scholar] [CrossRef]
  7. Vuille, M.; Carey, M.; Huggel, C.; Buytaert, W.; Rabatel, A.; Jacobsen, D.; Soruco, A.; Villacis, M.; Yarleque, C.; Elison Timm, O.; et al. Rapid decline of snow and ice in the tropical Andes—Impacts, uncertainties and challenges ahead. Earth-Sci. Rev. 2018, 176, 195–213. [Google Scholar] [CrossRef]
  8. Wilkes, M.A.; Carrivick, J.L.; Castella, E.; Ilg, C.; Cauvy-Fraunié, S.; Fell, S.C.; Füreder, L.; Huss, M.; James, W.; Lencioni, V.; et al. Glacier retreat reorganizes river habitats leaving refugia for Alpine invertebrate biodiversity poorly protected. Nat. Ecol. Evol. 2023, 7, 841–851. [Google Scholar] [CrossRef] [PubMed]
  9. Turpo, E.Y.; Borja, M.O.; Espinoza-Villar, R.; Moreno, N.; Camargo, R.; Almeida, C.; Hopfgartner, K.; Yarleque, C.; Souza, C.M. Mapping three decades of changes in the tropical Andean glaciers using landsat data processed in the Earth Engine. Remote Sens. 2022, 14, 1974. [Google Scholar] [CrossRef]
  10. Hugonnet, R.; McNabb, R.; Berthier, E.; Menounos, B.; Nuth, C.; Girod, L.; Farinotti, D.; Huss, M.; Dussaillant, I.; Brun, F.; et al. Accelerated global glacier mass loss in the early twenty-first century. Nature 2021, 592, 726–731. [Google Scholar] [CrossRef] [PubMed]
  11. Kohler, T.; Maselli, D. Mountains and Climate Change: From Understanding to Action; Geographica Bernensia: Bern, Switzerland, 2009; ISBN 9783905835168. [Google Scholar]
  12. Palomo, I. Climate change impacts on ecosystem services in high mountain areas: A literature review. Mt. Res. Dev. 2017, 37, 179–187. [Google Scholar] [CrossRef]
  13. Liu, B.; Zou, X.; Yi, S.; Sneeuw, N.; Li, J.; Cai, J. Reconstructing GRACE-like time series of high mountain glacier mass anomalies. Remote Sens. Environ. 2022, 280, 113177. [Google Scholar] [CrossRef]
  14. Giraldo-Malca, U.F.; Yauri-Solano, L.N.; Choroco-Carranza, S.V.; Camacho-Alvarez, D.G.; Quispe-Quispe, F.C.; Chávez-García, J.A.; Mark, B.G. The loss of glacier resilience due to climate change throughout the Cordillera Blanca, Peru between 1984 and 2023. Quat. Sci. Adv. 2025, 19, 100286. [Google Scholar] [CrossRef]
  15. INAIGEM. Inventario Nacional de Glaciares y Lagunas de Origen Glaciar 2023; Instituto Nacional de Investigación en Glaciares y Ecosistemas de Montaña: Huaraz, Peru, 2023.
  16. Haeberli, W.; Schaub, Y.; Huggel, C. Increasing risks related to landslides from degrading permafrost into new lakes in de-glaciating mountain ranges. Geomorphology 2016, 293, 405–417. [Google Scholar] [CrossRef]
  17. Ficetola, G.F.; Marta, S.; Guerrieri, A.; Cantera, I.; Bonin, A.; Cauvy-Fraunié, S.; Ambrosini, R.; Caccianiga, M.; Anthelme, F.; Azzoni, R.S.; et al. The development of terrestrial ecosystems emerging after glacier retreat. Nature 2024, 632, 336–342. [Google Scholar] [CrossRef]
  18. Vinšová, P.; Kohler, T.J.; Simpson, M.J.; Hajdas, I.; Yde, J.C.; Falteisek, L.; Žárský, J.D.; Yuan, T.; Tejnecký, V.; Mercl, F.; et al. The biogeochemical legacy of Arctic subglacial sediments exposed by glacier retreat. Glob. Biogeochem. Cycles 2022, 36, e2021GB007126. [Google Scholar] [CrossRef]
  19. Akhmetkaliyeva, S.; Dean, A.P.; Clarke, L.J.; Cook, S.J.; Lopez, S.R.; Sparkes, R.B. Past and present bacterial communities in deglaciating northern latitude catchments reveal varied soil carbon sequestration potential. Sci. Total Environ. 2025, 969, 178723. [Google Scholar] [CrossRef] [PubMed]
  20. Shugar, D.H.; Burr, A.; Haritashya, U.K.; Kargel, J.S.; Watson, C.S.; Kennedy, M.C.; Bevington, A.R.; Betts, R.A.; Harrison, S.; Strattman, K. Rapid worldwide growth of glacial lakes since 1990. Nat. Clim. Chang. 2020, 10, 939–945. [Google Scholar] [CrossRef]
  21. Xue, Y.; Tu, X.; Nie, Y.; Wu, L.; Zhang, H.; Wang, Z.; Su, G.; Liu, X. Secondary releases of legacy heavy metals to proglacial ecosystems from melting Arctic glaciers. J. Hazard. Mater. 2025, 496, 139290. [Google Scholar] [CrossRef]
  22. Hanshaw, M.N.; Bookhagen, B. Glacial areas, lake areas, and snow lines from 1975 to 2012: Status of the Cordillera Vilcanota, including the Quelccaya Ice Cap, northern central Andes, Peru. Cryosphere 2014, 8, 359–376. [Google Scholar] [CrossRef]
  23. Garcia, J.L.; Huaman-Navarro, Y.E.; Willems, B.L.; Loayza-Muro, R.; Moreira-Turcq, P.; Wadham, J.L.; Macdonald, M.L.; Bustamante, A. Identifying acid lakes and associated rock exposure in glacial retreat zones in the Peruvian Andes using Landsat 8 imagery. Environ. Monit. Assess. 2025, 197, 532. [Google Scholar] [CrossRef] [PubMed]
  24. Li, X.; Wang, N.; Ding, Y.; Hawkings, J.R.; Yde, J.C.; Raiswell, R.; Liu, J.; Zhang, S.; Kang, S.; Wang, R.; et al. Globally elevated chemical weathering rates beneath glaciers. Nat. Commun. 2022, 13, 407. [Google Scholar] [CrossRef] [PubMed]
  25. Greinwald, K.; Musso, A.; Scherer-Lorenzen, M.; Weiler, M.; Egli, M. The development of nutrient pools along two holocene chronosequences with contrasting bedrocks in the Swiss Alps. Catena 2023, 233, 107507. [Google Scholar] [CrossRef]
  26. Kabala, C.; Zapart, J. Initial soil development and carbon accumulation on moraines of the rapidly retreating Werenskiold Glacier, SW Spitsbergen, Svalbard archipelago. Geoderma 2012, 175–176, 9–20. [Google Scholar] [CrossRef]
  27. Mavris, C.; Egli, M.; Plötze, M.; Blum, J.D.; Mirabella, A.; Giaccai, D.; Haeberli, W. Initial stages of weathering and soil formation in the Morteratsch proglacial area (Upper Engadine, Switzerland). Geoderma 2010, 155, 359–371. [Google Scholar] [CrossRef]
  28. Dümig, A.; Smittenberg, R.; Kögel-Knabner, I. Concurrent evolution of organic and mineral components during initial soil development after retreat of the Damma glacier, Switzerland. Geoderma 2011, 163, 83–94. [Google Scholar] [CrossRef]
  29. Bernasconi, S.M.; Bauder, A.; Bourdon, B.; Brunner, I.; Bünemann, E.; Chris, I.; Derungs, N.; Edwards, P.; Farinotti, D.; Frey, B.; et al. Chemical and biological gradients along the Damma glacier soil chronosequence, Switzerland. Vadose Zone J. 2011, 10, 867–883. [Google Scholar] [CrossRef]
  30. Charles, C.; Khelidj, N.; Mottet, L.; Tu, B.N.; Adatte, T.; Bomou, B.; Faria, M.; Monbaron, L.; Reubi, O.; de Vere, N.; et al. Plant–soil interactions underline the development of novel ecosystems after glacier retreat. EGUsphere 2024, 2024, 1–24. [Google Scholar] [CrossRef]
  31. Egli, M.; Wernli, M.; Kneisel, C.; Haeberli, W. Melting glaciers and soil development in the proglacial area Morteratsch (Swiss Alps): I. Soil type chronosequence. Arct. Antarct. Alp. Res. 2006, 38, 499–509. [Google Scholar] [CrossRef]
  32. Kim, Y.J.; Laffly, D.; Kim, S.E.; Nilsen, L.; Chi, J.; Nam, S.; Lee, Y.B.; Jeong, S.; Mishra, U.; Lee, Y.K.; et al. Chronological changes in soil biogeochemical properties of the glacier foreland of Midtre Lovénbreen, Svalbard, attributed to soil-forming factors. Geoderma 2022, 415, 115777. [Google Scholar] [CrossRef]
  33. Navas, A.; Laute, K.; Beylich, A.A.; Gaspar, L. Variations of soil profile characteristics due to varying time spans since ice retreat in the inner Nordfjord, western Norway. Solid Earth 2014, 5, 485–498. [Google Scholar] [CrossRef]
  34. Wietrzyk, P.; Rola, K.; Osyczka, P.; Nicia, P.; Szymański, W.; Węgrzyn, M. The relationships between soil chemical properties and vegetation succession in the aspect of changes of distance from the glacier forehead and time elapsed after glacier retreat in the Irenebreen foreland (NW Svalbard). Plant Soil 2018, 428, 195–211. [Google Scholar] [CrossRef]
  35. Huang, Y.; Shi, W.; Fu, Q.; Qiu, Y.; Zhao, J.; Li, J.; Lyu, Q.; Yang, X.; Xiong, J.; Wang, W.; et al. Soil development following glacier retreat shapes metagenomic and metabolomic functioning associated with asynchronous C and N accumulation. Sci. Total Environ. 2023, 892, 164405. [Google Scholar] [CrossRef] [PubMed]
  36. Zhou, J.; Wu, Y.; Prietzel, J.; Bing, H.; Yu, D.; Sun, S.; Luo, J.; Sun, H. Changes of soil phosphorus speciation along a 120-year soil chronosequence in the Hailuogou Glacier retreat area (Gongga Mountain, SW China). Geoderma 2013, 195–196, 251–259. [Google Scholar] [CrossRef]
  37. Bojko, O.; Kabala, C. Transformation of physicochemical soil properties along a mountain slope due to land management and climate changes—A case study from the Karkonosze Mountains, SW Poland. Catena 2016, 140, 43–54. [Google Scholar] [CrossRef]
  38. Majeed, Z.; Mukhtar, M.A.; Bhat, N.A.; Misra, R.; Qureshi, A.A. Hydro-chemical characteristics of melt water draining from glaciers of Rongdo Basin, Shyok Valley, Ladakh. J. Geol. Soc. India 2023, 99, 459–465. [Google Scholar] [CrossRef]
  39. Shrestha, S.; Bhandari, R.; Bashyal, A.; Shrestha, N. A Comparative study of physico-chemical parameter in glacial melt water, Ponkar Glacier, Nepal. OALib 2021, 8, e7160. [Google Scholar] [CrossRef]
  40. Lizaga, I.; Gaspar, L.; Quijano, L.; Dercon, G.; Navas, A. NDVI, 137Cs and nutrients for tracking soil and vegetation development on glacial landforms in the Lake Parón Catchment (Cordillera Blanca, Perú). Sci. Total Environ. 2019, 651, 250–260. [Google Scholar] [CrossRef] [PubMed]
  41. Zimmer, A.; Beach, T.; Luzzadder-Beach, S.; Rabatel, A.; Lopez-Robles, J.; Cruz-Encarnación, R.; Temme, A.J.A.M. Physico-chemical properties and toxicity of young proglacial soils in the Tropical Andes and Alps. CATENA 2024, 237, 107748. [Google Scholar] [CrossRef]
  42. Zimmer, A.; Beach, T.; Luzzadder-Beach, S.; Rabatel, A.; Cruz-Encarnación, R.; Lopez-Robles, J.; Jara-Tarazona, E.; Temme, A.J.A.M. Soil temperature and local initial conditions drive carbon and nitrogen build-up in young proglacial soils in the Tropical Andes and European Alps. CATENA 2024, 235, 107645. [Google Scholar] [CrossRef]
  43. Chira, J.; Vargas, L.; Castañeda, D.; Agurto, A.; Trelles, G.; Mogrovejo, M.; Quispe, L.; Villarreal, E. Surface water quality and geogenic process in the Quillcayhuanca and Shallap streams, Huaraz-Peru. Int. J. Hydrol. 2022, 6, 119–125. [Google Scholar] [CrossRef]
  44. Grande, J.A.; Loayza-Muro, R.; Alonso-Chaves, F.M.; Fortes, J.C.; Willems, B.; Sarmiento, A.M.; Santisteban, M.; Dávila, J.M.; de la Torre, M.L.; Durães, N.; et al. The Negro River (Ancash-Peru): A unique case of water pollution, three environmental scenarios and an unresolved issue. Sci. Total Environ. 2019, 648, 398–407. [Google Scholar] [CrossRef] [PubMed]
  45. Vilímek, V.; Mark, B.; Emmer, A. Geoenvironmental Changes in the Cordillera Blanca, Peru; Springer: Berlin/Heidelberg, Germany, 2024; ISBN 9783031582448. [Google Scholar]
  46. Narro, R.A.; Eyles, C.H.; Lee, R.E.; Dàvila-Röller, L.; Maclachlan, J.C. Landsystem analysis of a tropical moraine-dammed supraglacial lake, Llaca Lake, Cordillera Blanca, Perú. Boreas 2023, 52, 272–293. [Google Scholar] [CrossRef]
  47. Castillo-Vergara, F.; Loarte, E.; Medina, K.; Rodriguez-Venturo, S.; Tuya, E. Spatiotemporal variation of glacier dynamics and its relationship with changes in high mountain ecosystems in the Cordillera Blanca, Peru. Rev. Teledetec. 2025, 66, e22235. [Google Scholar] [CrossRef]
  48. ANA. Retroceso Glaciar en la Cordillera Blanca 1948–2018; Ministerio de Desarrollo Agrario y Riego: Huaraz, Peru, 2019.
  49. ANA. Retroceso Glaciar en el Perú 1948–2019, Impactos en el Recurso Hídrico; Ministerio de Desarrollo Agrario y Riego: Lima, Peru, 2020.
  50. INAIGEM Geoportal del INAIGEM [Mapa Interactivo]. Available online: https://www.arcgis.com/apps/webappviewer/index.html?id=5379ac94516a4cb0a7f1cd0fa7bfc94b (accessed on 23 January 2026).
  51. Bisset, R.R.; Nienow, P.W.; Goldberg, D.N.; Wigmore, O.; Loayza-Muro, R.A.; Wadham, J.L.; Macdonald, M.L.; Bingham, R.G. Using thermal UAV imagery to model distributed debris thicknesses and sub-debris melt rates on debris-covered glaciers. J. Glaciol. 2023, 69, 981–996. [Google Scholar] [CrossRef]
  52. Wigmore, O.; Mark, B. Monitoring tropical debris-covered glacier dynamics from high-resolution unmanned aerial vehicle photogrammetry, Cordillera Blanca, Peru. Cryosphere 2017, 11, 2463–2480. [Google Scholar] [CrossRef]
  53. INGEMMET. Carta Geológica Nacional. Available online: https://portal.ingemmet.gob.pe/web/guest/carta-geologica-nacional (accessed on 7 July 2026).
  54. INGEMMET. Geología de los Cuadrángulos de Huari (Hojas 19i1, 19i2, 19i3, 19i4) y Singa (Hojas 19j3, 19j4)-[Boletín L 56]; INGEMMET: Lima, Peru, 2024.
  55. INGEMMET. Geología de los Cuadrángulos de Recuay (Hojas 20i1 y 20i4) y La Unión (Hojas 20j1, 20j2, 20j3 y 20j4)-[Boletín L 69]; INGEMMET: Lima, Peru, 2025.
  56. Anthelme, F.; Carrasquer, I.; Ceballos, J.L.; Peyre, G. Novel plant communities after glacial retreat in Colombia: (many) losses and (few) gains. Alp. Bot. 2022, 132, 211–222. [Google Scholar] [CrossRef]
  57. ANA. Protocolo Nacional para el Monitoreo de la Calidad de los Recursos Hídricos Superficiales; Ministerio de Agricultura y Riego: Lima, Peru, 2016.
  58. US EPA. Guidance for Data Quality Assessment; QA00 Versi.; U.S. Environmental Protection Agency: Washington, DC, USA, 2000.
  59. Hites, R.A. Correcting for censored environmental measurements. Environ. Sci. Technol. 2019, 53, 11059–11060. [Google Scholar] [CrossRef] [PubMed]
  60. SEMARNAT. NOM-021-SEMARNAT-2000; Que Establece Las Especificaciones de Fertilidad, Salinidad y Clasificación de Suelos. Estudios, Muestreo y Análisis; Secretaría de Medio Ambiente y Recursos Naturales: Mexico City, Mexico, 2002.
  61. APHA. Standard Methods for the Examination of Water and Wastewater, 24th ed.; Lipps, W.C., Braun-Howland, E.B., Baxter, T.E., Eds.; APHA Press: Washington, DC, USA, 2023; ISBN 978-0-87553-299-8. [Google Scholar]
  62. INACAL. NTP 339.128:1999 (Revisión 2019)—Método Para Análisis Granulométrico; Instituto Nacional de Calidad: Lima, Peru, 2019. [Google Scholar]
  63. US EPA EPA. Method 300.0; Determination of Inorganic Anions by Ion Chromatography, Revision 2.1; U.S. Environmental Protection Agency: Cincinnati, OH, USA, 1993.
  64. US EPA EPA. Method 3050B; Acid Digestion of Sediments, Sludges, and Soils; Environmental Protection Agency: Washington, DC, USA, 1996.
  65. US EPA EPA. Method 6010D; Inductively Coupled Plasma–Optical Emission Spectrometry, Revision 5; U.S. Environmental Protection Agency: Washington, DC, USA, 2018.
  66. US EPA EPA. Method 200.8; Determination of Trace Elements in Waters and Wastes by Inductively Coupled Plasma–Mass Spectrometry, Revision 5.4; U.S. Environmental Protection Agency: Cincinnati, OH, USA, 1994.
  67. Zimmer, A.; Meneses, R.I.; Rabatel, A.; Soruco, A.; Dangles, O.; Anthelme, F. Time lag between glacial retreat and upward migration alters tropical alpine communities. Perspect. Plant Ecol. Evol. Syst. 2018, 30, 89–102. [Google Scholar] [CrossRef]
  68. Kowalska, J.B.; Nicia, P.; Gąsiorek, M.; Zadrożny, P.; Węgrzyn, M.H.; Waroszewski, J. Are natural or anthropogenic factors influencing potentially toxic elements’ enrichment in soils in proglacial zones? An example from Kaffiøyra (Oscar II Land, Spitsbergen). Int. J. Environ. Res. Public Health 2022, 19, 13703. [Google Scholar] [CrossRef] [PubMed]
  69. Anthelme, F.; Cavieres, L.A.; Dangles, O. Facilitation among plants in alpine environments in the face of climate change. Front. Plant Sci. 2014, 5, 16. [Google Scholar] [CrossRef] [PubMed]
  70. Schweizer, S.A.; Hoeschen, C.; Schlüter, S.; Kögel-Knabner, I.; Mueller, C.W. Rapid soil formation after glacial retreat shaped by spatial patterns of organic matter accrual in microaggregates. Glob. Change Biol. 2018, 24, 1637–1650. [Google Scholar] [CrossRef] [PubMed]
  71. Bini, C. Geology and Geomorphology. In World Soils Book Series; Springer: Berlin/Heidelberg, Germany, 2013; pp. 39–56. [Google Scholar]
  72. Zhu, Y.; Zhang, Y.; Chen, H.; Wang, Y.; Cao, F.; Sun, W.; Qi, X.; Zhao, Y.; Xu, F. Soil properties and microbial diversity at the frontier of Laohugou glacier retreat in Qilian Mountains. Curr. Microbiol. 2020, 77, 425–433. [Google Scholar] [CrossRef] [PubMed]
  73. Darcy, J.L.; Schmidt, S.K. Nutrient limitation of microbial phototrophs on a debris-covered glacier. Soil Biol. Biochem. 2016, 95, 156–163. [Google Scholar] [CrossRef]
  74. Choudhary, O.P.; Kharche, V.K. Soil Salinity and Sodicity. In Soil Science: An Introducction; Bio-Green Books: New Delhi, India, 2017; pp. 353–384. ISBN 8190379771. [Google Scholar]
  75. Ismayilov, A.I.; Mamedov, A.I.; Fujimaki, H.; Tsunekawa, A.; Levy, G.J. Soil salinity type effects on the relationship between the electrical conductivity and salt content for 1:5 soil-to-water extract. Sustainability 2021, 13, 3395. [Google Scholar] [CrossRef]
  76. Khedim, N.; Cécillon, L.; Poulenard, J.; Barré, P.; Baudin, F.; Marta, S.; Rabatel, A.; Dentant, C.; Cauvy-Fraunié, S.; Anthelme, F.; et al. Topsoil organic matter build-up in glacier forelands around the world. Glob. Change Biol. 2021, 27, 1662–1677. [Google Scholar] [CrossRef] [PubMed]
  77. INGEMMET. Geología de los Cuadrángulos de Mollebamba, Tayabamba, Huaylas, Pomabamba, Carhuaz y Huari (Hojas 17-h, 17-i, 18-h, 18-i, 19-h, 19-i)-[Boletín A 16]; Wilson, J., Reyes, L., Garayar, J., Eds.; Servicio de Geología y Minería: Lima, Peru, 1967; Volume 18.
  78. Cáceres-Bottia, A.; Mantilla-Figueroa, L.C.; Ríos-Reyes, C.A.; Pimiento-Rueda, R. General considerations on the genesis of Uranium and Vanadium occurrence in the Cretaceous sedimentary rocks of the Berlin Synclinal, Central Cordillera (Colombian Andes). Bol. Geol. 2023, 45, 3. [Google Scholar] [CrossRef]
  79. Rzepa, G.; Manecki, M.; Jakubski, G.; Kwaśniak-Kominek, M.; Czerny, J.; Górniak, D. Weathering in a regolith on the werenskioldbreen glacier forefield (Sw spitsbergen). 2. speciation of Fe, Mn, Pb, Cu and Zn in the chronosequence. Ann. Soc. Geol. Pol. 2019, 89, 317–341. [Google Scholar] [CrossRef]
  80. Bosson, J.B.; Huss, M.; Cauvy-Fraunié, S.; Clément, J.C.; Costes, G.; Fischer, M.; Poulenard, J.; Arthaud, F. Future emergence of new ecosystems caused by glacial retreat. Nature 2023, 620, 562–569. [Google Scholar] [CrossRef] [PubMed]
  81. Bravo-Zevallos, W.; Fernández-Jerí, Y.; Torres-Lázaro, J.C.; Zuñiga-Bardales, K. Assessment of human health risk indices due to metal contamination in the surface water of the Negro River Sub-Basin, Áncash. Int. J. Environ. Res. Public Health 2024, 21, 733. [Google Scholar] [CrossRef] [PubMed]
  82. Shen, Z.; Ye, L.; Zhang, J.; Ma, H.; Zhang, R. Major ions and trace metals in glacial meltwaters nearby Ny-Ålesund, Svalbard. Acta Oceanol. Sin. 2024, 43, 86–99. [Google Scholar] [CrossRef]
  83. Hartmann, A.; Weiler, M.; Blume, T. The impact of landscape evolution on soil physics: Evolution of soil physical and hydraulic properties along two chronosequences of proglacial moraines. Earth Syst. Sci. Data 2020, 12, 3189–3204. [Google Scholar] [CrossRef]
  84. Pesch, C.; Weber, P.L.; Moldrup, P.; de Jonge, L.W.; Arthur, E.; Greve, M.H. Physical characterization of glacial rock flours from fjord deposits in South Greenland–Toward soil amendment. Soil Sci. Soc. Am. J. 2022, 86, 407–422. [Google Scholar] [CrossRef]
  85. INAIGEM. Informe Técnico N° 03 Glaciar Llaca; Instituto Nacional de Investigación en Glaciares y Ecosistemas de Montaña: Huaraz, Peru, 2016.
  86. Colombo, N.; Bocchiola, D.; Martin, M.; Confortola, G.; Salerno, F.; Godone, D.; D’Amico, M.E.; Freppaz, M. High export of nitrogen and dissolved organic carbon from an Alpine glacier (Indren Glacier, NW Italian Alps). Aquat. Sci. 2019, 81, 74. [Google Scholar] [CrossRef]
  87. Łokas, E.; Zwoliński, Z.; Rachlewicz, G.; Gąsiorek, M.; Wilkosz, G.; Samolej, K. Distribution of anthropogenic and naturally occurring radionuclides in soils and lakes of Central Spitsbergen (Arctic). J. Radioanal. Nucl. Chem. 2017, 311, 707–717. [Google Scholar] [CrossRef]
  88. Evans, L.K.; Nishioka, J. Accumulation processes of trace metals into Arctic sea ice: Distribution of Fe, Mn and Cd associated with ice structure. Mar. Chem. 2019, 209, 36–47. [Google Scholar] [CrossRef]
  89. López-Moreno, J.I.; Valero-Garcés, B.; Mark, B.; Condom, T.; Revuelto, J.; Azorín-Molina, C.; Bazo, J.; Frugone, M.; Vicente-Serrano, S.M.; Alejo-Cochachin, J. Hydrological and depositional processes associated with recent glacier recession in Yanamarey catchment, Cordillera Blanca (Peru). Sci. Total Environ. 2017, 579, 272–282. [Google Scholar] [CrossRef] [PubMed]
  90. Bruno, D.; Belmar, O.; Maire, A.; Morel, A.; Dumont, B.; Datry, T. Structural and functional responses of invertebrate communities to climate change and flow regulation in alpine catchments. Glob. Change Biol. 2019, 25, 1612–1628. [Google Scholar] [CrossRef] [PubMed]
  91. Dold, B. Acid rock drainage prediction: A critical review. J. Geochem. Explor. 2017, 172, 120–132. [Google Scholar] [CrossRef]
  92. Santofimia, E.; López-Pamo, E.; Palomino, E.J.; González-Toril, E.; Aguilera, Á. Acid rock drainage in Nevado Pastoruri glacier area (Huascarán National Park, Perú): Hydrochemical and mineralogical characterization and associated environmental implications. Environ. Sci. Pollut. Res. 2017, 24, 25243–25259. [Google Scholar] [CrossRef] [PubMed]
  93. Czop, M.; Motyka, J.; Sracek, O.; Szuwarzyński, M. Geochemistry of the Hyperalkaline Gorka Pit Lake (pH > 13) in the Chrzanow Region, Southern Poland. Water Air Soil Pollut. 2011, 214, 423–434. [Google Scholar] [CrossRef]
  94. Zhi, W.; Ouyang, W.; Shen, C.; Li, L. Temperature outweighs light and flow as the predominant driver of dissolved oxygen in US rivers. Nat. Water 2023, 1, 249–260. [Google Scholar] [CrossRef]
  95. Wanner, C.; Moradi, H.; Ingold, P.; Cardenas Bocanegra, M.A.; Mercurio, R.; Furrer, G. Rock glaciers in the Central Eastern Alps—How permafrost degradation can cause acid rock drainage, mobilization of toxic elements and formation of basaluminite. Glob. Planet. Change 2023, 227, 104180. [Google Scholar] [CrossRef]
  96. Hampton, S.E.; Sharma, S.; Brousil, M.R.; Filazzola, A. Winter and summer storms modify chlorophyll relationships with nutrients in seasonally ice-covered lakes. Ecosphere 2022, 13, e4272. [Google Scholar] [CrossRef]
  97. Michelutti, N.; Tapia, P.M.; Labaj, A.L.; Grooms, C.; Wang, X.; Smol, J.P. A limnological assessment of the diverse waterscape in the Cordillera Vilcanota, Peruvian Andes. Inl. Waters 2019, 9, 395–407. [Google Scholar] [CrossRef]
  98. Webster-Brown, J.; Gall, M.; Gibson, J.; Wood, S.; Hawes, I. The biogeochemistry of meltwater habitats in the Darwin Glacier region (80°S), Victoria Land, Antarctica. Antarct. Sci. 2010, 22, 646–661. [Google Scholar] [CrossRef]
  99. Slemmons, K.E.H.; Saros, J.E.; Simon, K. The influence of glacial meltwater on alpine aquatic ecosystems: A review. Environ. Sci. Process. Impacts 2013, 15, 1794–1806. [Google Scholar] [CrossRef] [PubMed]
  100. Das, A.; Krishnaswami, S.; Bhattacharya, S.K. Carbon isotope ratio of dissolved inorganic carbon (DIC) in rivers draining the Deccan Traps, India: Sources of DIC and their magnitudes. Earth Planet. Sci. Lett. 2005, 236, 419–429. [Google Scholar] [CrossRef]
  101. Magnússon, R.; Cammeraat, E.; Lücke, A.; Jansen, B.; Zimmer, A.; Recharte, J. Influence of glacial sediments on the chemical quality of surface water in the Ulta valley, Cordillera Blanca, Peru. J. Hydrol. 2020, 587, 125027. [Google Scholar] [CrossRef]
  102. Palacios-Robles, E.; Medina, K.; Loarte, E.; Castañeda-Barreto, A.; Gamboa-Mendoza, M.; Polo-Salazar, R.; Tapia, P.; Pellicciotti, F.; Brown, L.E. Declining glacier cover drives changes in aquatic macroinvertebrate biodiversity in the Cordillera Blanca, Perú. Glob. Change Biol. 2024, 30, e17355. [Google Scholar] [CrossRef] [PubMed]
  103. Kanna, N.; Sugiyama, S.; Ohashi, Y.; Sakakibara, D.; Fukamachi, Y.; Nomura, D. Upwelling of Macronutrients and Dissolved Inorganic Carbon by a Subglacial Freshwater Driven Plume in Bowdoin Fjord, Northwestern Greenland. J. Geophys. Res. Biogeosci. 2018, 123, 1666–1682. [Google Scholar] [CrossRef]
  104. Andrews, M.G.; Jacobson, A.D.; Osburn, M.R.; Flynn, T.M. Dissolved carbon dynamics in meltwaters from the Russell Glacier, Greenland Ice Sheet. J. Geophys. Res. Biogeosci. 2018, 123, 2922–2940. [Google Scholar] [CrossRef]
  105. Ljungberg, W.; Yau, Y.Y.Y.; Cabral, A.; Majtényi-Hill, C.; Henriksson, L.; McKenzie, T.; Ruiz-Angulo, A.; Szymczycha, B.; Dittmar, T.; Ulber, I.; et al. Carbon outwelling and uptake along a Tidal Glacier-Lagoon-Ocean continuum. J. Geophys. Res. Biogeosci. 2024, 129, e2023JG007895. [Google Scholar] [CrossRef]
  106. Barker, J.D.; Sharp, M.J.; Fitzsimons, S.J.; Turner, R.J. Abundance and dynamics of dissolved organic carbon in glacier systems. Arct. Antarct. Alp. Res. 2006, 38, 163–172. [Google Scholar] [CrossRef]
  107. Bain, E. An Investigation of Acid Rock Drainage in Glacial Streams Through Multivariate Exploratory Analysis and the Biotic Ligand Model in the Cordillera Blanca, Peru. Master’s Thesis, Western Washington University, Bellingham, WA, USA, 2017. [Google Scholar]
  108. Sotomayor, G.; Alvarado, A.; Romero, J.; López, C.; Aguilar, M.; Forio, M.A.E.; Goethals, P.L.M. Limnological characteristics and relationships with primary productivity in two high andean hydroelectric reservoirs in Ecuador. Water 2024, 16, 2012. [Google Scholar] [CrossRef]
  109. Jacobsen, D.; Dangles, O. Ecology of High Altitude Waters; Oxford University Press: Oxford, UK, 2017; ISBN 9780198736868. [Google Scholar]
  110. Wang, B.; Ma, L.; Qian, J.; Fang, Y.; Xie, W.; Ding, D.; Long, Y.; Zhou, H. Geochemical and isotopic fingerprint-based identification of sulfate source regional characteristics and evolution of groundwater impacted by Acid Mine Drainage (AMD) from a nonferrous metal mining area. Environ. Sci. Technol. 2025, 59, 27598–27609. [Google Scholar] [CrossRef] [PubMed]
  111. Su, H.; Liu, Y.; Yang, J.; Liu, M.; Dai, H.; Wu, Y.; Ye, M.; Zhao, M.; Zhang, F. Unraveling spatiotemporal variability of water geochemistry and sulfate sources in a multi-tributary river system. J. Hydrol. 2025, 662, 134073. [Google Scholar] [CrossRef]
  112. Dogramaci, S.; McLean, L.; Skrzypek, G. Hydrochemical and stable isotope indicators of pyrite oxidation in carbonate-rich environment; the Hamersley Basin, Western Australia. J. Hydrol. 2017, 545, 288–298. [Google Scholar] [CrossRef]
  113. Domine, F. The Chemical Composition of Snow and Glacial Ice. In Chemistry in the Cryosphere; Wordl Scientific: Singapore, 2022; pp. 57–138. [Google Scholar]
  114. Santachiara, G.; Belosi, F.; Nicosia, A.; Prodi, F. Surface snow, firn and ice core composition in polar areas in relation to atmospheric aerosol and gas concentrations: Critical aspects. Atmos. Clim. Sci. 2016, 06, 89–102. [Google Scholar] [CrossRef]
  115. Beard, D.B.; Clason, C.C.; Rangecroft, S.; Poniecka, E.; Ward, K.J.; Blake, W.H. Anthropogenic contaminants in glacial environments I: Inputs and accumulation. Prog. Phys. Geogr. Earth Environ. 2022, 46, 630–648. [Google Scholar] [CrossRef]
  116. Mark, B.G.; French, A.; Baraer, M.; Carey, M.; Bury, J.; Young, K.R.; Polk, M.H.; Wigmore, O.; Lagos, P.; Crumley, R.; et al. Glacier loss and hydro-social risks in the Peruvian Andes. Glob. Planet. Change 2017, 159, 61–76. [Google Scholar] [CrossRef]
  117. Rawat, B.; Zhang, Q.; Sharma, C.M.; Tripathee, L.; Pandey, A.; Kandel, K.; Sun, X.; Li, M.; Li, S.; Kang, S. Glacial record of trace metal pollution over the Central Himalayas and its surroundings: Distribution, variation, and anthropogenic signals. Atmos. Res. 2021, 251, 105428. [Google Scholar] [CrossRef]
  118. Vilanova, I.; Moreno, P.I.; Miranda, C.G.; Villa-Martínez, R.P. The last glacial termination in the Coyhaique sector of central Patagonia. Quat. Sci. Rev. 2019, 224, 105976. [Google Scholar] [CrossRef]
  119. INAIGEM. Evaluación de la Concentración de Metales en el Agua Superficial de la Unidad Hidrográfica (UH) Río Negro; INAIGEM: Huaraz, Peru, 2025.
  120. Flores, R. Efecto del Cambio Climático en la Oferta de Agua en la Unidad Hidrográfica Yanayacu para la Gestión del Recurso Hídrico, Áncash, Perú; Universidad Nacional Mayor de San Marcos: Lima, Peru, 2023. [Google Scholar]
Figure 1. Location of the Llaca and Gueshgue glaciers and soil and water sampling points in the glacier retreat areas. Glacier boundaries were delineated following the methodology described by Castillo-Vergara et al. [47]. Satellite imagery corresponds to PlanetScope imagery acquired in December 2024 and provided through the Planet Education and Research Program.
Environments 13 00423 g001
Figure 2. Boxplots showing the distribution and between-area comparison of selected common quantifiable soil physicochemical properties in Llaca and Gueshgue. Individual observations, medians, interquartile ranges, and data dispersion are shown. Gray corresponds to the Llaca glacier retreat area and blue to Gueshgue. The p-values indicate the statistical significance of the corresponding Student’s t-test or Mann–Whitney U test.
Environments 13 00423 g002
Figure 3. Principal Component Analysis (PCA) of soil physicochemical properties in the study areas. (a) Score plot (biplot) showing the distribution of Llaca and Gueshgue samples; (b) correlation circle of the environmental variables and their quality of representation (cos2) in the component space.
Environments 13 00423 g003
Figure 4. Hierarchical clustering dendrogram of soil samples from Llaca and Gueshgue. Background shading highlights the three main groups identified at the selected dissimilarity level. Llaca samples form a distinct group, whereas Gueshgue samples are subdivided into two internal groups that are consistent with the contrasting lithological setting of the area: a sector associated with the Cordillera Blanca Batholith and a sector influenced by the Chicama Group–Tinajones Formation.
Environments 13 00423 g004
Figure 5. Spearman correlation heatmap with hierarchical clustering of soil physicochemical properties. Colors indicate the strength and direction of the correlations, and asterisks (*) denote statistically significant relationships. The dendrogram groups variables according to similarities in their correlation patterns and is used as an exploratory visualization of covariation.
Environments 13 00423 g005
Figure 6. Boxplots showing the distribution and between-area comparison of selected common quantifiable water physicochemical properties in Llaca and Gueshgue. Individual observations, medians, interquartile ranges, and data dispersion are shown. Gray corresponds to the Llaca glacier retreat area and blue to Gueshgue. The p-values indicate the statistical significance of the corresponding Student’s t-test or Mann–Whitney U test.
Environments 13 00423 g006
Figure 7. Principal Component Analysis (PCA) of water physicochemical properties in the study areas. (a) Score plot (biplot) showing the distribution of Llaca and Gueshgue samples; (b) correlation circle of the environmental variables and their quality of representation (cos2) in the component space.
Environments 13 00423 g007
Figure 8. Hierarchical clustering dendrogram of water samples from Llaca and Gueshgue. Background shading highlights the four main groups identified at the selected dissimilarity level. Samples from each study area form separate broad clusters, with additional within-area subdivisions that are consistent with differences in lake stability, hydrological connectivity, and glacier/sediment influence.
Environments 13 00423 g008
Figure 9. Spearman correlation heatmap with hierarchical clustering of water physicochemical properties. Colors indicate the strength and direction of the correlations, and asterisks (*) denote statistically significant relationships. The dendrogram groups variables according to similarities in their correlation patterns and is used as an exploratory visualization of covariation.
Environments 13 00423 g009
Table 2. Descriptive summary statistics, including the mean, standard deviation (SD), minimum (min.), maximum (max.), and coefficient of variation (CV), for the physicochemical properties of 18 soil samples collected from the recently deglaciated areas of Llaca and Gueshgue. N.S. < LOQ: number of samples below limit of quantification.
Soil PropertiesLOQUnitLlacaGueshgueN.S. < LOQ
MeanSD (σ)MinMaxCV (%)MeanSD (σ)MinMaxCV (%)
Altitude-m a.s.l.449017447445280.37474025469747860.53-
SField-°14.5313.411.0032.8092.2614.2611.670.6034.2581.80-
T5cm-°C14.422.4511.1018.1016.966.534.350.1013.7066.54-
pHw-pH units6.960.156.647.092.166.531.233.347.2618.78-
EC-µS/cm501.33163.1128484832.54772.22372.26338148148.21-
h0.10%10.565.932.6223.1256.189.403.514.3416.8037.30-
ρb-g/cm31.520.121.361.707.681.670.291.282.1817.20-
TKN0.05%<LOQ-<LOQ<LOQ-<LOQ-<LOQ<LOQ-18
OM0.22%--<LOQ2.10---<LOQ1.00-15
Texture and granulometry
Material (<2.00 mm)-%85.18.7072.2698.2210.2367.1610.4844.7181.8615.60-
Material (>2.00 mm)-%14.98.701.7827.7458.4232.8410.4818.1455.2931.90-
Clay (<0.002 mm)-%0.431.270.013.81293.065.995.060.0115.4884.55-
Silt (0.002–0.05 mm)-%23.420.431.5467.5687.2936.8116.664.7968.5445.26-
Sand (0.05–2.00 mm)-%76.1820.7232.4498.4627.2057.2121.1215.9895.2136.91-
Textural class-%Loamy sand----Sandy loam-----
Inorganic anions
Chloride (Cl)0.70mg/kg2.441.390.985.2157.053.732.301.629.0361.65-
Fluoride (F)0.40mg/kg0.910.86<LOQ2.9494.020.900.56<LOQ1.7261.995
Nitrate (NO3)0.90mg/kg3.351.93<LOQ6.1457.778.6510.391.3130.47120.171
Nitrate-N (NO3-N)0.20mg/kg0.760.44<LOQ1.3957.931.952.340.306.88120.041
Nitrite (NO2)0.70mg/kg<LOQ-<LOQ<LOQ-<LOQ-<LOQ<LOQ-18
Nitrite-N (NO2-N)0.20mg/kg<LOQ-<LOQ<LOQ-<LOQ-<LOQ<LOQ-18
Phosphate (PO43−)0.60mg/kg1.862.10<LOQ6.63113.24<LOQ-<LOQ<LOQ-11
Phosphate-P (PO43−-P)0.20mg/kg0.610.68<LOQ2.16112.47<LOQ-<LOQ<LOQ-11
Sulfate (SO42−)0.70mg/kg15.218.506.4733.8655.87359.10442.0124.341313.50123.09-
Metals in higher concentrations
Aluminum (Al)4.7mg/kg3142.921509.5517755879.1048.0311,074.6432246679.8015,913.3029.11-
Calcium (Ca)8.0mg/kg713.22184.52479.50101925.871421.961321.48252.603537.3092.93-
Iron (Fe)0.8mg/kg4365.912473.552127.308966.1056.6616,963.444393.689255.3020,00025.90-
Potassium (K)11.7mg/kg1259.34749.13625.602718.7059.492422.17889.161255.903646.3036.71-
Magnesium (Mg)12.3mg/kg1061.28630.10512.802227.3059.373494.011034.652116.40514329.61-
Silica (SiO2)5.77mg/kg3270.65865.262228.944633.8726.464325.52737.762968.23500017.06-
Metals in moderate concentrations
Barium (Ba)0.77mg/kg13.717.486.7927.9354.5773.0046.6811.49145.0263.94-
Copper (Cu)0.23mg/kg1.120.610.401.9754.5425.3614.228.0046.1356.07-
Lithium (Li)1.0mg/kg18.1110.319.3036.7056.9516.293.5611.7023.1021.88-
Manganese (Mn)0.27mg/kg117.9460.7564.75232.4051.51164.5464.4588.22287.7939.17-
Sodium (Na)13mg/kg90.1439.3755.30179.0043.67197.8894.4581.30349.6047.73-
Phosphorus (P)1.0mg/kg258.1297.49148.20416.7037.77579.17190.93281.40869.6032.97-
Strontium (Sr)0.23mg/kg3.330.952.174.9628.5913.7010.643.2531.2777.68-
Titanium (Ti)0.1mg/kg286.96186.48124.40645.8064.99686.31398.79163.501240.3058.11-
Vanadium (V)0.17mg/kg5.793.862.2212.9166.6429.619.9618.1247.0833.63-
Zinc (Zn)0.77mg/kg23.3211.1613.8244.1047.8734.148.5924.7747.2925.15-
Metals in low concentrations
Arsenic (As)0.57mg/kg--<LOQ0.86-119.15111.611.15278.8193.677
Boron (B)0.67mg/kg--<LOQ0.79-<LOQ-<LOQ<LOQ-17
Beryllium (Be)0.07mg/kg--<LOQ0.09-0.190.10<LOQ0.3650.758
Cadmium (Cd)0.1mg/kg<LOQ-<LOQ<LOQ---<LOQ0.30-16
Cerium (Ce)1.0mg/kg2.271.391.105.8061.216.842.232.008.8032.52-
Cobalt (Co)0.17mg/kg0.780.480.331.6161.513.591.621.807.1144.97-
Chromium (Cr)0.17mg/kg0.420.27<LOQ0.9063.776.964.282.0312.8161.431
Tin (Sn)0.33mg/kg1.350.151.151.6410.890.870.300.551.4534.06-
Molybdenum (Mo)0.47mg/kg<LOQ-<LOQ<LOQ-2.782.39<LOQ6.3886.0311
Nickel (Ni)0.2mg/kg--<LOQ0.50-3.531.811.207.1051.265
Lead (Pb)0.27mg/kg1.670.890.643.5652.948.745.382.0315.9161.49-
Thorium (Th)0.67mg/kg0.820.58<LOQ1.7670.441.290.90<LOQ2.9469.676
Thallium (Tl)1.3mg/kg<LOQ-<LOQ<LOQ-2.631.620.654.8061.4011
Uranium (U)1.0mg/kg2.933.58<LOQ12.00122.15--<LOQ1.90-8
Tungsten (W)0.67mg/kg--<LOQ0.98---<LOQ1.86-12
Metals in undetectable concentrations in both deglaciated areas
Silver (Ag)0.2mg/kg----------18
Mercury (Hg)0.33mg/kg----------18
Antimony (Sb)0.73mg/kg----------18
Selenium (Se)1.3mg/kg----------18
Table 3. Descriptive summary statistics, including the mean, standard deviation (SD), minimum (min.), maximum (max.), and coefficient of variation (CV), for the physicochemical properties of 24 water samples collected from the recently deglaciated areas of Llaca and Gueshgue. N.S. < LOQ: number of samples below limit of quantification.
Water PropertiesLOQUnitLlacaGueshgueN.S. < LOQ
MeanSD (σ)MinMaxCV (%)MeanSD (σ)MinMaxCV (%)
Altitude-m a.s.l.449217447045250.39475539468248200.81-
T-°C4.172.201.009.1052.686.320.945.007.5014.89-
pH-pH units7.050.126.827.181.644.490.663.795.5414.70-
ORP-mV317.4125.87246.90338.508.15367.1168.29237.8047218.60-
EC-µS/cm17.083.03112317.73121.177.381101346.09-
TDS-ppm8.421.5151117.8860.503.6155675.97-
DO-mg/L6.781.144.668.9216.876.800.206.407.052.91-
Chl-a0.003mg/L<LOQ-<LOQ<LOQ-<LOQ-<LOQ<LOQ-24
TOC0.1mg/L0.260.120.200.6048.00--<LOQ0.10-10
IC0.1mg/L1.130.610.80353.890.270.050.200.3018.46-
Turbidity0.2NTU8.430.886.5010.4010.462.010.950.904.6047.31-
Inorganic anions
Chloride (Cl)0.050mg/L0.070.01<LOQ0.0822.230.180.040.100.2324.351
Fluoride (F)0.004mg/L0.1500.0240.1110.18916.050.0460.0210.0170.08246.07-
Phosphate (PO43−)0.037mg/L<LOQ-<LOQ<LOQ-<LOQ-<LOQ<LOQ-24
Phosphate-P (PO43−-P)0.012mg/L<LOQ-<LOQ<LOQ-<LOQ-<LOQ<LOQ-24
Nitrate (NO3)0.062mg/L0.6300.1330.2610.77021.130.3340.0830.2520.49124.98-
Nitrate-N (NO3-N)0.014mg/L0.1420.0300.0590.17421.130.0750.0190.0570.11124.98-
Nitrite (NO2)0.007mg/L<LOQ-<LOQ<LOQ-<LOQ-<LOQ<LOQ-24
Nitrite-N (NO2-N)0.002mg/L<LOQ-<LOQ<LOQ-<LOQ-<LOQ<LOQ-24
Sulfate (SO42−)0.03mg/L2.110.381.342.5317.8037.795.6929.2148.3315.06-
Metals in higher concentrations
Aluminum (Al)0.003mg/L2.2050.6980.5302.94831.641.2500.5100.4401.93040.80-
Calcium (Ca)0.09mg/L2.290.251.772.5610.767.362.464.4410.2833.42-
Iron (Fe)0.0013mg/L1.9820.7280.5743.02536.720.3170.2020.1310.80163.72-
Potassium (K)0.13mg/L1.780.470.852.4326.490.590.150.400.8325.95-
Magnesium (Mg)0.003mg/L0.7180.2280.2501.00631.774.8110.2984.4405.2986.19-
Silica (SiO2)0.27mg/L13.625.172.5420.5037.944.690.803.575.9817.09-
Silicon (Si)0.128mg/L6.3662.421.1879.5837.942.1930.3751.6682.79517.08-
Metals in moderate concentrations
Barium (Ba)0.0003mg/L0.01620.00600.00380.024536.890.01030.00110.00870.012211.01-
Copper (Cu)0.00009mg/L0.001490.000500.000740.0021633.750.005800.002120.003140.0095036.60-
Lithium (Li)0.0003mg/L0.01310.00450.00350.019634.240.00780.00150.00520.009619.71-
Manganese (Mn)0.00010mg/L0.06730.02410.02020.097435.870.28610.02370.24870.34308.29-
Sodium (Na)0.019mg/L0.8370.2420.2471.08528.880.5310.1200.3550.67222.63-
Strontium (Sr)0.0006mg/L0.01520.00260.00900.018217.050.03810.01320.02260.053034.51-
Titanium (Ti)0.0006mg/L0.08350.08410.00090.2457100.700.00900.00690.00080.018976.29-
Zinc (Zn)0.0026mg/L0.01440.00550.00130.020937.960.02130.00310.01360.026414.55-
Metals in low concentrations
Antimony (Sb)0.00013mg/L0.00050.00010.00030.000617.4<LOQ-<LOQ<LOQ-12
Arsenic (As)0.00010mg/L<LOQ-<LOQ<LOQ---<LOQ0.0017-18
Beryllium (Be)0.00006mg/L<LOQ-<LOQ<LOQ-0.000140.000030.000090.0001822.3412
Cadmium (Cd)0.00003mg/L<LOQ-<LOQ<LOQ-0.000300.000180.000160.0008660.6412
Cerium (Ce)0.00024mg/L0.001210.00048<LOQ0.0018540.230.000430.000100.000280.0006622.261
Cobalt (Co)0.00003mg/L0.000430.000160.000150.0006337.020.011790.003460.006690.0161329.36-
Chromium (Cr)0.0003mg/L--<LOQ0.0031---<LOQ0.0403-19
Cesium (Cs)0.0003mg/L0.00150.00050.00050.002235.77<LOQ-<LOQ<LOQ-12
Tin (Sn)0.00010mg/L--<LOQ0.00025---<LOQ0.00013-21
Gallium Ga)0.00012mg/L0.00140.00040.00040.001830.060.000200.000030.000160.0002616.19-
Molybdenum (Mo)0.00006mg/L0.00220.00060.00050.002727.08--<LOQ0.00081-6
Nickel (Ni)0.0006mg/L<LOQ-<LOQ<LOQ-0.01580.00390.00930.020124.7212
Lead (Pb)0.0006mg/L<LOQ-<LOQ<LOQ---<LOQ0.0007-23
Rubidium (Rb)0.0009mg/L0.01610.00510.00520.021531.610.00160.00050.00100.002331.01-
Uranium (U)0.000010mg/L0.00630.00190.00160.009929.790.00020.0002<LOQ0.0003575.783
Vanadium (V)0.0003mg/L<LOQ-<LOQ<LOQ---<LOQ0.0008-22
Ytterbium (Yb)0.00006mg/L--<LOQ0.00006---<LOQ0.00009-21
Metals in undetectable concentrations in both deglaciated areas
Bismuth (Bi)0.00003mg/L----------24
Boron (B)0.006mg/L----------24
Phosphorus (P)0.047mg/L----------24
Germanium (Ge)0.0006mg/L----------24
Hafnium (Hf)0.00015mg/L----------24
Lanthanum (La)0.0015mg/L----------24
Lutetium (Lu)0.00006mg/L----------24
Mercury (Hg)0.00009mg/L----------24
Niobium (Nb)0.0015mg/L----------24
Silver (Ag)0.000010mg/L----------24
Selenium (Se)0.0013mg/L----------24
Thallium (Tl)0.00006mg/L----------24
Tantalum (Ta)0.0021mg/L----------24
Tellurium (Te)0.003mg/L----------24
Thorium (Th)0.00019mg/L----------24
Tungsten (W)0.0006mg/L----------24
Zirconium (Zr)0.00045mg/L----------24
Disclaimer/Publisher’s Note: The statements, opinions and data contained in all publications are solely those of the individual author(s) and contributor(s) and not of MDPI and/or the editor(s). MDPI and/or the editor(s) disclaim responsibility for any injury to people or property resulting from any ideas, methods, instructions or products referred to in the content.