1. Introduction
Denitrifying bioreactors are subsurface, media-filled trenches designed to intercept agricultural drainage water at the edge of field before it enters nearby waterways [
1,
2]. Traditional bioreactors use woodchips as both a carbon source and a physical substrate for microbial habitat [
3,
4]. This biodegradable carbon provides the electrons required for the microbial reduction of nitrate (NO
3−) via nitrite (NO
2−), nitric oxide (NO), and nitrous oxide (N
2O) ideally to nitrogen gas (N
2), a process that is favored under saturated, anoxic conditions [
1]. In the absence of oxygen, microbes utilize nitrate as electron acceptor for anaerobic respiration, releasing nitrous oxide and/or nitrogen gas into the atmosphere and thereby achieving permanent nitrate removal from the water [
5]. However, the performance of woodchip-based bioreactors is often diminished under cold temperatures and high flow conditions—scenarios common during winter months in temperate climates or during storm-driven drainage events [
2,
5]. Low temperatures suppress microbial metabolic activity, while high flow rates reduce hydraulic residence times (HRTs), limiting the amount of time for nitrate reduction [
6,
7]. Enhancing bioreactor media composition presents an opportunity to improve nitrate removal efficiency across a broader range of environmental conditions [
2].
The use of alternative media types may enhance nitrate removal by retaining microbial electron donor (carbon) and acceptor (nitrate/nitrite) and increasing surface area for microbial attachment, leading to higher cell numbers and metabolic activity of denitrifying microbes [
8,
9]. Promising alternatives include biochar and various non-carbon-based materials [
6,
10]. Biochar, a highly stable and mostly recalcitrant carbonaceous material, is produced through the pyrolysis of organic matter [
10]. This process removes water and volatile compounds, resulting in a porous, chemically altered carbon material whose properties depend strongly on feedstock type and pyrolysis temperature [
10,
11]. Biochar made from different feedstocks has been shown to retain nitrate and organic matter through various surface sorption processes, potentially increasing nitrate and carbon availability for microbial respiration [
10,
11]. Non-carbon-based materials may serve as additional surfaces for microbial colonization, supporting the formation of structured communities of bacteria (biofilm) [
9]. However, the performance of these alternative media types varies depending on their physical, chemical, and hydraulic characteristics [
2]. Further research is needed to identify optimal media compositions and combinations that maximize nitrate removal efficiency under diverse environmental conditions.
Wood-based biochar (derived from hard or softwood) shows variable performance depending on several experimental factors. Generally, under long HRTs (>24 h), nitrate removal is moderate to high (~50–100%) [
12,
13]. When the HRT is reduced (8–12 h), nitrate removal efficiency declines to moderate levels (~40–50%) [
13,
14], likely due to a decreased contact time [
10]. In wood-based biochar systems under conditions of low-influent nitrate loading (<5 mg L
−1), removal efficiency can drop dramatically (~10%) [
15,
16]. It has also been demonstrated that the highest-influent nitrate concentration and lowest-influent flow rate produced the highest nitrate removal capacity (0.11 mg g
−1) [
17]. These studies demonstrate that HRT and influent nitrogen loading are key factors influencing the performance of wood-based biochar bioreactors, similar to woodchip-only systems.
Low temperatures can substantially reduce the removal of nitrate within denitrifying bioreactors. As of 2024, only four other published media-based, denitrifying bioreactor laboratory experiments used simulated agricultural drainage water and temperatures below 10 °C [
5,
18,
19,
20]. Some studies indicate a moderate negative correlation (r ≈ −0.5) between temperature and nitrate removal efficiency in wood-based biochar systems [
13]. In scenarios with low average temperatures (<10 °C), woodchip bioreactors have outperformed wood-based biochar bioreactors [
21], likely due to a reduction in microbial metabolism [
16]. These studies further demonstrate that low temperatures create challenges for nitrate removal in a variety of experimental situations and that more research in this area is greatly needed.
Limited studies have explored hybrid systems combining woodchips and wood-based biochar. However, even with high amendment rates (30–50% biochar by volume), nitrate removal remains low (<20%) [
22,
23]. This limited performance is likely due to the low carbon-to-nitrogen (C/N) ratio commonly associated with wood-based biochars, which can limit the amount of carbon available as an electron donor for the reduction process [
23]. Other research has shown only marginal improvements in nitrate removal under high loading conditions when wood-based biochar is added to woodchip systems [
24]. These findings suggest that biochar characteristics—particularly feedstock type—are critical to bioreactor performance and that wood-based biochar may have limited effectiveness for nitrate removal.
The method of biochar production plays a critical role in determining its final characteristics, which can either enhance or inhibit microbial denitrification. Some studies on both wood-based and nutshell-derived biochars have shown that higher pyrolysis temperatures (>750 °C) improve nitrate removal due to the development of a more crystalline structure and rougher surface texture [
17], as well as the enhanced formation of stable aromatic structures [
11]. Conversely, several studies indicate that wood-based biochars produced at lower pyrolysis temperatures (300–500 °C) retain higher fractions of labile carbon, volatile matter, and oxygenated functional groups, which may enhance microbial activity and favor denitrification under suitable conditions [
10,
25,
26]. Thus, pyrolysis temperature must be carefully selected to align with the intended function of the biochar in nitrate removal systems.
Some studies have investigated alternative, non-carbon-based forms of media for enhancing microbial denitrification. For example, Feyereisen et al. [
27] tested a two-stage bioreactor system using corncobs followed by a chamber containing a plastic biofilm carrier. They observed a slight increase (~10%) in nitrate removal, which was statistically significant at moderate temperatures (15 °C) but not at lower temperatures (1.5 °C). In a green roof tray experiment, Beck et al. [
28] evaluated a media blend consisting of 70% shell-based biochar and 30% tire-derived biochar, achieving a high level (~80%) reduction in nitrate leaching from rainfall runoff. While the tire-derived biochar may have contributed to improved structural properties, its effects were not tested independently of the shell-based component. Additionally, studies on the mineral zeolite have shown high nitrate removal efficiencies (>90%) comparable to wood-based biochar and high-density polyethylene (HDPE) plastic after an initial acclimation period (~6 days), likely due to its high surface area, porosity, and surface roughness that support microbial colonization [
29]. These findings suggest that non-carbon-based media and hybrid media combinations hold promise for enhancing nitrate removal in bioreactor systems.
Attempts have been made to improve the performance of both wood-based and biochar-based bioreactors to better accommodate low temperature and high flow conditions. Some studies have explored the use of electrostimulation to supply additional electrons to denitrifying bacteria [
30,
31]. Electrostimulation has been shown to moderately increase denitrification (~+10–25%) in wood-based bioreactors [
31] but is less effective when applied to walnut-shell biochar systems [
30]. Moreover, the implementation of electrostimulation introduces additional costs and logistical challenges, limiting its feasibility for real-world applications. Another approach to enhance bioreactor performance is carbon supplementation. Roser et al. [
20] showed an order of magnitude increase in denitrification due to continuous acetate dosing, as it provides an immediate and readily utilizable electron donor and carbon source for denitrifying microorganisms under low-temperature conditions. This supplementation has the effect of increasing microbial activity [
20]. However, continuous dosing may pose logistical challenges and incur additional costs in field settings. Therefore, alternative strategies for improving bioreactor performance warrant further investigation.
This study investigates the effectiveness of a multimedia denitrifying bioreactor over a wide range of temperatures. Nitrogen load removed and nitrate removal rates were determined by coupling measured data with a mass balance model that represents non-ideal bioreactor hydraulics using a plug flow segment followed by continuous stirred-tank reactors in series (CSTRs), as developed by Han et al. [
32]. In this previous study, the model was used to determine experimental bioreactor HRTs and other flow parameters using a conservative tracer (bromide) outflow curve. Furthermore, variation in microbial abundance was incorporated into the modeling framework using total bacterial 16S rRNA gene copy numbers as a scaling factor to represent relative change in overall microbial biomass [
33]. The model was used to calculate percent nitrate removal and nitrogen removal rates (g N m
−3 d
−1) by fitting predicted effluent nitrate concentrations to measured data through optimization of the decay coefficient (κd) using Excel Solver™, minimizing the sum of squared errors (SSE). This approach accounts for hydraulic residence time lags and computes nitrate removal on a time-step basis under variable influent concentrations.
The media selected for this study were chosen to test whether combining complementary physical and chemical properties could improve nitrate removal under challenging environmental conditions. Hardwood woodchips served as the primary degradable carbon source and are representative of conventional denitrifying bioreactor media. Walnut-shell biochar was selected because previous studies have demonstrated that biochar can provide additional pore space, sorption capacity, and microbial attachment surfaces while potentially retaining nitrate and dissolved organic carbon within the treatment matrix. Brotex, a porous PET fiber matrix originally developed for floating treatment wetlands, was selected to provide additional microbial colonization surfaces without substantially reducing hydraulic conductivity. It was hypothesized that combining these materials would enhance microbial activity and nitrate removal relative to a woodchip–biochar mixture and woodchip-only bioreactors from the literature tested under similar HRTs and temperatures.
2. Materials and Methods
The experimental system consisted of the reduced-temperature mesoscale bioreactors previously described by Han et al. [
32], Hackshaw [
33], and Krider [
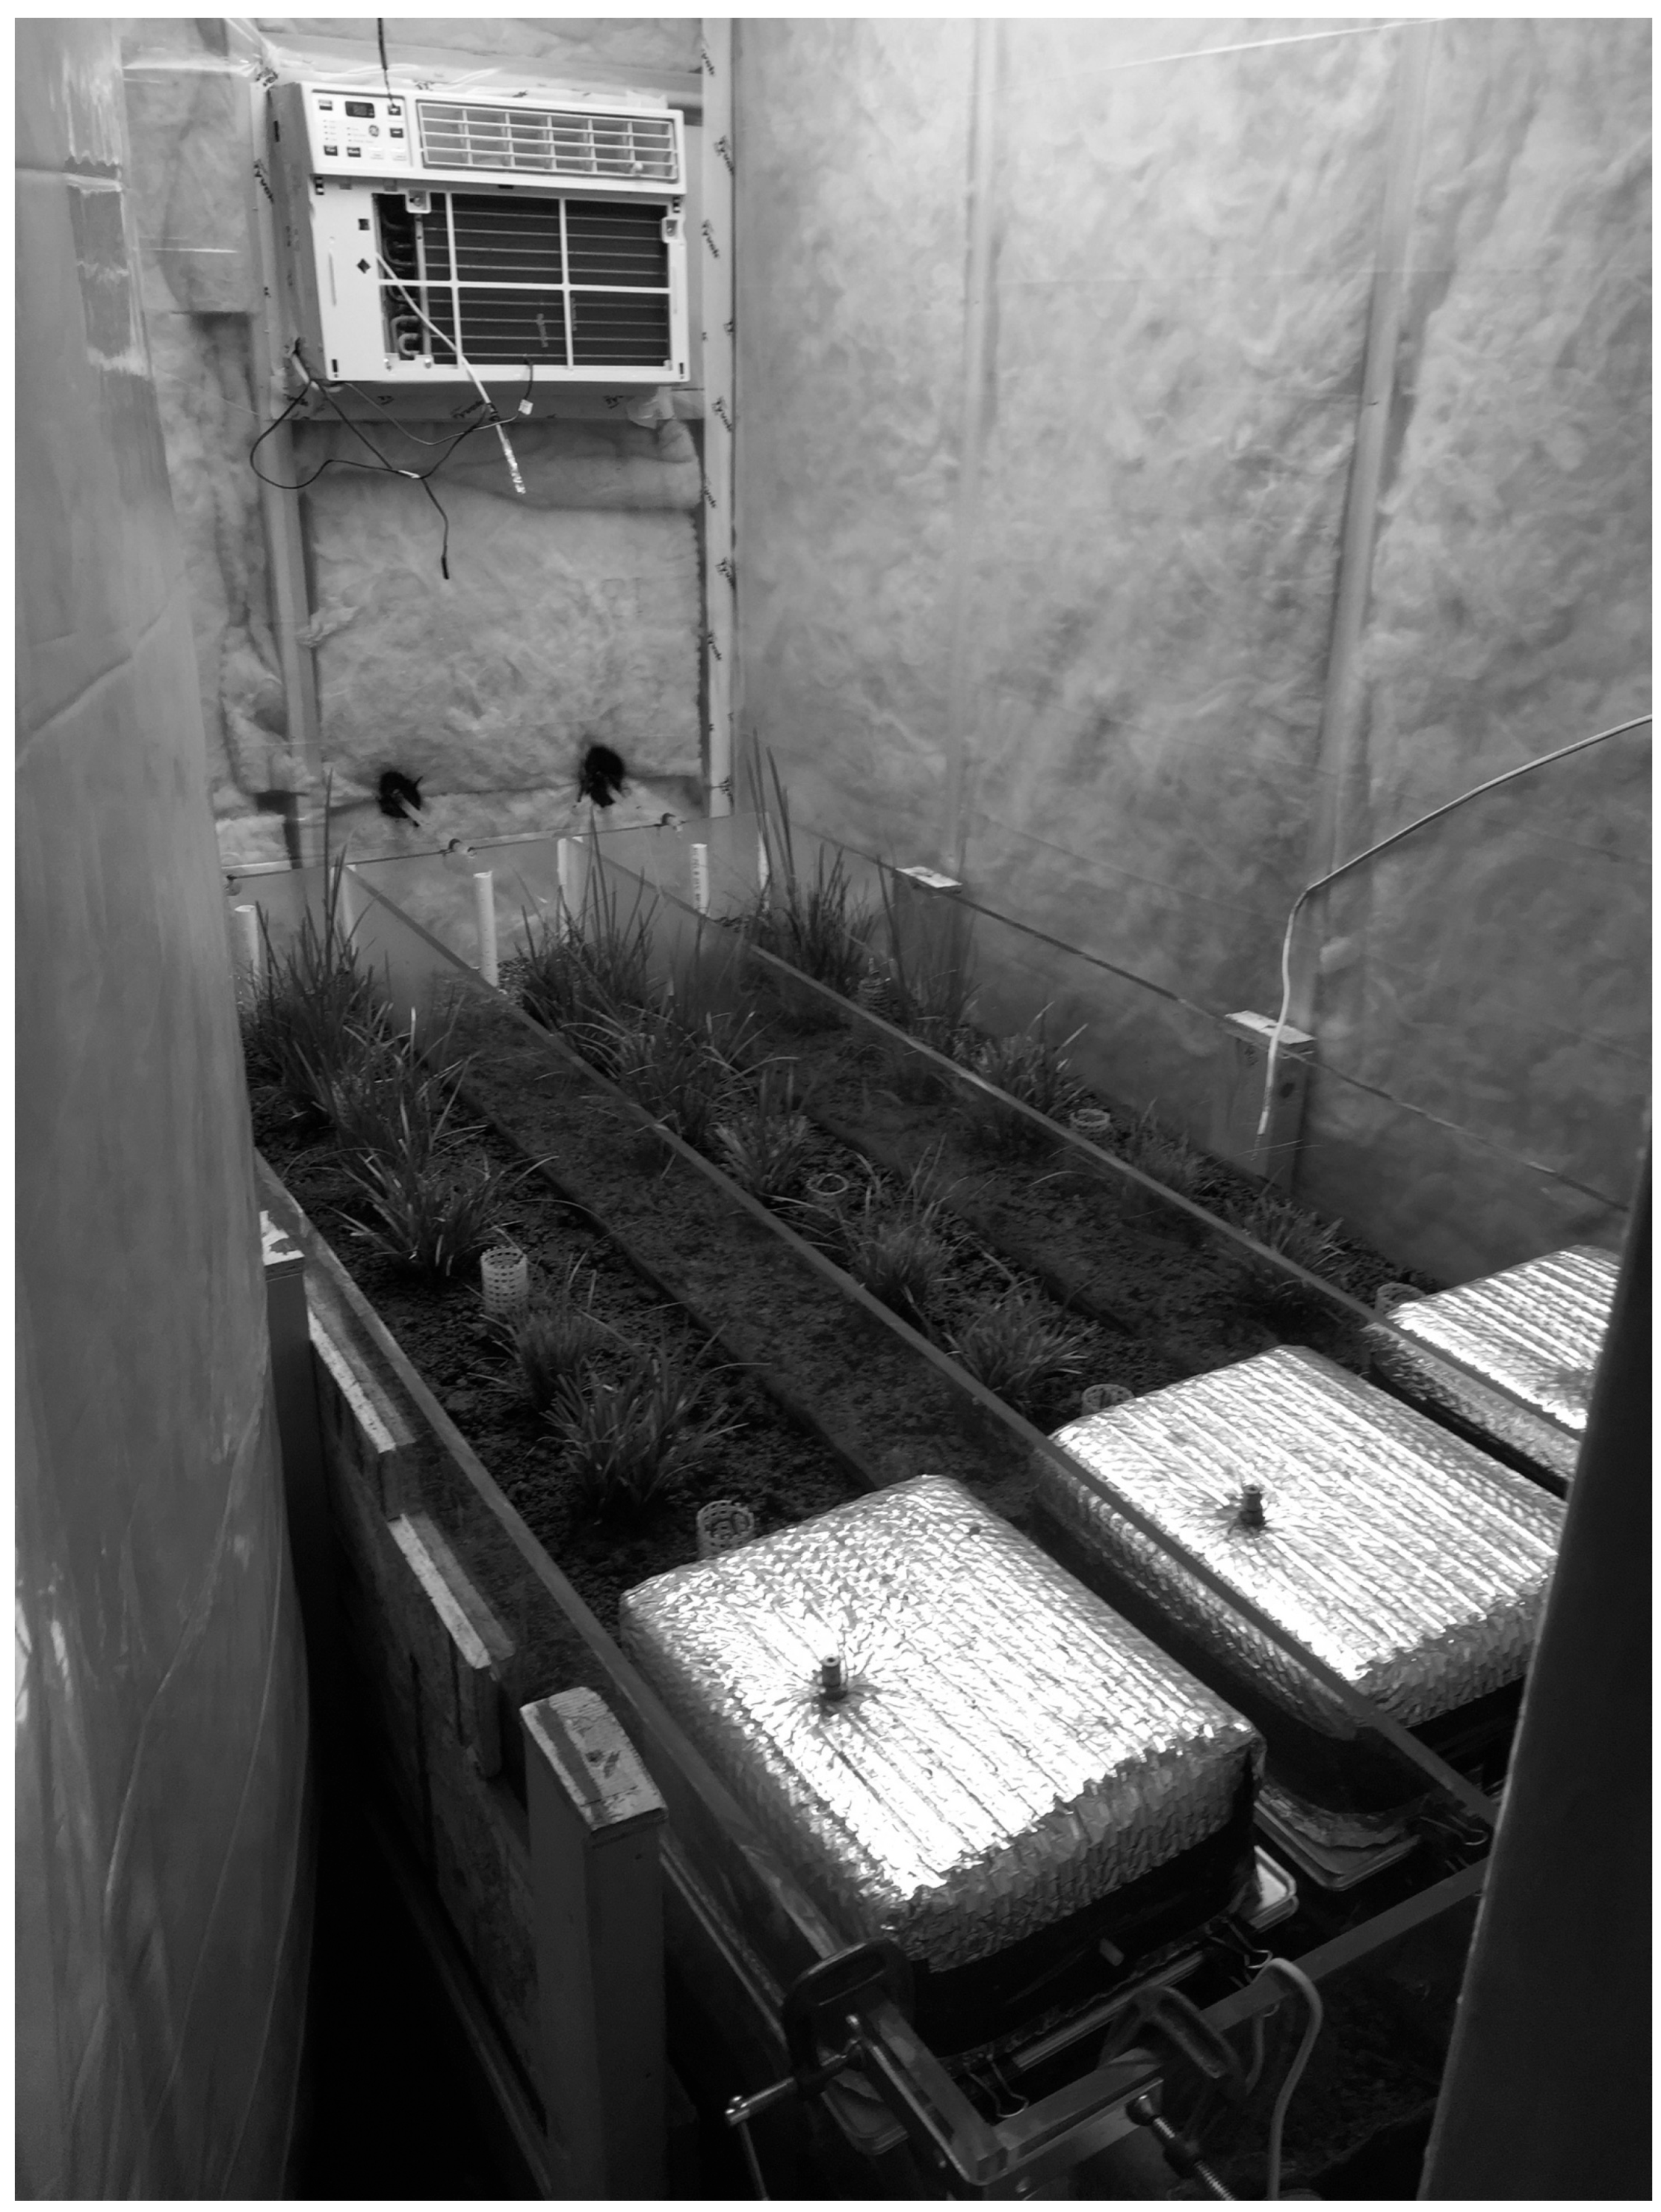
34]. This testing apparatus used temperature control chambers to simulate springtime air and water temperatures in southern Minnesota (
Figure 1). These chambers were used to test for denitrification within multimedia bioreactors under reduced temperature scenarios [
32]. A 12-week laboratory experiment was conducted in the winter of 2016/2017 to test two different bioreactor media combinations under 4 h and 12 h HRTs (4 treatments × 3 replicates per treatment for a total of 12 troughs (i.e., containers housing the media)) at 6 °C for 4 weeks and 14.5 °C for 4 weeks, with a warming period of 4 weeks in between to mimic the gradual transition from cold to warm temperatures typically present in nature [
32,
34].
Troughs were surface-exposed (open-topped), horizontal bioreactors with half (6) containing one media combination (10% Brotex material, 10% walnut-shell biochar, and 80% hardwood woodchips by volume), while the other half (6) contained a second media combination (10% walnut-shell biochar and 90% hardwood woodchips by volume) (Figure 4 in [
32]). Inflow was delivered from above the media surface through tubing into a gravel inlet zone, while effluent exited through a perforated vertical outlet pipe located near the downstream end of each trough, allowing for control of saturated conditions and external collection of effluent samples. Troughs were planted with wetland plant plugs (two of each fox sedge (
Carex vulpinoidea), dark-green bulrush (
Scirpus atrovirens), and rice cutgrass (
Leersia oryzoides)) purchased from Cardno Native Plant Nursery in Indiana to mimic natural conditions likely to be found in the field [
32,
34]. Bioreactors were approximately 1.83 m × 0.31 m × 0.61 m, yielding a total volume of ~0.35 m
3 and an aspect ratio of ~6:1 following guidelines presented by Christianson et al. [
14].
Coarse grit black walnut shells (size 4/6, ~4.76 mm) were purchased from Hammon’s Products Company in Missouri and charred by slow pyrolysis in a mobile downdraft gasifier at 600 °C for 3 h by Char Energy, LLC. in Ada, MN, USA [
32,
34]. This temperature was selected because it falls within the midrange commonly used for producing stable, high-surface-area biochars, and it represents a typical operating temperature employed by the commercial charring service. The walnut-shell biochar was chemically characterized by Eurofins (Hamburg, Germany) according to the guidelines introduced by the Biochar Science Network for obtaining the European Biochar Certificate (
Appendix C). Brotex is a fibrous plastic matrix originally developed for BioHaven
® floating treatment wetlands [
35]. The material consists of a dense, porous network of recycled PET fibers designed to support microbial biofilm development [
35]. For the purposes of mixing with the other substrate, large sheets of Brotex (3 m × 5 m) were cut into ~10 cm × 10 cm cubes. Media were arranged in a layered fashion, and all layers were inoculated with 80 mL of soil collected from an agricultural drainage ditch in southern Minnesota [
32,
34]. Additionally, each trough was topped with 0.025 m
3 of the same agricultural soil [
32,
34].
Throughout the course of the experiment, troughs received a water recipe designed to mimic the major chemical constituents and concentrations of agricultural drainage water in southern Minnesota. This recipe was determined based on water-quality data collected at the Mullenbach Two-Stage Ditch in Mower County, Minnesota, as well as information provided by Zhang [
12]. This recipe contained nitrate (NO
3−, 30 mg L
−1), phosphate (PO
43−, 0.5 mg L
−1), calcium (Ca
2+, 55 mg L
−1), chloride (Cl
−, 150 mg L
−1), magnesium (Mg
2+, 20 mg L
−1), and potassium (K
+, 5 mg L
−1) [
34]. This nutrient-laden water was continuously mixed with filtered tap water (for removal of chlorine and chloramine) to produce the desired water recipe concentrations before delivery to the troughs. Flow to each bioreactor was individually controlled using variable area flow meters.
The experiment was conducted in temperature-controlled chambers with air-conditioning units equipped with a temperature-regulating device to further reduce air temperatures beyond the range inherent in the air-conditioning unit Figure 1 [
34]. Setting up adequately reduced conditions took place over a span of 4 weeks, over which the temperature in the chambers was slowly reduced from 30 °C to 6 °C and nitrate measurements in the effluent were not yet taken [
34]. Troughs were saturated in filtered tap water for the first week, and the second week employed a 24 h HRT of the drainage water nutrient recipe and 100 mg L
−1 sodium acetate. Acetate was added during reactor startup to stimulate microbial recovery after air-drying the inoculum soil. This protocol was continued (minus the sodium acetate) for another 2 weeks while reducing the temperature by 2.8 °C every other day [
34]. The HRTs were reduced to 4 h and 12 h for the corresponding treatments, and the temperature was reduced another 2.8 °C (to 6 °C) 1 week prior to the start of the experiment (5 December 2016).
Influent and effluent water samples were collected twice daily for each trough for 6 days per week and analyzed for nitrate using a Hach Nitratax PlusTM nitrate probe, flow rate by timing a volume collected, and DO, conductivity, pH, and ORP (oxidation reduction potential) using a YSI 6-Series Sonde
TM [
32,
34]. Continuous influent nitrate measurements were collected every 15 min from 5:00 PM to 9:00 AM with the nitrate probe as well [
32,
34]. Air, water, and media temperatures were collected once daily for each trough for 6 days per week using Type K (chromel-alumel) thermocouples connected to a Campbell Scientific CR10X data logger [
32,
34]. Water samples were analyzed periodically at the University of Minnesota Research and Analytical Lab for QA/QC of nitrate and nitrite concentrations. All flow meters were cleaned as needed and reset daily at 5:00 PM [
32,
34].
Hydraulic parameters and effective HRT values were obtained from bromide tracer analyses previously reported by Han et al. (Figures 5 and 6 in [
32]). Hydraulic parameters were optimized using the Excel Solver GRG Nonlinear Method to produce a universal curve of bromide concentrations over time (Figure 7 in [
32]). The universal curve was used to determine in situ tracer detention time and employed to calculate actual HRT for the troughs (average of 3.80 h for the 4 h HRT and average 10.74 h for the 12 h HRT) [
32]. The optimal configuration was produced using four reactors containing 98.1% of the total flow, with 3.7% short-circuiting and 1.1% dead space (Table 2 in [
32]). A conceptual diagram of various flow components incorporated into the model is shown in Figure 1 in [
32].
Individual nitrate measurements were removed if the trough flow rate was greater than 25% from the expected value and individual days were removed if more than 25% of the troughs met the previously stated criteria [
32,
34]. Nitrate data were determined to be non-normally distributed with unequal variances between treatments; thus, box-cox transformations were performed using the preferred form presented by Draper and Smith [
36]. For calculating removal rates, the minimum sum of squared errors (SSE) was achieved using a lambda (L) of 0.4, so the data were transformed prior to this analysis [
32,
34]. Nitrate removal was calculated for days in which the χ
2 (as ∑(O
i − P
i)
2) value was less than 30, where Oi and Pi are the observed and predicted values, respectively [
32,
34]. This was chosen due to the natural split of the data and allowed for some variation between the model data and the actual data [
32,
34].
For statistical analysis, temperatures were grouped into three regimes: low (6.0 °C and 7.2 °C), mid (10.0 °C), and high (12.2 °C and 14.5 °C) [
32,
34]. Data were analyzed in SPSS (version 25) using a three-way mixed model ANOVA with the subjects of trough*replicate, the repeated measure of temperature regime, and the fixed factors of temperature regime, material, and HRT [
32,
34]. This analysis is based on a restricted maximum likelihood estimation, a type III sum of squares, and a diagonal repeated covariance type [
32,
34]. Significant differences in the exponent n in the microbial modification of the numerical approximation, as well as the nitrate removal efficiency and the nitrogen removal rate, all by temperature, are presented as results from the Fisher LSD test in ANOVA using XLSTAT
TM (2016.1.1 version) [
32,
34]. Additionally, the Q10 value was calculated as the proportional change in the nitrogen removal rate with a 10 °C temperature change based on a linear regression model [
32,
34].
A combined plug–CSTR in a series bioreactor representing non-ideal flow hydraulics parameterized from bromide tracer tests to obtain effective HRT, short-circuiting, and dead space was modeled in Microsoft Excel™ [
32]. The general formulations and analytical solutions, as well as the methodology for the sensitivity analysis, are given in [
32]. A first-order formulation was selected to maintain consistency with the previously developed hydraulic model of Han et al. [
32], which was developed for a combined plug flow–CSTR system operating under variable influent concentrations, flow rates, and effective hydraulic residence times. The specific mass-balance and kinetics equations used to calculate nitrate removal by denitrifying bacteria using first-order decay are provided in
Appendix A.
To represent spatial and temporal variation in microbial biomass, we scaled the first-order nitrate decay coefficient (κ) with total bacterial abundance estimated from qPCR of 16S rRNA genes measured throughout the longitudinal profile of the media ([
33];
Appendix B). Gene copy numbers were normalized to the run-specific mean and used to compute location-specific multipliers. The decay coefficient for each reactor segment was then adjusted by a power law function of the normalized abundance. Mass removal, efficiency, and volumetric removal rates were computed from the modeled time series.
Although the synthetic drainage water recipe was formulated to provide a target nitrate concentration of 30 mg L
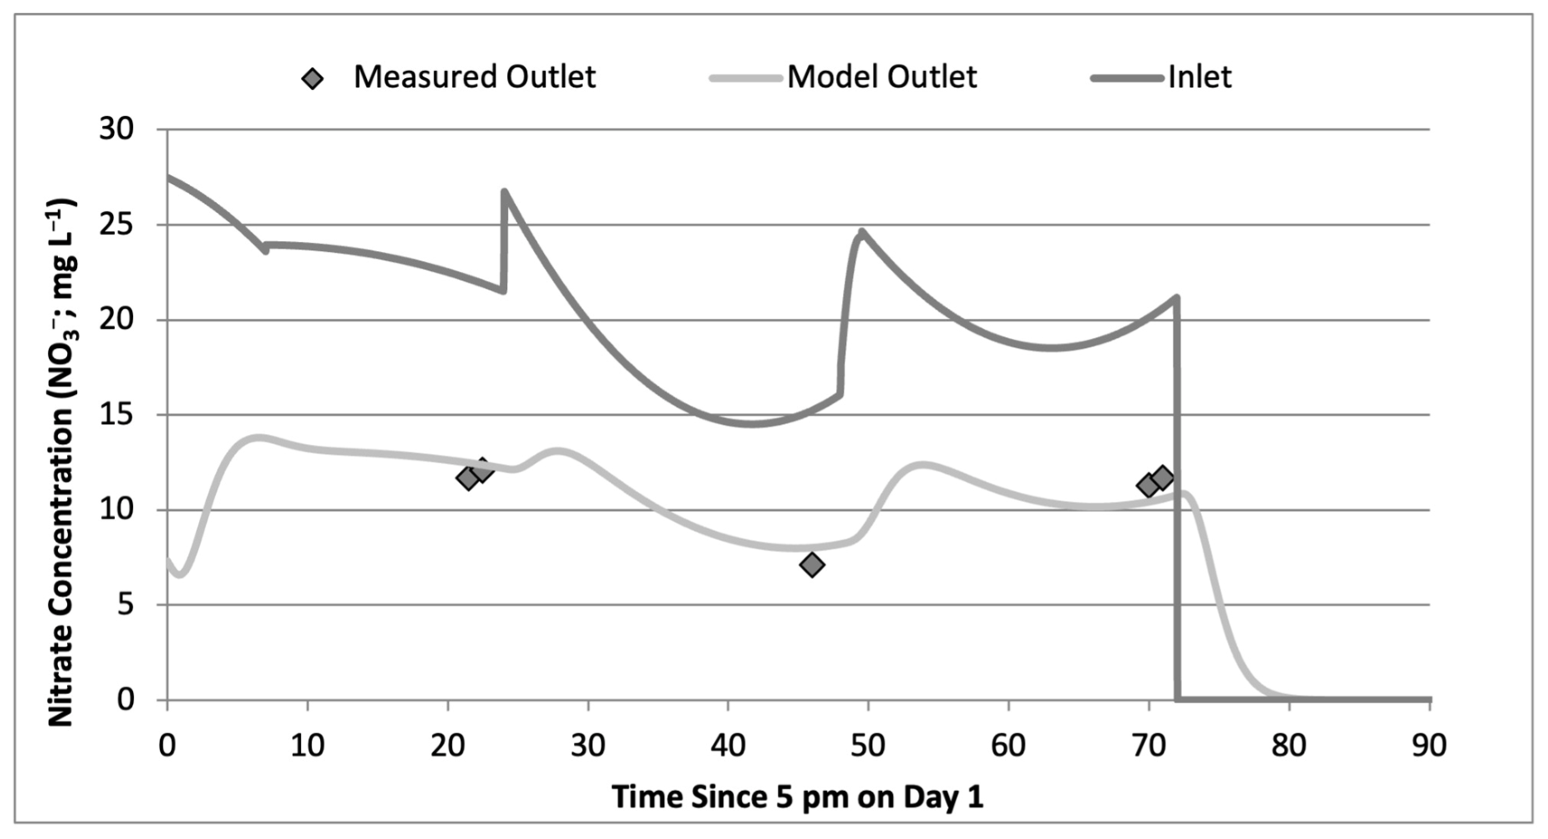
−1, actual influent concentrations varied over time due to inconsistencies in mixing and nutrient delivery due to the gradual clogging of the nutrient line flow meter. Therefore, regression curves were developed to reconstruct influent nitrate concentrations at any given time for use in the nitrate removal model (
Figure 2). For the first 20 days of the experiment, influent concentrations were estimated using linear regression equations based on 2–4 grab samples collected the following day. After day 20, polynomial regression equations were developed based on continuous overnight influent nitrate concentrations, recorded every 15 min from 5:00 PM to 9:00 AM using a nitrate probe, and used to estimate influent nitrate concentrations over each 24 h period starting from 5:00 PM [
34]. When necessary, two separate polynomial equations were utilized: one for the initial rise in concentration following the reset and another for the subsequent decline caused by gradual clogging of the nutrient flow meter due to algal growth [
34].
Nitrate removal was evaluated over 2–3 consecutive days, with the first day establishing initial influent flow and nitrate conditions. Nitrate removal was calculated after 6.75 h to allow stabilization of initial conditions [
34]. The removal rate constant (κd1) was optimized using Excel Solver™ to fit the modeled effluent curve to observed grab sample data (typically two samples spaced 5 h apart) collected between 9:00 a.m. and 5:00 p.m. the following day [
34].
Modeled effluent nitrate concentrations corresponding to measured values were graphed to determine the overall fit of the two datasets. A value of 0.98 was obtained for both a linear regression model coefficient (R2) and a Nash–Sutcliffe Coefficient (NSE) on 461 data points. There was more scatter to the data for concentrations between 15 and 20 mg L−1 (visual estimate), so a three-part linear regression was applied to determine how the fit changes based on the effluent nitrate concentration. In the 0–15 mg L−1 range, the R2 was 0.96, 0.41 in the 15–20 mg L−1 range, and 0.92 in the 20–28 mg L−1 range.
4. Discussion
To contextualize the performance of the multimedia bioreactors evaluated in this study, we compare our findings to results reported across laboratory, bench-scale/mesocosm, and field-scale denitrifying bioreactor systems. While laboratory comparisons are emphasized where possible, comparisons to field systems are also included to bracket the broader range of nitrate removal performance observed in real-world applications. Since relatively few laboratory studies report nitrate removal under temperatures below 10 °C and HRTs of 4 and 12 h, drawing on field benchmarks provides additional perspective. Differences in hydrologic complexity, thermal variability, and loading dynamics across scales are acknowledged. While field benchmarks strengthen context, factors dependent on scale and environmental conditions limit direct comparability. Presenting both laboratory and field comparisons provides a comprehensive view of potential performance while explicitly acknowledging contextual differences.
Nitrate removal efficiencies in these multimedia systems were consistently higher than values reported for laboratory and bench-scale woodchip-only bioreactors operated at similar temperatures and HRTs (e.g., [
34,
37]). For example, Chun et al. [
38] achieved a 30–40% removal at a 12 h HRT and 16–17 °C, with performance dropping to 15% at 13 °C—considerably lower than the 75% removal observed here at ~14.5 °C under the same HRT. Wrightwood et al. [
37] reported ~56% removal in a bench-scale continuous-flow woodchip bioreactor at ~22 °C, again lower than efficiencies observed here. It should be noted, however, that nitrate removal efficiency is influenced by influent nitrate concentration and loading rate, which differed among studies; therefore, these comparisons are intended to provide general context rather than direct performance equivalency. Overall, the literature consistently shows that woodchip-only bioreactors tend to exhibit significantly lower nitrate removal efficiencies, even under conditions of longer HRTs and higher temperatures.
The nitrogen removal rates achieved in this study are high relative to many reported laboratory and bench-scale systems, particularly under reduced temperature and short HRTs. Addy et al. [
5] synthesized laboratory, mesocosm, and field studies and reported mean removal rates of 2.1 g N m
−3 d
−1 at low temperatures (<6 °C) and 5.7 g N m
−3 d
−1 at intermediate temperatures (6–16.9 °C). Lin and Volkenborn [
39] reported laboratory woodchip bioreactor rates ranging from 0.4 to 4.3 g N m
−3 d
−1 at 14 °C with a 24 h HRT. A more recent synthesis by Christianson et al. [
2] reported median nitrate removal rates of 5.1 g N m
−3 d
−1 (mean ± SD: 7.2 ± 9.6 g N m
−3 d
−1; n = 27) across agricultural denitrifying bioreactors operating under a wide range of field conditions and temperatures. While these aggregated values overlap with those observed here, they largely reflect warmer seasonal operation and longer residence times than those evaluated in the present study. Taken together, these comparisons indicate that the removal rates observed here (4–6 g N m
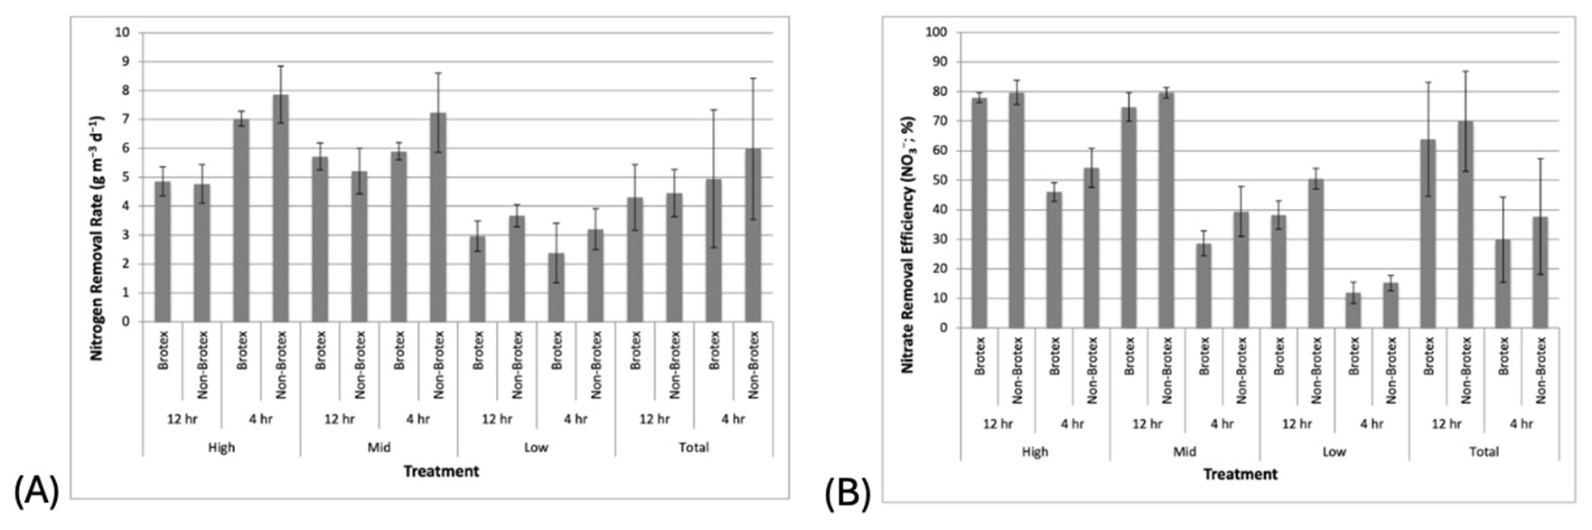
−3 d
−1 across 6–14.5 °C and 7–8 g N m
−3 d
−1 for 4 h HRT treatments at 14.5 °C) fall toward the upper end of reported ranges for short-HRT, low-temperature systems without continuous soluble carbon addition. Some field-scale systems can achieve comparably high rates under longer HRTs, warmer conditions, or carbon supplementation, which helps contextualize the magnitude of these laboratory results while recognizing differences in scale and operating conditions.
First-order decay coefficients (k) observed here (0.04–0.30 h
−1; mean 0.14 h
−1) were higher than those of many laboratory and field woodchip-only systems. Field values reported by Jaynes et al. [
8] were 0.041–0.043 h
−1, and Chun et al. [
40] reported ~0.01 h
−1 at the field scale. Laboratory estimates from Chun et al. [
38] spanned <0.001–0.13 h
−1, and Lin and Volkenborn [
39] reported 0.0008–0.0101 h
−1. Our maximum value (0.30 h
−1) approached the methanol-dosed field system of Moghaddam et al. [
41] (0.369 h
−1, 10 h HRT). The elevated reaction rates observed in the current study may be attributed to the presence of biochar, which likely improved nitrate and biodegradable carbon availability for microbial denitrification through sorption and increased surface area for biofilm growth in the multimedia bioreactor system.
The experimental design did not include a woodchip-only control treatment operated concurrently with the biochar-amended reactors. As a result, the specific contribution of biochar to nitrate removal performance cannot be fully isolated from the effects of the mixed-media configuration under identical HRT and temperature conditions. Interpretations regarding the role of biochar, therefore, rely, in part, on comparisons to nitrate removal rates and denitrification performance reported for woodchip-only bioreactors in the published literature. While such comparisons provide useful context and suggest that the observed removal rates fall within or above previously reported ranges, they do not substitute for a direct internal control. Consequently, conclusions regarding biochar are framed as evidence of enhanced performance of the tested media mixtures relative to literature benchmarks rather than definitive attribution of causality to biochar alone.
Incorporation of the Brotex material did not result in enhanced nitrate removal and was associated with lower removal relative to woodchip-only systems reported in the literature. Previous studies examining porous plastic biocarriers (PBCs) have shown mixed results, with some reporting improved nitrate removal [
42,
43,
44] and others observing variable or inconsistent performance [
27]. In this study, Brotex was incorporated by replacing an equivalent volumetric fraction of hardwood woodchips, which ensured volumetric consistency between treatments but did not maintain functional equivalence in terms of electron donor mass or reactive capacity. Since woodchips provide the primary source of degradable organic carbon and electrons for denitrification, a reduction in nitrate removal would be expected based on mass balance considerations alone when a portion of the woodchip volume is replaced with an inert polymer matrix, independent of any material-specific limitations. Accordingly, the reduced performance observed in Brotex-amended treatments is interpreted primarily as a consequence of decreased reactive carbon availability, although differences in surface chemistry and electrochemical activity may still play a secondary role.
The influence of Brotex on reactor performance appeared to be primarily biological rather than hydraulic. Previous tracer analyses showed that the addition of Brotex increased drainable porosity from 53.6% to 55.4% but did not substantially alter overall hydraulic behavior because both treatment configurations exhibited minimal dead space (~1%) and short-circuiting (~4%) [
32]. Thus, any treatment differences were more likely related to the additional microbial attachment area provided by the fibrous matrix than to changes in flow dynamics. Despite this potential advantage, Brotex did not consistently improve nitrate removal across temperature regimes, hydraulic residence times, or the duration of the experiment. This suggests that denitrification was more strongly constrained by environmental and operational factors, particularly temperature and hydraulic residence time, than by attachment surface area.
Several properties of the walnut-shell biochar may have contributed to the nitrate removal observed in this study. The material exhibited a high C:N ratio (199), indicating substantial carbon content relative to nitrogen within the biochar matrix (
Appendix C). In contrast, the measured surface area was relatively low compared with the European Biochar Certificate benchmark of 150 m
2 g
−1 (
Appendix C), suggesting that surface area alone was unlikely to explain the observed treatment performance. The biochar also contained positively charged ions and a range of trace metals that may have influenced denitrification processes, although the specific role of these constituents remains uncertain. Positively charged sites may have enhanced retention of negatively charged nitrate ions, potentially increasing nitrate availability within biofilms. It is also important to note that the characterization data represent fresh biochar; chemical properties may evolve during bioreactor operation as carbon and nitrogen compounds are adsorbed and transformed, as reported by Mukome et al. [
45]. Finally, walnut-shell biochar produced at moderate pyrolysis temperatures (<700 °C) may retain greater quantities of aliphatic compounds and other labile functional groups than highly carbonized materials, which could provide conditions favorable for initial microbial colonization and activity (Christianson et al. [
14]; Mukome et al. [
45]; Zhang et al. [
46]).
Influent nitrate concentrations fluctuated throughout the experiment, but most observations remained below approximately 12 mg N L
−1. As a result, some variation in nitrogen removal rate could be attributed to changes in nitrate loading, although the overall concentration range was relatively modest. Addy et al. [
5] reported that denitrifying bioreactors receiving influent concentrations greater than 30 mg N L
−1 generally exhibited higher nitrogen removal rates than systems receiving intermediate (10–30 mg N L
−1) or low (<10 mg N L
−1) nitrate concentrations. Since the majority of influent concentrations in the present study were well below this higher-loading threshold, changes in nitrate availability were unlikely to be the primary factor governing treatment performance. Temperature and hydraulic residence time, therefore, likely exerted a stronger influence on denitrification than the observed variation in influent nitrate concentration.
The modeling framework applied in Han et al. [
32] was utilized to improve nitrate removal estimates provided by mass-balance equations under non-ideal and time-varying conditions. Although denitrifying bioreactors are physically static systems, tracer studies and prior work have shown that internal dispersion, entrance and exit effects, and media heterogeneity often lead to mixed-flow behavior. In Han et al. [
32], bromide tracer tests demonstrated that actual HRTs differed from design values and that a portion of reactor volume behaved as mixed flow rather than ideal plug flow. Under these conditions, same-day influent–effluent comparisons can misattribute nitrate removal to incorrect loading periods. By explicitly accounting for hydraulic lag, short-circuiting, and effective treatment volume, the model enabled a more accurate estimation of nitrate removal rates and efficiencies. Additionally, since the experimental bioreactors also received variable inflow concentrations over time, a process-based model was employed to align influent loads with effluent response based on measured HRTs.
In this study, normalized 16S rRNA gene copy numbers were used to scale the decay coefficient in the nitrate removal model, allowing removal estimates to adjust for relative differences in microbial biomass among treatments. This measurement provides a reproducible metric of total bacterial abundance that can vary spatially and temporally. While other functional marker genes involved in various steps of the complete microbial nitrate reduction pathway—such as the nitrate reductase (napA/narG), nitrite reductase (nirK, nirS), nitric oxide reductase (norB), and nitrous oxide reductase (nosZ)—could have been used, previous studies have highlighted challenges in obtaining significantly different results with these functional marker genes under varying temperatures [
19]. Additionally, at the time this study was initiated, limited research had incorporated nirK or nirS into bioreactor analyses, leaving their relevance in such systems largely unexplored [
33]. Given these limitations, 16S rRNA gene copy numbers were deemed the most appropriate and reliable variable for inclusion in this study.
An additional limitation of this study is that the experimental design was not intended to isolate startup effects or distinguish short-term and long-term treatment responses independently. Consequently, differences associated with reactor maturation, microbial establishment, and media aging could not be separated from the effects of temperature, hydraulic residence time, and media configuration. Future studies specifically designed to evaluate startup dynamics and long-term performance may provide additional insight into the temporal effects of the media on denitrification processes.
This work lays the foundation for a wide range of future experiments involving multimedia bioreactor systems. Laboratory studies on multimedia bioreactors could explore variations in media proportions, introduce wet-dry cycling, apply high-concentration nitrate pulses, inoculate systems with different soils or microbial communities, test broader-range HRTs, and evaluate alternative non-wood-based biochars. Additional analyses could include monitoring for the removal of other nutrients or contaminants, assessing the potential degradation of PBCs into plastic particulates within the media or effluent, and conducting gas and microbial sampling in suspected low-activity zones. Furthermore, the nitrogen removal model used in this study should be validated using field-scale data. Given the promising preliminary results, future work could aim to optimize system design for cost-effectiveness by using the most effective media combinations in minimal quantities.