Article

Comparative Analysis of Microbial Communities in Six Urban Recreational Beach Sands and Seawater in the United States and Australia


by
Alexis Danielle Guerra
1,
Helena M. Solo-Gabriele
2,
John Scott Meschke
3,
Kirstin Ross
4,
João Brandão
5,6 and
Sunny Jiang
7,*
1
Department of Environmental and Occupational Health, University of California, Irvine, CA 92697, USA
2
Department of Chemical, Environmental, and Materials Engineering, University of Miami, Coral Gables, FL 33146, USA
3
Department of Environmental and Occupational Health Sciences, University of Washington, Seattle, WA 98195, USA
4
College of Science and Engineering, Flinders University, GPO Box 2100, Adelaide 5001, Australia
5
National Institute of Health Dr. Ricardo Jorge, 1649-016 Lisbon, Portugal
6
cE3c—Centre for Ecology, Evolution and Environmental Changes, Faculdade de Ciências da Universidade de Lisboa, Campo Grande 016, 1749-016 Lisbon, Portugal
7
Department of Civil and Environmental Engineering, University of California, Irvine, CA 92697, USA
*
Author to whom correspondence should be addressed.
Environments 2026, 13(7), 388; https://doi.org/10.3390/environments13070388
Submission received: 16 May 2026 / Revised: 3 July 2026 / Accepted: 6 July 2026 / Published: 8 July 2026
(This article belongs to the Section Environmental Monitoring and Management)

Abstract

Marine microbiomes play an important role in coastal marine environments. This study examined microbial communities in beach waters and sands at six recreational beaches to identify the fingerprints of anthropogenic influences. Samples were collected from four metropolitan areas in the U.S., within Miami, Florida; Seattle, Washington; Newport Beach, California and in Australia within Adelaide. Samples were analyzed for enterococci and fungi by culture. Reverse-transcription droplet digital PCR (RT-ddPCR) was performed for pepper mild mottle virus (PMMoV). Next-generation sequencing was carried out to elucidate the microbial diversity and predict antibiotic resistance. Enterococci concentrations surpassed the U.S. EPA marine water quality guideline value in the seawater samples from Seattle and Adelaide, and fungal concentration exceeded the WHO guideline in the sand of North Star Beach, California. Low levels of PMMoV were detected in seawater and sand from multiple locations. Chloroflexi and Acidobacteria were the most abundant bacterial phyla in sand, while Marinimicrobia and Cyanobacteria dominated in seawater. Beach sand had higher bacterial and fungal diversity than seawater, of which the most abundant fungal genera include taxa of potential pathogens. Predicted antibiotic resistance genes showed high levels of beta-lactam and multidrug resistance genes in all samples. This study contributes to the understanding of anthropogenic impact on the coastal environment, emphasizing the need for human health protection measures.

1. Introduction

Coastal microbiomes are foundational for determining the health of coastal ecosystems. They serve as an indicator for the health status of the coastal environments and inform us about the impacts of natural events and anthropogenic activities on coastal ecology. Extreme storm events have been shown to dramatically shift microbial composition in coastal surface waters [1]. Urban runoff and human wastewater discharge into coastal oceans often disrupt the natural processes by contributing pathogens and toxins that can affect the water quality and the coastal ecosystem’s overall health. High concentrations of pathogenic bacteria and fecal indicator bacteria (FIB) have been found among the total microbial community in regions influenced by sewage discharge and after extreme rainstorm events [2].
To protect human health in coastal recreation, national agencies such as the U.S. Environmental Protection Agency (EPA) set water quality standards based on FIB and recommended a threshold enterococci concentration of 35 colony-forming units (CFU)/100 mL in marine and fresh waters [3]. Since FIB behaves differently from viruses in terms of persistence in the environment, researchers have also suggested that water quality monitoring should include viruses. Pepper mild mottle virus (PMMoV) has been considered as a human viral indicator [4] because of its high concentrations in human feces and raw sewage due to humans’ dietary habits for pepper products. PMMoV is an RNA virus that causes disease in pepper plants worldwide. It is highly stable in the environment and is found in treated wastewater and seawater impacted by wastewater [5].
Beyond bacterial and viral pathogens, antibiotic-resistant organisms have emerged as a pressing public health threat in recent years due to the decline of antibiotic efficacy in clinical practice for treating infectious diseases. Antibiotics as well as antibiotic-resistant bacteria can be discharged into aquatic ecosystems from pharmaceutical companies, hospitals, farms, and human wastewater [6], spreading and amplifying bacteria harboring antibiotic resistance genes (ARGs). ARGs are frequently detected in coastal environments after storm events [2] and are acquired on human skin after recreating in beach waters [7].
In addition to recreational beach water, recent decades of research have identified that beach sands are an important reservoir of pathogens that pose human health threats because beachgoers spend most of their time on the sand [8,9]. Studies have revealed that FIB, such as enterococci, are widespread in sands along coastal beaches with much human development [10]. Populated recreational beaches harbor greater numbers and species of potentially pathogenic yeast than unpopulated beaches [11]. A coordinated study in multiple recreational beach sites of Europe and Australia reported frequent detection of opportunistic fungal pathogens in beach sands [12]. Antibiotic-resistant bacteria have also been cultured from marine recreational beach sands [13]. Although the World Health Organization (WHO) set tentative guidelines for enterococci and fungal concentrations in sands [14] to advise recreational health, no formal regulatory standard has been established for sandy beaches in the U.S. or Australia.
This study compares microbial fecal indicators, bacterial and fungal communities in beach sands and seawater collected from the East and West Coasts of the United States, and from two beaches in Australia. The study aimed to illustrate the relationship between human fecal markers, fungi, microbial diversity and patterns of antibiotic resistance in efforts to evaluate their consistencies in predicting anthropogenic impacts. The study outcomes suggest that beach sands can serve as reservoirs for fecal bacteria, fungi and clinically relevant ARGs across different geographic sites, which contributes to our understanding of coastal microbiomes.

2. Materials and Methods

2.1. Study Site

Six public recreational beaches were sampled between July and October 2020 by four participating laboratories in the U.S. and Australia. The sample locations include four U.S. beaches and two Australian beaches. The U.S. beaches included a beach in Miami, Florida, Miami Beach (MB), a beach in Seattle, Washington, Golden Gardens State Park (GG) and two beaches in Newport Beach, California, Newport (NB) and North Star (NS). The two Australian beaches were in Adelaide and included Christies (CB) and Seacliff (SB) Beaches (Table 1). The time of sampling coincided with the U.S. and Australian summer beach recreational season. For both countries, the COVID-19 isolation protocol was in place at the time, which reduced the beach visitor density. All beaches in this study are located at urban centers and were influenced by urban runoff to various degrees. Detailed information on sample location, date, site identification (ID) code, and proximity to an urban river outflow is presented in Table 1. A map illustrating the sampling locations is presented in Figure S1.

2.2. Sample Collection and Processing

Approximately 2500 g of beach sand were collected at each study site by scraping the top 2 cm of the sand surface from the supratidal zone using a sterilized sample scoop into a sterile plastic sample bag. Simultaneously, about 6 L of seawater was collected from the intertidal or “swash” zone of the beach using a triple sample rinsed bucket and filled into a bleached and triple sample rinsed carboy. Physical characteristics and environmental conditions were measured on site and upon return in the lab with details provided in the Supplemental Information (S.1). Samples were transported on ice to the laboratory within 3 h of collection. Beach sand and water samples were identified using site ID with letter “S” for sand, and “W” for water, respectively, at the end of the site IDs. To recover microbes from beach sand, 200 g of wet sand was mixed with 2 L of sterile phosphate-buffered saline (PBS, pH 8.0) in a 2 L bottle. The mixture was shaken and swirled for 10 min and left to settle for 3 min before collecting the supernatant for microbial analyses.

2.3. Enumeration of Enterococci

Enterococci were quantified by culture for each sand and seawater sample in triplicate. For the U.S. laboratories, the membrane filtration according to EPA standard methods [15] was used. Briefly, 40 mL of sand eluate in PBS, and 100 mL of seawater were filtered through 0.45 μm pore size, 47 mm diameter filters (Hach Company 2936100, Loveland, CO, USA). Filters were placed on BBL™ membrane-Enterococcus Indoxyl-β-D-Glucoside (mEI) agar and incubated at 41 ± 5.0 °C for 24 h (Becton, Dickinson and Company, Sparks, MD, USA). Colonies with blue halos and ≥0.5 mm in diameter were counted as CFU at the end of the incubation period. For the Australian laboratory, the chromogenic substrate-based method of EnterolertTM (IDEXX Laboratories Inc., Westbrook, ME, USA) was used following the manufacturer’s protocol. Briefly, samples were diluted, added to the reagent bottles, mixed and poured into the Quanti-Tray and sealed by the Quanti-Tray Sealer (IDEXX Laboratories Inc., Westbrook, ME, USA). After 24 h of incubation at 41 ± 5.0 °C, the fluorescent wells were read, and the most probable number (MPN) was determined based on EnterolertTM protocols. All concentrations were corrected by the original sample volume and the average with standard deviation per 100 mL of seawater or 100 g of dry sand was reported (see equations presented in Supplemental Information S.2). In the comparative analysis, MPN is assumed to be equivalent to CFU since both methods are considered comparable and accepted by the U.S. EPA for water monitoring.

2.4. Fungal Culture Analysis

For sand, 40 g of wet sand was mixed with 40 mL of deionized (DI) water by gentle swirling for 30 min to minimize the breakage of fungal hyphae if present. After a brief 5 min settling, 200 μL supernatants of sand eluate were spread onto Difco™ Sabouraud dextrose agar (SDA) plate with 0.05 g/L chloramphenicol (Becton, Dickinson and Company, Sparks, MD, USA). For seawater, 250 mL of water was passed through 0.45 μm, 47 mm filters, which were placed on SDA containing 0.05 g/L chloramphenicol. The plates were incubated at 27.5 ± 2.5 °C for 5–7 days, and the average total fungal concentrations in CFU were calculated using equations in Supplemental Information (S.2). Both sand and water samples were assayed in triplicate and presented as average with standard deviation of CFU per milliliter of seawater or per gram of dry sand.

2.5. Concentration of Microbial Biomass for DNA/RNA Extraction

Electro-negative filtration was used for the concentration of microbial community in sand elute and seawater based on previously reported methods [16,17]. Briefly, sand eluate and seawater samples were adjusted to pH 6.0, and MgCl2 was added to a final concentration of 25 mM, then filtered through 47 mm, 0.45 μm HAWP04700 filters (Merck Millipore Ltd., Sydney, Australia) in triplicate. The final filtration volume was recorded to calculate the concentration factor. Filters were eluted using Zymobiomics DNA/RNA Shield (Zymo Inc., Irvine, CA, USA) in sterile microfuge tubes and stored at −80 °C until further use for DNA/RNA extraction or shipped to the University of California, Irvine (UCI) lab on dry ice. All nucleic acid extractions were performed by the UCI lab following the Zymobiomics DNA/RNA Mini-Prep Extraction Kit protocol (Zymo Inc., Irvine, CA, USA). The DNA and RNA fractions recovered from Mini-Prep Extraction were stored in −80 °C freezer until used for droplet digital PCR (ddPCR) and sequencing analysis at UCI.

2.6. RT-ddPCR Assays for PMMoV

To detect PMMoV, 2 μL of nucleic acid extract from each sample was used as the template in RT-ddPCR using the Bio-Rad One-Step RT-ddPCR Advanced Kit for Probes (Catalog #1864021, BioRad Laboratories, Hercules, CA, USA). Nucleic acid extracts from wastewater with a known concentration of PMMoV were used as the positive control, and DI water served as the negative control during each RT-ddPCR run [18]. The primers, the TaqMan probe (Thermo Fisher Scientific, Waltham, MA, USA) and assay protocols for the RT-ddPCR were adopted from previous studies [4,19]. The raw data were examined for the droplet fluorescence intensity and position in comparison with the negative and positive control signals for each set of PCR reactions. The viral concentrations in the RT-ddPCR assay were analyzed using BioRad QuantaSoft (Version 1.7.4, BioRad, Hercules, CA, USA) and corrected for the concentration factors. All samples were analyzed in triplicate.

2.7. Sequencing and Analysis

NextGen Sequencing (NGS) for the 16S and 18S rRNA genes was performed by MRDNA/Molecular Research LP (Shallowater, TX, USA) using the bTEPAP® method. A 16S rRNA gene was amplified using the PCR primers 515F/806R (515F: 5′-GTGCCAGCMGCCGCGGTAA-3′, and 806R: 5′-GGACTACVSGGGTATCTAAT-3′) and 18S rRNA gene was amplified using primers Euk1391/EukBr (Euk1391: 5′-GTACACACCGCCCGTC-3′ and EukBr: 5′-TGATCCTTCTGCAGGTTCACCTAC-3′).
Gene sequences were processed using QIIME2 (Version 2021.4) [20]. The taxonomy classifier contained reference sequences from the SILVA 138.1 database and was trained according to the 16S and 18S rRNA gene primers. The representative sequences were imported into RStudio (Version 2023.03.0). All 16S rRNA gene sequences assigned to chloroplasts, archaea, mitochondria and unassigned taxonomy were removed. Samples were accepted for further sequencing analysis if they yielded more than 1000 sequence reads. After taxonomic assignment, the 16S sequences were rarified based on the lowest number of DNA sequence reads of 17,348, as shown in the rarefication curve in Figure S2.
Similarly, the 18S rRNA gene sequences were filtered to remove all archaea, bacteria and unassigned taxonomy at the phylum level. The remaining sequences assigned to Eukaryota were rarified based on the lowest sequence reads (n = 8023).
To identify the prevalence of ARGs, rarified 16S rRNA sequences were loaded into PICRUSt2 (Version 2.4.2) [21] to predict the functional ARG profile in the bacteria based on the GitHub online tutorial. Stratified metagenome predictions per operational taxonomic unit (OTU) in each sample were generated based on the Kegg Ortholog database and a previous study using PICRUSt2 for ARGs [22]. Predicted ARGs associated with the bacterial OTUs in the samples were visualized, filtered and quantified using Excel spreadsheets and R packages such as biomformat (Version 1.24.0) [23], seqinr (Version 4.2.23) [24], and Biostrings (Version 2.64.1) [25] to load the data into RStudio [7,22].

2.8. Statistical Analysis

Statistical analyses were conducted in RStudio (Version 2024.12.1). The statistical significance in microbial community composition was calculated between sample types and sample locations in the beta-diversity matrix using a PERMANOVA test via adonis2 in the vegan R package (Version 2.6.4) [26]. The dispersion within sample types and locations was calculated using Bray–Curtis and the betadisper function in the vegan R package (Version 2.6.4) [26]. The diversities and the relative abundances of taxonomy were visualized using ggplot2 (Version 3.5.2) [27], dplyr (Version 1.1.4) [28] and tidyverse (Version 1.3.2) [29] packages. The Kendall’s tau values were calculated to determine the correlation between microbial markers and environmental parameters via the corrplot R package (Version 0.92) [30]. Comparisons of microbial culture concentrations and abundance were interpreted qualitatively, focusing on relative abundances rather than absolute numerical differences.

3. Results and Discussion

3.1. Environmental Conditions

The sampling sites in this study span a large geographic region with different climate conditions. Supratidal, intertidal beach sand and seawater temperature reflected the local air temperature, varying widely from a low of 14.1 °C in Christies Beach, Australia, to a high of 34 °C in Miami Beach (Tables S1 and S2). Most sites had water salinity values closer to ocean water (ranged from 32 to 35.1 practical salinity units, or psu), except Golden Gardens Park in Seattle, where the salinity was 2.85 psu, reflecting the significant influence of the Shilshole Bay and Columbia River. The two Southern California beaches, Newport Beach and North Star Beach, also had salinity of 33 and 32 psu, respectively, which were slightly lower compared to Miami Beach and the two Australian beaches, reflecting the influence from urban runoff of the Santa Ana River and the Newport watershed. The pH values of water samples from Golden Gardens Park and North Star Beach were slightly lower (7.5 and 7.46 psu, respectively) than the seawater pH values shown in the other sample locations. No rain events were recorded the day prior to or during the sampling events. Most of the sites were coastal recreational sandy beaches, but Golden Gardens Park and North Star Beach are considered marine estuarine beaches. Additional environmental data are shown in the Supplemental Information (Table S3). The environmental parameters described here provide background information that sheds light on the outcomes of microbial analysis.

3.2. Enterococci and PMMoV

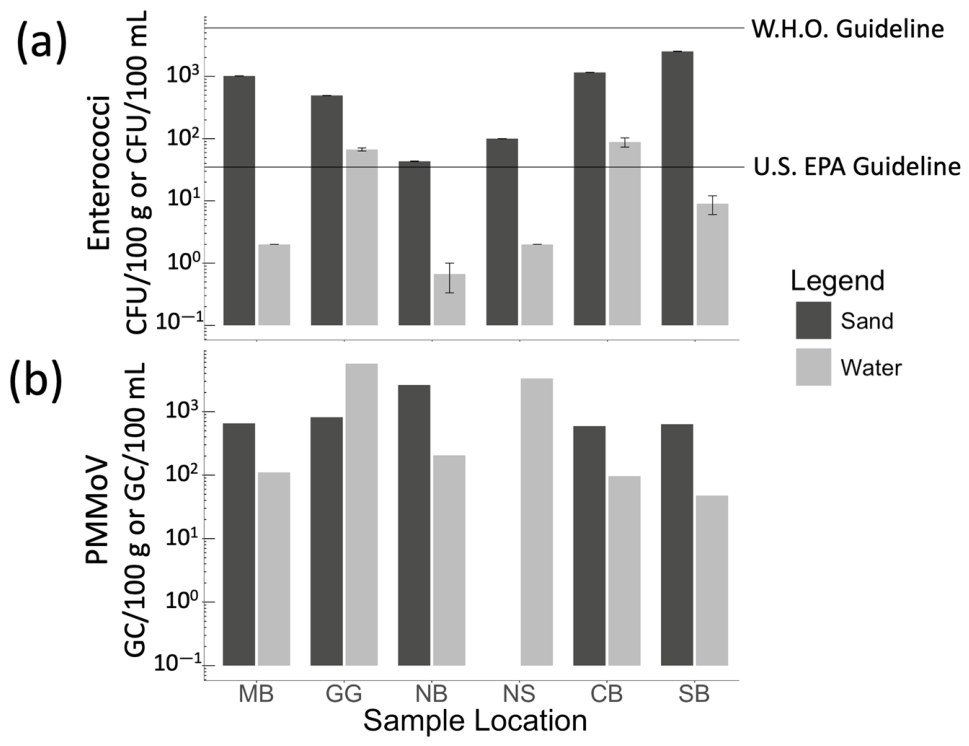
The mean enterococci concentrations by sample location in beach sand and seawater are shown in Figure 1. Two high seawater enterococci concentrations were found at Golden Gardens Park, WA (average 67 CFU/100 mL) and Christies Beach, Australia (average 88 CFU/100 mL), which surpassed the U.S. EPA average daily marine water quality threshold value of 35 CFU/100 mL. These findings suggest fecal contamination in the recreational waters at these sample locations at levels that may promote risks for gastrointestinal disease. The lowest seawater enterococci concentration was recorded at Newport Beach, CA (average 0.67 CFU/100 mL).
The highest mean sand enterococci concentration (average 2523 CFU/100 g) was recorded from Seacliff Beach, Australia, and the lowest was from Newport Beach (average 43 CFU/100 g). Although there is no easy comparison of concentration in sand and water, by approximation of 100 g of sand equals 100 mL of water, the concentrations in sand were approximately one order of magnitude higher than those in the adjacent seawater, as shown in Figure 1a. This result is consistent with previous studies that report higher concentrations of enterococci in beach sands than those in seawater [10,31,32,33]. However, in comparison with the WHO tentative sand quality enterococci guideline of 60 CFU/g (6000 CFU/100 g) of sand [14], the enterococci concentrations in beach sands from this study were below the WHO guideline value (Figure 1).
There was no correlation between enterococci in sand and in seawater (p > 0.05), meaning that high concentrations in sand did not necessarily indicate high concentrations in adjacent seawater. This result is in general agreement with similar studies [34]. Enterococci are known to persist in beach sand and grow in sand from temperate to tropical and subtropical environments [33,35,36]. The only weak corresponding enterococci pattern in the sand and seawater in this study was observed at the two California sites, Newport Beach and North Star Beach. Since the result only reflected a single sampling event, the observation may only reflect the specific condition at the time of sample collection.
The RT-ddPCR results revealed that PMMoV, the viral fecal marker, was detectable in all but the sand sample from North Star Beach. However, only one or two fluorescence droplets were detected in most of the samples. Moreover, only one of the three triplicated samples yielded positive results. Thus, no error bar could be assigned to the assay outcome as shown in Figure 1b. Only three samples had greater than three fluorescence droplets: seawater in Golden Gardens Park, Washington and North Star Beach, California, and a sand sample in Newport Beach, California. After correcting for sample volume, these convert to PMMoV concentrations in the range of 2.6 × 10³ genome copies (GCs)/100 g of sand and up to 5.7 × 10³ GC/100 mL of seawater. However, since the concentration calculation was only based on one of the three replications, the variability of the results could not be assessed (Figure 1b).
In comparison with the wastewater samples that contained PMMoV concentrations of 109 to 1011 GC/100 mL, the concentrations detected in seawater and sand were very low. Nevertheless, their presence suggests the low level of human fecal signal, especially in Golden Gardens Park, North Star Beach and Newport Beach. Golden Garden, with a salinity measurement of 2.85 psu, was clearly influenced by urban runoff. The salinity at North Star and Newport Beaches was 32 and 35 psu, respectively, also below the ocean salinity of 35 psu, indicating some degree of runoff influence at these sites.
A few previous studies have reported PMMoV concentrations in coastal water samples ranging from 1.2 × 101 GC/100 mL [37] to 6.0 × 10⁶ GC/100 mL [5], the latter of which was detected in seawater samples influenced by secondary treated wastewater discharge. One study in Southeast Queensland, Australia, measured PMMoV concentrations ranging from 3.6 to 8.6 × 10³ GC/100 mL in 4 of the 12 seawater samples collected from recreational beaches [38], which is similar to the finding of this study. There have not been previous reports specifically quantifying PMMoV in beach sands. However, studies have shown that PMMoV can persist in sewage-contaminated soils [39].
Statistical analysis indicated no correlation between positive PMMoV detection and enterococci concentrations in sand or in seawater (p > 0.05). Although both organisms have been used to denote human waste in water contamination, these two indicators do not necessarily show a corresponding pattern to one another in marine environments [40]. While PMMoV is generally believed to be associated with human wastewater, enterococci in beach sands could naturally thrive in sand [33,35].

3.3. Fungal Abundance

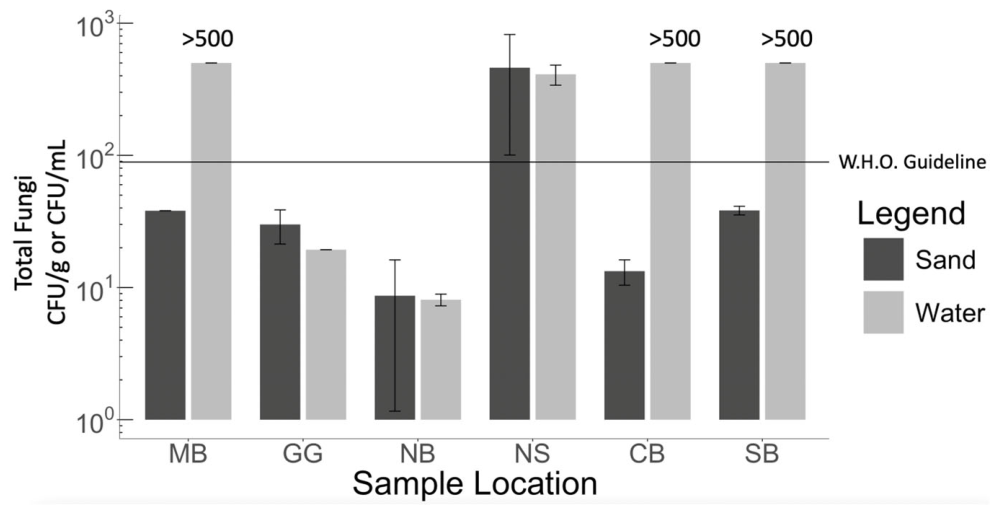
The average fungal concentrations cultured on SDA in beach sand and in seawater are shown in Figure 2. Similar fungal concentrations in beach sand and seawater were observed at three of the U.S. beaches. North Star Beach sand had the highest concentration of fungal counts, while Newport Beach sand had the lowest counts. By comparison, fungal counts in seawater collected from Miami Beach, Christies Beach and Seacliff Beach, Australia were at least one order of magnitude higher than those in the beach sand. The fungal colonies in these water samples were too numerous to count on the SDA plates when they measured above the upper limit of detection of 500 CFU/mL. These concentrations were much higher than measurements in other seawater samples in this study, and in previous reports of fungi in marine water [12]. Early fungal studies that focus on understanding the biodiversity of fungal species between sample locations [41,42] have also shown higher abundance in marine sediments, beach sands, and other marine substrates than in seawater [43,44,45,46]. Therefore, the reason for the abnormally high fungal concentration found in the culture from Miami and Australian water samples was unclear, which could not rule out the rapid spreading of fungal spores during incubation, especially considering the low fraction of fungal community identified by sequencing in samples from these seawaters, as presented in Section 3.4 of this study.
Fungi on beaches have become an important topic, adding to the knowledge of beach recreational health [47]. In 2021, the WHO established a guiding value of 89 CFU/g of sand for advised sand quality based on the study by Brandão et al. [12]. According to this threshold, the beach sand at North Star Beach, California, is above the guiding value (Figure 2). However, it is important to note that the recreational safety of beach sand requires investigation of the composition of the flora, especially considering taxa with the potential to cause invasive infections. There still has not been a standardized method for quantifying fungi in beach sand, and the relationship between fungal species present in sand and health risk has not been explored. The results presented here provide a glimpse of fungi in beach sands, which is an understudied area of recreational health research.

3.4. Microbial Communities’ Diversity and Taxonomy

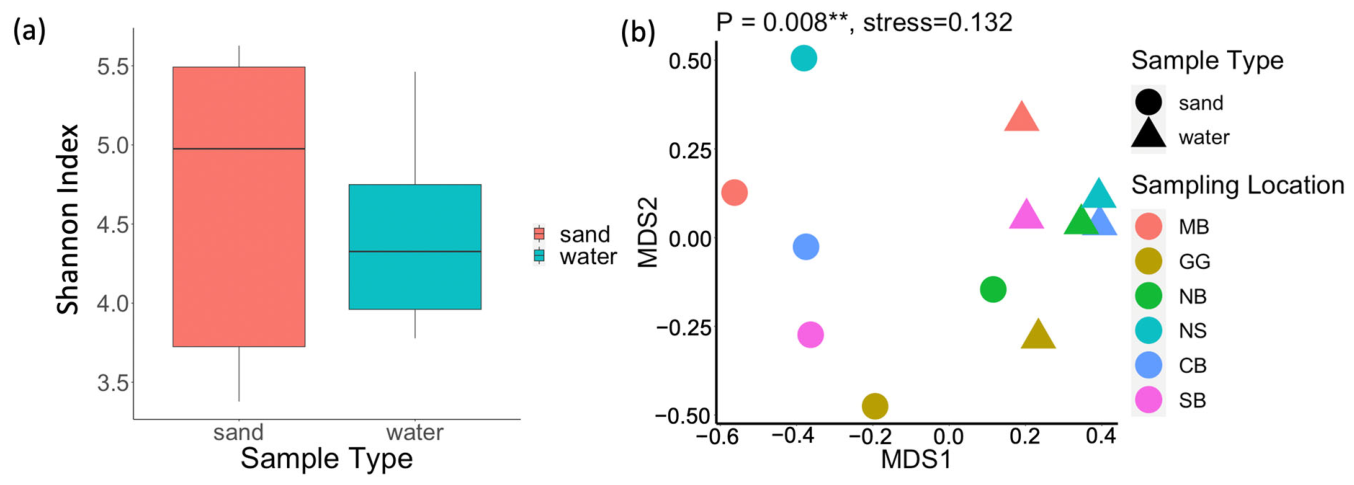
The 16S rRNA gene sequencing retrieved reads ranged between 17,348 and 29,134 per sample, with an average of 23,779 and a total of 285,349 reads in the final data set (Figure S2 and Table S4). The Shannon indices of sequences stratified by sample type show that sand had a wider range of alpha-diversity compared to that of seawater (Figure 3a and Table S4). The NMDS plot showed that sand bacterial communities were distinct from the seawater bacterial communities that clustered more closely together (Figure 3b, Table S5). The PERMANOVA confirmed that microbial community composition was statistically significantly different between sand and seawater (p = 0.008, R2 = 0.187, F = 2.30). The p-value of the NMDS represents the significant difference in communities (p < 0.05). The homogeneity of dispersion across sample types was confirmed (p = 0.123), supporting that differences reflect shifts in community composition rather than dispersion. The PERMANOVA results for assessing microbial community by sample location revealed no statistical significance (p > 0.05). The results generally suggest that waters are more homogenously mixed and have similar conditions around the world compared to beach sand, which may display each site’s unique ecological condition.
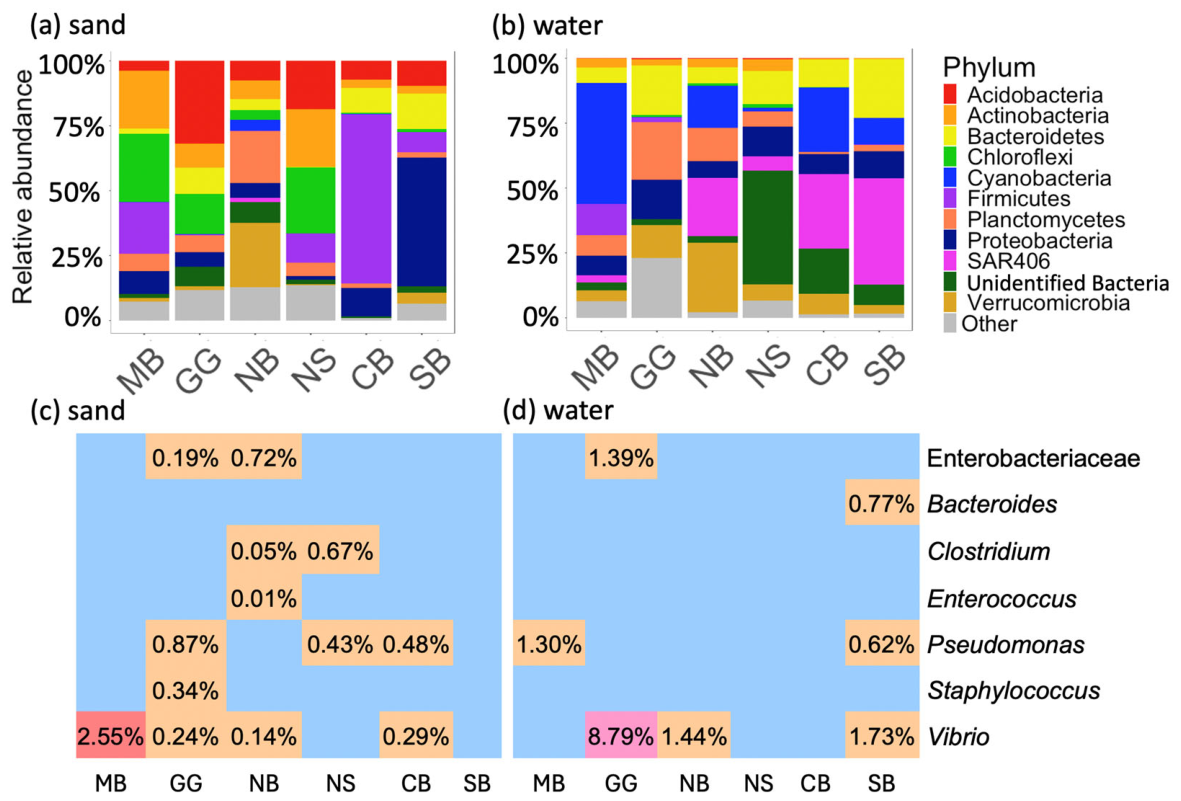
When comparing sample types regardless of sample location, the phylogenetic analysis revealed that the most abundant phyla in beach sand were Acidobacteria and Chloroflexi, while Marinimicrobia (SAR406) and Cyanobacteria were the most abundant bacterial phyla in seawater. When comparing the ten most abundant bacterial phyla in sand and seawater by sample location, the results reveal variability of dominating phyla at each individual beach (Figure 4). For example, Firmicutes is the most abundant phylum in beach sand collected from Christies Beach, while Proteobacteria dominates sand from Seacliff Beach (Figure 4a). Unidentified bacterial phyla are the most abundant in the seawater sample from North Star Beach. The phyla that were not included in the top ten phyla were categorized as “other”. Approximately 25% phyla in the Golden Gardens Park water (Figure 4b) were assigned to “other”. Table S6 shows the OTU table with the assigned bacterial sequences and taxonomy.
The phyla analysis reconfirms the trend observation in beta-diversity and agrees with previous studies suggesting divergence of the sand microbiome from one location to another. Earlier studies show that Chloroflexi and Acidobacteria are dominant in some beach sands, while Actinobacteria, Bacteroidetes, and Proteobacteria are in higher abundance in other beach sands [13,14,48,49].
The genera of potentially pathogenic bacteria were searched among the sequence data, although genus-level identification could not define pathogenicity with certainty. The Vibrio genus was the most common potential bacterial pathogen (Figure 4c,d) in sand and seawater, reflecting the marine/estuarine condition of the sample locations. A previous study indicates Vibrio is frequently isolated from sewage-contaminated beaches, with a higher concentration in beach sand than seawater [32]. In addition to Vibrio, several other potential pathogenic genera were observed in beach sands from Golden Gardens and Newport Beach samples. Both beaches are influenced by urban runoff to various degrees according to the salinity measurements. The Pseudomonas genus was the second most identified potentially pathogenic genus. Both Vibrio and Pseudomonas can proliferate in coastal environments, and some species can cause human infections. Enterococcus (0.01% of all sequences) was only identified in Newport Beach sand, yet it was found in all sand samples by culture assay. These results indicate that although 16S rRNA gene sequencing can provide a general profile of the local bacterial community, they are insufficient to rely on for identifying pathogens or fecal contamination. PCR methods are necessary to identify specific pathogens [34,35,50], yet a sequencing-based approach can identify the unique microbiome characteristics at a specific site and time.
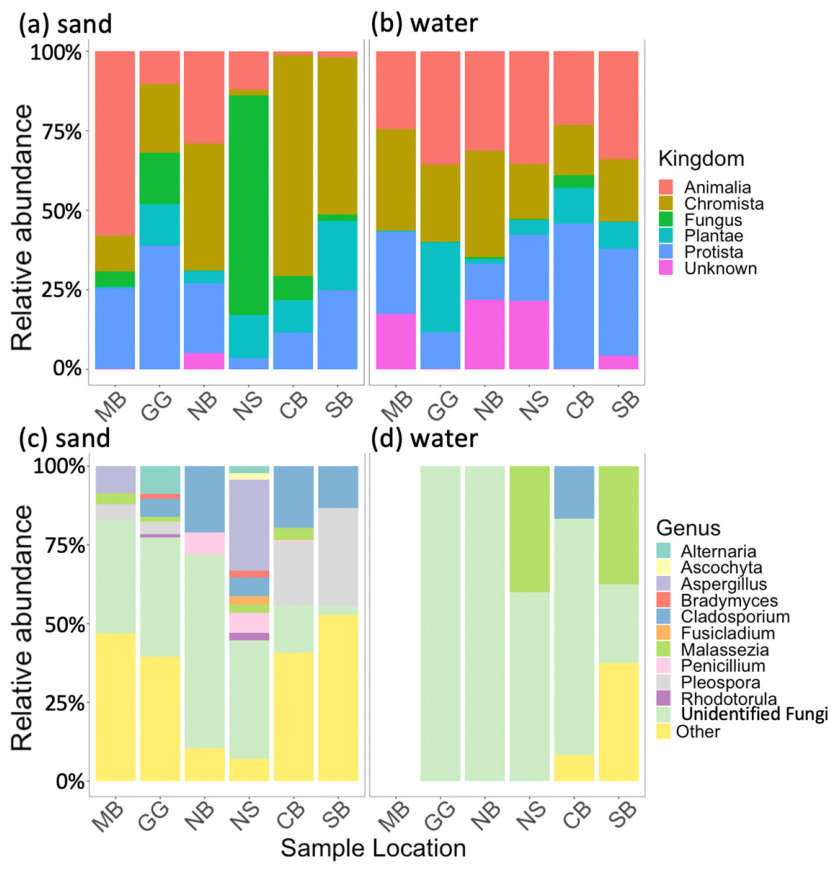
The 18S rRNA gene sequencing yielded 238,177 reads assigned to Eukaryotic taxonomy, ranging from 8023 to 29,849 with an average of 19,848 reads per sample. Animalia, Plantae and Chromista made up important fractions of 18S sequences in the sand and water. Protista sequences ranged from a few % to near 50% of the sequences. Fungal sequences were a small fraction of the 18S rRNA gene sequences recovered, accounting for less than 1% to around 20%, except for the beach sand from North Star Beach, where Fungus accounted for nearly 70% of all sequences (Figure 5a,b). The top ten most abundant fungal genera identified are Alternaria, Aspergillus, Ascochyta, Bradymyces, Cladosporium, Fusicladium, Malassezia, Penicillium, Pleospora, and Rhodotorula. Fungal sequences were less than 1% in the water sample from Miami Beach. The few fungal sequences found in seawater belonged to the genera Malassezia and Cladosporium (Figure 5c,d), which were different from the top ten most abundant fungal genera in beach sand. Nine of the top ten fungal genera were found in the sand from North Star Beach, with Aspergillus being the most abundant in the sample.
Five of the top ten fungal genera could potentially cause systemic infections in vulnerable populations of humans, including Alternaria, Aspergillus, Cladosporium, Malassezia, and Rhodotorula [51]. A seasonal study of a tourist beach in Italy demonstrated that higher detection of Aspergillus and Candida were commonly found in the sand during the high tourist summer seasons, suggesting the human influence and health risks of these fungi in beach sands [52]. In our study, the genus Rhodotorula was only found in sands from North Star Beach and Golden Gardens State Park, which are estuarine beaches most affected by runoff. Rhodotorula spp. have been observed in the environment and in humans’ gastrointestinal tracts and have been suggested as a potential informal fecal indicator organism in beach sands and marine waters [53]. Further research is needed to verify whether Rhodotorula can be used as a fungal indicator of fecal contamination in marine environments. Table S7 shows the OTU table, the fungal sequences and assigned taxonomy.

3.5. Antibiotic Resistance Potential in Beach Sand and Water

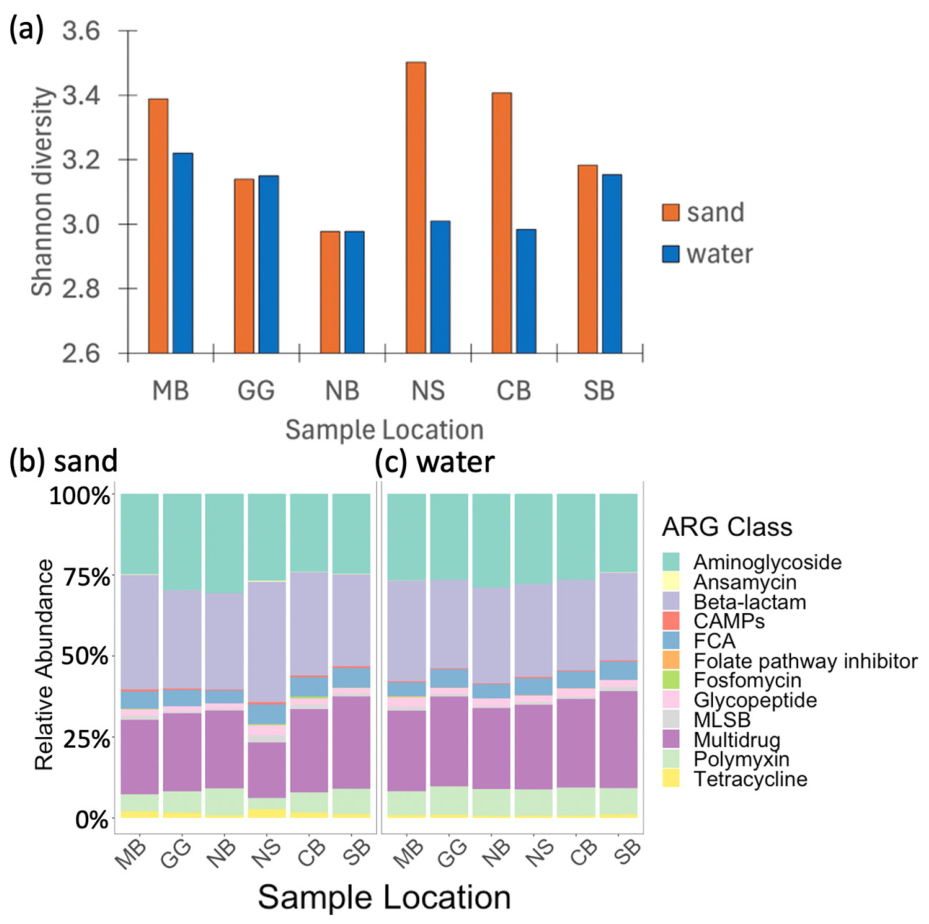
Predicted ARGs based on PICRUSt2 analysis are shown in Figure 6. The percentage of ARG ranged between 0.82 and 0.94% in each sample’s total PiCRUST2 outcomes (Table S8). Proteobacteria, Bacteroidetes and Actinobacteria contributed the most to ARGs across the samples. Higher Shannon indices of ARGs were seen in sands at most sample locations, with North Star Beach sand showing the highest (Figure 6a). The relative abundances of ARGs were represented similarly across seawater and sand (Figure 6b,c). The most abundant representation of predicted ARG classes in sand and seawater encoded multidrug and beta-lactam resistance, as well as resistance to commonly prescribed aminoglycosides, followed by last-resort antibiotics, polymyxins, which are all highly clinically important. It is important to note the inherent limitation of using PICRUSt2 prediction to reveal ARGs in environmental samples. In the absence of the availability of deep metagenomic sequencing that requires significant resources and technical capacities, PICRUSt2 analysis offers a glimpse of the antibiotic-resistant potential in a sample. Our results agree with a previous study using PICRUSt2 to reveal the abundances of beta-lactam and polymyxin resistance in beach sand in South Africa [13]. Most studies prioritize recreational beaches to investigate ARGs, but future studies should consider understanding the baseline of “naturally occurring” antibiotic resistance in non-recreational beaches with less human impact [54] to better understand the anthropogenic impacts.
The ARG profiles do not translate directly to human health risks because most of the bacterial genera in the samples are not human pathogens. Predicted ARG profiles also give no information on phenotypic resistance. However, growing evidence suggests that marine bacteria harboring ARGs are viable and culturable. For example, a combination of disk diffusion tests and quantitative PCR assays was applied to detect clinically relevant ARGs in ocean water samples, of which beta-lactam resistance was the most detected [55]. Colistin-resistant bacteria were isolated from public beaches influenced by urban and industrial wastewater [56]. Furthermore, human recreational exposure to beach water and sand can lead to rapid acquisition of ARGs and the potential transfer of these ARGs from marine bacteria to human skin microbiomes [7]. Therefore, this glimpse of the ARG profile calls for more detailed investigation of environmental antibiotic resistance and coastal microbiomes to assess the recreational health at sandy beaches.

3.6. Study Limitations

There are several limitations to consider that warrant refinement for future research on beach sand and seawater microbial communities and fecal indicators. First, a larger sample size and repetitive sampling are necessary to better compare microbiomes and anthropogenic impacts at diverse beaches and climate conditions from different hemispheres. A larger sample size across different beach types and seasons can confirm robust correlations between environmental conditions and the microbiome variation. The temporal variability should be established with high frequency sampling that spans daily variability, seasonal variability, tidal influence and variations in terrestrial runoff at the same location to establish baselines. A larger sample size would have also provided more insight into the detection of fecal indicator PMMoV in the sand and seawater samples. Moreover, the beach sands in this study were only collected from the supratidal zone immediately above the tidal zone. The microbial communities at different zones of the beach may have significant differences in composition, which should warrant future studies to better understand indigenous versus disrupted microbial communities in coastal sands and seawater [35,36,48,52].
To better understand the risk of ARGs in recreational beaches, it is necessary to combine the molecular method with culture-based approaches to determine the infectivity of ARG-harboring bacteria. The PICRUSt2 program was primarily developed to predict metabolic pathways and functional gene profiles associated with each bacterial sequence based on reference genomes and databases of previous work [21]. Metagenomic sequencing would reveal a more accurate prediction of functions and genes associated with microbial communities.
Furthermore, only one type of culture media was used for isolation and quantification of fungi, which is unlikely to recover all the fungi because of the diverse culture requirements of different types of fungi, including growth speed. Sequencing using an 18S rRNA target also may not be a good approach to identify fungal communities because of the over-domination of other eukaryotic organisms in marine samples. Combining ITS PCR with amplicon-based sequencing would retrieve more diversity and representation of fungal sequences. Also, fungal-specific PCR primers targeting critically concerning fungal pathogens, such as Candidozyma auris, have the potential to retrieve fungal species with low concentrations in total environmental biomass [57]. A previous study also showed that fungal ITS-based sequencing correlated fungal pathogens with heavy metal contamination in beach sand [58]. As we continue to refine methods to investigate the abundance and diversity of fungal species in beach sand, we should also keep in mind that antifungal resistance in beach sands and waters is a rising public health concern in coastal environments. For example, Aspergillus isolated from beach sands and Candida from seawater have shown antifungal resistance to drugs such as amphotericin B, posaconazole and itraconazole [45,59]. Future studies should consider this as a public health risk in environmental monitoring of microbes in beach sands and waters. More research is also needed on the long-term changes in sand microbial communities and the resilience of ecosystem health from extreme weather events caused by climate change around the globe.

4. Conclusions

This study presented a perspective of different environmental health concerns at six recreational beaches in the U.S. and Australia. Higher concentrations of enterococci were observed in beach sands than in seawater across all locations, with two water samples surpassing the U.S. EPA marine water quality guidelines. At the same time, the lack of correlation between PMMoV and enterococci concentrations beckons future research to understand which microbial markers can track human-specific fecal contamination and human health microbial threats in beach sand compared to adjacent recreational waters. Phylogenetic analysis of bacterial communities suggests pathogenic genera are a very minor fraction of the microbiome in the beach sand and adjacent seawater. Although phylogenetic-based sequencing was not sufficiently sensitive to reveal fecal contamination in comparison with the culture-based enterococci assay, the phylogenetic profile provides a microbiome signature that distinguishes beach sand collected from different sites. Fungal sequencing revealed a high abundance of Aspergillus, which has recently been suggested as a pathogen and poses public health risks to beachgoers. Predicted ARG profiles also shed light on the importance of investigating clinically important antibiotic resistance in the human and beach sand environment interface, as well as using metagenomic sequencing in future studies. Beach sand could be a reservoir to link marine ARGs to humans and further spread the resistance of the marine microbiome to the human microbiome.

Supplementary Materials

The following supporting information can be downloaded at: https://www.mdpi.com/article/10.3390/environments13070388/s1, S.1: additional description of conditions of sampling sites and sample measurements; S.2: equations used for computing enterococci and fungal concentrations by culture assay; Figure S1: map displaying the sample locations; Figure S2: rarefaction curve of 16S rRNA gene sequencing data; Table S1: physical measurements of seawater and supratidal sand; Table S2: environmental conditions during sampling; Table S3: human and animal counts during sampling; Table S4: bacterial sequence reads counts and Shannon alpha-diversity indices of bacterial communities per sample across beaches; Table S5: beta-diversity matrix values of bacterial communities across samples; Table S6: OTU table of bacterial sequences and taxonomy; Table S7: OTU table of fungal sequences and taxonomy; Table S8: PICRUSt2 genome function counts of ARGs per antibiotic class across bacterial phyla.

Author Contributions

Conceptualization, S.J., A.D.G., H.M.S.-G., J.S.M. and K.R.; methodology, S.J., A.D.G., H.M.S.-G., J.S.M. and K.R.; software, A.D.G.; validation, S.J. and A.D.G.; formal analysis, A.D.G.; investigation, S.J., A.D.G., H.M.S.-G., J.S.M. and K.R.; resources, S.J., A.D.G., H.M.S.-G., J.S.M. and K.R.; data curation, A.D.G.; writing—original draft preparation, A.D.G. and S.J.; writing—review and editing, S.J., A.D.G., H.M.S.-G., J.S.M., J.B. and K.R.; visualization, S.J. and A.D.G.; supervision, S.J.; project administration, S.J.; funding acquisition, S.J. and A.D.G. All authors have read and agreed to the published version of the manuscript.

Funding

The funding for A.D.G. is provided by the National Science Foundation (NSF) Graduate Research Fellowship and the NSF INTERN program. S.J. was supported by NSF 2128480, and EPA-G2021-STAR-A1, 84025701.

Data Availability Statement

The original contributions presented in this study are included in the article/Supplementary Materials. Further inquiries can be directed to the corresponding author.

Acknowledgments

The authors would like to thank A. Green for assistance in sample collection and processing; A. Pappu in the Jiang lab for valuable comments and assistance with statistical analysis; M. Brock in A. Martiny lab; K. Whiteson, and C. Weihe in the UCI Microbiome Initiative; J. Martiny for metagenome data analysis; and M. Oakes at UC Irvine for assistance with RT-ddPCR and analysis.

Conflicts of Interest

The authors declare no conflicts of interest.

References

  1. Walker, J.R.; Woods, A.C.; Pierce, M.K.; Steichen, J.L.; Quigg, A.; Kaiser, K.; Labonté, J.M. Functionally diverse microbial communities show resilience in response to a record-breaking rain event. ISME Commun. 2022, 2, 81. [Google Scholar] [CrossRef] [PubMed]
  2. Yang, S.; Chen, C.; Chu, K. Fecal indicators, pathogens, antibiotic resistance genes, and ecotoxicity in Galveston Bay after Hurricane Harvey. J. Hazard. Mater. 2021, 411, 124953. [Google Scholar] [CrossRef] [PubMed]
  3. Environmental Protection Agency. Recreational Water Quality Criteria; Environmental Protection Agency: Washington, DC, USA, 2012; pp. 6–13. Available online: https://www.epa.gov/sites/default/files/2015-10/documents/rwqc2012.pdf (accessed on 1 September 2020).
  4. Zhang, T.; Breitbart, M.; Lee, W.H.; Run, J.Q.; Wei, C.L.; Soh, S.W.; Hibberd, M.L.; Liu, E.T.; Rohwer, F.; Ruan, Y. RNA viral community in human feces: Prevalence of plant pathogenic viruses. PLoS Biol. 2006, 4, e3. [Google Scholar] [CrossRef] [PubMed]
  5. Rosario, K.; Symonds, E.M.; Sinigalliano, C.; Stewart, J.; Breitbart, M. Pepper mild mottle virus as an indicator of fecal pollution. Appl. Environ. Microbiol. 2009, 75, 7261–7267. [Google Scholar] [CrossRef] [PubMed]
  6. Amarasiri, M.; Sano, D.; Suzuki, S. Understanding human health risks caused by antibiotic resistant bacteria (ARB) and antibiotic resistance genes (ARG) in water environments: Current knowledge and questions to be answered. Crit. Rev. Environ. Sci. Technol. 2020, 50, 2016–2059. [Google Scholar] [CrossRef]
  7. Nielsen, M.; Wang, N.; Jiang, S. Acquisition of antibiotic resistance genes on human skin after swimming in the ocean. Environ. Res. 2021, 197, 110978. [Google Scholar] [CrossRef] [PubMed]
  8. Halliday, E.; Gast, R.J. Bacteria in beach sands: An emerging challenge in protecting coastal water quality and bather health. Environ. Sci. Technol. 2011, 45, 370–379. [Google Scholar] [CrossRef] [PubMed]
  9. Heaney, C.D.; Sams, E.; Wing, S.; Marshall, S.; Brenner, K.; Dufour, A.P.; Wade, T.J. Contact With Beach Sand Among Beachgoers and Risk of Illness. Am. J. Epidemiol. 2009, 170, 164–172. [Google Scholar] [CrossRef] [PubMed]
  10. Yamahara, K.M.; Layton, B.A.; Santoro, A.E.; Boehm, A.B. Beach Sands along the California Coast Are Diffuse Sources of Fecal Bacteria to Coastal Waters. Environ. Sci. Technol. 2007, 41, 4515–4521. [Google Scholar] [CrossRef] [PubMed]
  11. Vogel, C.; Rogerson, A.; Schatz, S.; Laubach, H.; Tallman, A.; Fell, J. Prevalence of yeasts in beach sand at three bathing beaches in South Florida. Water Res. 2007, 41, 1915–1920. [Google Scholar] [CrossRef] [PubMed]
  12. Brandão, J.; Gangneux, J.P.; Arikan-Akdagli, S.; Barac, A.; Bostanaru, A.C.; Brito, S.; Bull, M.; Çerikçioğlu, N.; Chapman, B.; Efstratiou, M.A.; et al. Mycosands: Fungal diversity and abundance in beach sand and recreational waters—Relevance to human health. Sci. Total Environ. 2021, 781, 146598. [Google Scholar] [CrossRef] [PubMed]
  13. Sibanda, T.; Ramganesh, S. Taxonomic and functional analyses reveal existence of virulence and antibiotic resistance genes in beach sand bacterial populations. Arch. Microbiol. 2021, 203, 1753–1766. [Google Scholar] [CrossRef] [PubMed]
  14. World Health Organization. Guidelines on Recreational Water Quality—Volume 1: Coastal and Fresh Waters; World Health Organization: Geneva, Switzerland, 2021; Available online: https://www.who.int/publications/i/item/9789240031302 (accessed on 19 February 2025).
  15. Environmental Protection Agency. Method 1600: Enterococci in Water by Membrane Filtration Using Membrane-Enterococcus Indoxyl-β-D-Glucoside Agar (mEI); Environmental Protection Agency: Washington, DC, USA, 2009. Available online: https://www.epa.gov/sites/default/files/2015-08/documents/method_1600_2009.pdf (accessed on 1 September 2020).
  16. Ver, B.A.; Melnick, J.L.; Wallis, C. Efficient Filtration and Sizing of Viruses with Membrane Filters. J. Virol. 1968, 2, 21–25. [Google Scholar] [CrossRef] [PubMed]
  17. Wallis, C.; Melnick, J.L. Concentration of Enteroviruses on Membrane Filters. J. Virol. 1967, 1, 472–477. [Google Scholar] [CrossRef] [PubMed]
  18. Green, A.; Song, Z.; Tran, C.; Reifsnyder, S.; Rosso, D.; Hsia, P.; Melitas, N.; Holden, P.A.; Jiang, S. Community-Scale Surveillance of SARS-CoV-2: Optimizing Sampling Strategies for Centralized Wastewater Treatment Plants. Environ. Eng. Sci. 2024, 41, 7–17. [Google Scholar] [CrossRef]
  19. Haramoto, E.; Kitajima, M.; Kishida, N.; Konno, Y.; Katayama, H.; Asami, M.; Akiba, M. Occurrence of pepper mild mottle virus in drinking water sources in Japan. Appl. Environ. Microbiol. 2013, 79, 7413–7418. [Google Scholar] [CrossRef] [PubMed]
  20. Bolyen, E.; Rideout, J.R.; Dillon, M.R.; Bokulich, N.A.; Abnet, C.C.; Al-Ghalith, G.A.; Alexander, H.; Alm, E.J.; Arumugam, M.; Asnicar, F.; et al. Reproducible, interactive, scalable and extensible microbiome data science using QIIME 2. Nat. Biotechnol. 2019, 37, 852–857. [Google Scholar] [CrossRef] [PubMed]
  21. Douglas, G.M.; Maffei, V.J.; Zaneveld, J.R.; Yurgel, S.N.; Brown, J.R.; Taylor, C.M.; Huttenhower, C.; Langille, M.G.I. PICRUSt2 for prediction of metagenome functions. Nat. Biotechnol. 2020, 38, 685–688. [Google Scholar] [CrossRef] [PubMed]
  22. Le, L.T.; Huang, Z.; Whiteson, K.; Jiang, S. The occurrence and diversity of antibiotic resistance and virulence factor genes in wastewater from four North American treatment plants. Environ. Sci. Water Res. Technol. 2022, 8, 1650–1664. [Google Scholar] [CrossRef]
  23. McMurdie, P.; Paulson, J. Biomformat: An Interface Package for the BIOM File Format, R Package Version 1.40.0; Bioconductor: Seattle, WA, USA, 2026. Available online: https://bioconductor.org/packages/biomformat (accessed on 5 January 2025). [CrossRef]
  24. Charif, D.; Lobry, J.R. SeqinR 1.0-2: A Contributed Package to the R Project for Statistical Computing Devoted to Biological Sequences Retrieval and Analysis. In Structural Approaches to Sequence Evolution. Biological and Medical Physics, Biomedical Engineering; Bastolla, U., Porto, M., Roman, H.E., Vendruscolo, M., Eds.; Springer: Berlin/Heidelberg, Germany, 2007. [Google Scholar] [CrossRef]
  25. Pagès, H.; Aboyoun, P.; Gentleman, R.; DebRoy, S. Biostrings: Efficient Manipulation of Biological Strings, R Package Version 2.64.1; Bioconductor: Seattle, WA, USA, 2022. Available online: https://bioconductor.org/packages/Biostrings (accessed on 5 January 2025).
  26. Oksanen, J.; Simpson, G.; Blanchet, F.; Kindt, R.; Legendre, P.; Minchin, P.; O’Hara, R.; Solymos, P.; Stevens, M.; Szoecs, E.; et al. vegan: Community Ecology Package, R Package Version 2.6-4; The Comprehensive R Archive Network: Vienna, Austria, 2022. Available online: https://CRAN.R-project.org/package=vegan (accessed on 15 June 2022).
  27. Wickham, H. ggplot2: Elegant Graphics for Data Analysis; Springer: New York, NY, USA, 2016; Available online: https://ggplot2.tidyverse.org (accessed on 15 June 2022).
  28. Wickham, H.; François, R.; Henry, L.; Müller, K.; Vaughan, D. dplyr: A Grammar of Data Manipulation, R Package Version 1.1.4; The Comprehensive R Archive Network: Vienna, Austria, 2023. Available online: https://CRAN.R-project.org/package=dplyr (accessed on 15 June 2022).
  29. Wickham, H.; Averick, M.; Bryan, J.; Chang, W.; McGowan, L.D.; François, R.; Grolemund, G.; Hayes, A.; Henry, L.; Hester, J.; et al. Welcome to the tidyverse. J. Open Source Softw. 2019, 4, 1686. [Google Scholar] [CrossRef]
  30. Wei, T.; Simko, V. R Package ‘corrplot’: Visualization of a Correlation Matrix, Version 0.92; The Comprehensive R Archive Network: Vienna, Austria, 2021. Available online: https://github.com/taiyun/corrplot (accessed on 15 January 2023).
  31. Oshiro, R.; Fujioka, R. Sand, soil, and pigeon droppings: Sources of indicator bacteria in the waters of Hanauma Bay, Oahu, Hawaii. Water Sci. Technol. 1995, 31, 251–254. [Google Scholar] [CrossRef]
  32. Elmanama, A.A.; Fahd, M.I.; Afifi, S.; Abdallah, S.; Bahr, S. Microbiological beach sand quality in Gaza Strip in comparison to seawater quality. Environ. Res. 2005, 99, 1–10. [Google Scholar] [CrossRef] [PubMed]
  33. Yamahara, K.M.; Walters, S.P.; Boehm, A.B. Growth of Enterococci in Unaltered, Unseeded Beach Sands Subjected to Tidal Wetting. Appl. Environ. Microbiol. 2009, 75, 1517–1524. [Google Scholar] [CrossRef] [PubMed]
  34. De Giglio, O.; Narracci, M.; Apollonio, F.; Triggiano, F.; Acquaviva, M.I.; Caroppo, C.; Diella, G.; Di Leo, A.; Fasano, F.; Giandomenico, S.; et al. Microbiological and chemical characteristics of beaches along the Taranto Gulf (Ionian Sea, Southern Italy). Environ. Monit. Assess. 2022, 194, 448. [Google Scholar] [CrossRef] [PubMed]
  35. Cui, H.; Yang, K.; Pagaling, E.; Yan, T. Spatial and Temporal Variation in Enterococcal Abundance and Its Relationship to the Microbial Community in Hawaii Beach Sand and Water. Appl. Environ. Microbiol. 2013, 79, 3601–3609. [Google Scholar] [CrossRef] [PubMed]
  36. Whiley, H.; Austin, J.; da Silva, G.M.; Ross, K. Faecal indicator bacteria present in sand at South Port Beach, South Australia. J. Coast. Res. 2018, 34, 215–219. [Google Scholar] [CrossRef]
  37. Rosiles-González, G.; Almazán-Becerril, A.; Carrillo-Jovel, V.H.; Peniche-Pérez, J.C.; Caballero-Vázquez, J.A.; Moreno Valenzuela, O.A.; Bautista-García, J.E.; Leal-Bautista, R.M.; Hernández-Zepeda, C. Surveillance of Enteric Viruses, Enterococci, and PMMoV in Sargassum-Impacted Coastal Waters in the Mexican Caribbean. Food Environ. Virol. 2025, 17, 57. [Google Scholar] [CrossRef] [PubMed]
  38. Hughes, B.; Beale, D.J.; Dennis, P.G.; Cook, S.; Ahmed, W. Cross-Comparison of Human Wastewater-Associated Molecular Markers in Relation to Fecal Indicator Bacteria and Enteric Viruses in Recreational Beach Waters. Appl. Environ. Microbiol. 2017, 83, 1–16. [Google Scholar] [CrossRef] [PubMed]
  39. Calderon, J.S.; Verbyla, M.E.; Gil, M.; Pinongcos, F.; Kinoshita, A.M.; Mladenov, N. Persistence of Fecal Indicators and Microbial Source Tracking Markers in Water Flushed from Riverbank Soils. Water Air Soil Pollut. 2022, 233, 83. [Google Scholar] [CrossRef]
  40. Symonds, E.M.; Sinigalliano, C.; Gidley, M.; Ahmed, W.; McQuaig-Ulrich, S.M.; Breitbart, M. Faecal pollution along the southeastern coast of Florida and insight into the use of pepper mild mottle virus as an indicator. J. Appl. Microbiol. 2016, 121, 1469–1481. [Google Scholar] [CrossRef] [PubMed]
  41. Steele, C.W. Fungus Populations in Marine Waters and Coastal Sands of the Hawaiian, Line, and Phoenix Islands. Pac. Sci. 1967, 21, 317–331. [Google Scholar]
  42. Dunn, P.H.; Baker, G.E. Filamentous Fungal Populations of Hawaiian Beaches. Pac. Sci. 1984, 38, 232–248. [Google Scholar]
  43. Amend, A.; Burgaud, G.; Cunliffe, M.; Edgcomb, V.P.; Ettinger, C.L.; Gutiérrez, M.H.; Heitman, J.; Hom, E.F.Y.; Ianiri, G.; Jones, A.C.; et al. Fungi in the Marine Environment: Open Questions and Unsolved Problems. mBio 2019, 10, 1–15. [Google Scholar] [CrossRef] [PubMed]
  44. Walker, A.K.; Robicheau, B.M. Fungal diversity and community structure from coastal and barrier island beaches in the United States Gulf of Mexico. Sci. Rep. 2021, 11, 3889. [Google Scholar] [CrossRef] [PubMed]
  45. Babič, M.N.; Gunde-Cimerman, N.; Breskvar, M.; Džeroski, S.; Brandão, J. Occurrence, Diversity and Anti-Fungal Resistance of Fungi in Sand of an Urban Beach in Slovenia-Environmental Monitoring with Possible Health Risk Implications. J. Fungi 2022, 8, 860. [Google Scholar] [CrossRef]
  46. Orsi, W.D.; Vuillemin, A.; Coskun, Ö.K.; Rodriguez, P.; Oertel, Y.; Niggemann, J.; Mohrholz, V.; Gomez-Saez, G.V. Carbon assimilating fungi from surface ocean to subseafloor revealed by coupled phylogenetic and stable isotope analysis. ISME J. 2022, 16, 1245–1261. [Google Scholar] [CrossRef] [PubMed]
  47. Zupančič, J.C.; Babič, M.N. Microbial burden of seawater and beach sand during bathing season. Acta Biol. Slov. 2024, 67, 31–43. [Google Scholar] [CrossRef]
  48. Halliday, E.; McLellan, S.L.; Amaral-Zettler, L.A.; Sogin, M.L.; Gast, R.J. Comparison of bacterial communities in sands and water at beaches with bacterial water quality violations. PLoS ONE 2014, 9, e90815. [Google Scholar] [CrossRef] [PubMed]
  49. Nevers, M.B.; Byappanahalli, M.N.; Nakatsu, C.H.; Kinzelman, J.L.; Phanikumar, M.S.; Shively, D.A.; Spoljaric, A.M. Interaction of bacterial communities and indicators of water quality in shoreline sand, sediment, and water of Lake Michigan. Water Res. 2020, 178, 115671. [Google Scholar] [CrossRef] [PubMed]
  50. Abdelzaher, A.M.; Wright, M.E.; Ortega, C.; Solo-Gabriele, H.M.; Miller, G.; Elmir, S.; Newman, X.; Shih, P.; Bonilla, J.A.; Bonilla, T.D.; et al. Presence of Pathogens and Indicator Microbes at a Non-Point Source Subtropical Recreational Marine Beach. Appl. Environ. Microbiol. 2010, 76, 724–732. [Google Scholar] [CrossRef] [PubMed]
  51. Fang, W.; Wu, J.; Cheng, M.; Zhu, X.; Du, M.; Chen, C.; Liao, W.; Zhi, K.; Pan, W. Diagnosis of invasive fungal infections: Challenges and recent developments. J. Biomed. Sci. 2023, 30, 42. [Google Scholar] [CrossRef] [PubMed]
  52. Deligios, M.; Mazzarello, V.; Fiamma, M.; Barac, A.; Diana, L.; Ferrari, M.; Murgia, M.; Paglietti, B.; Rubino, S. Seasonal Variation in Fungi in Beach Sand in Summertime: Stintino (Italy). Int. J. Environ. Res. Public Health 2023, 20, 7134. [Google Scholar] [CrossRef] [PubMed]
  53. Hof, H. Rhodotorula spp. in the gut—Foe or friend? GMS Infect. Dis. 2019, 7, Doc02. [Google Scholar] [CrossRef] [PubMed]
  54. Mudryk, Z.; Perliński, P.; Skórczewski, P. Detection of antibiotic resistant bacteria inhabiting the sand of non-recreational marine beach. Mar. Pollut. Bull. 2010, 60, 207–214. [Google Scholar] [CrossRef] [PubMed]
  55. Zahra, Q.; Gul, J.; Shah, A.R.; Yasir, M.; Karim, A.M. Antibiotic resistance genes prevalence prediction and interpretation in beaches affected by urban wastewater discharge. One Health 2023, 17, 100642. [Google Scholar] [CrossRef] [PubMed]
  56. Šamanić, I.; Kalinić, H.; Fredotović, Z.; Dželalija, M.; Bungur, A.; Maravić, A. Bacteria tolerant to colistin in coastal marine environment: Detection, microbiome diversity and antibiotic resistance genes’ repertoire. Chemosphere 2021, 281, 130945. [Google Scholar] [CrossRef] [PubMed]
  57. Kordalewska, M.; Zhao, Y.; Lockhart, S.R.; Chowdhary, A.; Berrio, I.; Perlin, D.S. Rapid and Accurate Molecular Identification of the Emerging Multidrug-Resistant Pathogen Candida auris. J. Clin. Microbiol. 2017, 55, 2445–2452. [Google Scholar] [CrossRef] [PubMed]
  58. Selvarajan, R.; Sibanda, T.; Ullah, H.; Abia, A.L.K. Beach sand mycobiome: The silent threat of pathogenic fungi and toxic metal contamination for beachgoers. Mar. Pollut. Bull. 2024, 198, 115895. [Google Scholar] [CrossRef] [PubMed]
  59. Ramos, L.S.; Fernandes, M.F.; Santos, H.L.C.; Picão, R.C.; Branquinha, M.H.; Santos, A.L.S. Candida spp. Isolated from recreational coastal waters of Rio de Janeiro—Brazil: Focus on antifungal resistance and virulence attributes. Sci. Total Environ. 2024, 947, 174662. [Google Scholar] [CrossRef] [PubMed]
Figure 1. Concentrations of (a) enterococci and (b) PMMoV in beach sand and adjacent seawater at six urban recreational beaches. The lines across (a) represent the U.S. EPA marine water quality guideline value (35 CFU/100 mL) and the WHO guideline value for enterococci in sand (60 CFU/g, or 6000 CFU/100 g). Error bars represent the standard deviation of triplicate enterococcal cultural assays.
Environments 13 00388 g001
Figure 2. Average fungal concentration in beach sand and seawater at six urban recreational beaches. Error bars represent the standard deviation of the triplicate assay. The line represents the WHO guiding value for 89 CFU/g for total fungi in beach sand.
Environments 13 00388 g002
Figure 3. Characteristics of bacterial communities based on 16S rRNA gene OTU abundance table. (a) Shannon alpha-diversity in sand and seawater, and (b) beta-diversity via the NMDS dissimilarity plot across sample locations (color) and sample types (shape). Asterisks indicate the level of statistical significance: ** p ≤ 0.01.
Environments 13 00388 g003
Figure 4. Bacterial taxonomy based on 16S rRNA gene sequences. The relative abundance (%) of the top ten bacterial phyla in (a) sand and (b) water, as well as the potentially pathogenic bacteria in (c) sand and (d) water. In (c,d), blue, beige, red and pink boxes indicated relative abundances of 0%, <2%, ≥2%, and ≥5%, respectively.
Environments 13 00388 g004
Figure 5. The fungal taxonomy based on 18S rRNA gene sequences at each sample location: (a,b) the relative abundance of the fungus among all the eukaryotic kingdoms found in sand and water, respectively; (c,d) the top ten fungal genera in sand and water.
Environments 13 00388 g005
Figure 6. Diversity and abundance of predicted ARGs. (a) The Shannon diversity index for the ARGs in sand and seawater samples per sample location. The relative abundance of the antibiotic resistance gene classes is also shown in (b) for sand and (c) for water (FCA = fluoroquinolone, quinolone, florfenicol, chloramphenicol, and amphenicol; MLSB = macrolides, lincosamide, and streptogramin B).
Environments 13 00388 g006
Table 1. Sample collection information.
Sample Location
(Beach, City, State, Country)
Site IDCoordinatesProximal Urban River OutflowSample Collection Date
Miami Beach, Miami, Florida, U.S.MB25°46′29.5″ N, 80°7′53.7″ WMiami River19 July 2020
Golden Gardens Park, Seattle, Washington, U.S.GG47°41′23.1″ N, 122°24′12.1″ WShilshole Bay27 August 2020
Newport Beach, Newport Beach, California, U.S.NB33°37′41.5″ N, 117°57′27.6″ WSanta Ana River30 September 2020
North Star Beach, Newport Beach, California, U.S.NS33°37′27.2″ N, 117°53′36.6″ WNewport Back Bay19 October 2020
Christies Beach, Christies Beach, Adelaide, Aus.CB35°7′44.5″ S, 138°28′9.4″ ESt. Vincent Gulf28 October 2020
Seacliff Beach, Seacliff Beach, Adelaide, Aus.SB35°1′53.1″ S, 138°31′0.4″ ESt. Vincent Gulf28 October 2020
Disclaimer/Publisher’s Note: The statements, opinions and data contained in all publications are solely those of the individual author(s) and contributor(s) and not of MDPI and/or the editor(s). MDPI and/or the editor(s) disclaim responsibility for any injury to people or property resulting from any ideas, methods, instructions or products referred to in the content.