Article

Accumulated Land Use and Land Cover Anthropization Between 1985 and 2023 in the Soure–Salvaterra Region, Brazilian Amazon: A Bivariate Local Moran’s I Approach

by
Ítala Duam Souza Narusawa
1,*,
Nelson Ken Narusawa Nakakoji
2,
João Fernandes da Silva Júnior
2,
Gabriel Garreto dos Santos
3,
João Paulo Ferreira Neris
4,
Pedro Guerreiro Martorano
2,
Alexandre da Trindade Lélis
5,
Rômulo José Alencar Sobrinho
2,
Alessandra Noelly Reis Lima
2,
Welliton de Lima Sena
6,
Rose Luiza Moraes Tavares
7,
Fábio Júnior de Oliveira
8,
Thais Gleice Martins Braga
9 and
Eliseu José Weber
1
1
Graduate Program in Remote Sensing (PPGSR), Vale Campus, Federal University of Rio Grande do Sul (UFRGS), Porto Alegre 91501-970, RS, Brazil
2
Graduate Program in Agronomy (PGAGRO), Belém Campus, Federal Rural University of the Amazon (UFRA), Belém 66077-830, PA, Brazil
3
Graduate Program in Crop Science, Department of Agronomy (DAA), Federal University of Viçosa (UFV), Viçosa 36570-900, MG, Brazil
4
Graduate Program in Plant Production, Center for Agricultural Sciences and Technologies (CCTA), State University of Northern Rio de Janeiro (UENF), Campos dos Goytacazes 28013-602, RJ, Brazil
5
Graduate Program in Forest Sciences (PPGCF), Belém Campus, Federal Rural University of the Amazon (UFRA), Belém 66077-830, PA, Brazil
6
Castanhal Campus, Federal Institute of Education, Science and Technology of Pará (IFPA), Castanhal 68740-970, PA, Brazil
7
Graduate Program in Crop Production, Faculty of Agronomy, University of Rio Verde (UniRV), Rio Verde 75901-970, GO, Brazil
8
Capitão Poço Campus (CCP), Federal Rural University of the Amazon (UFRA), Capitão Poço 68650-000, PA, Brazil
9
Cyberspace Institute (ICIBE), Belém Campus, Federal Rural University of the Amazon (UFRA), Belém 66077-830, PA, Brazil
*
Author to whom correspondence should be addressed.
Environments 2026, 13(7), 378; https://doi.org/10.3390/environments13070378
Submission received: 11 May 2026 / Revised: 23 June 2026 / Accepted: 23 June 2026 / Published: 4 July 2026
(This article belongs to the Section Environmental Monitoring and Management)

Abstract

Land use and land cover (LULC) changes are major drivers of environmental transformation in sensitive regions, such as the Marajó Archipelago in the Brazilian Amazon. This study assessed accumulated anthropization of LULC in the Immediate Geographic Region of Soure–Salvaterra, Eastern Amazon, between the reference years 1985 and 2023, using MapBiomas data and spatial statistical techniques. Bivariate Local Moran’s I (LISA) was applied to evaluate intertemporal spatial associations between areas classified as natural in 1985 and anthropized in 2023. In this approach, High–Low indicates natural areas associated with low anthropization in 2023, whereas High–High indicates areas where natural cover in 1985 was spatially associated with higher anthropization in 2023. The results indicated a strong predominance of High–Low, with values above 94% in all municipalities and up to 99.86% in Santa Cruz do Arari. In contrast, High–High had localized concentrations in Salvaterra (3.53%), Cachoeira do Arari (1.28%), and Soure (1.16%), especially in coastal zones and inland sectors. Low–Low, associated with lower anthropogenic pressure or possible signs of natural regeneration, was extremely low (≤0.0004%). These findings indicate that LISA is useful for identifying local LULC patterns and supporting environmental assessment and territorial planning in tropical regions.

1. Introduction

Changes in land use and land cover (LULC) are among the main drivers of environmental transformation in the Amazon, especially in sensitive regions such as the Marajó Archipelago. The Immediate Geographic Region of Soure–Salvaterra, located in the state of Pará, Brazil, stands out for its environmental and social relevance, as it is predominantly composed of mangrove ecosystems, floodplain forests, and natural grasslands, which harbor high biodiversity and play a fundamental role in climate regulation and ecological balance [1,2,3].
The region is also recognized as the main tourist hub of the Marajó Archipelago, favored by its proximity to the capital city of Belém [4]. Its municipalities encompass extensive natural areas, including beaches, ecological trails, and enterprises such as farm hotels, which provide direct contact with nature and local culture [4,5,6]. However, the intensification of these activities, associated with the expansion of agricultural and livestock activities and infrastructure, has contributed to the advance of anthropization, resulting in changes in landscape dynamics and greater pressure on natural ecosystems.
In recent decades, this process has intensified, driven by population growth and the expansion of productive activities and infrastructure [4,6,7,8]. These changes have promoted significant alterations in land use, with direct implications for natural resources and regional sustainability. When not adequately assessed, such changes can lead to irreversible environmental degradation, affecting not only local ecosystems but also the quality of life of populations that depend on these resources [9,10].
Assessing LULC changes is essential for understanding anthropization processes and their environmental effects [11]. In this context, remote sensing has become an essential tool, enabling the generation of standardized historical datasets, such as those made available by the MapBiomas project [12]. In addition, spatial analysis methods, such as spatial autocorrelation, make it possible to identify patterns and priority areas relevant to environmental planning and management [13,14]. Despite these advances, studies using bivariate spatial autocorrelation approaches to assess the relationship between natural and anthropized areas at a local scale in the Amazon remain limited, which hinders the understanding of spatial processes associated with landscape transformation and their environmental impacts.
Based on the regional context, we expected accumulated anthropization to be spatially concentrated in specific coastal, urban, peri-urban, and agricultural expansion sectors, rather than being homogeneously distributed across the region. Therefore, this study assessed accumulated LULC anthropization in the Immediate Geographic Region of Soure–Salvaterra, Eastern Amazon, between the reference years 1985 and 2023, using MapBiomas data and spatial statistical techniques to evaluate intertemporal spatial associations between natural areas in 1985 and anthropized areas in 2023.

2. Materials and Methods

2.1. Study Area

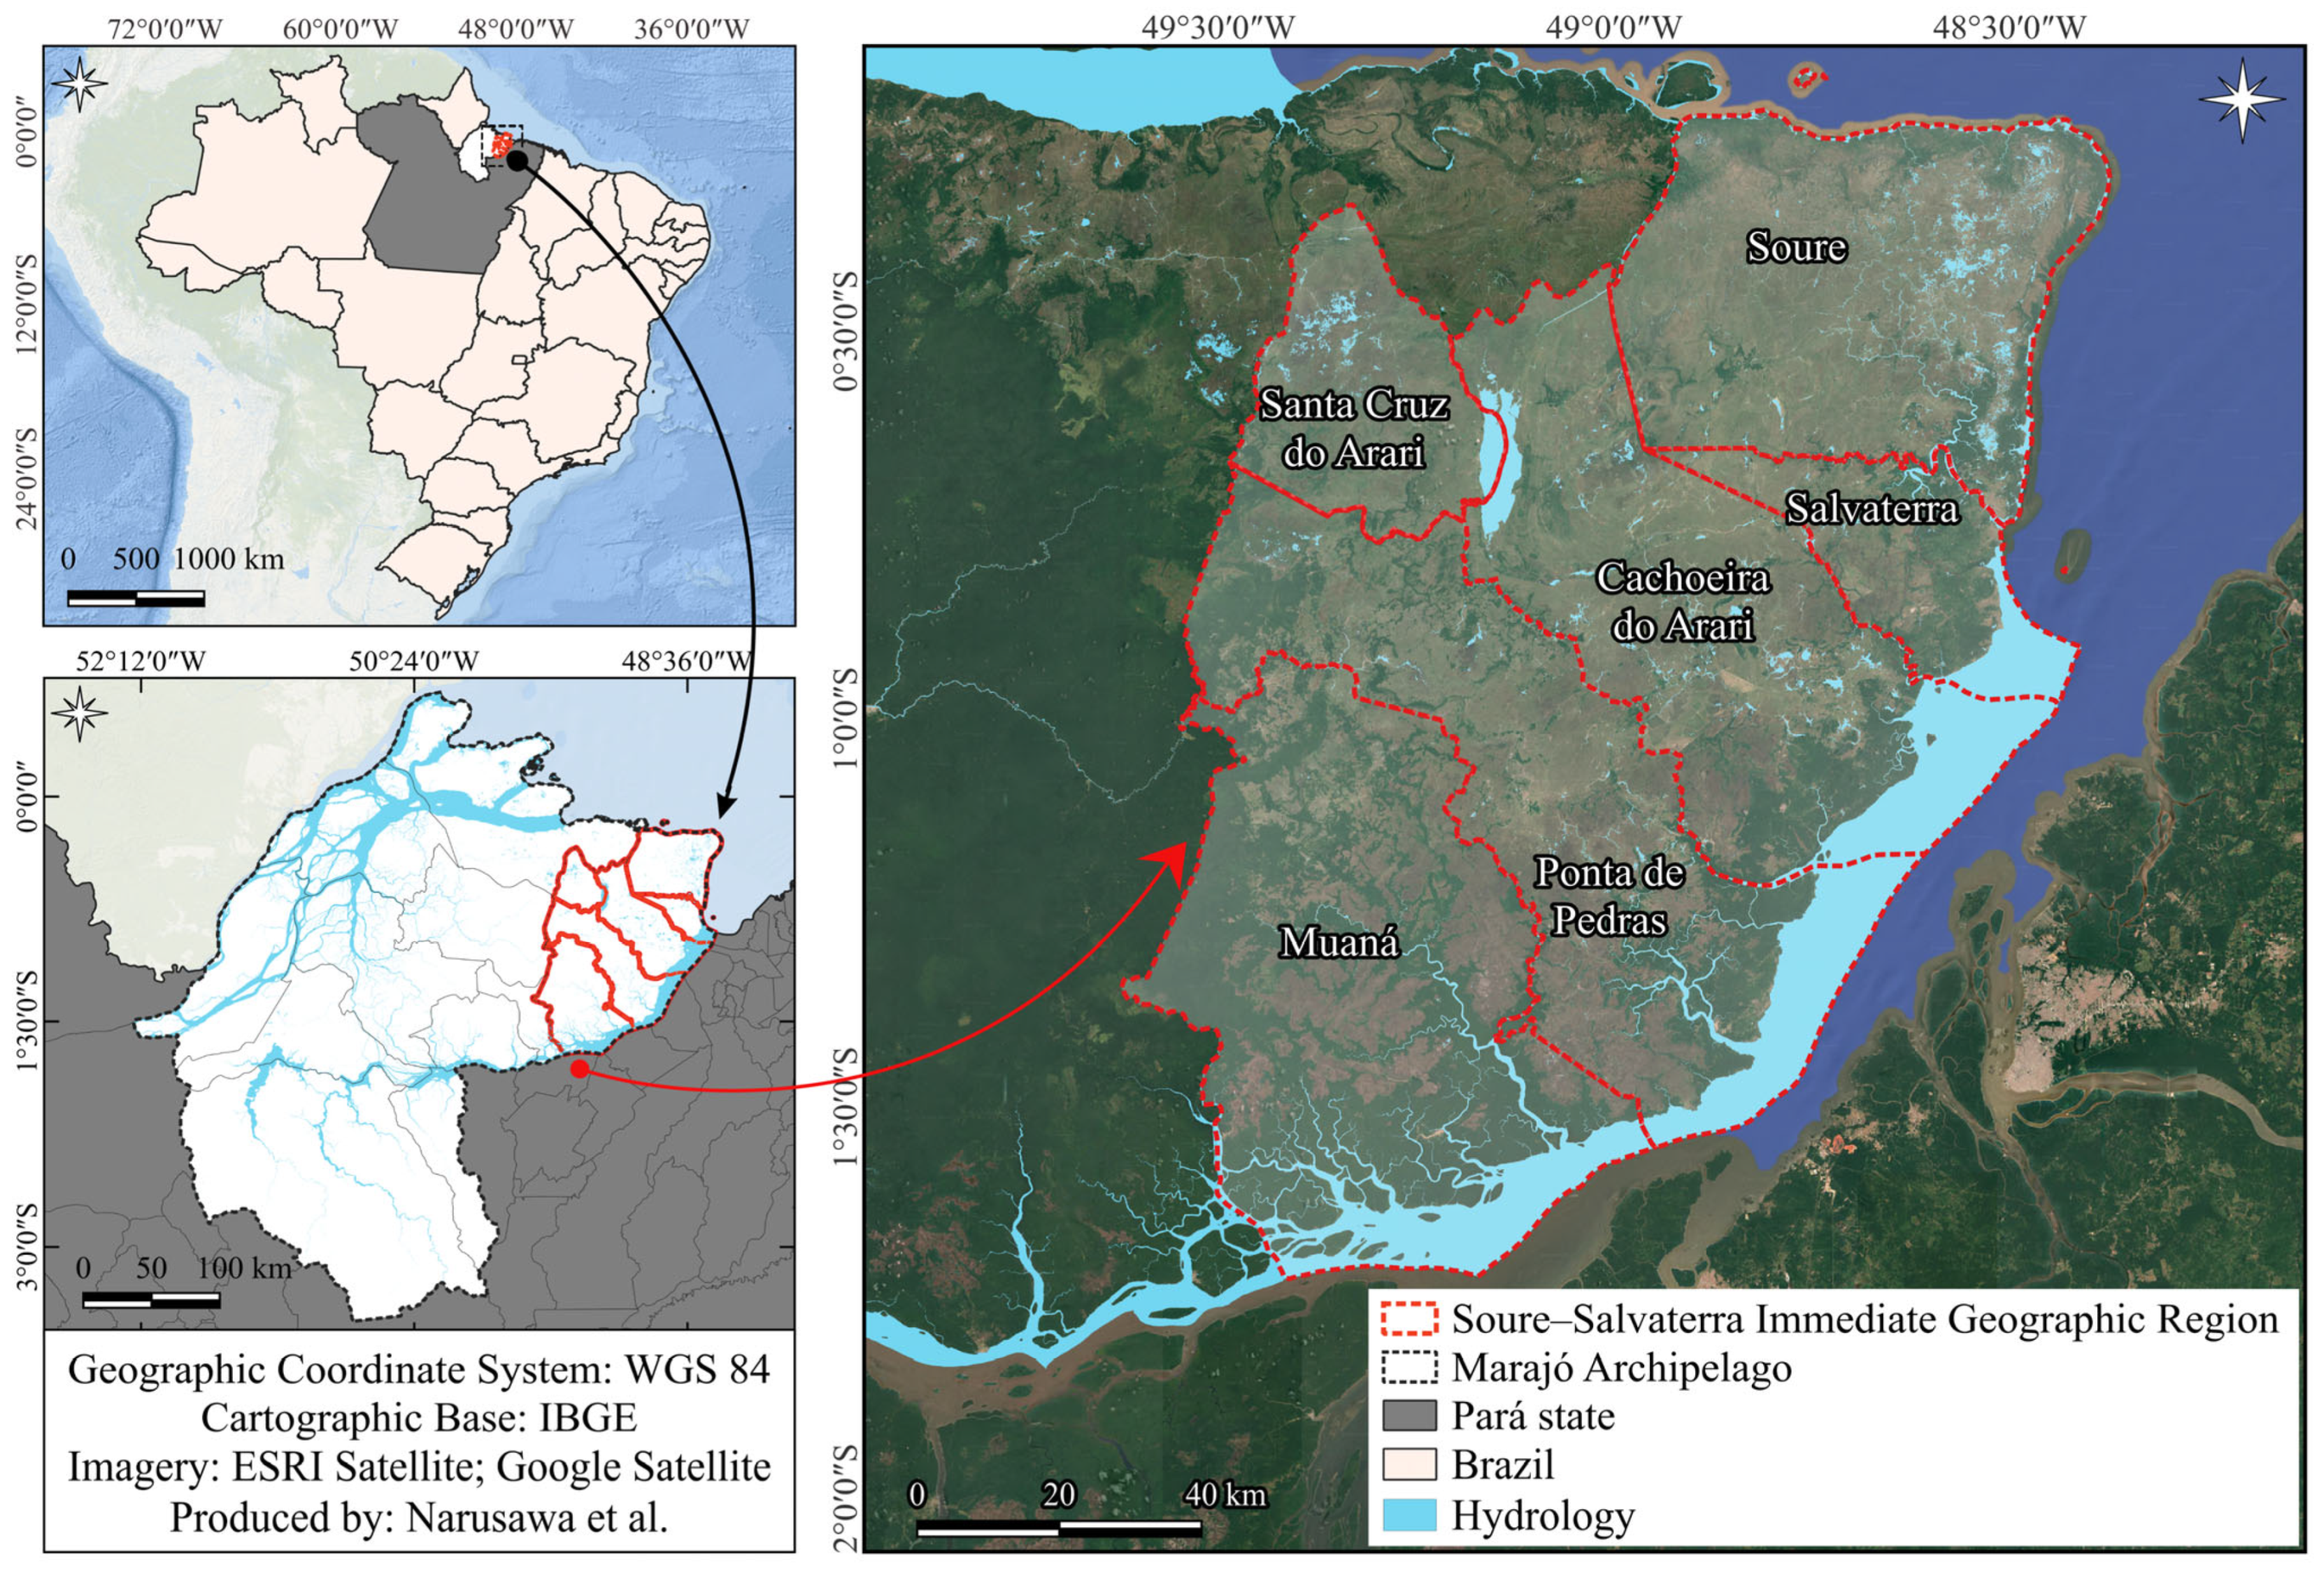
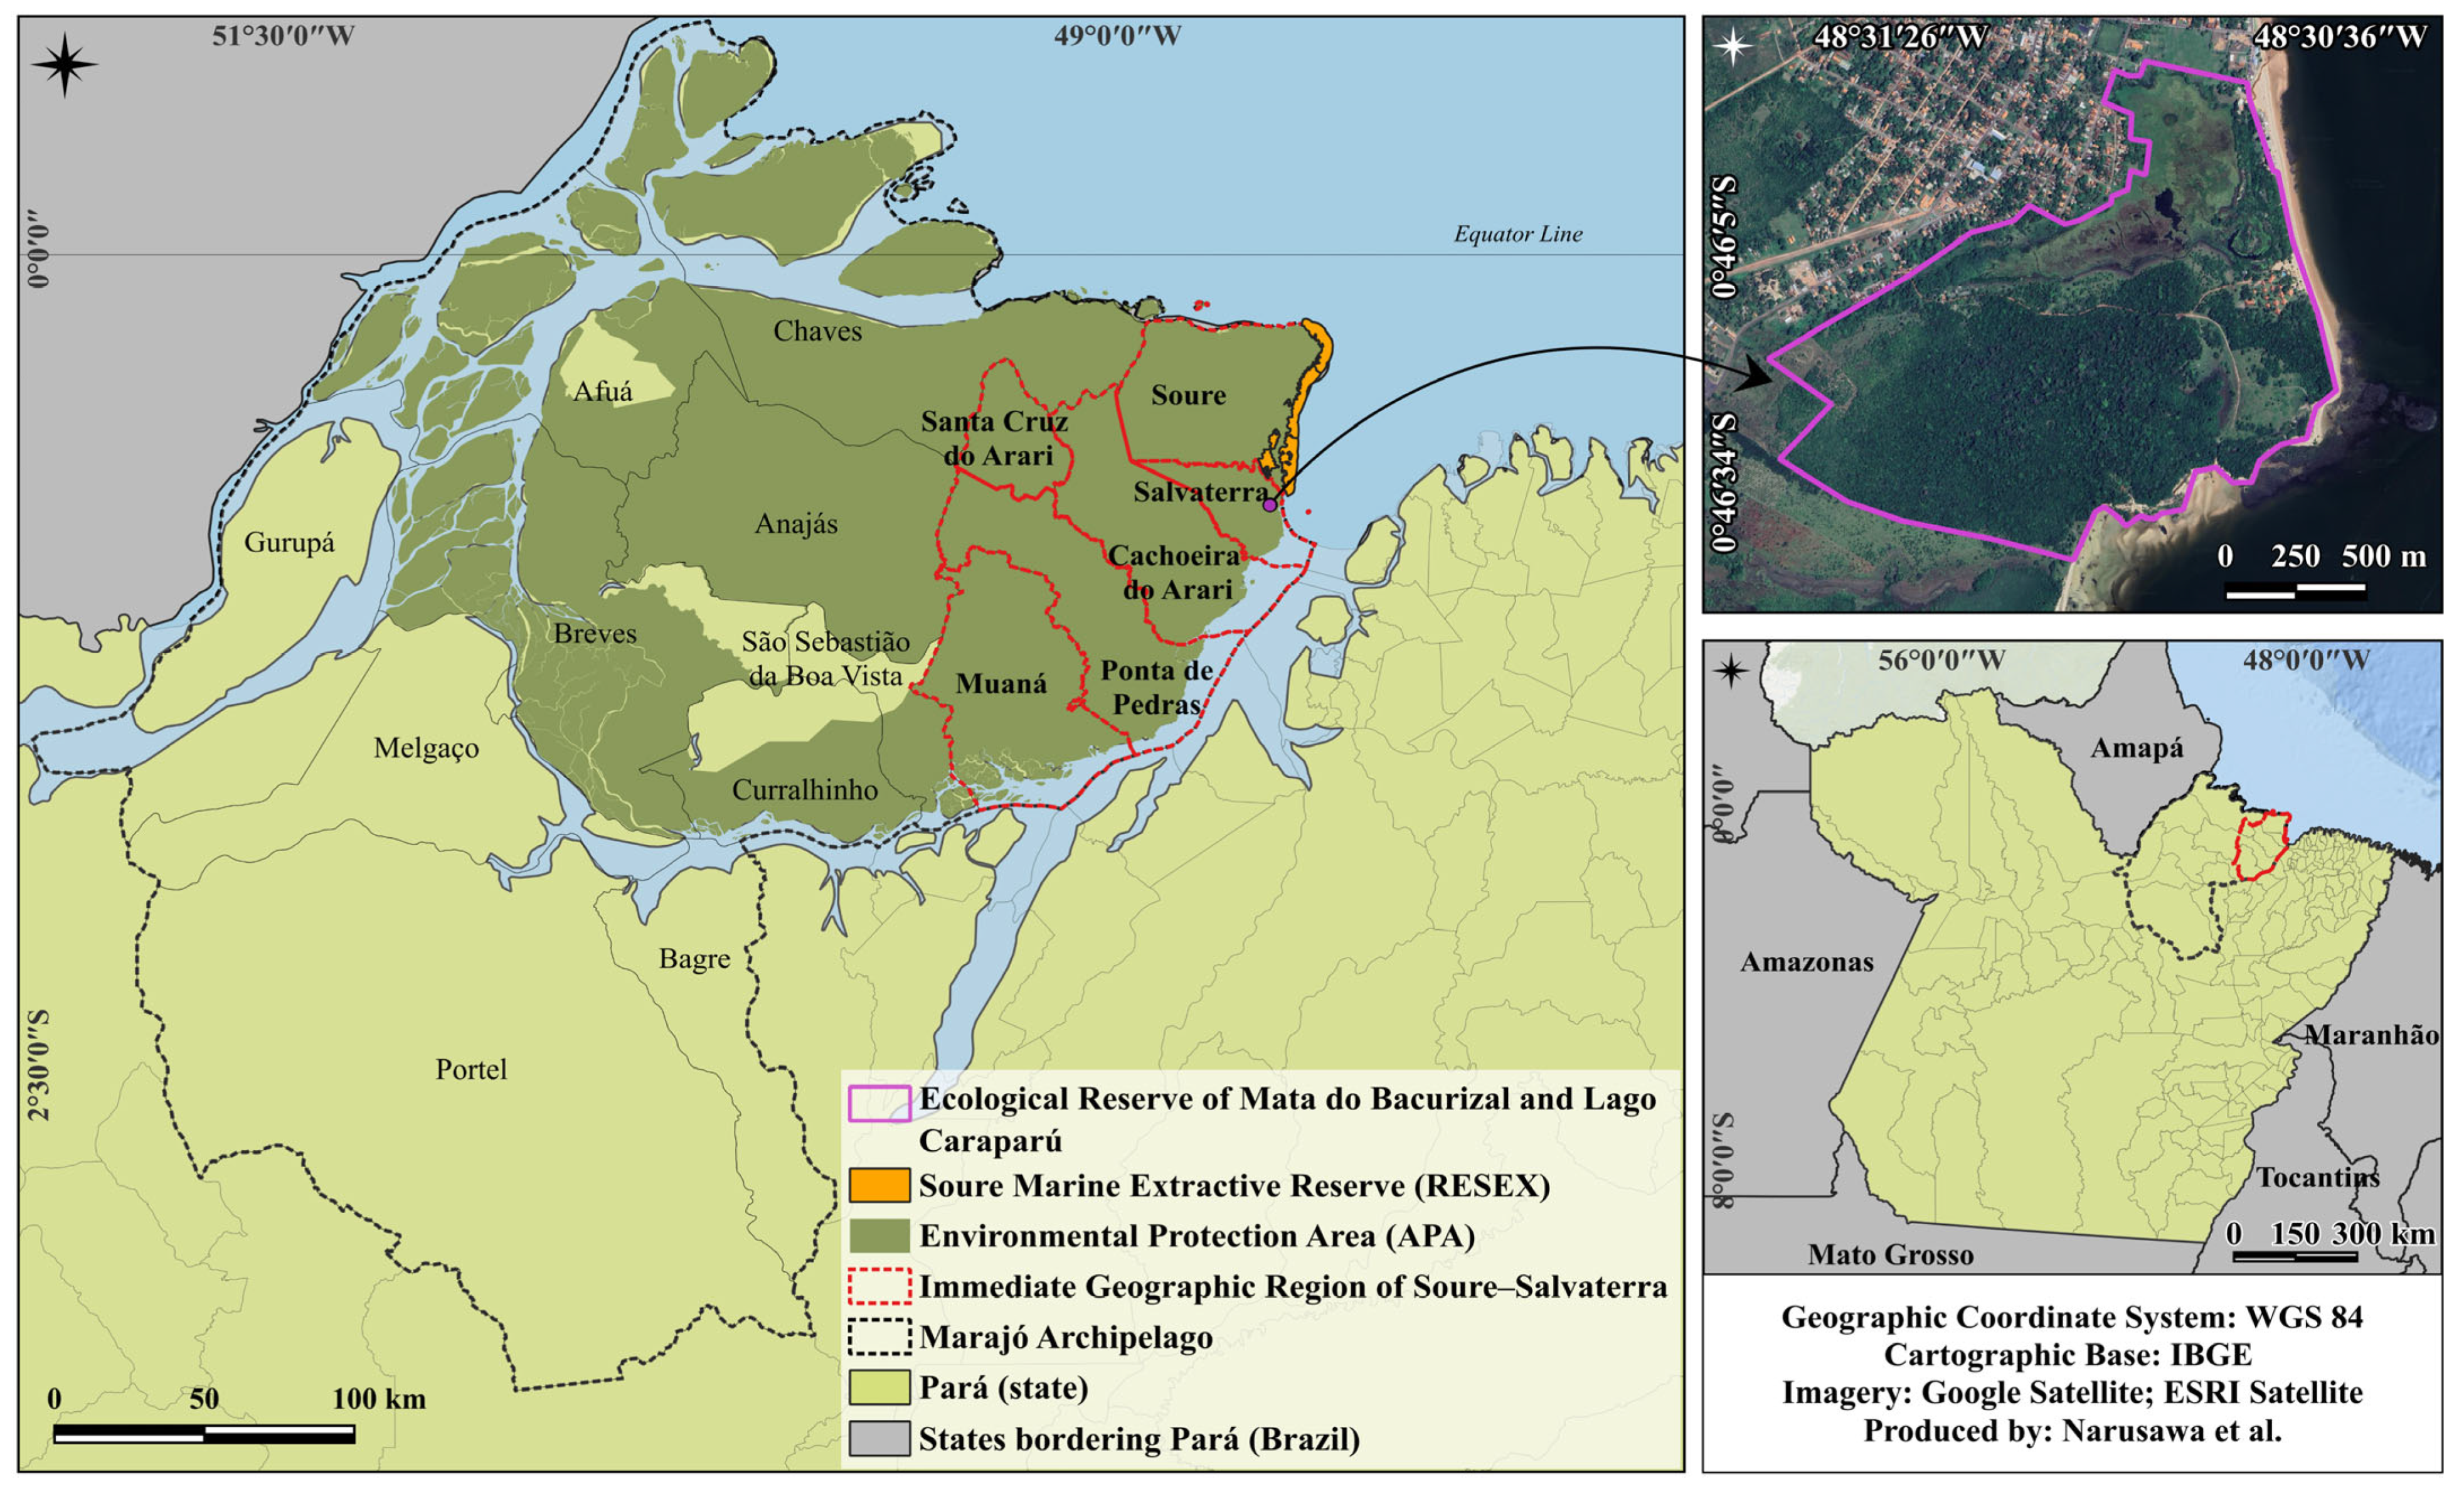
The Immediate Geographic Region of Soure–Salvaterra is located in the Marajó Archipelago, in the state of Pará, Brazil, between 0°09′49.23″ and 1°43′09.97″ S latitude and 48°22′28.52″ and 49°37′24.19″ W longitude [15]. This region comprises the municipalities of Soure, Salvaterra, Cachoeira do Arari, Santa Cruz do Arari, Muaná, and Ponta de Pedras, covering a total area of approximately 15,860 km2 and a population of 150,111 inhabitants, according to the 2022 Brazilian Demographic Census [16] (Figure 1). Situated within the Intermediate Geographic Region of Breves, the area has economic and environmental relevance, particularly due to water buffalo farming, artisanal fishing, tourism, and the presence of protected areas that contribute to the conservation of local biodiversity [17].

2.2. Image Acquisition

LULC maps from Collection 9 of the MapBiomas project were used [12], covering two reference years: 1985 and 2023. MapBiomas uses imagery from the Landsat 5 Thematic Mapper (TM) (Hughes Santa Barbara Research Center, Goleta, CA, USA), Landsat 7 Enhanced Thematic Mapper Plus (ETM+) (Raytheon Santa Barbara Remote Sensing, Santa Barbara, CA, USA), and Landsat 8 Operational Land Imager/Thermal Infrared Sensor (OLI/TIRS) (Ball Aerospace & Technologies Corporation, Boulder, CO, USA; NASA Goddard Space Flight Center, Greenbelt, MD, USA), with a spatial resolution of 30 m. The mapping is based on the Random Forest algorithm and processed on the Google Earth Engine platform [18]. Map accuracy is estimated from 85,000 annual samples, following the good validation practices proposed by Olofsson et al. [19] and Stehman [20,21,22]. For the Amazon biome, Collection 9 presents an overall accuracy of 96.8%, with 2.2% allocation disagreement and 1.0% area disagreement [22].

2.3. Image Classification and Processing

After acquiring the LULC maps, the raster files were clipped to the area of interest and reclassified into a dichotomous classification, distinguishing natural areas from anthropized areas using QGIS software (version 3.34.8-Prizren) [23] and the R programming language (version 4.2.2) [24]. For 1985, natural areas were assigned a value of 1, while anthropized areas were assigned a value of 0. For 2023, this coding was inverted, with anthropized areas assigned a value of 1 and natural areas assigned a value of 0, as shown in Table 1. This strategy was adopted to represent the intertemporal association between the initial natural condition and the final anthropized condition, allowing the assessment of spatial patterns consistent with accumulated anthropization between the two reference years.
Spatial analysis began after the reclassification of the raster data. Preprocessing was performed in QGIS by converting the reclassified 1985 raster into a regular grid of points based on the central coordinates of each pixel, while preserving the original spatial resolution of the data. These points were used as the basis for extracting the corresponding values from the 2023 raster, resulting in a sampling table containing the natural and anthropized area classes for both years. The minimal dataset used in the study is provided in Table S1.
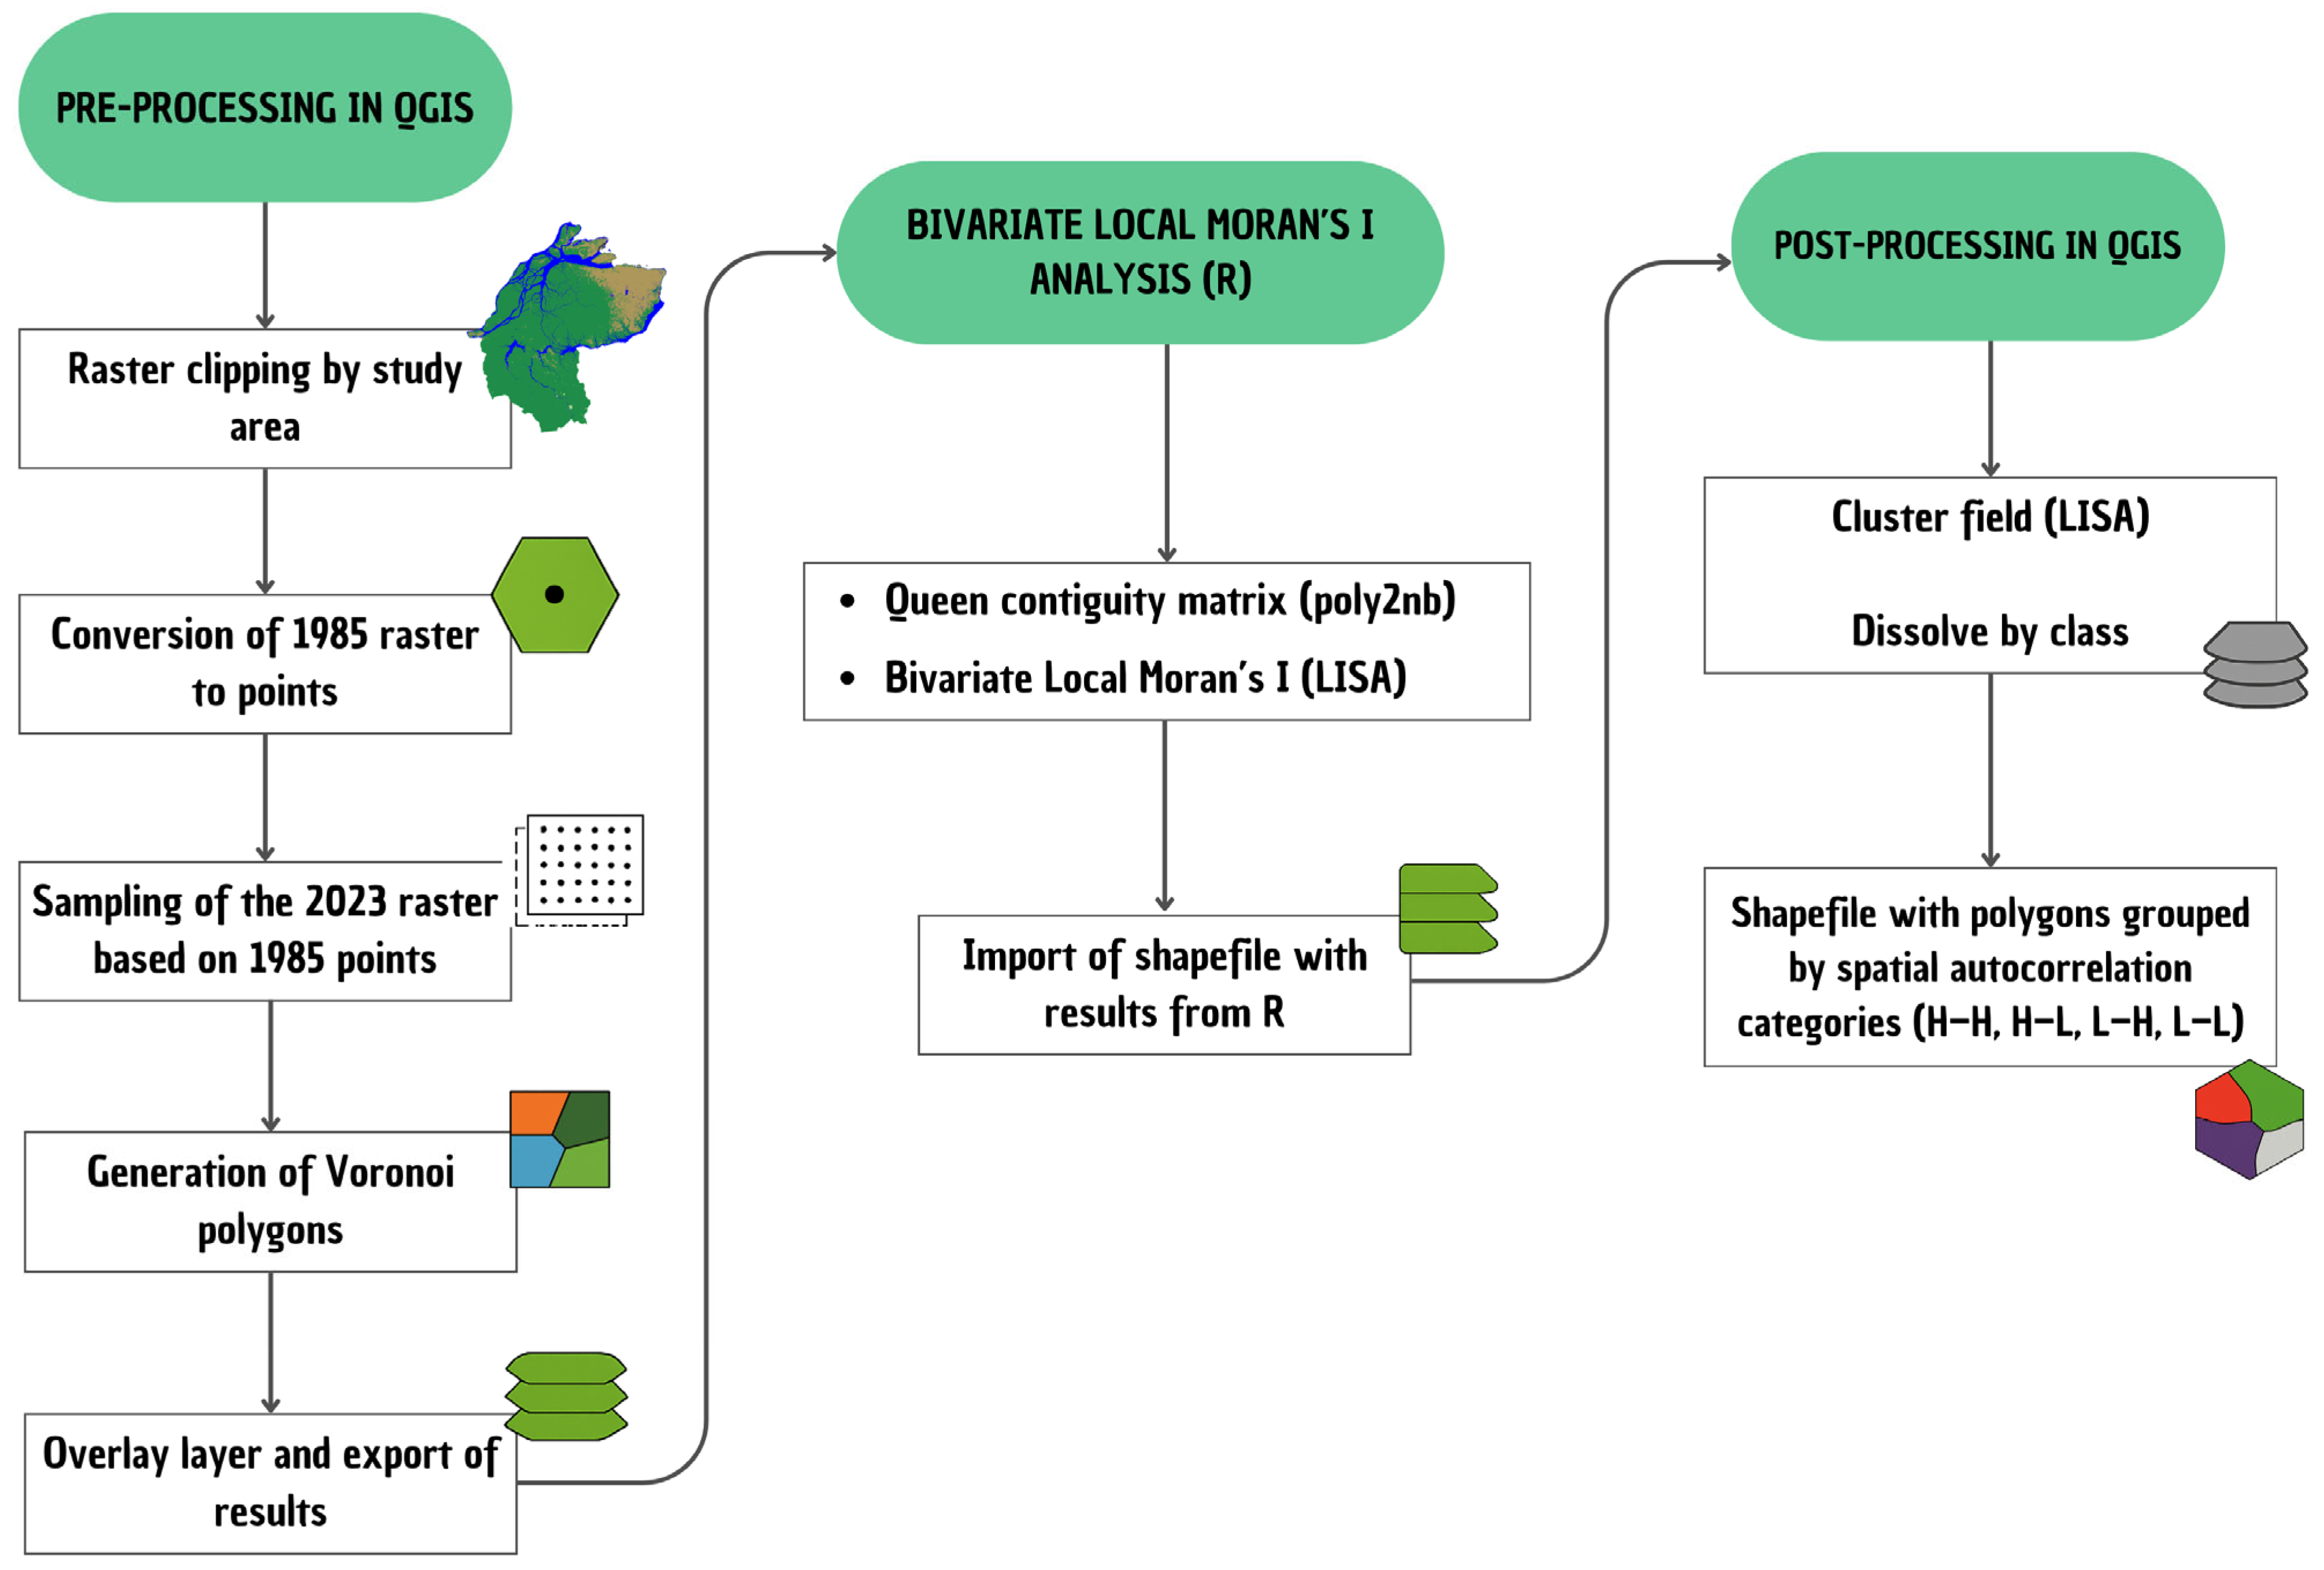
Based on this point grid, Voronoi polygons were generated, in which each polygon delimits the area of influence of a sampled point and inherits its respective thematic attributes. This approach was adopted to minimize possible geometric imperfections associated with the direct vectorization of raster data, ensuring greater accuracy in spatial representation and consistency in the subsequent stage of the analysis. The adopted methodological flowchart is presented in Figure 2.
In the second phase of the process, the Bivariate Local Moran’s I analysis was performed in the R programming language. The vector layer resulting from preprocessing was imported into the R environment, where the Bivariate Local Moran’s I (LISA) was calculated based on the definition of a Queen-type neighborhood matrix using the poly2nb function, followed by classification into spatial autocorrelation quadrants. The vector layer containing the results was then reimported into QGIS, and an additional field was created to identify the clusters. Subsequently, the polygons were dissolved according to the groups defined in the analysis, resulting in a final vector layer with areas grouped by spatial autocorrelation category.
The resulting categories were classified into four main patterns: High–High, High–Low, Low–High, and Low–Low. Table 2 presents the interpretation of these categories, considering the association between natural areas in 1985 and anthropized areas in 2023. Although the method does not directly represent pixel-by-pixel conversion of LULC classes, the observed patterns allow the identification of intertemporal spatial associations between the initial natural condition in 1985 and the final anthropized condition in 2023, consistent with accumulated anthropization between the two reference years.

2.4. Bivariate Spatial Autocorrelation Analysis

To calculate the Bivariate Local Moran’s I, the spatial weights matrix was first constructed. In this study, Queen contiguity was adopted, in which polygons sharing any boundary segment or vertex, even minimally, are considered neighbors. Thus, considering a set of n polygons {Ai, …, Aj}, the matrix of spatial weights W was constructed, with dimension (n × n), in which each element Wij assumes a value of 1 when there is a neighborhood between the polygons i and j, and 0 otherwise [25,26]. Subsequently, the matrix was row-standardized so that the sum of the weights for each spatial unit was equal to 1, as expressed in Equation (1).
j W i j = 1
where the sum of the elements in each row of the Wij matrix is equal to 1.
The underlying hypothesis is to investigate whether the values of a variable observed in a spatial unit, represented in this study by natural areas, are associated with the values of another variable observed in neighboring spatial units, represented by anthropized areas [25,26]. Initially, spatial autocorrelation was evaluated using Global Moran’s I, which expresses the degree of linear association between the observed values and the spatially weighted mean of neighboring values. The formulation of this statistic is presented in Equation (2).
I = i j ( x i x ¯ ) W i j ( y j y ¯ ) i ( x i x ¯ ) 2  
where xi and yj are the values of the variables of interest at locations i and j, respectively, x ¯ and y ¯ are the mean values of the respective variables, and the Wij spatial weight between locations i and j, row-standardized so that each row sums to 1.
Global Moran’s I provides an average measure for the entire study area. However, it can mask local patterns of association, such as spatial clusters and outliers. Therefore, the global indicator was decomposed into the local contribution of each observation, allowing the identification of four spatial autocorrelation categories: High–High, High–Low, Low–High, and Low–Low [27,28]. The mathematical expression of the Bivariate Local Moran’s I is presented in Equation (3).
I i = ( x i x ¯ ) j W i j ( y j y ¯ ) i ( x i x ¯ ) 2 n
where Ii is the Local Moran’s I for spatial unit i, n is the total number of spatial units, xi and yj are the values of the variables of interest at locations i and j, respectively, x ¯ and y ¯ are the mean values of the respective variables, and Wij is the spatial weight between locations i and j, row-standardized so that each row sums to 1.
The significance of Moran’s I was assessed using a pseudo-significance test. This procedure involved generating 999 permutations of the attribute values associated with the spatial units. Each permutation produces a new spatial arrangement, in which the values are redistributed among the areas. Since only one of these arrangements corresponds to the observed situation, an empirical distribution of Moran’s I can be constructed.
When the observed value lies at the extremes of this empirical distribution after a large number of permutations (p-value < 0.05), the null hypothesis of absence of spatial autocorrelation is rejected. This indicates that the data exhibit spatial dependence and supports the interpretation of the spatial autocorrelation categories [25,29,30].

2.5. Software Used

To ensure the replicability of the study, only free and open-source software was used. The operating system was Linux Mint Debian Edition 6 “Faye” [31]. Data organization and tabulation were performed using LibreOffice Calc version 7.4.7 [32]. Image reclassification and calculation of the Bivariate Local Moran’s I (LISA) were performed in R version 4.2.2 [24], through the RStudio graphical interface version 2022.07.2+576 “Spotted Wakerobin”, using the readODS version 1.7.0, dplyr version 1.0.10, terra version 1.6-17, sf version 1.0-8, sp version 1.5-0, and spdep version 1.2-7 packages.
The spatial clipping, raster-to-point conversion, data sampling, polygon dissolution, Voronoi polygon generation, and cartographic layout preparation, including location and spatial autocorrelation maps, were carried out in QGIS 3.34.8 “Prizren” [23], with the support of the QuickMapServices plugin version 0.19.34.

3. Results and Discussion

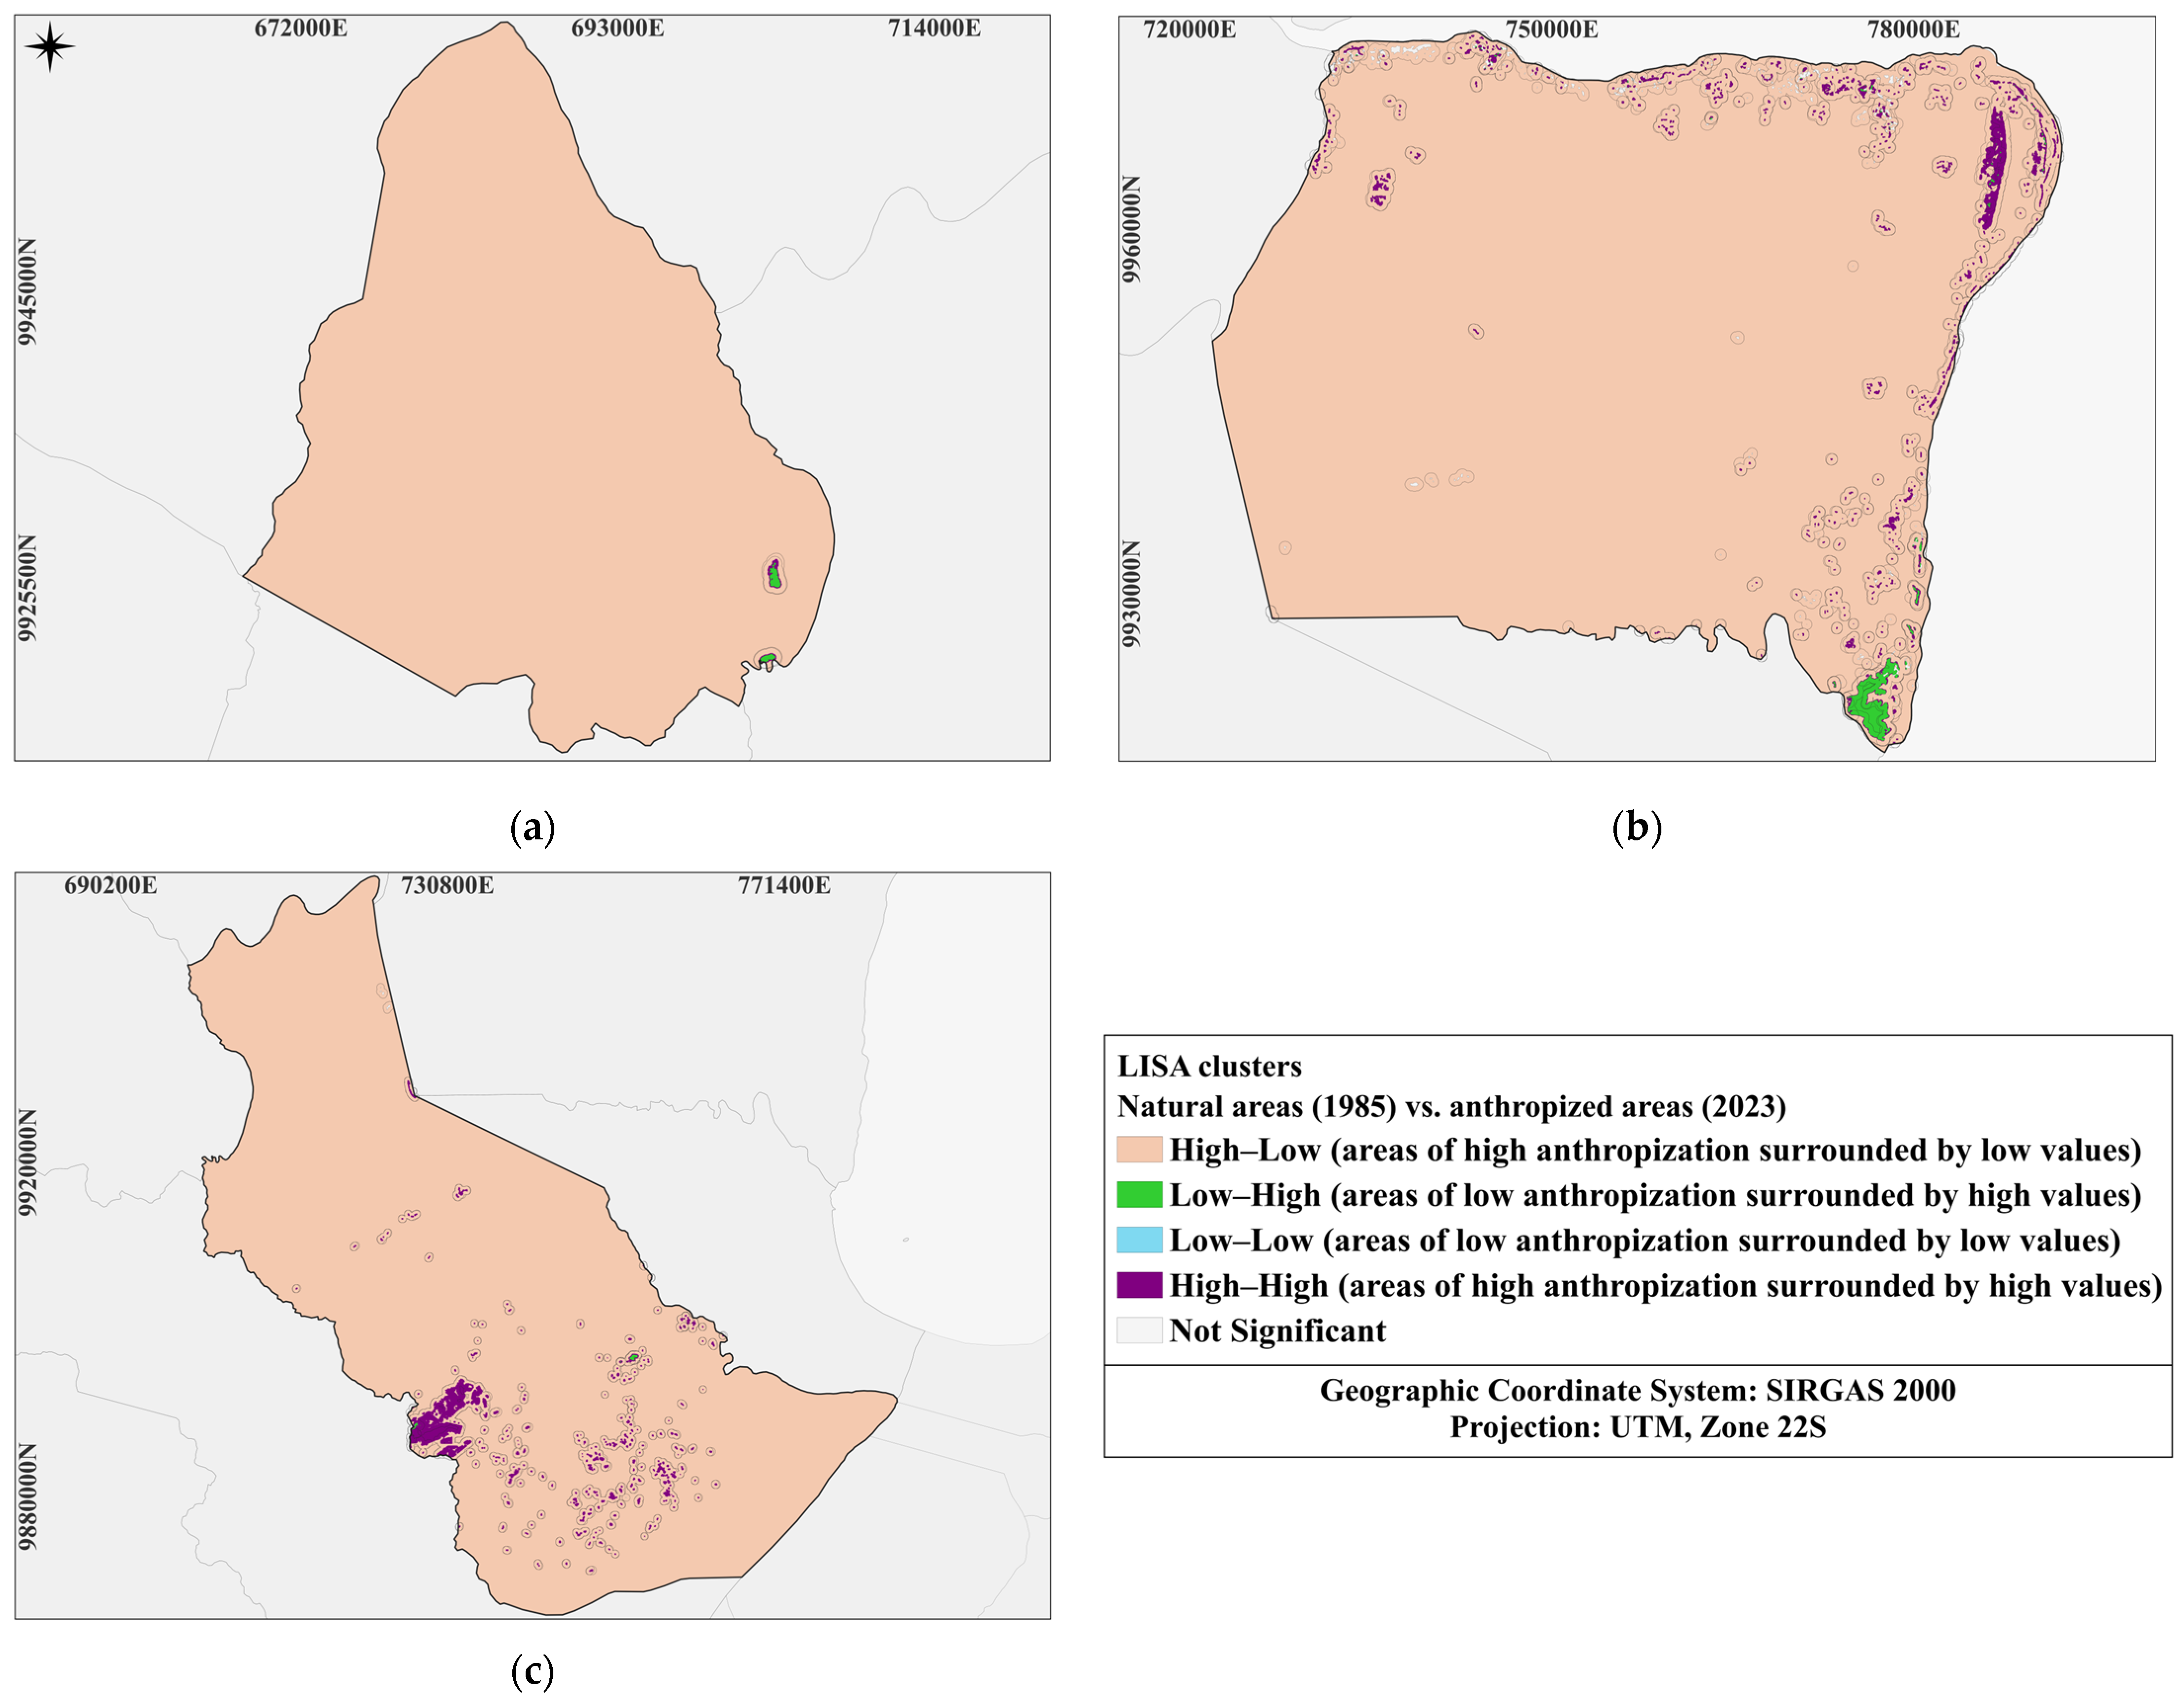
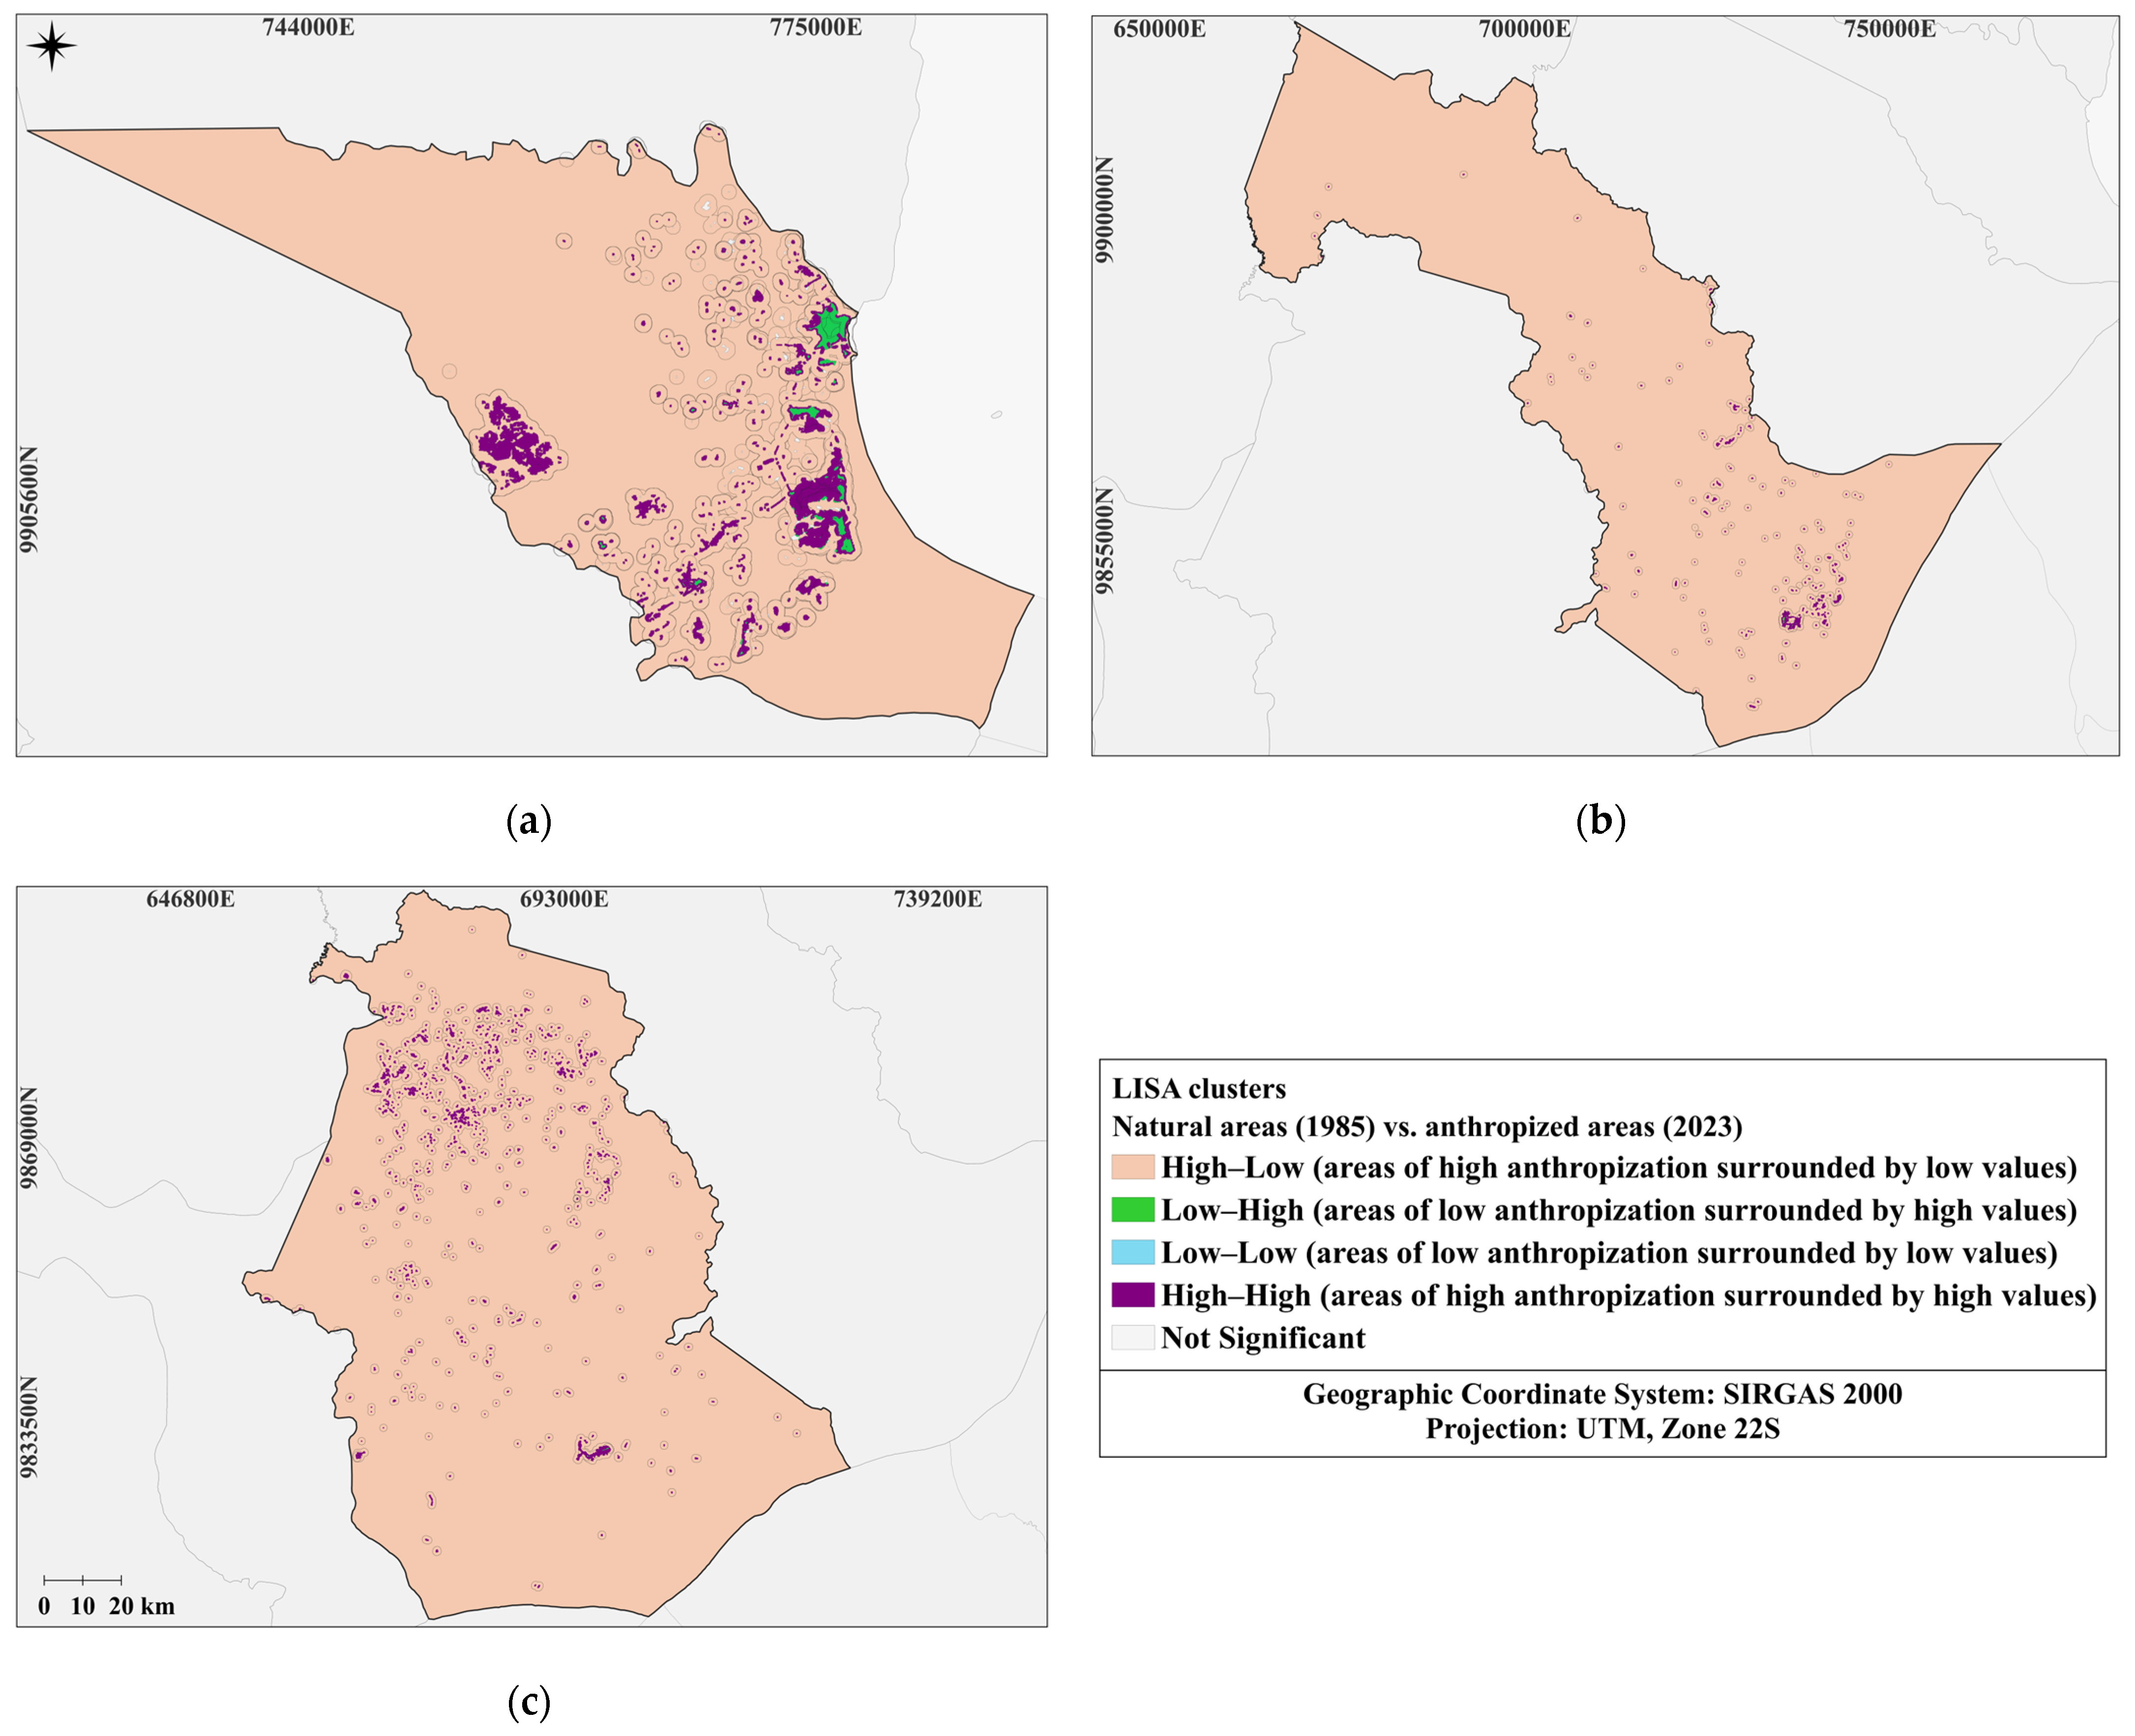
The analysis of the spatial autocorrelation categories obtained using the Bivariate Local Moran’s I revealed distinct patterns of spatial association between natural areas in 1985 and anthropized areas in 2023 (Figure 3, Figure 4 and Figure 5). Figure 3 and Figure 4 present the spatial distribution of these categories across the municipalities of the region, while Figure 5 summarizes their percentages relative to the municipal area. Together, these figures allow the identification of patterns of persistence, transformation, and stability in LULC between the reference years 1985 and 2023.
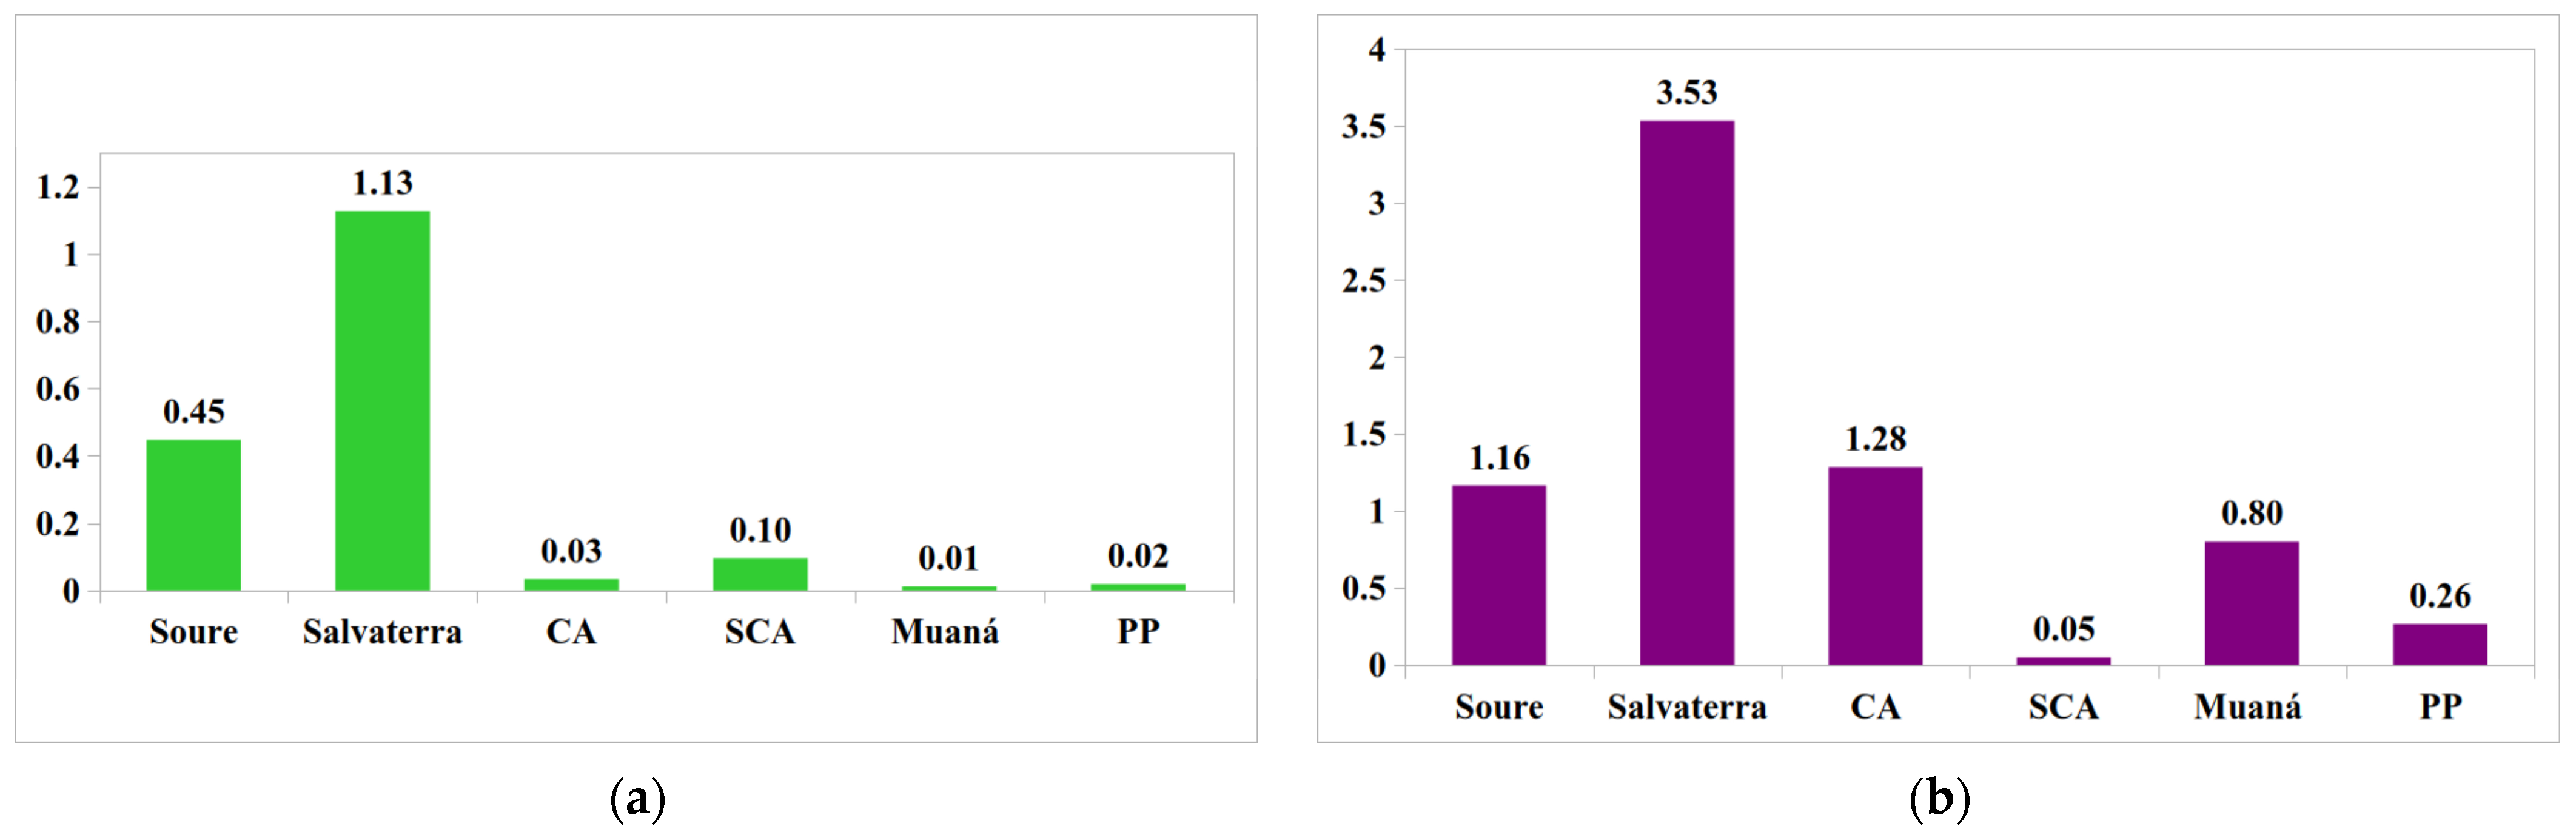
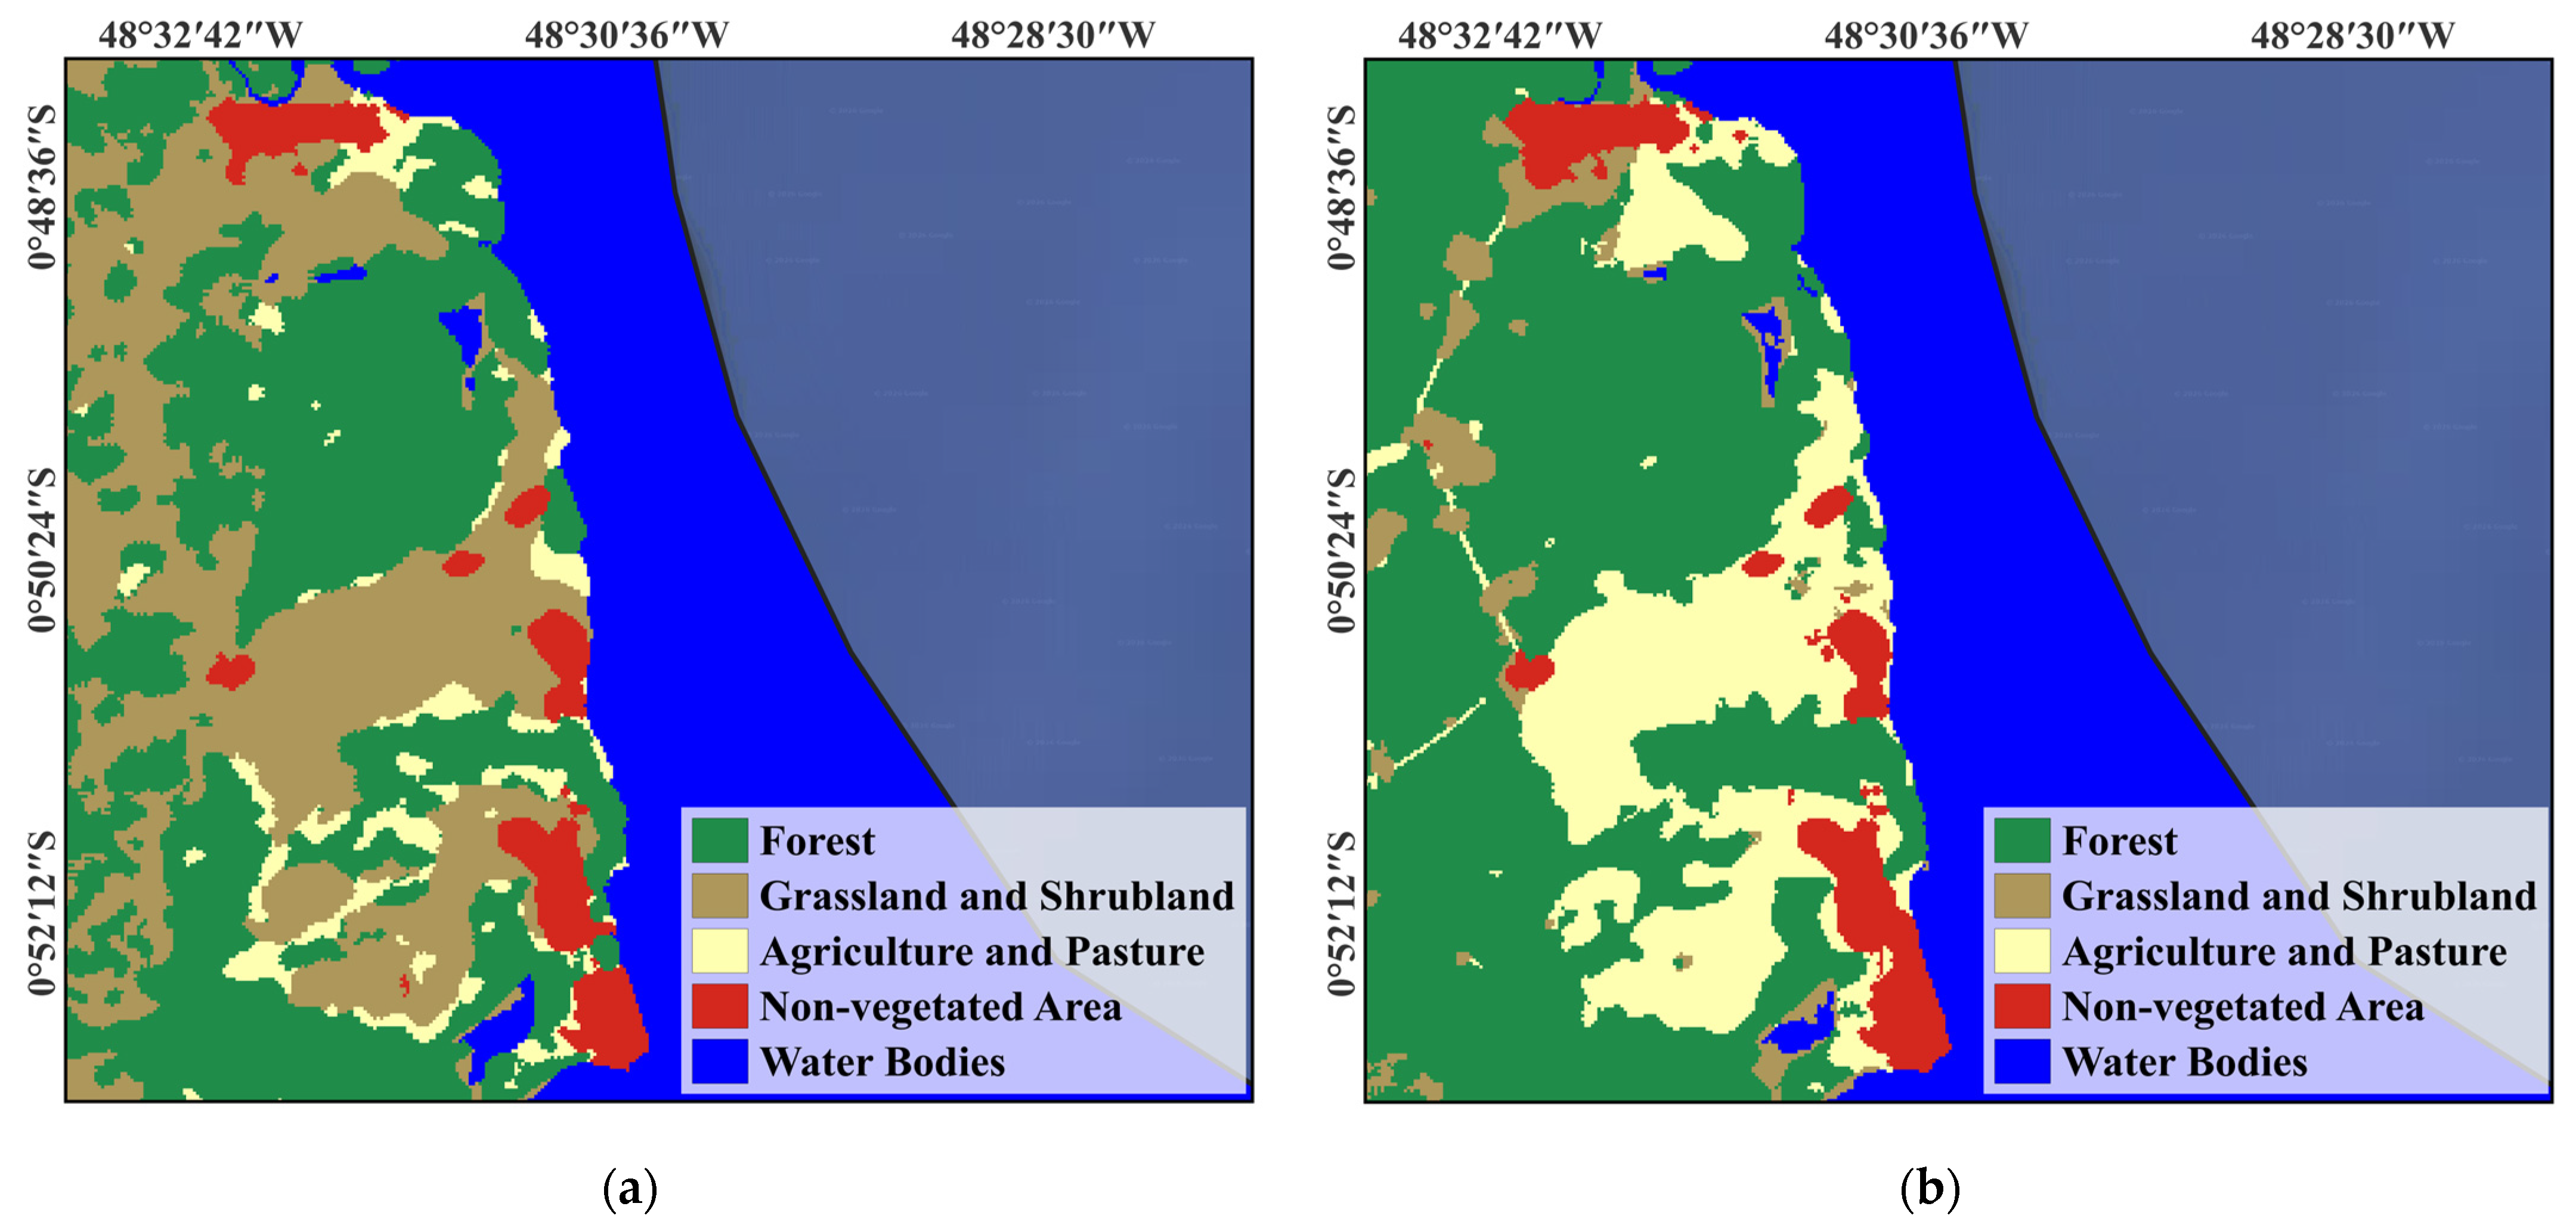
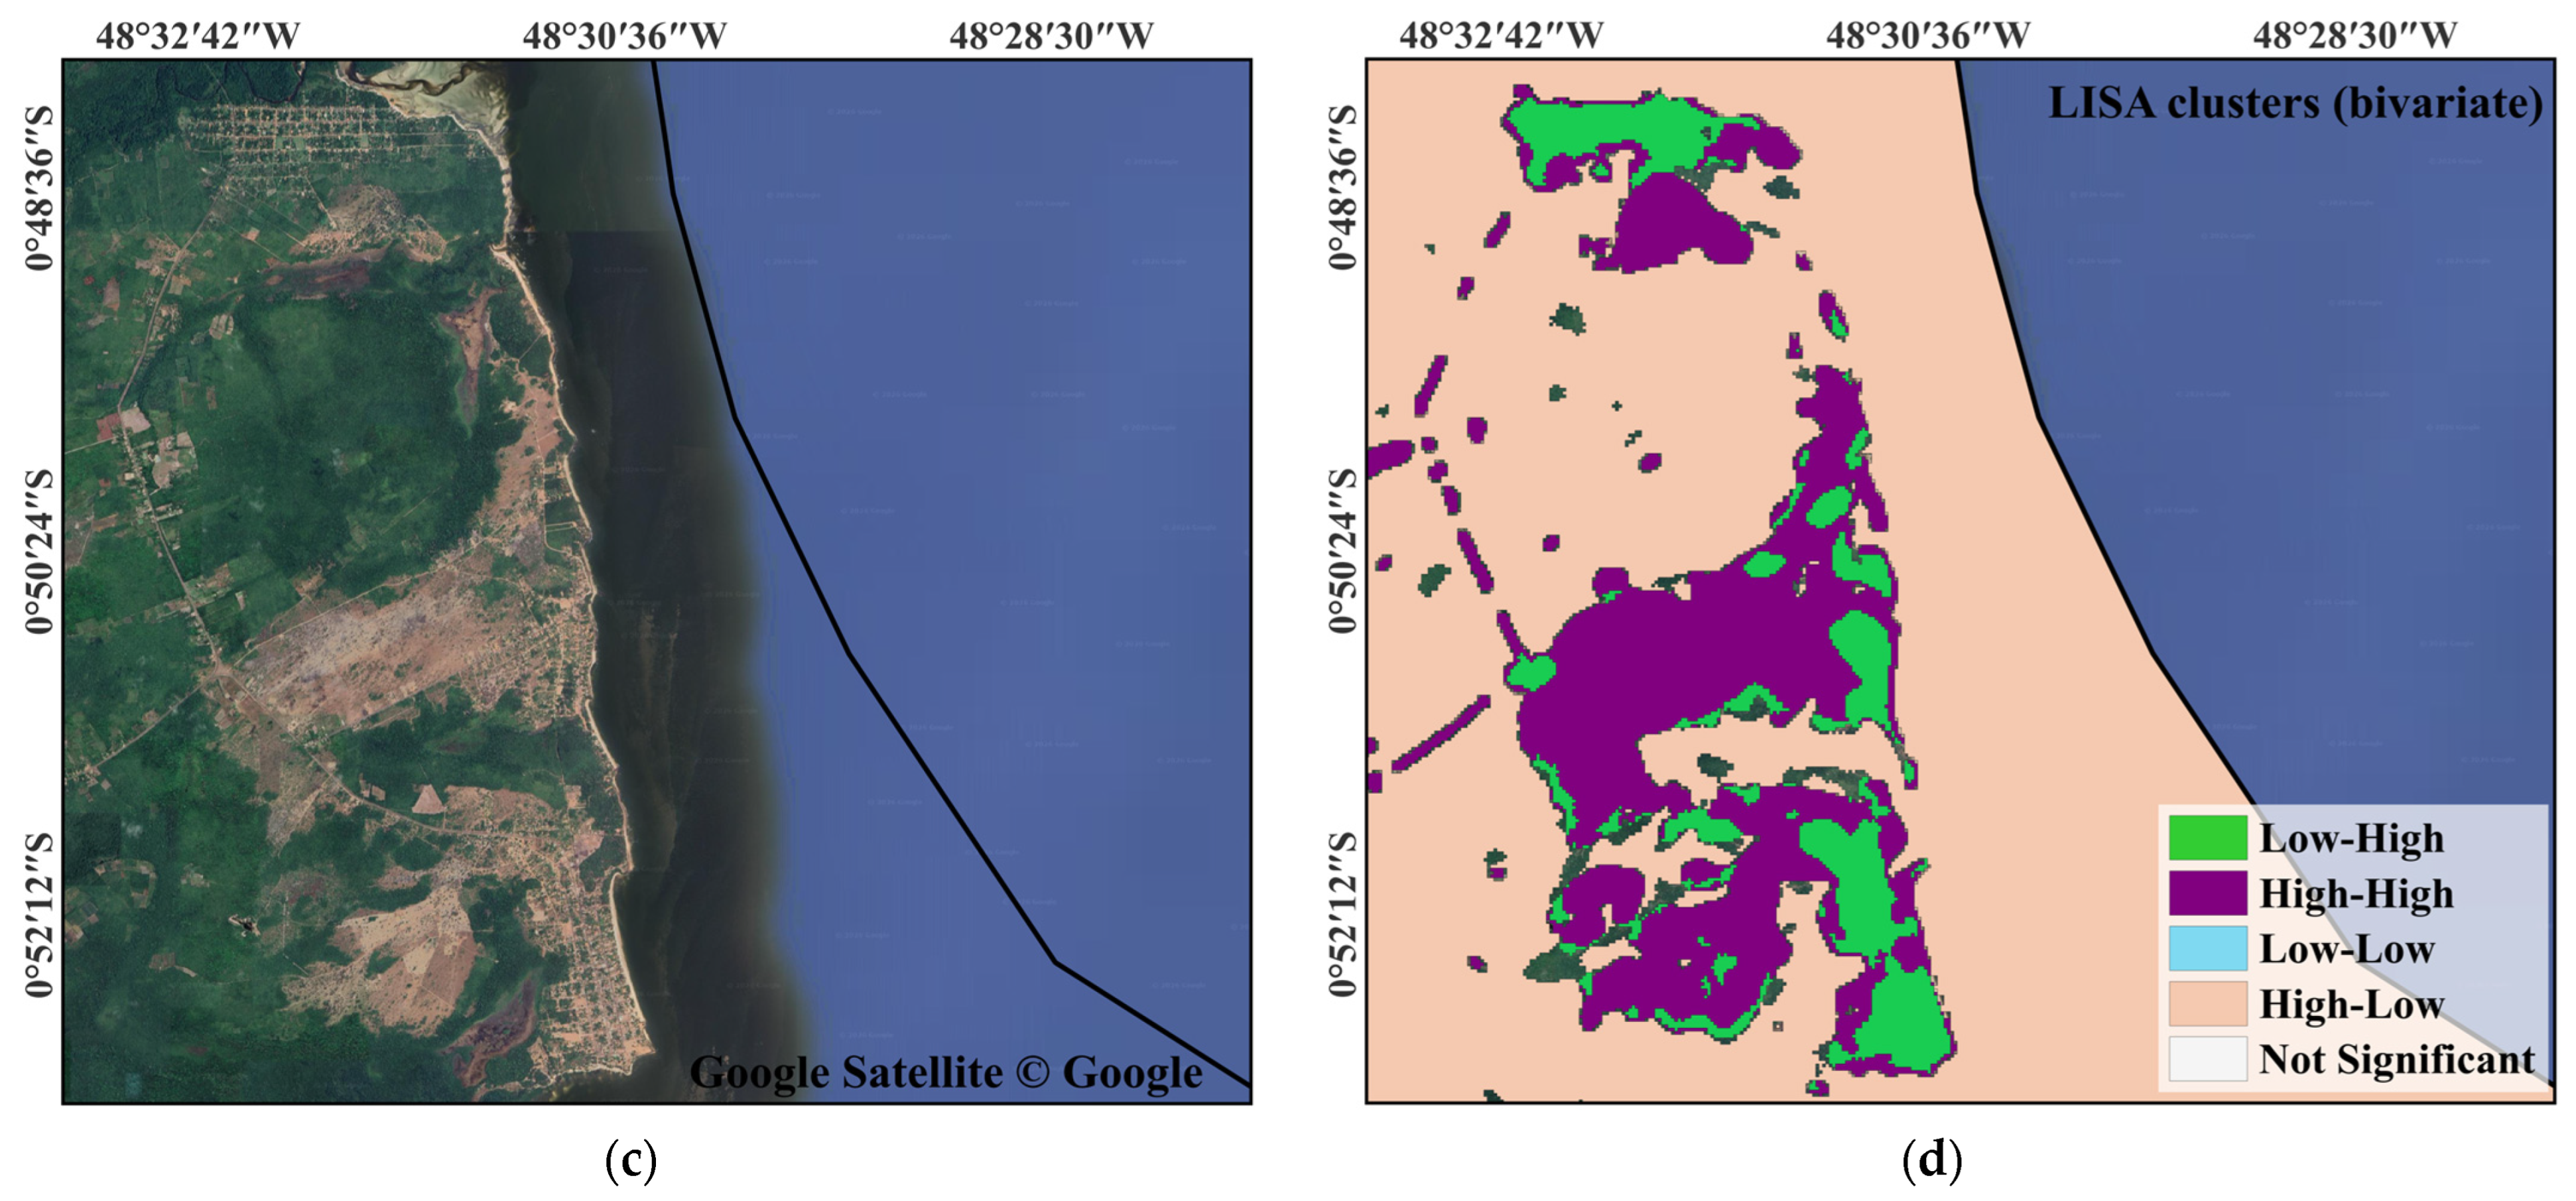
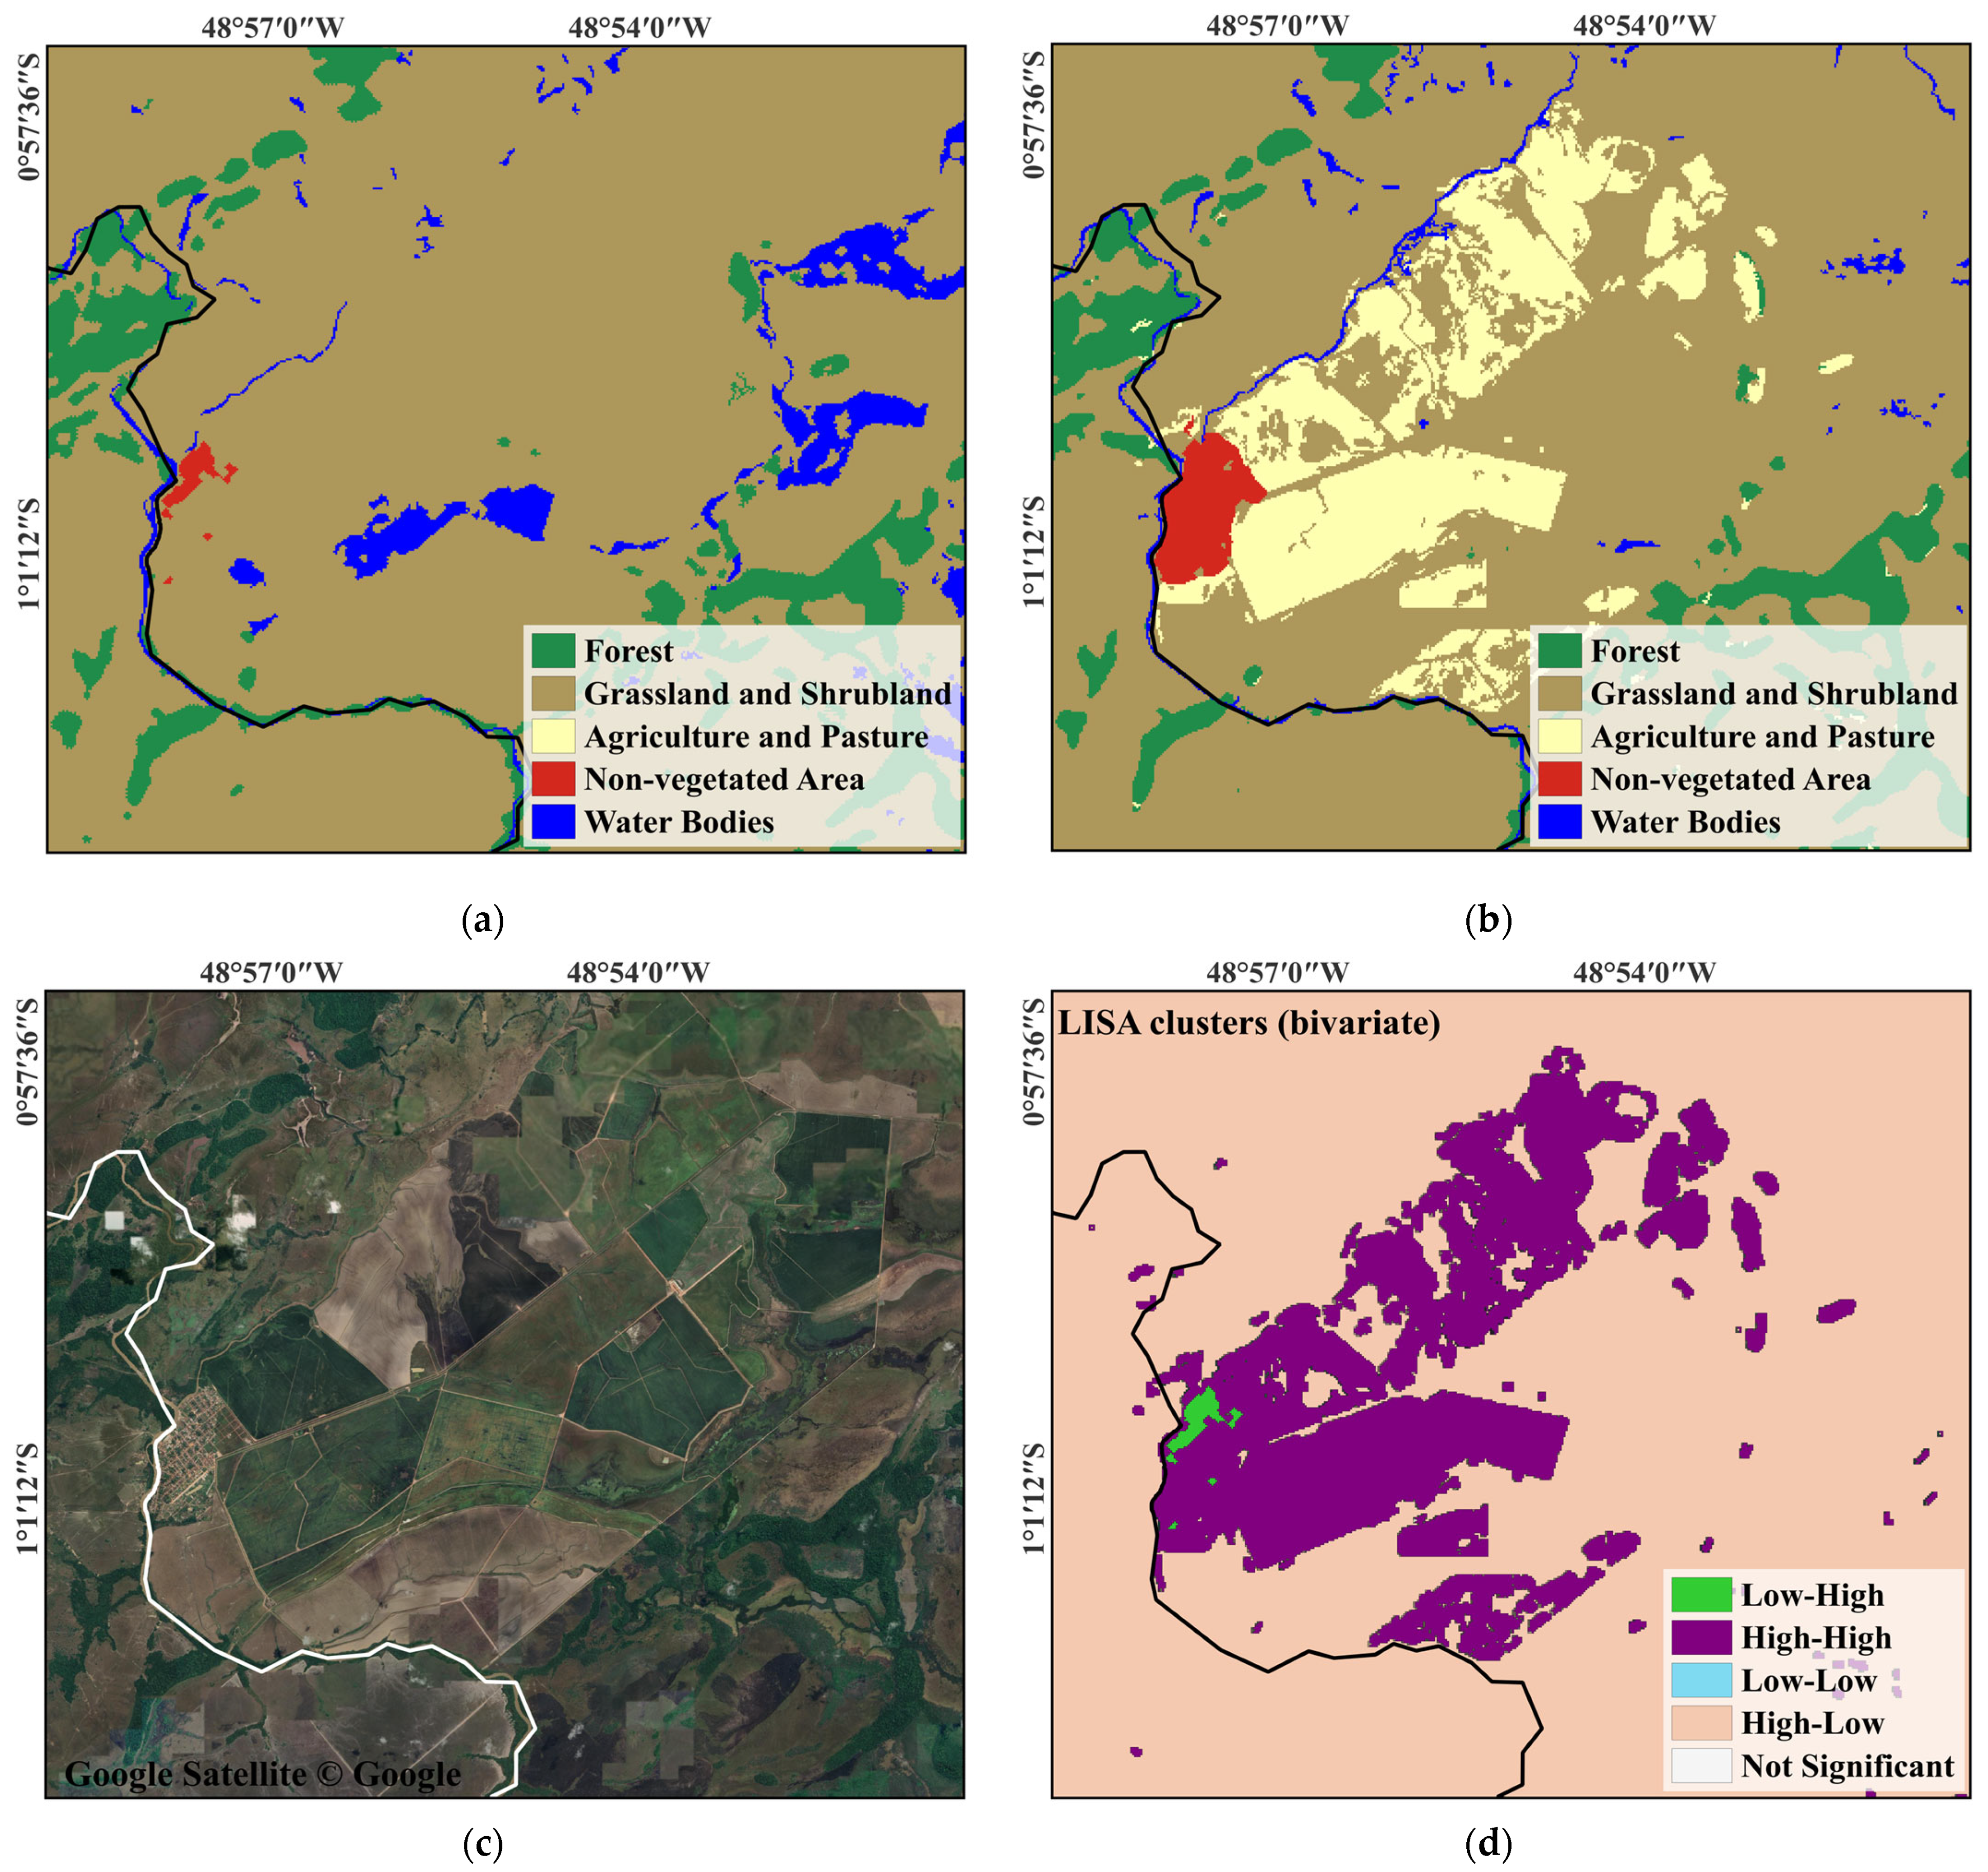
For the Low–High category (Figure 3 and Figure 4), areas with a low presence of natural areas in 1985 associated with high levels of anthropized areas in 2023 were observed, indicating the persistence of anthropogenic use. In quantitative terms (Figure 5a), Salvaterra had the highest percentage (1.13%), followed by Soure (0.45%), while the other municipalities showed lower values, such as Cachoeira do Arari (0.03%), Santa Cruz do Arari (0.10%), Muaná (0.01%), and Ponta de Pedras (0.02%), suggesting lower spatial continuity of anthropization. These areas largely correspond to urbanized zones and consolidated areas of anthropogenic use, especially in municipalities with greater socioeconomic dynamism, such as Soure and Salvaterra, which have strong tourism activity [4,6]. This spatial pattern is illustrated in Figure 6.
This pattern is consistent with the territorial organization of the region, revealing the concentration of human activities in specific areas that remained relatively stable over time. The adopted approach made it possible to clearly identify these areas of permanence, contributing to the monitoring of processes associated with urban occupation, agricultural and livestock expansion, and the preservation of natural areas [10].
For the High–High category (Figure 3 and Figure 4), which represents areas with a high presence of natural areas in 1985 spatially associated with high levels of anthropized areas in 2023, concentrations were observed in coastal zones, especially in the northern and northeastern sectors of the study area, as well as scattered patches in the interior of the region.
In quantitative terms (Figure 5b), Salvaterra stood out with the highest percentage (3.53%), followed by Cachoeira do Arari (1.28%) and Soure (1.16%). Lower values were observed in Santa Cruz do Arari (0.05%), Ponta de Pedras (0.26%), and Muaná (0.80%), indicating lower intensity of transformation in these municipalities.
Anthropogenic processes were concentrated mainly around previously consolidated areas, corresponding to the Low–High category, reflecting typical spatial patterns of urban expansion and peri-urban land use (Figure 6d). These processes are associated with increasing population density and agricultural expansion, which tend to occur along the peripheral areas of urban centers [33,34,35].
In other areas of the Immediate Geographic Region of Soure–Salvaterra, land-use expansion is strongly associated with agricultural and livestock activities (Figure 7), reflecting economic and social dynamics that drive the occupation of new areas, often beyond peri-urban zones. This territorial advance is associated with demand for production, the availability of suitable areas, and the intensification of agricultural practices, contributing to the spatial reconfiguration of the regional landscape [36,37].
Based on the most recent data from the Brazilian Demographic Census, the population of the Immediate Geographic Region of Soure–Salvaterra increased from 73,749 inhabitants in 1980 to 150,111 in 2022 [16]. At the national scale, the Brazilian population grew from 121,150,573 to 203,080,756 inhabitants over the same period [16], while the global population increased from approximately 4.438 billion in 1980 to 8.062 billion in 2023 [38]. This population growth is associated with increasing demand for agricultural and livestock production to meet food needs, thereby exerting pressure for the opening of new productive areas [39,40]. However, this relationship does not occur in isolation. Comparing the LISA categories with municipal socioeconomic indicators suggests that the spatial patterns of anthropization are associated with different combinations of demographic, territorial, and productive factors (Table 3) [17,41].
Salvaterra presented the highest proportions of the High–High (3.53%) and Low–High (1.13%) categories, as well as the highest population density (26.27 inhabitants km−2) and the smallest territorial area among the municipalities analyzed. This result indicates that the transformation of natural cover in Salvaterra occurs in a proportionally more concentrated manner, possibly associated with the intensification of human occupation within a smaller municipal area, especially in urban, peri-urban, and coastal sectors, as discussed above. The functional proximity to Belém may also reinforce this pattern, as it favors regional flows of people, goods, services, and tourism-related activities [42]. In this context, the diversity of natural and cultural attractions reinforces the tourism relevance of Salvaterra and is associated with the expansion of services and infrastructure related to visitor mobility. The municipality and its surrounding area include beaches, natural grasslands, buffalo-raising properties, traditional festivities, Marajó gastronomy, handicrafts, and cultural expressions such as carimbó and Búfalo-Bumbá, an artistic performance created in Salvaterra that integrates popular theater, music, dance, and elements of the Afro-Indigenous traditions of Marajó [43,44,45,46].
Pereira da Silva [47] highlights the association of buffalo farming with seasonally flooded grasslands and with productive, cultural, and tourism-related activities characteristic of the regional landscape. Complementarily, Borja and Corbin [48] found that visitors value participatory and immersive experiences associated with sustainability, although infrastructure limitations remain a challenge to regional tourism development. These attributes may support the development of ecotourism, cultural tourism, and experience-based tourism, increasing the demand for accommodation, food services, transportation, commerce, and access infrastructure. Although the present analysis does not allow a direct causal relationship to be established, the concentration of these activities and of the infrastructure associated with visitor mobility in urban, peri-urban, and coastal sectors constitutes a plausible territorial mechanism for interpreting the higher proportion of anthropization observed in Salvaterra compared with the other municipalities analyzed.
However, the socioeconomic indicators show that landscape transformation cannot be explained by a single factor. Soure and Cachoeira do Arari also presented relevant High–High values, although their population densities were lower than that of Salvaterra. This result suggests localized anthropogenic pressures rather than homogeneous landscape transformation at the municipal scale. In Soure, functional proximity to Belém, coastal occupation, tourism activity, and regional flows help explain the persistence and concentration of anthropized areas in specific sectors. The PA-154 highway also acts as a regional circulation axis and may favor the concentration of anthropogenic land uses near urban centers, access areas, and mobility corridors [49].
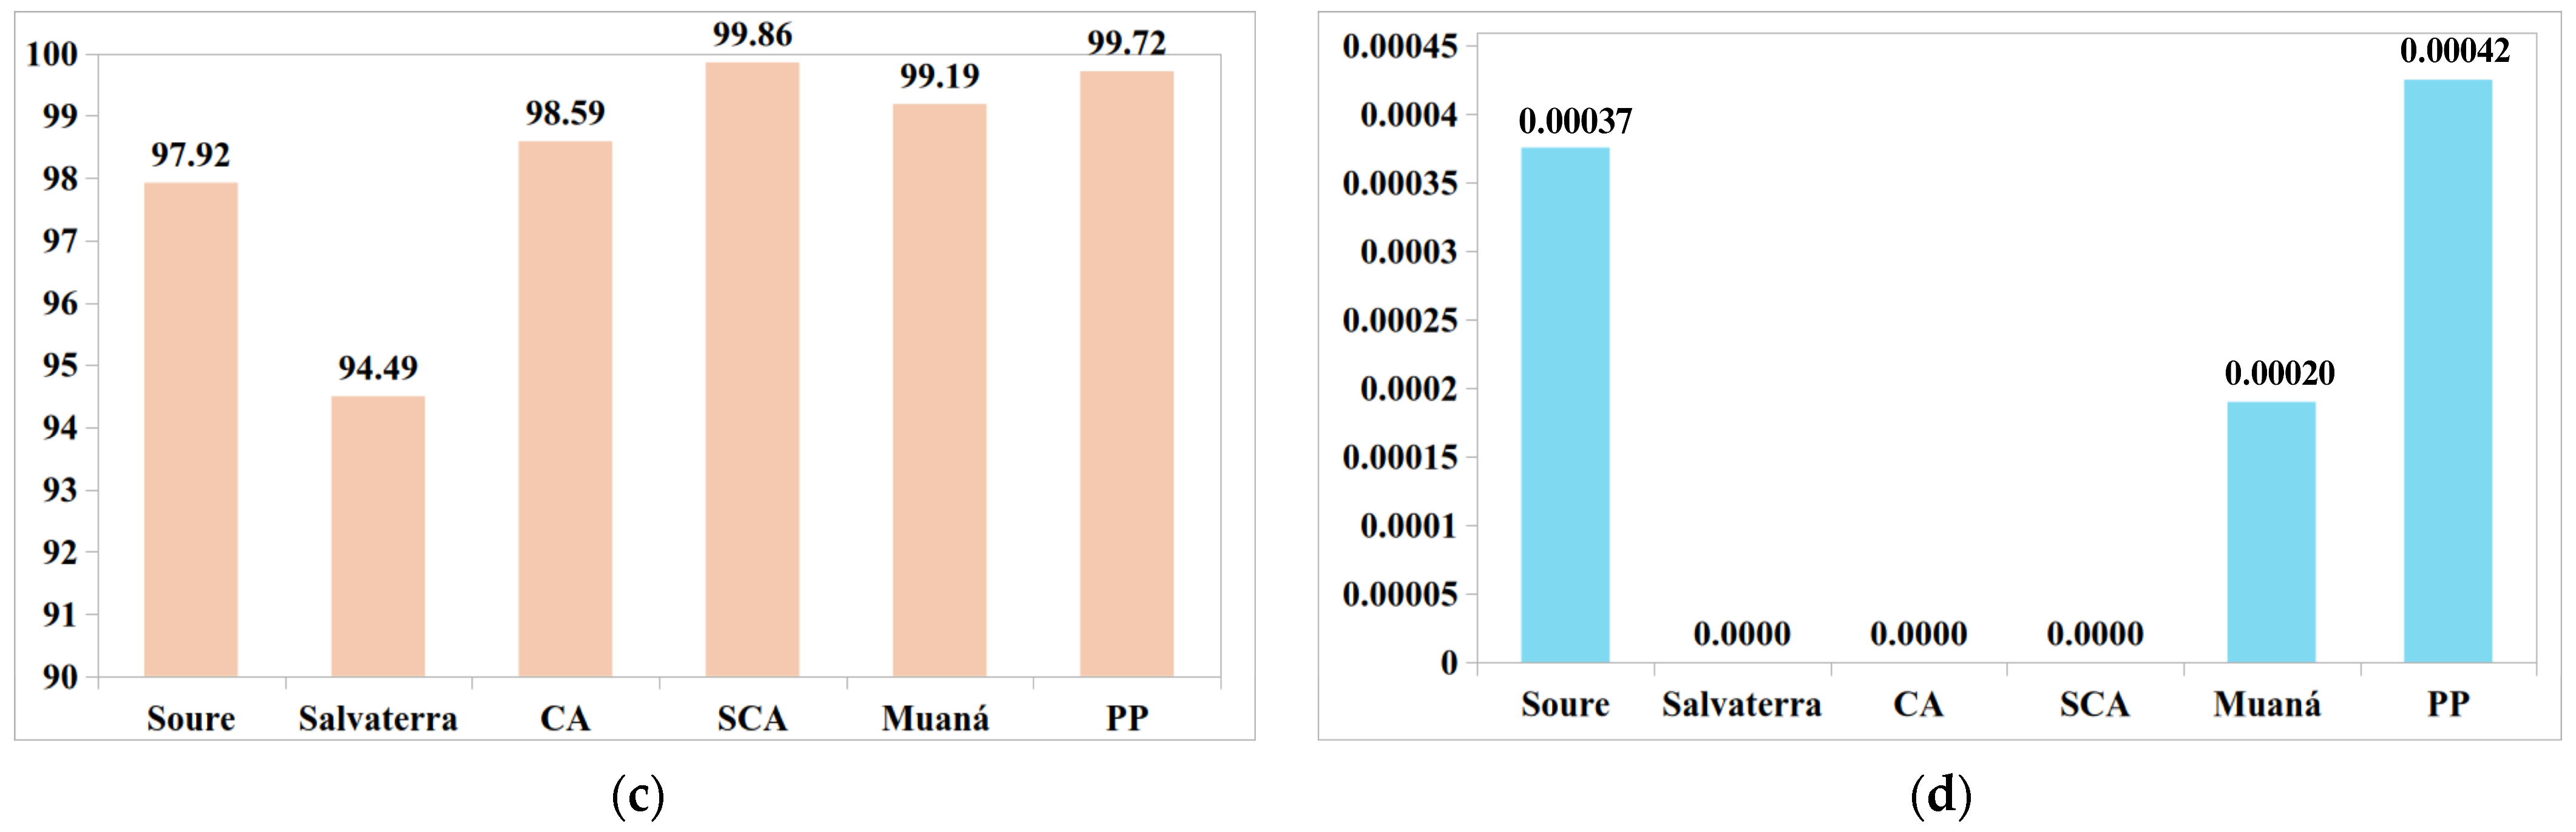
In Cachoeira do Arari and Muaná, the higher gross value added of agriculture and livestock indicates the importance of productive activities in the regional landscape dynamics. However, Muaná presented lower percentages in the LISA categories, reinforcing that population size and the economic value of agriculture and livestock, when considered in isolation, do not determine the intensity of anthropization. Thus, the observed patterns are better interpreted as the result of the combined influence of demographic concentration, municipal area, territorial accessibility, functional proximity to Belém, coastal occupation, tourism-related activities, and agricultural and livestock land uses. Regarding the High–Low category (Figure 5c), which represents areas of persistent natural vegetation between 1985 and 2023, the highest percentages were observed in Santa Cruz do Arari (99.86%), Ponta de Pedras (99.72%), Muaná (99.19%), and Cachoeira do Arari (98.59%). Soure (97.92%) and Salvaterra (94.49%) also showed high values, although slightly lower. These results indicate a high degree of vegetation cover conservation in the region. The maintenance of these areas may be explained, in part, by the current legal framework, especially the requirement to maintain 80% of native vegetation in rural properties located in the Legal Amazon, as established by the Brazilian Forest Code [50].
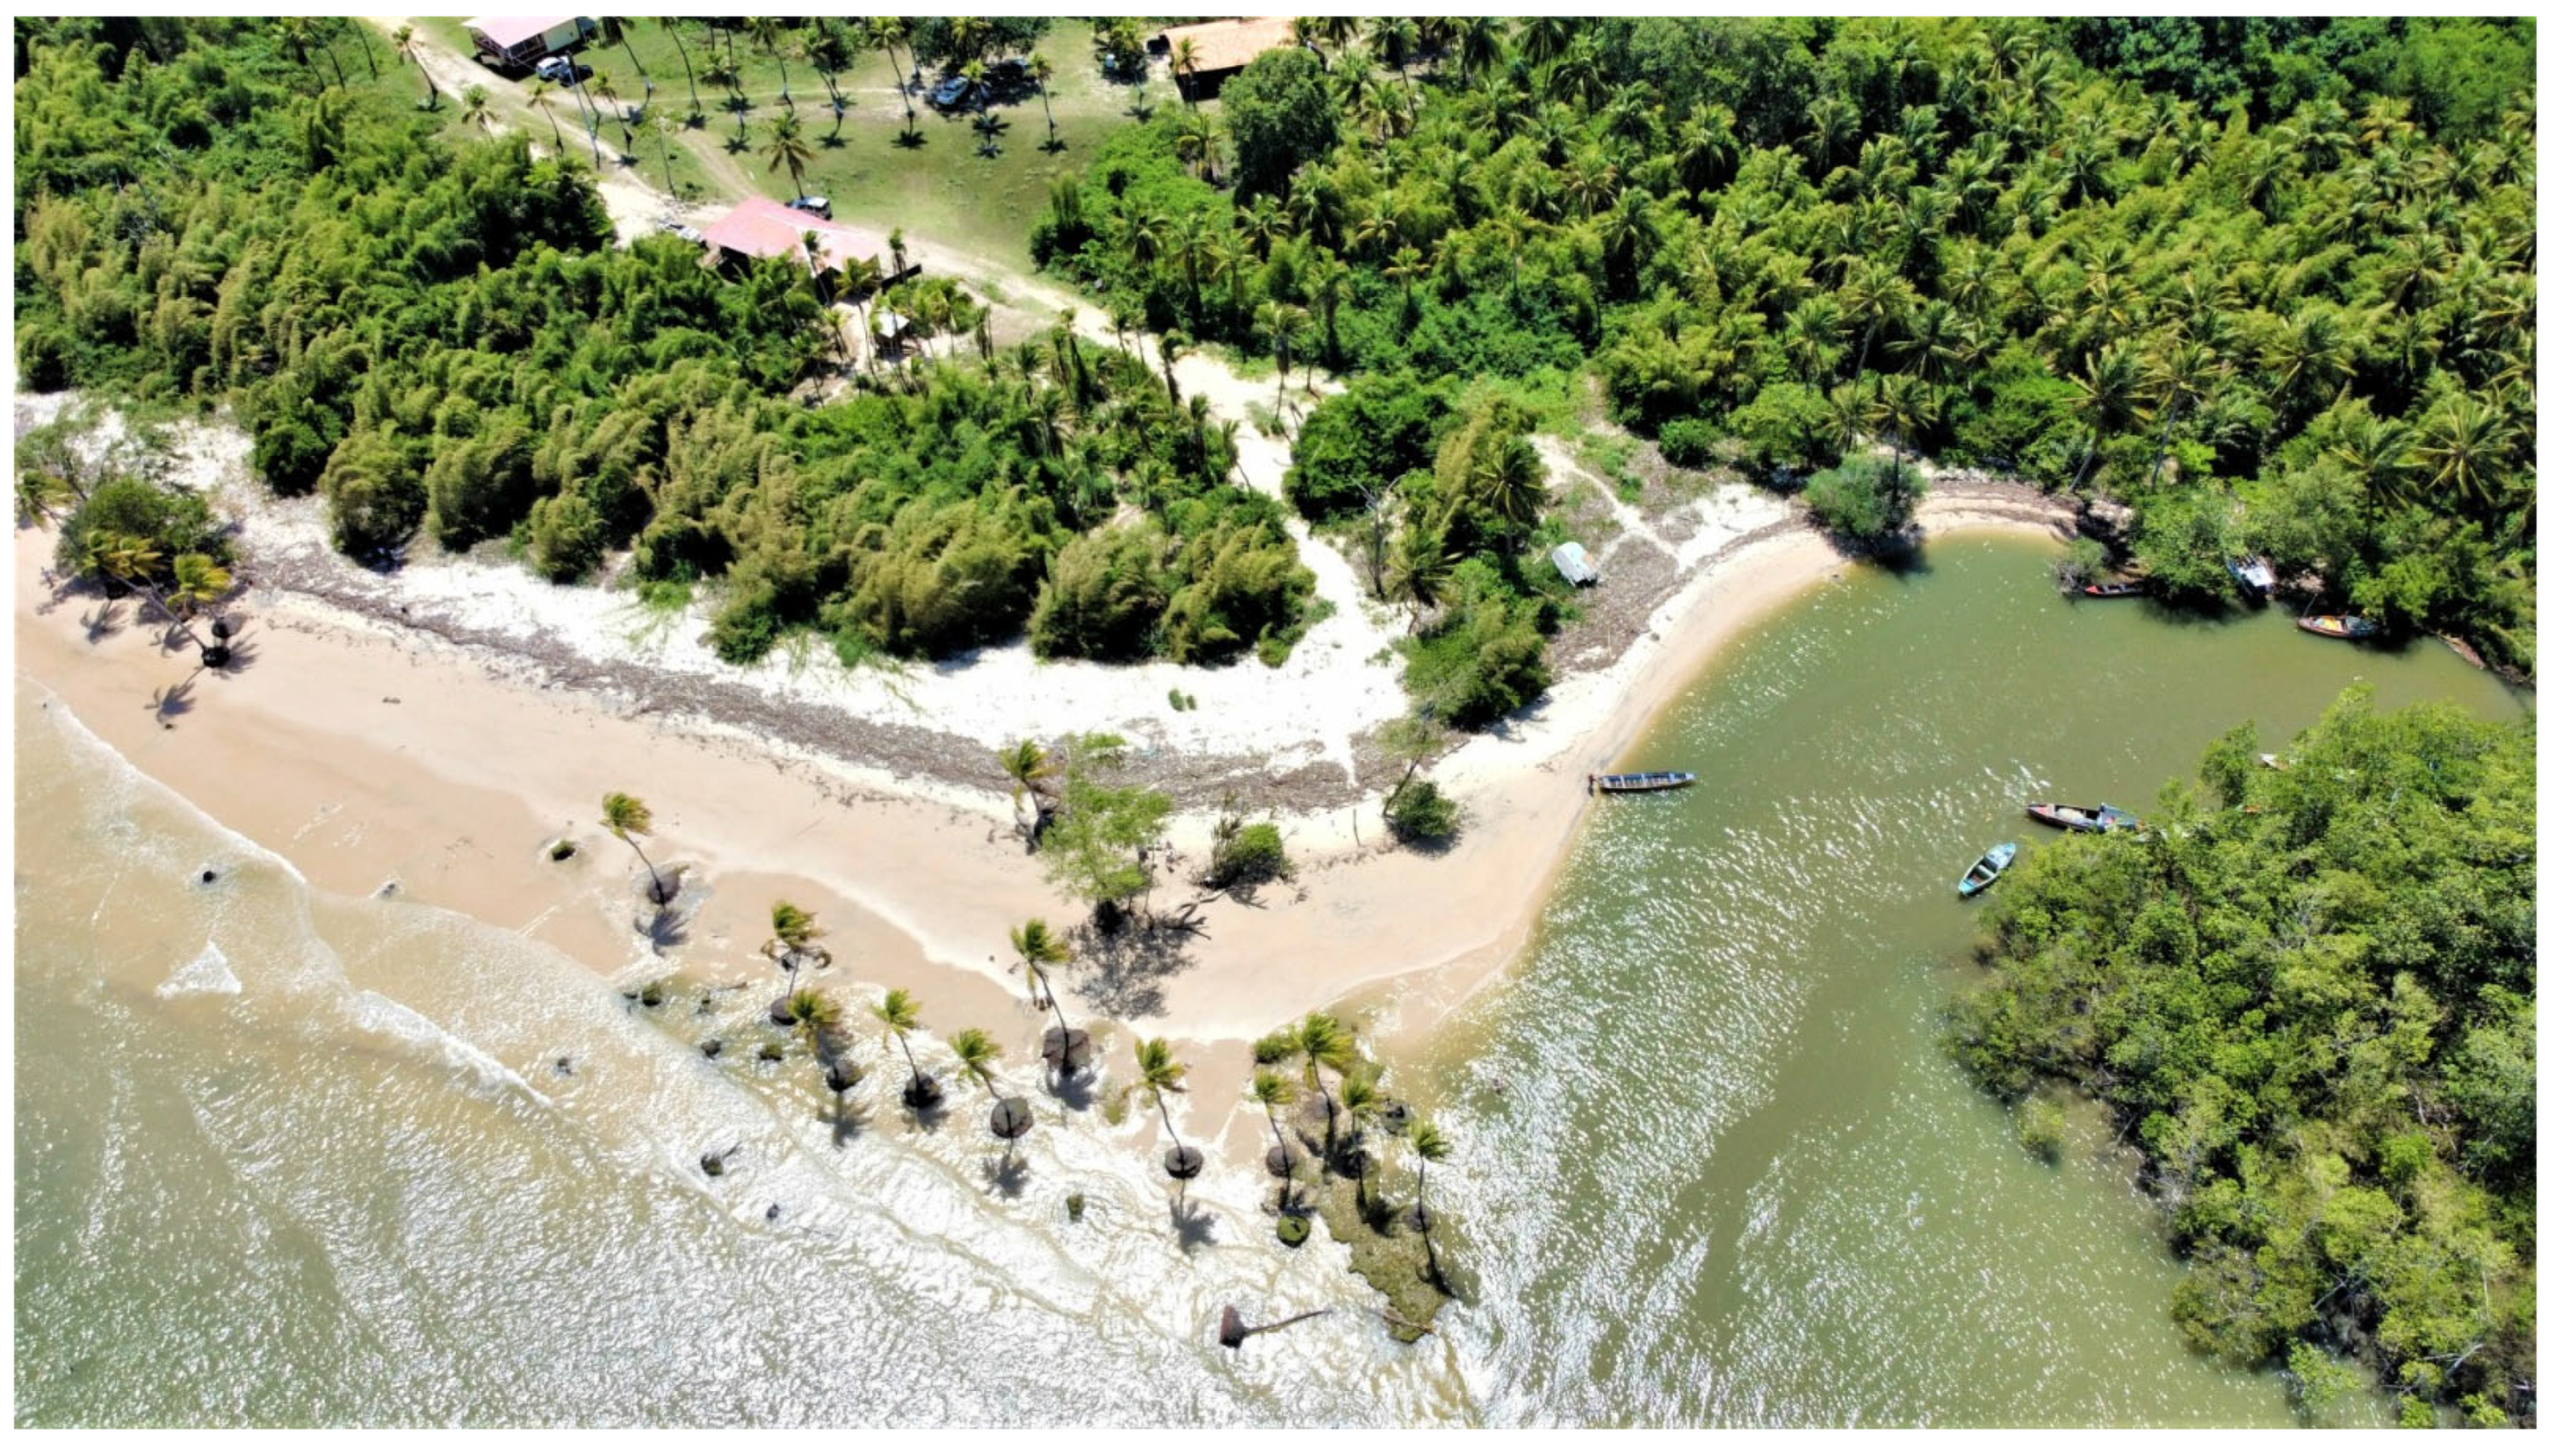
In addition, the territory encompasses important protected areas that are fundamental for the conservation of local ecosystems and the sustainable use of natural resources. The Marajó Archipelago Environmental Protection Area (Área de Proteção Ambiental, APA) stands out, as it covers all municipalities in the Immediate Geographic Region of Soure–Salvaterra, as well as those in the Immediate Geographic Region of Breves. It constitutes the largest sustainable-use protected area in Brazil and encompasses a wide diversity of landscapes, traditional communities, and strategic ecosystems [51]. Also noteworthy are the Soure Marine Extractive Reserve (Reserva Extrativista Marinha de Soure, RESEX), aimed at protecting traditional ways of life and the sustainability of fishing activities [52], and the Mata do Bacurizal and Lago Caraparú Ecological Reserve, in Salvaterra, which integrates environmental protection and ecotourism [53]. Together, these areas play a strategic role in maintaining native vegetation and conserving regional biodiversity (Figure 8 and Figure 9) [15,54].
Although protected areas contribute to the maintenance of natural cover, the localized occurrence of High–High clusters in Salvaterra and other areas indicates that legal protection does not completely eliminate anthropogenic pressures on the landscape. This pattern may be associated with the management category of these protected areas, especially Environmental Protection Areas (Áreas de Proteção Ambiental, APAs), which belong to the sustainable-use group and allow different forms of occupation and use of natural resources, provided that they are compatible with conservation objectives [51].
High–High clusters may also reflect edge effects and localized internal pressures. The edges of protected areas are more exposed to roads, urban centers, peri-urban areas, agricultural and livestock activities, tourism, and the circulation of people. In Salvaterra, this condition is particularly relevant because of the proximity between protected areas, coastal zones, urbanized areas, and spaces used for tourism. In sustainable-use protected areas, such as APAs and Extractive Reserves (Reservas Extrativistas, RESEXs), the presence of communities and economic activities is part of the territorial dynamics. However, the intensification of these uses may favor internal degradation, vegetation fragmentation, and the partial replacement of natural cover by anthropogenic land uses [55,56].
These results should be interpreted with caution. Bivariate Local Moran’s I identifies spatial associations between natural areas in 1985 and anthropized areas in 2023, but it does not demonstrate direct causality or confirm environmental infractions. Therefore, High–High clusters indicate priority sectors for complementary analyses of edge effects, internal degradation, land tenure regularity, land-use intensity, and the effectiveness of environmental management. Thus, the simultaneous presence of High–Low areas and High–High patches shows that protected areas maintain a large part of the natural cover, but still require enforcement, territorial planning, sustainable management, and continuous spatial monitoring.
In the Amazonian context, although the Brazilian Forest Code establishes mechanisms such as the compensation of legal reserves, the Rural Environmental Registry (Cadastro Ambiental Rural, CAR) and the Environmental Regularization Program (Programa de Regularização Ambiental, PRA) [50], the effectiveness of these instruments has relevant operational limitations. In particular, the slow validation of records and the low operationalization of the Environmental Reserve Quotas (Cotas de Reserva Ambiental, CRA) market reduce the ability of these mechanisms to promote environmental compliance on a regional scale [57,58,59].
These limitations may contribute to the interpretation of the spatial patterns observed in this study. The localized occurrence of High–High clusters in the Immediate Geographic Region of Soure–Salvaterra suggests that agricultural and livestock expansion may occur, in some cases, under conditions of low effectiveness of environmental control instruments. This result is consistent with evidence that recent deforestation in the Amazon frequently occurs on properties already registered in the Rural Environmental Registry, indicating that the registry alone does not ensure compliance with environmental legislation [60,61,62].
In addition, the fragility of environmental enforcement, particularly in remote areas, may contribute to the maintenance of anthropogenic pressures on natural cover. Institutional and operational limitations in agencies such as the Brazilian Institute of the Environment and Renewable Natural Resources (Instituto Brasileiro do Meio Ambiente e dos Recursos Naturais Renováveis, IBAMA) and the Chico Mendes Institute for Biodiversity Conservation (Instituto Chico Mendes de Conservação da Biodiversidade, ICMBio), associated with the region’s land tenure complexity, may favor the persistence of these pressures, including in protected areas [63,64,65]. In this context, the concentration of High–High clusters can be interpreted as a result of the combination of agricultural pressure and limitations in environmental governance.
The analysis also suggests that some of these areas require further investigation regarding environmental and land tenure regularity, especially considering evidence of deforestation on formally registered properties and within protected areas [66,67]. This pattern reinforces the existence of a mismatch between legal instruments and their practical application, which compromises the effectiveness of conservation policies. Structural factors, such as geographic isolation, limited monitoring capacity, and institutional weaknesses at the local level, may also contribute to this scenario [68,69]. In some contexts, there is also a reconfiguration of territorial arrangements, such as the fragmentation of collective records in the Rural Environmental Registry, which can favor processes of land individualization and the intensification of land use [70,71].
In contrast, the results for the Low–Low category indicate an extremely reduced occurrence of areas compatible with possible natural regeneration in all analyzed municipalities. The percentages are residual, with Soure and Ponta de Pedras (approximately 0.0004%) and Muaná (0.0002%) standing out, while in the other municipalities the values are null. The low spatial expression of these clusters, mapped in Figure 3 and Figure 4 and summarized in Figure 5d, indicates that vegetation recovery processes are limited in the region, suggesting the continuity of anthropogenic use in previously degraded areas. This pattern highlights the absence or insufficiency of effective environmental restoration initiatives, representing a significant challenge for regional sustainability. Considering the high ecological relevance of the study area, characterized by high biodiversity and strategic ecosystem functions, the low representativeness of areas compatible with natural regeneration reinforces the need for more effective public policies aimed at native vegetation recovery [72,73].
In addition, the low representativeness of areas compatible with possible natural regeneration indicates limited landscape resilience, as the persistence of anthropogenic land uses may reduce ecological recovery over time [9]. In coastal and insular Amazonian environments, this condition is particularly relevant because natural cover supports essential functions, such as water regulation, soil stability, biodiversity maintenance, and habitat connectivity [1,3,73]. Thus, regional sustainability depends not only on the conservation of remaining natural areas, but also on the control of anthropogenic expansion and the restoration of strategic areas.
In this context, this study contributes to environmental monitoring in tropical regions by integrating remote sensing, open data, and local spatial statistics to identify patterns of stability, anthropogenic pressure, and limited vegetation recovery. This approach enhances the analytical capacity to identify intertemporal spatial patterns of accumulated LULC anthropization, supporting the recognition of relevant areas for conservation, restoration, and territorial planning. By relating environmental patterns to socioeconomic drivers, such as tourism, agricultural and livestock activities, and human occupation, the results provide relevant support for environmental planning in sensitive Amazonian landscapes. Thus, the application of spatially explicit methods reinforces their usefulness for guiding conservation policies and territorial management, with potential adaptation to other tropical regions subjected to different levels of anthropogenic pressure.

4. Conclusions

The application of Bivariate Local Moran’s I (LISA) was effective in identifying spatial patterns associated with accumulated landscape anthropization. By integrating data from the reference years 1985 and 2023, the method revealed intertemporal spatial associations compatible with accumulated LULC anthropization. The High–High category indicated areas where the high presence of natural cover in 1985 was spatially associated with higher levels of anthropization in 2023, while the Low–High category highlighted areas of consolidated anthropogenic occupation.
Although anthropized areas increased between the reference years, natural vegetation remained predominant across much of the region. Areas compatible with lower anthropogenic pressure or possible signs of natural regeneration showed low representativeness, indicating that the persistence of anthropogenic land use may limit vegetation recovery.
Bivariate LISA can serve as a strategic tool for environmental assessment, supporting future studies and contributing to the formulation of public policies and territorial planning strategies based on spatial evidence.

Supplementary Materials

The following supporting information can be downloaded at: https://www.mdpi.com/article/10.3390/environments13070378/s1, Table S1: Minimal dataset used in the study. The R scripts used for LULC reclassification into Natural Areas and Anthropized Areas and for Bivariate Local Moran’s I analysis have been deposited in Figshare and will be made publicly available upon publication at: https://doi.org/10.6084/m9.figshare.32229888.

Author Contributions

Conceptualization, Í.D.S.N.; Methodology, Í.D.S.N. and N.K.N.N.; Software, Í.D.S.N., N.K.N.N. and F.J.d.O.; Formal analysis, Í.D.S.N. and N.K.N.N.; Investigation, G.G.d.S., J.P.F.N., P.G.M., A.d.T.L., R.J.A.S., A.N.R.L. and W.d.L.S.; Data curation, Í.D.S.N., N.K.N.N., G.G.d.S., J.P.F.N., P.G.M., A.d.T.L., R.J.A.S., A.N.R.L. and W.d.L.S.; Writing—original draft preparation, Í.D.S.N. and N.K.N.N.; Writing—review and editing, Í.D.S.N., N.K.N.N., R.L.M.T., J.F.d.S.J., T.G.M.B. and E.J.W.; Visualization, Í.D.S.N.; Validation, R.L.M.T., J.F.d.S.J. and E.J.W.; Supervision, T.G.M.B. and E.J.W.; Project administration, Í.D.S.N. and T.G.M.B. All authors have read and agreed to the published version of the manuscript.

Funding

This research was funded by CAPES (Coordenação de Aperfeiçoamento de Pessoal de Nível Superior), Demanda Social Program, grant number 88887.208948/2025-00.

Data Availability Statement

The LULC datasets analyzed in this study are publicly available from the MapBiomas Project, Collection 9, at https://brasil.mapbiomas.org/ (accessed on 4 June 2025) and through the MapBiomas platform at https://plataforma.brasil.mapbiomas.org/ (accessed on 4 June 2025). The processed layers and tabulated results generated from these datasets are available from the corresponding author upon reasonable request.

Acknowledgments

The authors acknowledge the MapBiomas project for providing the LULC datasets used in this study. The authors also thank the Federal University of Rio Grande do Sul (UFRGS), the Graduate Program in Remote Sensing (PPGSR/UFRGS), and the Federal Rural University of the Amazon (UFRA) for institutional support.

Conflicts of Interest

The authors declare no conflicts of interest.

Abbreviations

The following abbreviations are used in this manuscript:
LULCLand use and land cover
LISALocal Indicators of Spatial Association
IBGEInstituto Brasileiro de Geografia e Estatística, Brazilian Institute of Geography and Statistics
APAÁrea de Proteção Ambiental, Environmental Protection Area
RESEXReserva Extrativista, Extractive Reserve
ICMBioInstituto Chico Mendes de Conservação da Biodiversidade, Chico Mendes Institute for Biodiversity Conservation
CARCadastro Ambiental Rural, Rural Environmental Registry
PRAPrograma de Regularização Ambiental, Environmental Regularization Program
CRACotas de Reserva Ambiental, Environmental Reserve Quotas
IBAMAInstituto Brasileiro do Meio Ambiente e dos Recursos Naturais Renováveis, Brazilian Institute of the Environment and Renewable Natural Resources

References

  1. do Amaral, D.D.; Rossetti, D.F.; Gurgel, E.S.C.; Pereira, J.L.G. Phytophysiognomy in the east of Marajó Island (mouth of the Amazon River) from the perspective of geological history in the Late Quaternary. Catena 2023, 220, 106711. [Google Scholar] [CrossRef]
  2. Francisquini, M.I.; Lima, C.M.; Pessenda, L.C.R.; Rossetti, D.F.; França, M.C.; Cohen, M.C.L. Relation between Carbon Isotopes of Plants and Soils on Marajó Island, a Large Tropical Island: Implications for Interpretation of Modern and Past Vegetation Dynamics in the Amazon Region. Palaeogeogr. Palaeoclimatol. Palaeoecol. 2014, 415, 91–104. [Google Scholar] [CrossRef]
  3. Gomes, C.P.; Gardunho, D.C.L.; Virgulino-Júnior, P.C.C.; Fernandes, M.E.B. The function of mangrove transition zones on the population structure and fishery of the mangrove crab Ucides cordatus on the Brazilian Amazon coast. Wetl. Ecol. Manag. 2024, 32, 825–839. [Google Scholar] [CrossRef]
  4. Narusawa, Í.D.S.; Nakakoji, N.K.N.; Gomes, M.D.A.; Braga, T.G.M.; de Freitas, T.P.M. Análise espacial de correlação entre o Índice de Desenvolvimento Humano e as atividades agropecuárias na Ilha do Marajó, Pará, Brasil. Rev. Geociênc. Nordeste 2025, 11, 190–206. [Google Scholar] [CrossRef]
  5. Rodrigues, C.B.; Prideaux, B. A management model to assist local communities developing community-based tourism ventures: A case study from the Brazilian Amazon. J. Ecotour. 2018, 17, 1–19. [Google Scholar] [CrossRef]
  6. Boulhosa, M.; Farias, K.S.; Figueiredo, S.L. Políticas públicas e desenvolvimento na Ilha de Marajó, Brasil: Participação e exclusão no turismo. Rev. Tur. Desenvolv. 2021, 36, 313–323. [Google Scholar] [CrossRef]
  7. de Oliveira, A.M.; Santos, M.A.S.d.; Silva, J.A.R.d.; Santos, W.M.d.; Rodrigues, T.C.G.d.C.; Silva, W.C.d.; Hamid, S.S.; Lourenço-Júnior, J.d.B. Spatial distribution and sources of growth of dairy farming in the State of Pará, Brazil. Sustainability 2024, 16, 122. [Google Scholar] [CrossRef]
  8. Kawakami, S.K.; Mello, L.H.; Carmo, A.M.C.; Sótão Neto, B.M.T.; Aquino, R.F.O.; Taniguchi, S.; Figueira, R.C.L.; Montone, R.C. Background of persistent organic pollutants in estuarine sediments from Marajó Island, an Amazonian environmental protection area for sustainable use. Environ. Sci. Pollut. Res. 2024, 31, 65481–65495. [Google Scholar] [CrossRef] [PubMed]
  9. Bathiany, S.; Bastiaansen, R.; Bastos, A.; Blaschke, L.; Lever, J.; Loriani, S.; De Keersmaecker, W.; Dorigo, W.; Milenković, M.; Senf, C.; et al. Ecosystem resilience monitoring and early warning using Earth observation data: Challenges and outlook. Surv. Geophys. 2025, 46, 265–301. [Google Scholar] [CrossRef]
  10. Xiong, J.; Yu, H.; Li, L.; Yuan, M.; Yu, J. Asymmetry between ecosystem health and ecological quality from an Earth observation perspective. Sci. Rep. 2025, 15, 10143. [Google Scholar] [CrossRef] [PubMed]
  11. Herrmann, M.; Schulz, C.M. Klimaresilienz und Gesundheit—Die Vitalparameter des Planeten leuchten rot. Inn. Med. 2025, 66, 365–372. [Google Scholar] [CrossRef] [PubMed]
  12. MapBiomas. Coleções MapBiomas. Available online: https://brasil.mapbiomas.org/colecoes-mapbiomas/ (accessed on 3 June 2025).
  13. Basnet, P.; Grieger, S.; Putzenlechner, B.; Seidel, D. Forests with high structural complexity contribute more to land surface cooling: Empirical support for management for complexity. J. For. Res. 2025, 36, 59. [Google Scholar] [CrossRef]
  14. Xiang, M.; Wu, Z.; Yang, X.; Yang, J.; Li, J.; Duan, L.; Liu, Y. Evolutionary characteristics and influencing factors of disaster resilience in rural areas of ecologically fragile zones—Empirical evidence from the Upper Minjiang River, China. Ecol. Indic. 2025, 175, 113535. [Google Scholar] [CrossRef]
  15. IBGE. Malhas Territoriais. Available online: https://www.ibge.gov.br/geociencias/organizacao-do-territorio/malhas-territoriais/15774-malhas.html (accessed on 28 March 2026).
  16. IBGE. Panorama do Censo 2022. Available online: https://www.ibge.gov.br/estatisticas/sociais/saude/22827-censo-demografico-2022.html (accessed on 5 June 2025).
  17. IBGE. Cidades e Estados do Brasil. Available online: https://cidades.ibge.gov.br/brasil/panorama (accessed on 4 June 2025).
  18. MapBiomas. Visão Geral da Metodologia. Available online: https://brasil.mapbiomas.org/visao-geral-da-metodologia/ (accessed on 4 June 2025).
  19. Olofsson, P.; Foody, G.M.; Herold, M.; Stehman, S.V.; Woodcock, C.E.; Wulder, M.A. Good practices for estimating area and assessing accuracy of land change. Remote Sens. Environ. 2014, 148, 42–57. [Google Scholar] [CrossRef]
  20. Stehman, S.V. Sampling designs for accuracy assessment of land cover. Int. J. Remote Sens. 2009, 30, 5243–5272. [Google Scholar] [CrossRef]
  21. Stehman, S.V. Estimating area and map accuracy for stratified random sampling when the strata are different from the map classes. Int. J. Remote Sens. 2014, 35, 4923–4939. [Google Scholar] [CrossRef]
  22. MapBiomas. Estatística de Acurácia, Coleção 9. Available online: https://brasil.mapbiomas.org/estatistica-de-acuracia/colecao-9/ (accessed on 4 June 2025).
  23. QGIS Development Team. QGIS Geographic Information System, version 3.34.8-Prizren; Open Source Geospatial Foundation Project: Beaverton, OR, USA, 2024. Available online: https://qgis.org (accessed on 4 June 2025).
  24. R Core Team. R: A Language and Environment for Statistical Computing, version 4.2.2; R Foundation for Statistical Computing: Vienna, Austria, 2022. Available online: https://www.R-project.org/ (accessed on 4 June 2025).
  25. Anselin, L.; Syabri, I.; Smirnov, O. Visualizing multivariate spatial correlation with dynamically linked windows. In Proceedings of the Specialist Meeting on New Tools for Spatial Data Analysis, Santa Barbara, CA, USA, 10–12 May 2002; Anselin, L., Rey, S., Eds.; Center for Spatially Integrated Social Science (CSISS), University of California: Santa Barbara, CA, USA, 2002. [Google Scholar]
  26. Fischer, M.M.; Getis, A. (Eds.) Handbook of Applied Spatial Analysis: Software Tools, Methods and Applications; Springer: Berlin/Heidelberg, Germany, 2010; ISBN 978-3-642-03646-0. [Google Scholar]
  27. Anselin, L. Local indicators of spatial association—LISA. Geogr. Anal. 1995, 27, 93–115. [Google Scholar] [CrossRef]
  28. Anselin, L. The GeoDa Book: Exploring Spatial Data, 1st ed.; GeoDa Press LLC: Chicago, IL, USA, 2017; ISBN 978-0-9863421-2-7. [Google Scholar]
  29. Bai, X.; Xiong, K.; Chen, Y.; Liu, Z. Spatiotemporal evolution of landscape stability in World Heritage karst sites: A case study of Shibing Karst and Libo-Huanjiang Karst. Herit. Sci. 2024, 12, 215. [Google Scholar] [CrossRef]
  30. Câmara, G.; Carvalho, M.S.; Druck, S. Análise Espacial de Dados Geográficos; Embrapa Informação Tecnológica: Brasília, Brazil, 2004; ISBN 978-85-7383-260-0. [Google Scholar]
  31. Linux Mint. Linux Mint Debian Edition 6 (LMDE 6) “Faye”; Linux Mint: Athlone, Ireland, 2023. Available online: https://www.linuxmint.com/ (accessed on 4 June 2025).
  32. The Document Foundation. LibreOffice; The Document Foundation: Berlin, Germany, 2025; Available online: https://www.libreoffice.org/ (accessed on 4 June 2025).
  33. Haldar, S.; Chatterjee, U.; Bhattacharya, S.; Paul, S.; Bindajam, A.A.; Mallick, J.; Abdo, H.G. Peri-urban dynamics: Assessing expansion patterns and influencing factors. Ecol. Process. 2024, 13, 58. [Google Scholar] [CrossRef]
  34. Nuissl, H.; Siedentop, S. Urbanisation and land use change. In Sustainable Land Management in a European Context: A Co-Design Approach; Weith, T., Barkmann, T., Gaasch, N., Rogga, S., Strauß, C., Zscheischler, J., Eds.; Springer International Publishing: Cham, Switzerland, 2021; pp. 75–99. ISBN 978-3-030-50841-8. [Google Scholar]
  35. Seifollahi-Aghmiuni, S.; Kalantari, Z.; Egidi, G.; Gaburova, L.; Salvati, L. Urbanisation-driven land degradation and socioeconomic challenges in peri-urban areas: Insights from Southern Europe. Ambio 2022, 51, 1446–1458. [Google Scholar] [CrossRef] [PubMed]
  36. Ajith, S.; Vijayakumar, S.; Elakkiya, N. Yield prediction, pest and disease diagnosis, soil fertility mapping, precision irrigation scheduling, and food quality assessment using machine learning and deep learning algorithms. Discov. Food 2025, 5, 67. [Google Scholar] [CrossRef]
  37. Dhiman, S.; Thakur, B.; Kaur, S.; Ahuja, M.; Gantayat, S.; Sarkar, S.; Singh, R.; Tripathi, M. Closing the loop: Technological innovations in food waste valorisation for global sustainability. Discov. Sustain. 2025, 6, 258. [Google Scholar] [CrossRef]
  38. World Bank. World Development Indicators. Available online: https://datatopics.worldbank.org/world-development-indicators/ (accessed on 5 June 2025).
  39. Song, W.; Wang, C.; Chen, W.; Zhang, X.; Li, H.; Li, J. Unlocking the spatial heterogeneous relationship between per capita GDP and nearby air quality using bivariate local indicator of spatial association. Resour. Conserv. Recycl. 2020, 160, 104880. [Google Scholar] [CrossRef]
  40. Kuschnig, N.; Cuaresma, J.C.; Krisztin, T.; Giljum, S. Spatial spillover effects from agriculture drive deforestation in Mato Grosso, Brazil. Sci. Rep. 2021, 11, 21804. [Google Scholar] [CrossRef] [PubMed]
  41. IBGE. Produto Interno Bruto dos Municípios. Available online: https://www.ibge.gov.br/estatisticas/economicas/contas-nacionais/9088-produto-interno-bruto-dos-municipios.html (accessed on 15 June 2026).
  42. Silva, L.S.; de Moraes, R.D.C.M.; de Souza, A.P.M.; Pereira, S.L.D.S.; Vianna, J.R.N.T.; Magalhães, R.A.B.; dos Reis, A.A.; Silva, C.D.S. Análise dos indicadores de desempenho de operadores de transporte de passageiros por navegação interior na linha Belém–Salvaterra. ARACÊ 2025, 7, e7119. [Google Scholar] [CrossRef]
  43. Nunes, G. Videografia de Mestre Damasceno. Available online: https://mestredamasceno.com.br/videografia/ (accessed on 21 June 2026).
  44. Nunes, A.C.M.; Pacheco, A.S. Arte(manhas) da cultura afroindígena: Trajetórias e experiências de Mestre Damasceno pelo Marajó dos Campos. Boitatá 2012, 7, 1–19. [Google Scholar] [CrossRef]
  45. IDEFLOR-Bio. Diagnóstico do Meio Físico Visando à Reavaliação da Unidade de Conservação da Natureza Municipal “Reserva Ecológica da Mata do Bacurizal e do Lago Caraparú”: Salvaterra-PA; IDEFLOR-Bio: Belém, Brazil, 2025; 68p.
  46. FAPESPA. Marajó se Destaca por Natureza, Turismo e Agropecuária. Available online: https://www.fapespa.pa.gov.br/2024/03/19/marajo-se-destacada-por-natureza-turismo-e-agropecuaria/ (accessed on 21 June 2026).
  47. Pereira da Silva, M.H. Como trabalham os búfalos na Amazônia marajoara. Aceno—Rev. De Antropol. Do Cent.-Oeste 2025, 12, 127–144. Available online: https://periodicoscientificos.ufmt.br/ojs/index.php/aceno/article/view/19634 (accessed on 21 June 2026).
  48. Borja, I.M.F.S.; Corbin, H.P. Desvendando experiências turísticas na Ilha do Marajó: Motivações e escolhas rumo a um turismo sustentável. Tur. Visão E Ação 2025, 27, e20269. [Google Scholar] [CrossRef]
  49. SECOM. Nova PA-154 Garante Mobilidade e Fomenta o Turismo no Marajó. Available online: https://agenciapara.com.br/noticia/1385/nova-pa-154-garante-mobilidade-e-fomenta-o-turismo-no-marajo (accessed on 15 June 2026).
  50. Brasil. Lei No. 12.651, de 25 de Maio de 2012, Que Dispõe Sobre a Proteção da Vegetação Nativa. Available online: https://www.planalto.gov.br/ccivil_03/_ato2011-2014/2012/lei/l12651.htm (accessed on 20 June 2025).
  51. Brasil. Lei No. 9.985, de 18 de Julho de 2000, Que Institui o Sistema Nacional de Unidades de Conservação da Natureza (SNUC). Available online: https://www.planalto.gov.br/ccivil_03/leis/l9985.htm (accessed on 20 June 2025).
  52. Brasil. Decreto de 22 de Novembro de 2001, Que Cria a Reserva Extrativista Marinha de Soure. Available online: https://legislacao.presidencia.gov.br/atos/?tipo=DSN&numero=22/11-3&ano=2001&ato=af1ITSE50MNpWTe80 (accessed on 20 June 2025).
  53. Salvaterra. Lei No. 109, de 19 de Julho de 1987, Que Cria a Reserva Ecológica da Mata do Bacurizal e do Lago Caraparú. Available online: https://acervo.socioambiental.org/acervo/documentos/lei-n-109-de-190687-cria-reserva-ecologica-da-mata-do-bacurizal-e-do-lago (accessed on 20 June 2025).
  54. ICMBio. Reserva Extrativista Marinha de Soure. Available online: https://www.gov.br/icmbio/pt-br/assuntos/biodiversidade/unidade-de-conservacao/unidades-de-biomas/marinho/lista-de-ucs/resex-marinha-de-soure/resex-marinha-de-soure (accessed on 28 March 2026).
  55. Lapola, D.M.; Pinho, P.; Barlow, J.; Aragão, L.E.O.C.; Berenguer, E.; Carmenta, R.; Liddy, H.M.; Seixas, H.; Silva, C.V.J.; Silva-Junior, C.H.L.; et al. The drivers and impacts of Amazon forest degradation. Science 2023, 379, eabp8622. [Google Scholar] [CrossRef] [PubMed]
  56. Pellin, A.; Dias, L.; Soares, N.; Prado, F. Management effectiveness and deforestation in protected areas of the Brazilian Amazon. PARKS 2022, 28, 45–54. [Google Scholar] [CrossRef]
  57. Azevedo, A.A.; Rajão, R.; Costa, M.A.; Stabile, M.C.C.; Macedo, M.N.; dos Reis, T.N.P.; Alencar, A.; Soares-Filho, B.S.; Pacheco, R. Limits of Brazil’s Forest Code as a means to end illegal deforestation. Proc. Natl. Acad. Sci. USA 2017, 114, 7653–7658. [Google Scholar] [CrossRef] [PubMed]
  58. MapBiomas. Monitor da Fiscalização. Available online: https://plataforma.alerta.mapbiomas.org (accessed on 20 June 2025).
  59. Soares-Filho, B.; Rajão, R.; Macedo, M.; Carneiro, A.; Costa, W.; Coe, M.; Rodrigues, H.; Alencar, A. Cracking Brazil’s Forest Code. Science 2014, 344, 363–364. [Google Scholar] [CrossRef] [PubMed]
  60. Coelho-Junior, M.G.; Valdiones, A.P.; Shimbo, J.Z.; Silgueiro, V.; Rosa, M.; Marques, C.D.L.; Oliveira, M.; Araújo, S.; Azevedo, T. Unmasking the impunity of illegal deforestation in the Brazilian Amazon: A call for enforcement and accountability. Environ. Res. Lett. 2022, 17, 041001. [Google Scholar] [CrossRef]
  61. Nunes, F.S.M.; Soares-Filho, B.S.; Oliveira, A.R.; Veloso, L.V.S.; Schmitt, J.; Van der Hoff, R.; Assis, D.C.; Costa, R.P.; Börner, J.; Ribeiro, S.M.C.; et al. Lessons from the historical dynamics of environmental law enforcement in the Brazilian Amazon. Sci. Rep. 2024, 14, 1828. [Google Scholar] [CrossRef] [PubMed]
  62. Salem, M.; Tsurusaki, N. Impacts of rapid urban expansion on peri-urban landscapes in the Global South: Insights from landscape metrics in Greater Cairo. Sustainability 2024, 16, 2316. [Google Scholar] [CrossRef]
  63. Imazon. Ocorrências de Desmatamento Dentro e no Entorno das Áreas Protegidas Aumentaram 13% Em um Ano na Amazônia. Available online: https://imazon.org.br/imprensa/ocorrencias-de-desmatamento-dentro-e-no-entorno-das-areas-protegidas-aumentaram-13-em-um-ano-na-amazonia/ (accessed on 20 June 2025).
  64. Menegassi, D. Ministério do Meio Ambiente tem Menor Orçamento das Últimas duas Décadas. Available online: https://oeco.org.br/noticias/ministerio-do-meio-ambiente-tem-menor-orcamento-das-ultimas-duas-decadas/ (accessed on 20 June 2025).
  65. Yanai, A.M.; de Alencastro Graça, P.M.L.; Ziccardi, L.G.; Escada, M.I.S.; Fearnside, P.M. Brazil’s Amazonian deforestation: The role of landholdings in undesignated public lands. Reg. Environ. Chang. 2022, 22, 30. [Google Scholar] [CrossRef]
  66. Candino, M.; Brandão, A.; Munger, J.; Rausch, L.; Gibbs, H.K. Protected areas in the Brazilian Amazon threatened by cycles of property registration, cattle ranching, and deforestation. Land 2024, 13, 901. [Google Scholar] [CrossRef]
  67. Costa, V.O.B.; Koehler, H.S.; Robert, R.C.G. Characterization of technical and legal irregularities in management plans in the Brazilian Amazon. Trees For. People 2024, 16, 100548. [Google Scholar] [CrossRef]
  68. Lagneaux, E.G.; Callo-Concha, D.; Speelman, E.N.; Descheemaeker, K. Panarchy to explore land use: A historical case study from the Peruvian Amazon. Sustain. Sci. 2024, 19, 1187–1203. [Google Scholar] [CrossRef]
  69. Miranda, R.; Schwaninger, M.; Lucena, A.; Logullo, Y.; Belderrain, M.C.N.; Carvalho, T.C.M.B.; Sato, R.C. Sustainable Amazon: A systemic inquiry with native populations. Sustainability 2023, 15, 7517. [Google Scholar] [CrossRef]
  70. Bataier, C. Agricultores de Portel (PA) Denunciam Prefeitura por Tentativa de Desmonte de Assentamentos. Available online: https://www.brasildefato.com.br/2025/06/07/agricultores-de-portel-pa-denunciam-prefeitura-por-tentativa-de-desmonte-de-assentamentos/ (accessed on 20 June 2025).
  71. SECOM. Programa Regulariza Pará Cancela Mais de 200 CAR Irregulares Ligados a Projetos de Carbono. Agência Pará. 29 January 2023. Available online: https://agenciapara.com.br/noticia/41007/programa-regulariza-para-cancela-mais-de-200-car-irregulares-ligados-a-projetos-de-carbono (accessed on 22 June 2026).
  72. Correia, A.M.; Lopes, L.F. Revisiting biodiversity and ecosystem functioning through the lens of complex adaptive systems. Diversity 2023, 15, 895. [Google Scholar] [CrossRef]
  73. Hong, P.; Schmid, B.; De Laender, F.; Eisenhauer, N.; Zhang, X.; Chen, H.; Craven, D.; De Boeck, H.J.; Hautier, Y.; Petchey, O.L.; et al. Biodiversity promotes ecosystem functioning despite environmental change. Ecol. Lett. 2022, 25, 555–569. [Google Scholar] [CrossRef] [PubMed]
Figure 1. Study area: Immediate Geographic Region of Soure–Salvaterra, Pará, Brazil.
Environments 13 00378 g001
Figure 2. Methodological flowchart of the bivariate spatial autocorrelation analysis using LISA for 1985 and 2023.
Environments 13 00378 g002
Figure 3. Bivariate Local Moran’s I (LISA) clusters between natural areas in 1985 and anthropized areas in 2023 in the municipalities of the Immediate Geographic Region of Soure–Salvaterra: (a) Santa Cruz do Arari; (b) Soure; (c) Cachoeira do Arari.
Environments 13 00378 g003
Figure 4. Bivariate Local Moran’s I (LISA) clusters between natural areas in 1985 and anthropized areas in 2023 in the municipalities of the Immediate Geographic Region of Soure–Salvaterra: (a) Salvaterra; (b) Ponta de Pedras; (c) Muaná.
Environments 13 00378 g004
Figure 5. Percentage distribution of bivariate local spatial autocorrelation (LISA) categories in the municipalities of the Immediate Geographic Region of Soure–Salvaterra, Pará, Brazil: (a) Low–High; (b) High–High; (c) High–Low; and (d) Low–Low. CA: Cachoeira do Arari; SCA: Santa Cruz do Arari; PP: Ponta de Pedras.
Environments 13 00378 g005aEnvironments 13 00378 g005b
Figure 6. Spatial evidence of peri-urban anthropization along the coastal zone of the Immediate Geographic Region of Soure–Salvaterra: (a) LULC in 1985; (b) LULC in 2023; (c) Google Satellite image accessed through QGIS 3.34.8 using the QuickMapServices plugin version 0.19.34 as visual support; and (d) Bivariate Local Moran’s I (LISA) clusters. Source of panel (c): Google Satellite © Google; accessed on 1 May 2026.
Environments 13 00378 g006aEnvironments 13 00378 g006b
Figure 7. Expansion of agricultural and livestock activities associated with the High–High spatial autocorrelation pattern in the Immediate Geographic Region of Soure–Salvaterra: (a) LULC in 1985; (b) LULC in 2023; (c) Google Satellite image accessed through QGIS 3.34.8 using the QuickMapServices plugin version 0.19.34 as visual support; and (d) Bivariate Local Moran’s I (LISA) clusters. Source of panel (c): Google Satellite © Google; accessed on 1 May 2026.
Environments 13 00378 g007
Figure 8. Protected areas in the Immediate Geographic Region of Soure–Salvaterra, Pará, Brazil.
Environments 13 00378 g008
Figure 9. Soure Marine Extractive Reserve, Pará, Brazil, highlighting coastal vegetation and the estuarine landscape.
Environments 13 00378 g009
Table 1. Reclassification of MapBiomas LULC classes for the application of the Bivariate Local Moran’s I (LISA).
CategoryValue (1985)Value (2023)MapBiomas Classes (Codes)
Natural areas103: Forest Formation; 4: Savannah Formation; 5: Mangrove; 6: Floodable Forest; 49: Arboreal Restinga; 11: Wetland and Swampy Area; 12: Grassland Formation; 29: Rocky Outcrop; 32: Hypersaline tidal flat; 50: Herbaceous Restinga; 33: Water body; 23: Beach, Dune and Sand Spot.
Anthropized areas019: Forestry; 14: Agriculture/Livestock Farming; 15: Pasture; 18: Agriculture; 19: Temporary Crop; 20: Sugarcane; 21: Mosaic of Uses; 35: Oil palm; 36: Perennial Crop; 39: Soybean; 40: Rice; 41: Other Temporary Crops; 46: Coffee; 47: Citrus; 48: Other Perennial Crops; 62: Cotton; 24: Urbanized Area; 25: Other Non-Vegetated Areas; 30: Mining; 31: Aquaculture.
Table 2. Interpretation of bivariate spatial autocorrelation categories (LISA).
Category (Quadrant)Spatial AssociationInterpretation
High–High (HH)High presence of natural areas in 1985 associated with high levels of anthropized areas in 2023Areas under greater anthropogenic pressure between the reference years
High–Low (HL)High presence of natural areas in 1985 associated with low levels of anthropized areas in 2023Maintenance of preserved or less altered areas
Low–High (LH)Low presence of natural areas in 1985 associated with high levels of anthropized areas in 2023Persistence of anthropogenic use
Low–Low (LL)Low presence of natural areas in 1985 associated with low levels of anthropized areas in 2023Areas under lower anthropogenic pressure or compatible with possible natural regeneration
Table 3. Bivariate Local Moran’s I categories and socioeconomic indicators in the municipalities of the Immediate Geographic Region of Soure–Salvaterra, Pará, Brazil.
MunicipalityHigh–High (%)Low–High (%)PopulationPopulation Density (Inhabitants km−2)Territorial Area (km2)GDP per Capita (BRL)Gross Value Added of Agriculture and Livestock (BRL × 1000)
Soure1.160.4524,2048.472857.34913,995.5653,587.834
Salvaterra3.531.1324,12926.27918.56311,218.7736,072.596
Cachoeira do Arari1.280.0323,9817.743100.26114,790.9794,533.040
Santa Cruz do Arari0.050.1074456.911076.65215,479.5137,430.059
Muaná0.800.0145,36812.063763.13010,235.72102,947.190
Ponta de Pedras0.260.0224,9847.433363.74312,543.7069,027.147
Note: High–High and Low–High refer to the bivariate Local Moran’s I categories obtained in this study. GDP = gross domestic product; BRL = Brazilian real.
Disclaimer/Publisher’s Note: The statements, opinions and data contained in all publications are solely those of the individual author(s) and contributor(s) and not of MDPI and/or the editor(s). MDPI and/or the editor(s) disclaim responsibility for any injury to people or property resulting from any ideas, methods, instructions or products referred to in the content.