Article

Seasonal and Climatic Influences on Soil Microbial Communities and Their Enzymatic Activities in Five Tea Plantations in Jorhat, Assam, India


by
Bobita Payeng
1,
Ranjit Kumar Paul
2,
Md. Yeasin
2,
Animesh Sarkar
3,
C. S. Maiti
3,
Saumik Panja
4,*,
Manoj Dutta
5,
Rusha Pal
6,
Diganta Deka
7,
Harisadhan Malakar
8,
Jintu Dutta
8,
Jiban Saikia
9,
Sagarika Das
10 and
Tanmoy Karak
11,*
1
Upper Assam Advisory Centre, Tea Research Association, Dikom, Dibrugarh 786101, India
2
ICAR-Indian Agricultural Statistics Research Institute, New Delhi 110012, India
3
Department of Horticulture, School of Agricultural Sciences, Nagaland University, Medziphema 797106, India
4
University of California, San Francisco 505 Parnassus Ave, San Francisco, CA 94143, USA
5
Department of Soil and Water Conservation, School of Agricultural Sciences, Nagaland University, Medziphema Campus, Medziphema 797106, India
6
Department of Microbiology, Molecular Genetics, and Immunology, University of Kansas Medical Center, 3901 Rainbow Boulevard, Kansas City, KS 66160, USA
7
North Bank Advisory Centre, Tea Research Association, Thakurbari 784503, India
8
Soils Department, Tocklai Tea Research Institute, Tea Research Association, Jorhat 785008, India
9
Department of Chemistry, Dibrugarh University, Dibrugarh 786004, India
10
Multidisciplinary Research Unit, Diphu Medical College & Hospital, Diphu 782462, Karbi Anglong, India
11
Department of Soil Science, School of Agricultural Sciences, Nagaland University, Medziphema Campus, Medziphema 797106, India
*
Authors to whom correspondence should be addressed.
Environments 2026, 13(6), 314; https://doi.org/10.3390/environments13060314

Submission received: 31 January 2026 / Revised: 17 April 2026 / Accepted: 27 May 2026 / Published: 3 June 2026
(This article belongs to the Topic Soil Quality: Monitoring Attributes and Productivity)

Abstract

This study examines the effects of climatic variability on bacterial and fungal populations, as well as enzymatic activities innutrient-rich, organic soils that support tea plants (Camellia sinensis L). Conducted from 2016 to 2019 across five district tea estates (TEs) in the Jorhat district of Assam, India, this research investigates the intricate relationships among these parameters. The findings indicate that bacterial and fungal communities exhibit optimal growth within a temperature range of 18 to 30 °C, establishing a critical threshold for their metabolic activity. A significant positive correlation was observed between the abundance of these microbial populations and the corresponding soil enzymatic activities, underscoring the essential role of these robust microbial communities in sustaining vital soil processes. Hierarchical cluster analysis identified two distinct groups of TEs that displayed consistent patterns of microbial behaviour across varying seasonal conditions. Furthermore, principal component analysis demonstrated that the first three principal components accounted for over 80% of the variability observed in the microbial and enzymatic data sets. This research contributes valuable insights into the dynamic interactions between seasonal fluctuations and soil health, highlighting the crucial contributions of bacterial and fungal populations, along with their enzymatic activities, to the complex ecosystem underlying tea cultivation.

1. Introduction

Tea is a widely consumed beverage, distinguished by its aroma and flavour, which is produced by steeping the tender leaves, delicate buds, or slender twigs of the Camellia sinensis L. plant in hot or boiling water [1,2]. The origin of tea dates back thousands of years to the fertile regions of China. Over time, tea cultivation and consumption have expanded to approximately 48 countries worldwide, flourishing within the latitudinal range of 45° N to 34° S [3,4,5,6]. As a result, tea has become an integral component of the cultural practices of many societies, serving as a staple beverage deeply embedded in both tradition and community [6,7]. Community rituals surrounding tea consumption present a rich area of exploration within both botanical studies and the human experience [8,9,10].
Tea (Camellia sinensis L.) is an acidophilic perennial cash crop that thrives optimally in soils with a pH range of 4.5 to 5.5 [11,12,13]. The species is particularly suited to warm, humid environments found in subtropical and tropical climates. Optimal growth occurs at temperatures between 10 °C and 30 °C, with a mean annual temperature of approximately 20 °C [5]. Regions where tea cultivation is predominantly concentrated tend to exhibit these favourable climatic conditions. It is important to note that temperatures falling below 10 °C can damage tea plants, while those exceeding 30 °C may inhibit growth and adversely affect leaf quality. Such temperature extremes can significantly influence the diverse flavour profiles that tea aficionados appreciate. Thus, understanding the environmental requirements for tea cultivation is crucial for optimising production and maintaining the quality of the final product [14].
According to statistics from the Food and Agriculture Organization (FAO), tea is cultivated on approximately 5,245,319 hectares globally, leading to an annual production of approximately 28,191,556.18 tonnes of tea leaves. This amount translates to roughly 6,257,428 tonnes of processed tea in 2021 [15]. India, while accounting for only 10.44% of the global tea-growing area, is the second-largest producer and consumer of tea and the leading exporter. The tea industry plays a significant role in India’s economy, contributing around USD 660 million annually [16]. However, tea cultivation is increasingly challenged by climate change, which manifests as extreme weather events and shifts in temperature and rainfall patterns, thereby impacting production levels [17].
In tea-growing regions, diverse soil microbial communities flourish in the rhizosphere, encompassing algae, bacteria, fungi, and protozoa, which play critical roles in the tea soil ecosystem [18]. These microorganisms exert both direct and indirect influences on the physical, chemical, and biological properties of the soil [19]. They are integral to key soil processes, including the decomposition of organic matter, which e releases essential nutrients for plant health. Furthermore, soil microbes are pivotal in nutrient recycling, thereby contributing to overall plant growth. They also enhance soil structure by producing of polysaccharides and other compounds, which improve soil stability and water retention [20]. Moreover, certain soil microorganisms can suppress plant diseases by outcompeting or attacking detrimental pathogens [21].
Research conducted by Koga et al. [22] revealed that microbial activity in tea fields in Numazu, Shizuoka, Japan, was approximately 1.2 times higher in plots treated with organic fertilisers than in those treated with compound fertilisers. Additionally, investigations by Zhang et al. [23] indicated that soil acidification can adversely affect microbial populations in tea fields, leading to decreased cellulose degradation rates, which in turn affects soil nitrification activity. As a result, the diversity of soil microbial communities is frequently recognised as a critical indicator of soil health and quality [24]. Furthermore, environmental factors, including fluctuations in soil temperature, annual rainfall, and humidity, significantly influence the productivity of tea plants. The composition of soil microorganisms, along with various soil enzymatic activities, plays a vital role in shaping the growing conditions for tea [25].
Various enzymes, collectively referred to as soil enzymes, are present in tea-growing soil, including soil dehydrogenase (DH), urease, and phosphatase, which are produced by soil microorganisms [26]. These enzymes are classified as extracellular or intracellular based on their functional roles in microbes [27]. Soil dehydrogenase, in particular, is an intracellular enzyme synthesised by soil microorganisms that plays a critical role in the oxidation of soil organic matter by transferring protons and electrons from substrates to electron acceptors [28]. Dehydrogenase is a widely recognised biological indicator of microbial activity in soils and a valuable parameter for evaluating microbial oxidative processes. Additionally, it helps quantify the impact of chemical fertilisers on soil disturbance within the ecosystem [29]. While seasonal variations in DH have been documented in various field crops [30], there is a notable lack of data on its activity in tea cultivation. Therefore, further research focusing on the enzymatic activity in tea-growing soils is warranted to enhance our understanding of this critical aspect.
Phosphatase is an enzyme that facilitates the breakdown of phosphoric acid into phosphate ions through the action of microbial cells, which subsequently release these ions into the soil environment. These enzymes play a vital role in phosphorus cycling and are essential for maintaining the soil ecosystem [31]. Under phosphorus-deficient conditions, phosphatase secretes phosphate ions into the soil, and its activity is influenced by various climatic factors. Based on soil pH, phosphatase is categorised into two types: acid phosphatase (AcP) and alkaline phosphatase (ALP). In various soil contexts, AcP is regarded as a robust indicator of organic phosphorus mineralisation [32]. Research has demonstrated that intercropping systems positively affect AcP activity [33]. However, other studies indicate that while intercropping enhances crop yields and soil nutrient availability, its impact on the activities of soil enzymes remains minimal when compared to monoculture systems, such as that of tea cultivation [26].
Assam, situated in Northeast India, is a significant contributor to the country’s tea industry, accounting for approximately 55% of the total national tea production [34,35]. Within Assam, the Jorhat district is recognised as the tea capital, located between latitudes 26°20′ N and 27°10′ N and longitudes 93°57′ E and 94°37′ E in the central part of the Brahmaputra Valley. The tea produced in Jorhat is distinguished by its vibrant colour and brisk flavour, which has garnered it a prominent reputation among global tea-producing regions. The district is home to approximately 135 large tea gardens, which play a crucial role in the region’s economic and agricultural landscape.
In Jorhat, dominant soil classifications include Typic Hapludults, Ruptic Ultic Dystrudepts, and Ruptic Alfic Dystrudepts [36]. These soils benefit from alluvial deposits originating in the adjacent hills and transported by tributaries of the Brahmaputra River. This process contributes to the formation of predominantly rich loamy textures, which are particularly favourable for tea cultivation. However, it is important to note that certain regions within the district may exhibit sandy soils or heavier loam compositions.
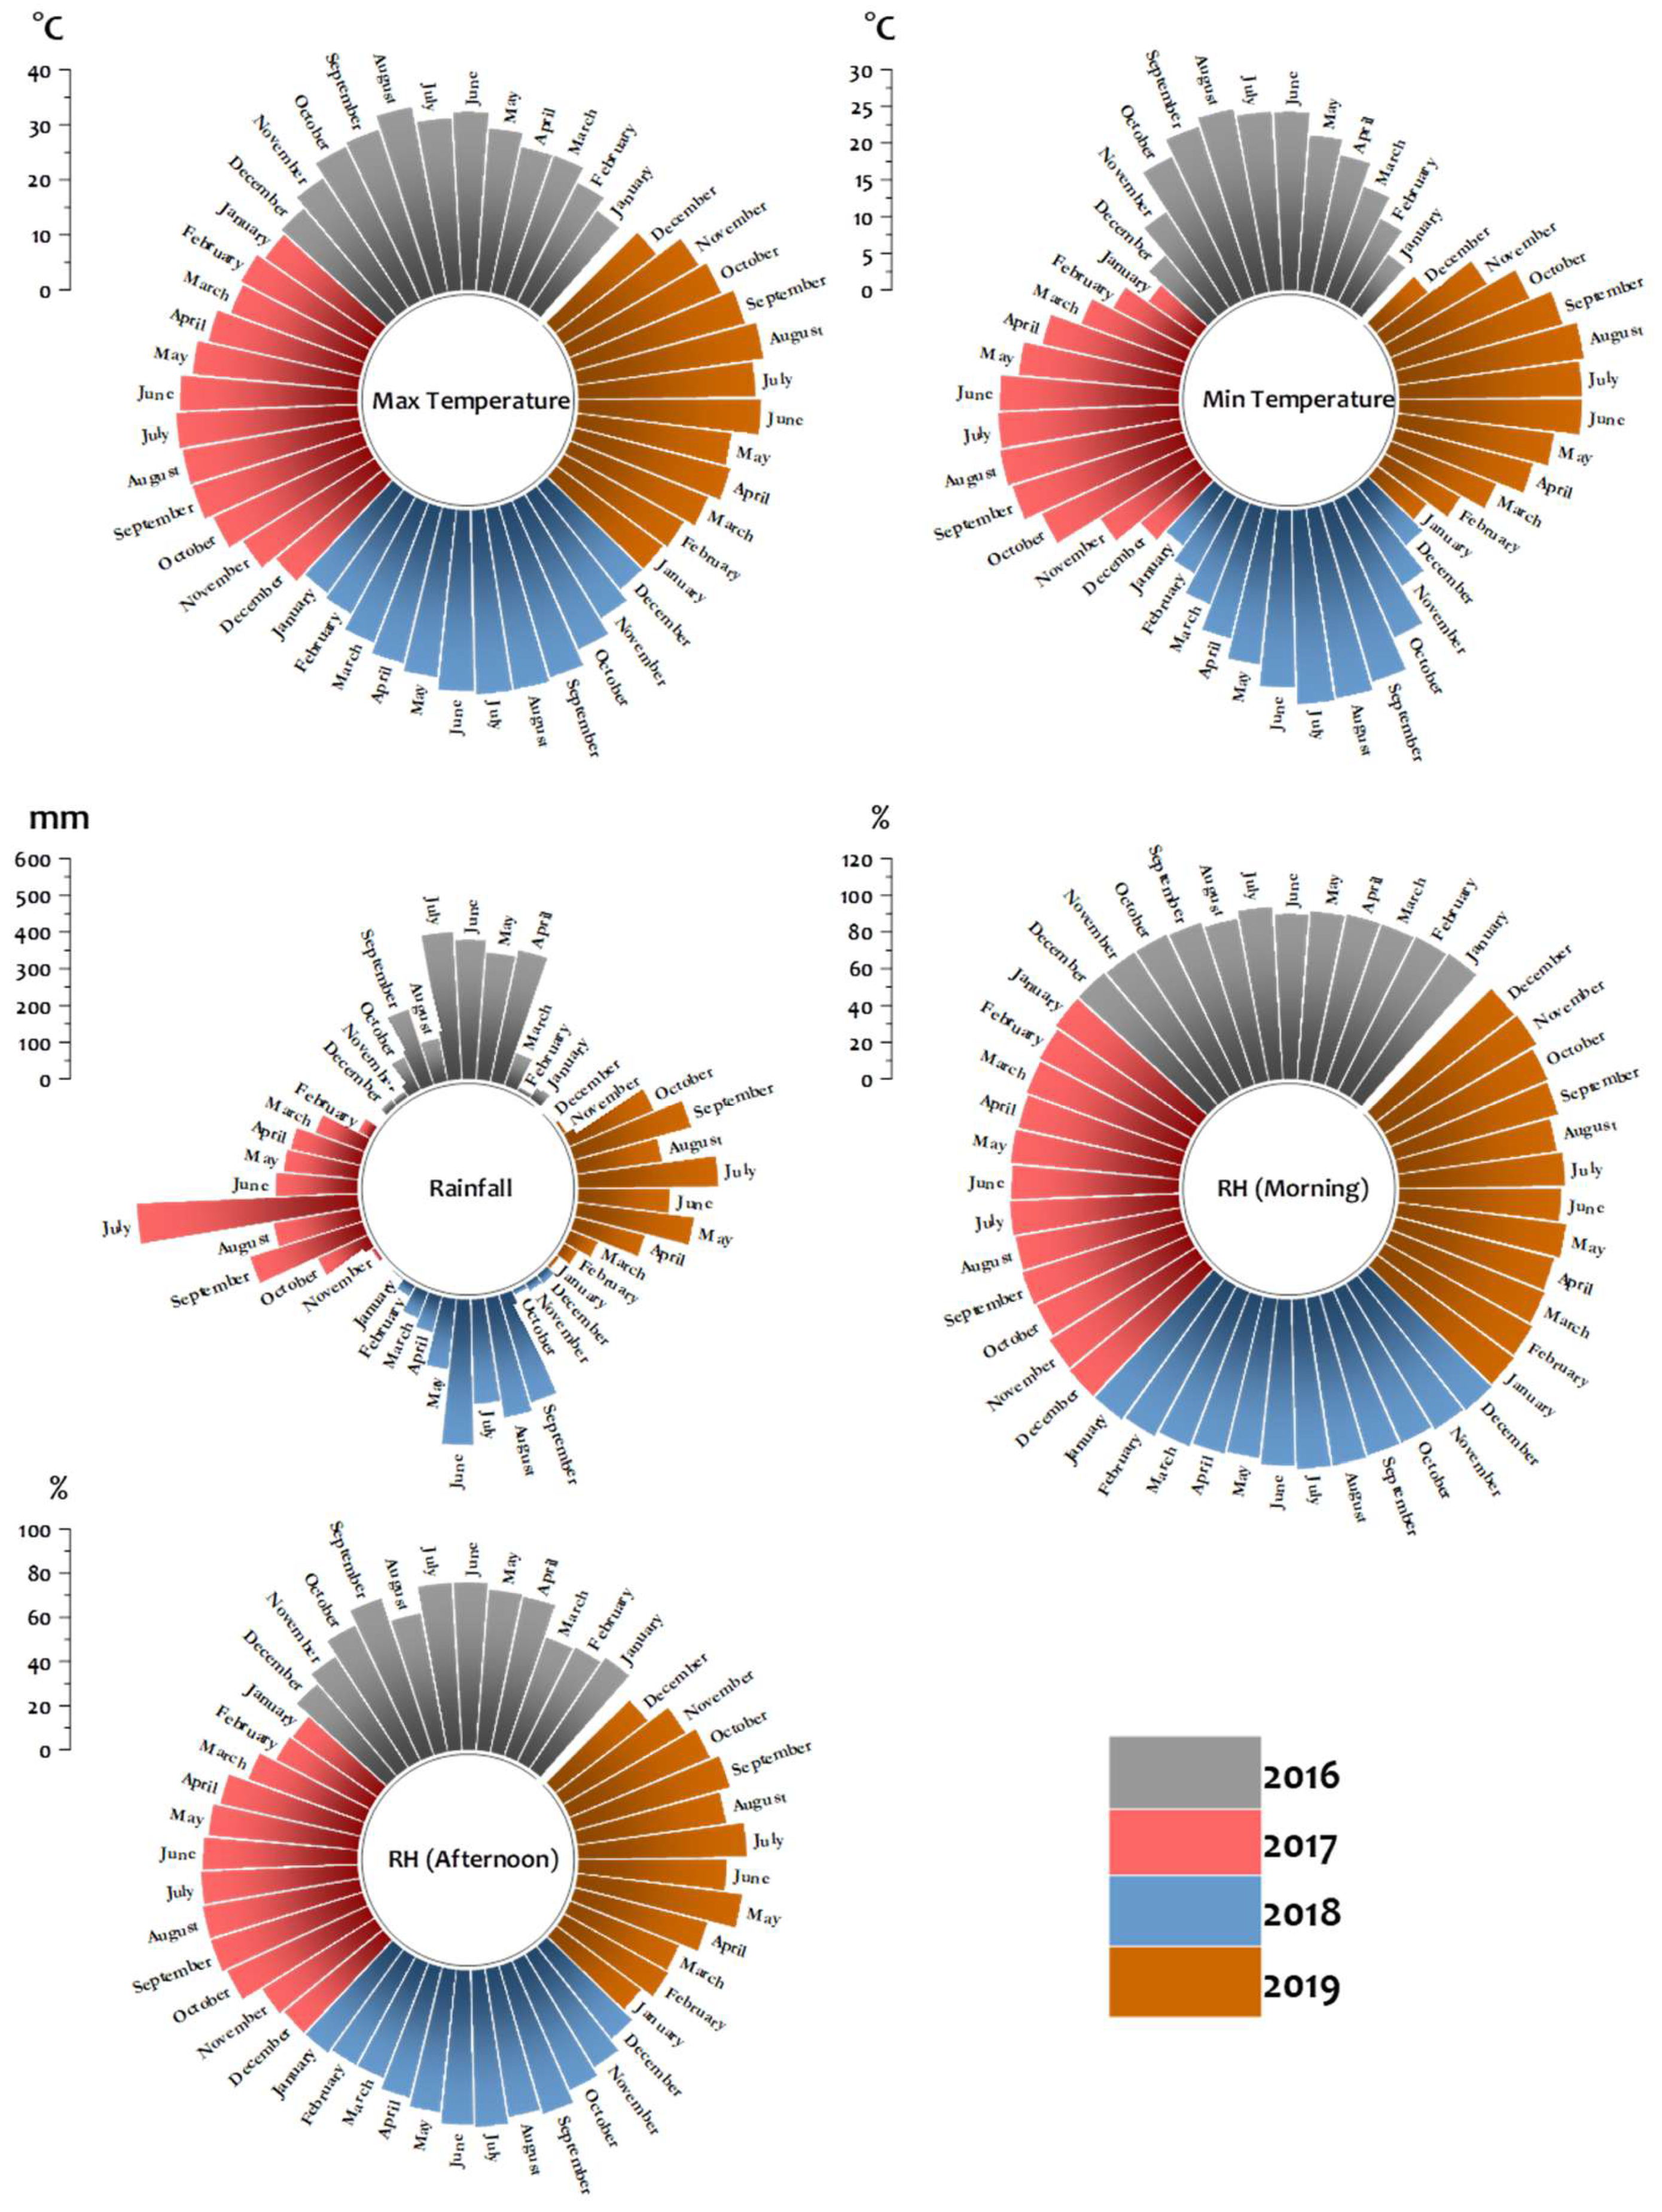
Jorhat plays a crucial role in the tea industry of Assam, particularly concerning production volume. However, the impacts of climate change, manifesting as extreme weather events and alterations in temperature and precipitation patterns, present significant challenges to tea cultivation. Between 2016 and 2019, Jorhat experienced considerable climatic variability, characterised by typical winter seasons, a notably dry monsoon in 2017, heavy rainfall and flooding in 2018, and normal monsoon conditions in both 2016 and 2019 (Figure 1). Summer seasons during this period were generally warmer than the historical average, except for 2018, which recorded slightly cooler temperatures. Despite the prominence of Jorhat tea, often regarded as “the highest-quality tea in the world” for its distinctive aroma and taste, research on seasonal variations in the total soil microbial population and enzyme activity in the tea-growing soils of the Jorhat district remains limited. This gap is particularly critical given the importance of microbial communities in soil health and tea plant development [37]. Typically, the uppermost layer of soil contains substantially more microorganisms, with their abundance diminishing with increasing soil depth [38]. Therefore, it is imperative to investigate the microbial load within the tea soil zone to understand better the ecological dynamics that influence tea quality and productivity.
Investigating soil enzyme activity is essential for understanding the biochemical processes vital to maintaining optimal soil health [39]. This study aims to analyse the seasonal variations in microbial population densities in tea-growing soils from 2016 to 2019. The findings presented herein detail the seasonal fluctuations of microbial populations in selected tea gardens across different seasons, alongside an evaluation of soil health indicators linked to specific enzyme activities, viz., alkaline phosphatase (ALP), acid phosphatase (AcP) and dehydrogenase (DH) in relation to rainfall and temperature. Additionally, this study explores the correlations between various biological properties and climatic variables.

2. Materials and Methods

2.1. Experimental Sites

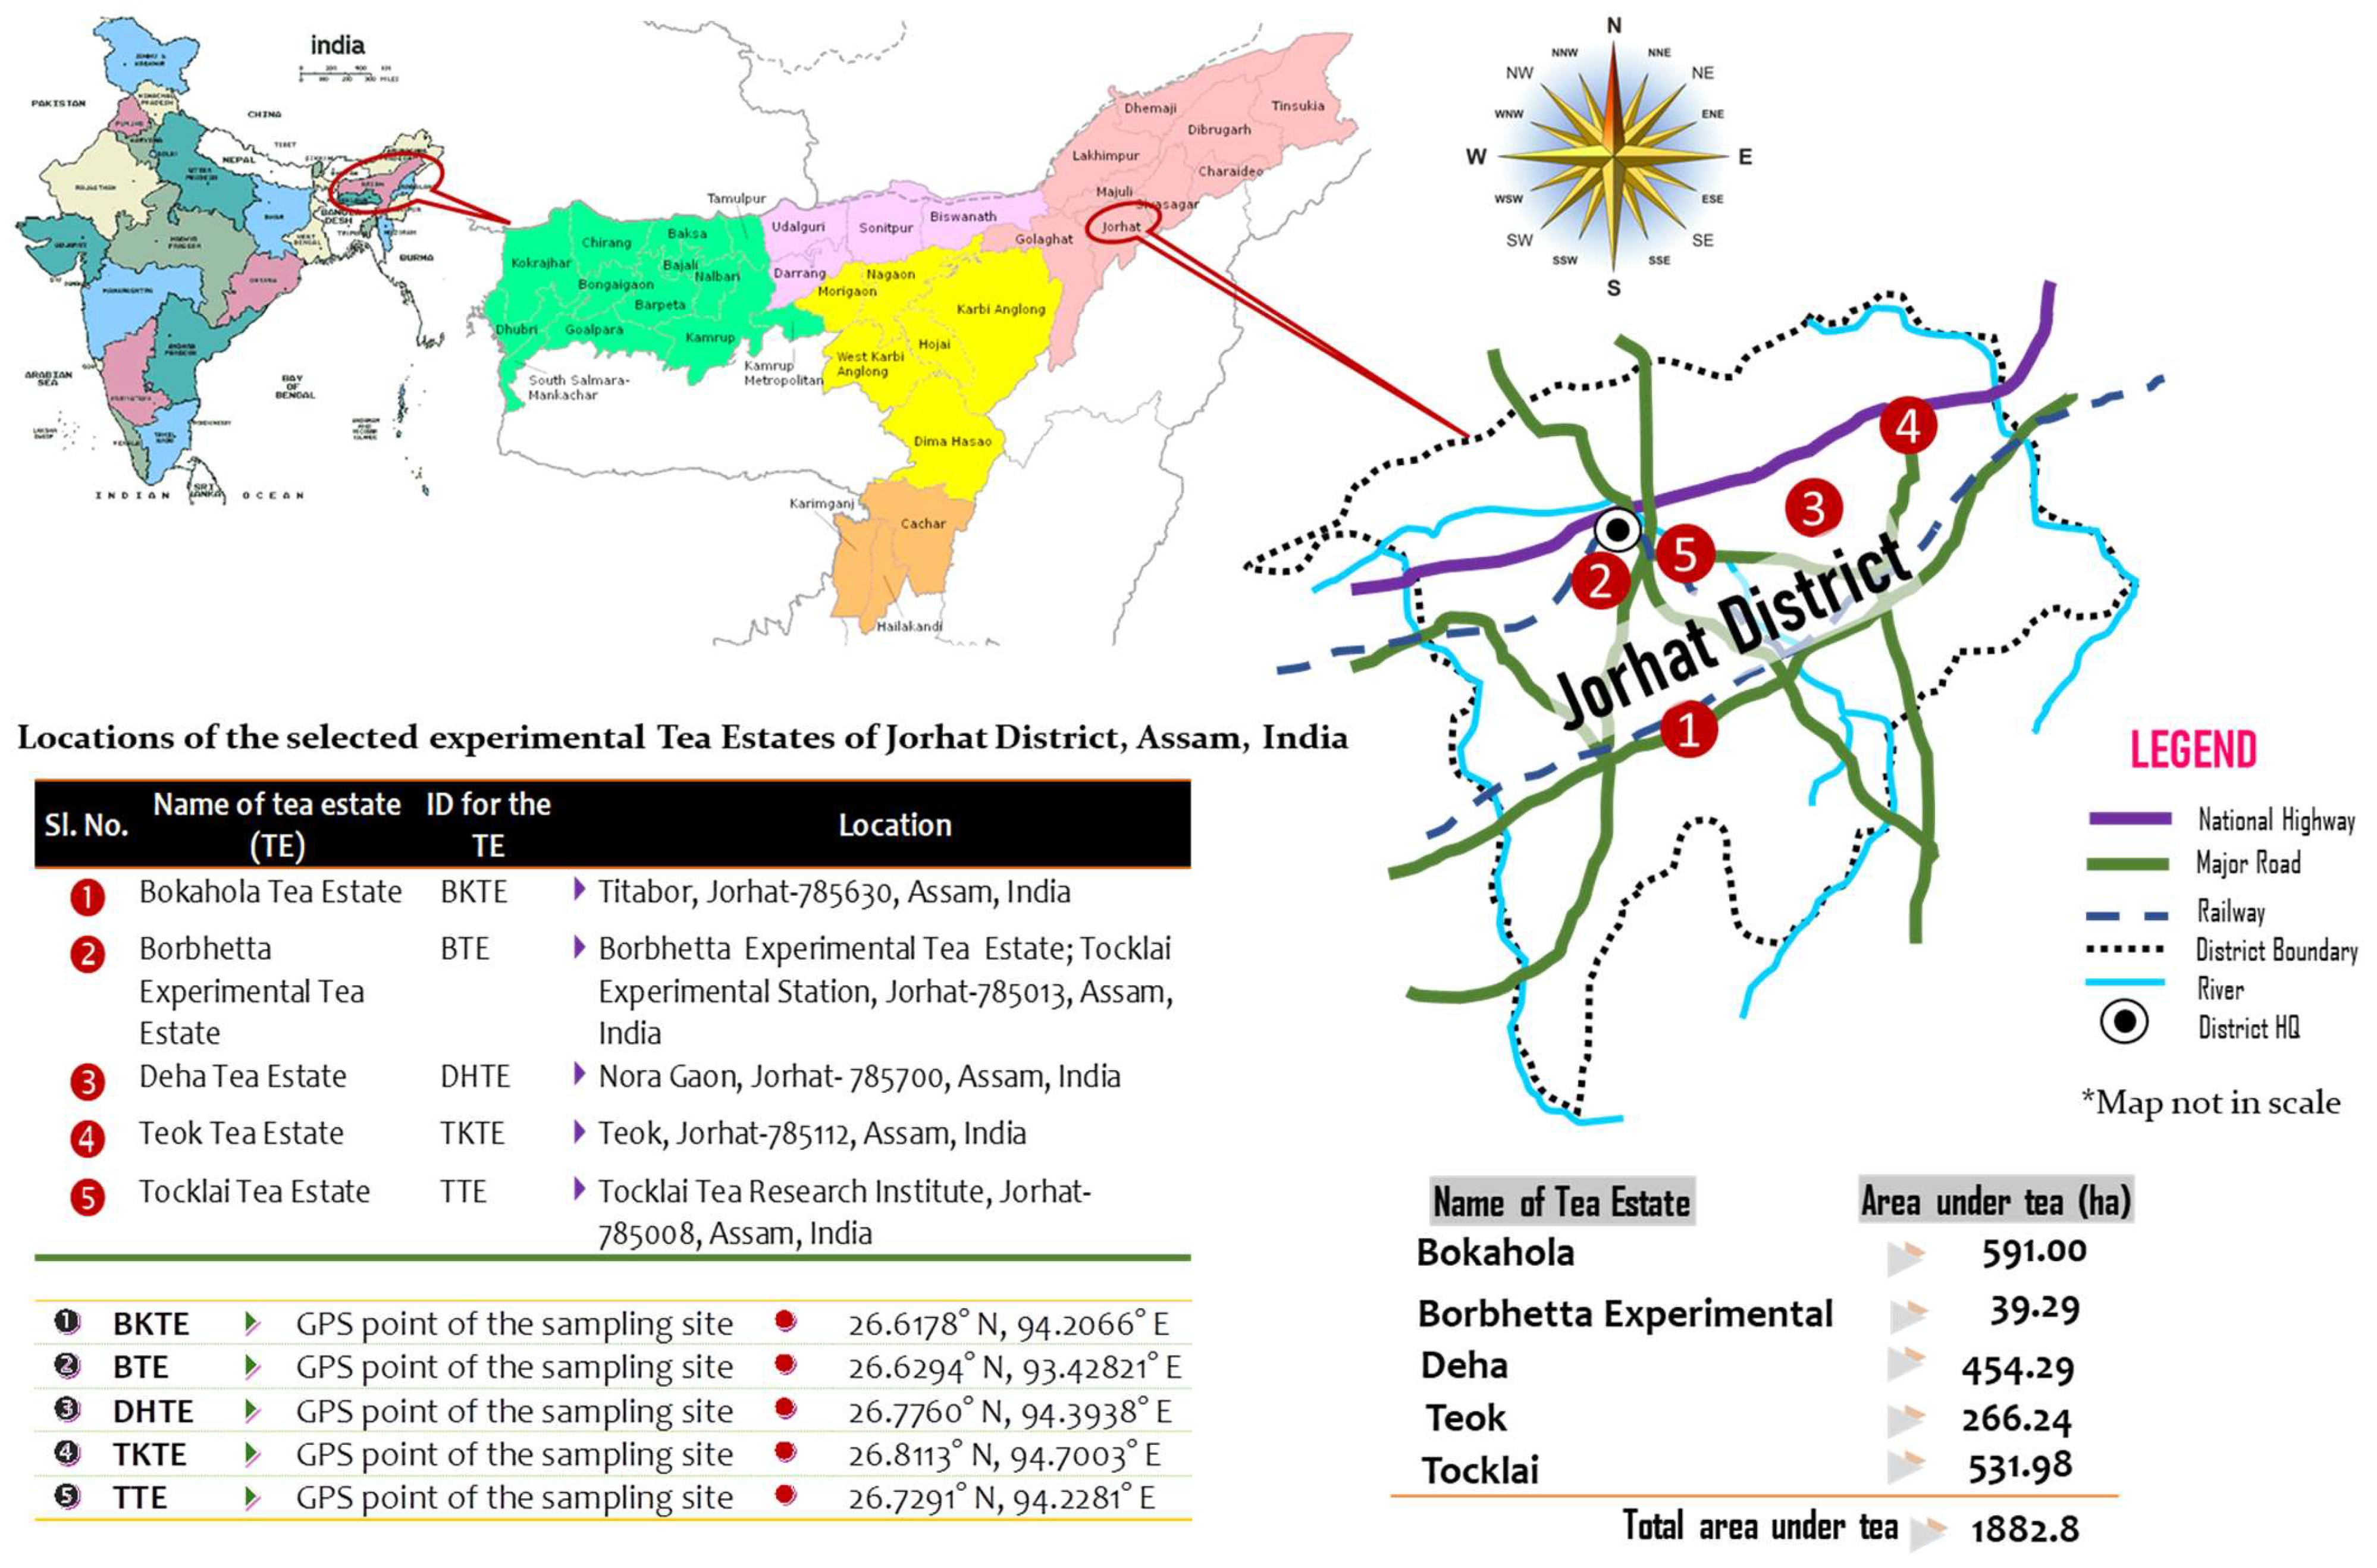
This research was conducted across five designated tea estates (TEs), whereby essential physical and chemical properties were assessed to establish baseline data. The findings are systematically presented in Table 1, providing a comprehensive overview of the selected parameters that underpin the study’s framework. Furthermore, the selection of the five tea estates has been explicitly justified through a statistically robust sampling framework. A stratified purposive sampling design was employed, in which the study area was first divided according to key sources of variability, such as agro-climatic conditions, estate size, and management practices. Within each stratum, one representative estate was selected based on predefined inclusion criteria to ensure comprehensive representation of the dominant production systems. This approach was adopted to capture the heterogeneity of the systems while minimising selection bias. Although the number of estates was limited (n = 5) due to logistical and accessibility constraints, the stratification ensures that the sample remains analytically representative, thereby facilitating valid comparative and inferential statistical analyses.
These selected TEs include:
i.
Bokahola Tea Estate (ID: BKTE): The estate encompasses a total area of 863.59 hectares, of which 591 hectares are dedicated to the cultivation of Camellia sinensis. This significant allocation underscores its role as a major contributor to the region’s tea production dynamics.
ii.
Borbhetta Experimental Tea Estate (ID: BTE): Covering 69.96 hectares, with 39.29 hectares devoted to tea, this estate serves as a valuable site for experimental research, contributing to advancements in tea cultivation techniques.
iii.
Deha Tea Estate (ID: DHTE): The estate encompasses a total cultivation area of 454.29 hectares, of which 266.24 hectares are dedicated to tea cultivation. This delineates the significant tea-growing potential inherent in the region.
iv.
Teok Tea Estate (ID: TKTE): The estate covers an area of 851.80 hectares, of which 531.98 hectares are dedicated to the cultivation of tea. This site is recognised not only for its extensive land area but also for its adherence to high-quality production standards.
v.
Tocklai Tea Estate (ID: TTE): The estate encompasses a total area of 205.04 hectares, of which 118.27 hectares are designated for the cultivation of tea. It is distinguished for its research and development endeavours focused on the improvement of tea quality and the promotion of sustainable agricultural practices.
Situated within the Jorhat district of Upper Assam, these experimental TEs play a crucial role in the local economy while simultaneously offering a visually appealing landscape that reflects the region’s rich heritage of tea cultivation. The geographic coordinates of these experimental TEs are illustrated in Figure 2. All the tea estates involved in this study are members of the Tocklai Tea Research Institute (TTRI), indicating their active engagement with TTRI for advisory services and expertise. These member estates derive significant advantages from the research and development initiatives facilitated by TTRI, which ensures adherence to stringent standards of tea production and overall quality. It is noteworthy that, although the experimental TEs selected for this study have a formal affiliation with TTRI, prior authorisation was obtained for the collection of samples from these estates. This procedure underscores the commitment to ethical research practices and compliance with the operational protocols established by each estate.

2.2. Collection of Soil Samples

Soil samples were systematically collected from February 2016 to January 2019, encompassing three distinct seasonal periods: the extreme summer months (April to June), the intense monsoon season (July to September), and the cool winter months (October to March). To establish a comprehensive sampling strategy, the grid sampling protocol as outlined by Lorenz and Dick [40] and Wollum II [41] was followed (Table S1).
To accurately capture the inherent spatial variability of soils within each tea estate, a soil auger was employed to randomly extract samples from a depth of 0–15 cm at ten carefully selected spots within the designated TEs. These individual samples were subsequently blended to create a composite sample that represents the soil profile of the area. After collection, the homogenised soil samples were distributed on a sterilised plastic tray for meticulous examination, during which extraneous materials, including leaf litter, small root fragments, and detritus, were removed [26,41,42]. The refined soil samples were then portioned into labelled plastic bags to facilitate organised transport and subsequent analysis.
To ensure the integrity of the samples, they were promptly transported to the Laboratory of Tocklai Tea Research Institute in Jorhat, Assam, where they were stored in an ice chest to maintain a cold chain. To prevent cross-contamination between sampling sites, all soil sampling tools were subjected to stringent cleaning protocols. Initially, the tools were washed with water, followed by rinsing with 95% ethanol, and subsequently sterilised by igniting the ethanol to ensure complete evaporation [41].
The collected soil samples were maintained in a refrigerator at a controlled temperature of 4 °C to facilitate the analysis of soil microbial populations and enzyme activities. For microbial counts, the soils were carefully sieved through a 2 mm mesh and rehydrated with autoclaved water to achieve approximately 75% of field capacity. This procedure was subsequently followed by a 5-day incubation period, as advocated by Vieira and Nahas [42], to establish optimal conditions conducive to microbial proliferation.

2.3. Media Composition for the Estimation of Bacteria

The nutrient agar medium was precisely formulated following the protocol established by Bosmans et al. [43]. This enriched medium comprises high-quality meat extract at 3.0 g, peptone at 5.0 g, and agar at 15.0 g, all dissolved in 1.0 L of distilled water. To promote optimal microbial growth, the pH of the medium was carefully adjusted to a neutral level of 7.0.

2.4. Media Composition for the Estimation of Fungi in Soil

A variety of culture media for quantifying bacterial populations in soil have been extensively reported in the scientific literature. For the purpose of this study, the media formulation developed by Chesters and Thornton [44] was adopted. The formulation comprises the following components: dextrose (10 g), peptone (5 g), potassium dihydrogen phosphate (KH2PO4, 1 g), magnesium sulphate heptahydrate (MgSO4.7H2O, 0.5 g), and agar (20 g), all dissolved in 1 L of deionised water. To facilitate the visualisation of the bacterial colonies, rose bengal was incorporated at a dilution of 1:15,000, and the pH of the resulting medium was carefully adjusted to 6.8.

2.5. Microbial Population

To estimate the soil microbial population, the serial dilution plate method was utilised, as described by Johnson and Curl [45]. This methodology involved the use of nutrient agar (NA) medium in conjunction with rose bengal chloramphenicol (RBC) agar medium, building upon the foundational work of Chesters and Thornton [44].
Initially, 10 g of the soil sample was suspended in 100 mL of sterile distilled water within a sterilised container, ensuring a contamination-free environment. Employing a sterilised 10 mL pipette, 10 mL of the resulting soil suspension was transferred to a separate sterilised bottle that contained 90 mL of additional sterilised distilled water. This dilution process was repeated systematically to create further dilutions, specifically achieving 10−1 and 10−5 times diluted soil suspensions.
Following the preparation of the dilutions, 1 mL of the diluted soil suspension was plated onto sterilised Petri dishes in triplicate, allowing for a robust assessment of microbial populations. The incubation temperature was maintained at 30 ± 1 °C for 48 h to promote bacterial growth, while fungal colonies were incubated for a duration of 21 days.
Upon completion of the incubation period, the colonies that developed on the Petri plates were counted meticulously according to the methodology outlined by Case and Johnson [46], enabling the precise quantification of colony-forming unit (CFU) of both bacterial and fungal populations present in the soil samples.
C F U   p e r   g   s o i l = N o   o f   c o l o n i e s v o l u m e m L   i n   p l a t e × d i l l u t i o n   f a c t o r

2.6. Determination of Soil Enzyme Activity

2.6.1. Preparation of Modified Universal Buffer (MUB) for Estimation of Acid and Alkaline Phosphatases (ALPs)

The MUB stock solution was prepared with precision in accordance with the protocols established by Skujiņš et al. [47] and Takano et al. [48]. To formulate the MUB stock solution, 11.6 g of maleic acid (C4H4O4), a compound recognised for its ability to stabilise pH levels, was combined with 12.1 g of tris(hydroxymethyl)aminomethane (C4H11NO3), an essential buffering agent in biological systems. Furthermore, 14.0 g of citric acid (C6H8O7), noted for its multifunctional role in pH regulation, and 6.3 g of boric acid (H3BO3), which enhances overall buffering capacity, were incorporated into the mixture. These constituents were subsequently dissolved in Milli-Q water, which is characterised by its high purity and is essential for laboratory applications, within 488 mL of a 0.1 M sodium hydroxide (NaOH) solution. The preparation was carefully finalised by adjusting the final volume to 1000 mL, yielding a precise buffer solution suitable for analytical and experimental applications.

2.6.2. Alkaline Phosphatase (ALP) Activity

The evaluation of alkaline phosphatase (ALP) activity in soil samples was performed in accordance with established methodologies as described by Tabatabai and Bremner [49] and Tabatabai [50]. Initially, a working solution of the MUB was prepared by alkalising 200 mL of the stock solution with 0.1 M sodium hydroxide to achieve a pH of 11. This solution was subsequently diluted to a final volume of 1000 mL using Milli-Q water, thereby designating it as the MUB working solution. For the preparation of the MUB substrate solution, 0.928 g of p-nitrophenyl phosphate (PNP; C6H6NO6P) was dissolved in 100 mL of the MUB working solution, ensuring that the pH was at 11. Soil samples of 2 g were then placed in sample vials and sealed using Millipore Triple-layer Polysep II Filters (Grade W1, with pore sizes of 1.0 µm, 0.2 µm, and 0.1 µm; Merck KGaA, Darmstadt, Germany). The samples were subsequently freeze-dried and finely ground.
In the reaction phase, 0.25 g of the powdered soil sample was combined with 50 µL of ultra-pure toluene (C7H8), 1 mL of MUB working solution, and 250 µL of MUB substrate solution, then incubated at 37 °C for 1 h in a water bath. The reaction was then incubated by the addition of 250 µL of 0.5 M calcium chloride (CaCl2) and 1 mL of 0.5 M NaOH. The resultant mixture was filtered through a 0.20 micron PTFE membrane filter (Merck KGaA, Darmstadt, Germany).
Finally, the absorbance of the resulting reaction product, p-nitrophenol, was quantified at 410 nm using a UV-VIS spectrophotometer (Varian Cary 60 Bio spectrophotometer, Agilent Technologies, Inc.; Mulgrave, Australia). The ALP activity was subsequently calculated utilising the appropriate equation for enzymatic activity quantification:
A A L P = C × V 1000 t
where A A L P is ALP activity, C is the increase in PNP concentration (μmol), V is the total volume of substrate solution (mL), and t is incubation time (min).

2.6.3. Acid Phosphatase (AcP)

The pH of the MUB stock solution, as described in Section 2.6.1, was carefully adjusted to exactly 6.5 using a 0.1 mol L−1 solution of hydrochloric acid (HCl). Following this adjustment, the solution was diluted to a final volume of 1000 mL with high-purity Milli-Q water, and the mixture was subsequently labelled as the MUB working solution, resulting in the preparation of the MUB substrate solution, which was also maintained at pH 6.5. In the subsequent step, 0.928 g of PNP was carefully dissolved in 100 mL of the MUB working solution, yielding the MUB substrate solution, which was also maintained at pH 6.5. The experimental procedures were executed with the same rigour and methodology employed in the ALP analysis to ensure consistency and reliability of the obtained results.

2.6.4. Soil Dehydrogenase (DH)

Soil dehydrogenase (DH) activity was evaluated in accordance with the methodology established by Casida [51], employing a modified version of the 2,3,5-triphenyl tetrazolium chloride (TTC; C19H17ClN4) reduction technique to yield formazan. A precisely measured, air-dried soil sample of one gram was placed into a 50 mL centrifuge tube, along with 2 mL of distilled water and 2 mL of a 1% TTC solution. The resulting mixture was incubated at 37 °C for two durations: 2 h and 24 h, to facilitate sufficient enzyme activity. A blank sample was concurrently maintained as a control for comparative evaluation. Post-incubation, the samples underwent centrifugation at 8000× g for 10 min, effectively separating the supernatant from the sediment. This supernatant was aliquoted into two separate portions, designated E1 and E2, for additional dilution and analysis.
To each aliquot, 0.2 mL of concentrated sulphuric acid (H2SO4) and 3 mL of toluene were added, followed by vigorous shaking to ensure adequate mixing. The resulting supernatant was subsequently pipetted using a 1000 microlitre (1 mL) micropipette for further quantification. The optical density of the solutions was measured at a wavelength of 485 nm using a UV-visible spectrophotometer (Varian Cary 60 Bio spectrophotometer, Australia). The final results are expressed as U g−1 h−1 (rate of enzyme activity per unit mass of soil over time) converted from micrograms of triphenyl formazan (TPF; C19H16N4).

2.7. Chemicals and Reagents

All chemicals and reagents utilised in the current investigation were procured from Merck KGaA, Darmstadt, Germany. To facilitate the unique identification of the chemicals employed, the corresponding PubChem Compound Identifiers (CIDs), along with their chemical formulas and molecular weights, are provided herein. The used chemicals were: 2,3,5-triphenyl tetrazolium chloride (TTC; C19H17ClN4; PubChem CID: 53249492; molecular weight: 336.8 g mol−1), boric acid (H3BO3; PubChem CID: 7628; molecular weight: 61.84 g mol−1), calcium chloride (CaCl2; PubChem CID: 5284359; molecular weight: 110.98 g mol−1), citric acid (C6H8O7; PubChem CID: 311; molecular weight: 192.12 g mol−1), hydrochloric acid (HCl; PubChem CID: 313; molecular weight: 36.46 g mol−1), magnesium sulphate heptahydrate (MgSO4.7H2O, 0.5 g; PubChem CID: 24843; molecular weight: 246.48 g mol−1), maleic acid (C4H4O4; PubChem CID: 444266; molecular weight: 116.07 g mol−1), p-nitrophenyl phosphate (PNP; C6H6NO6P; PubChem CID: 378; molecular weight: 219.09 g mol−1), potassium dihydrogen phosphate (KH2PO4, 1 g; PubChem CID: 516951; molecular weight: 136.086 g mol−1), sodium hydroxide (NaOH; PubChem CID: 14798; molecular weight: 39.997 g mol−1), sulphuric acid (H2SO4; PubChem CID: 1118; molecular weight: 98.08 g mol−1), toluene (C7H8; PubChem CID: 1140; molecular weight: 92.14 g mol−1), triphenyl formazan (TPF; C19H16N4; PubChem CID: 68274; molecular weight: 300.4 g mol−1), andtris(hydroxymethyl)aminomethane (C4H11NO3; PubChem CID: 6503; molecular weight: 121.14 g mol−1).

2.8. Statistical Analysis

This study aims to apply a variety of statistical distributions to the analysed parameters across distinct seasonal contexts, with the goal of enhancing our comprehension of the intrinsic characteristics of the data. Distribution fitting entails the meticulous selection of a statistical distribution that best reflects the dataset’s unique characteristics. Probability distributions are critical instruments for managing uncertainty; however, selecting an unsuitable distribution can lead to erroneous computations and misinterpretations. To address the diverse analytical requirements presented by varying scenarios, researchers have devised a multitude of probability distributions in recent decades.
In this investigation, several key distributions, including Normal, Log-normal, Gamma, Beta, Cauchy, Exponential, Logistic, and Weibull were implemented. Following the fitting of these distributions to the data, it became imperative to assess their adequacy in representing the observed values. This evaluation was conducted by comparing empirical distributions, derived from sample data, with theoretical distributions obtained from the fitting process, utilising specific goodness-of-fit tests as a diagnostic tool. The optimal distribution for the datasets under examination was identified based on the results of these tests.
To evaluate goodness-of-fit, the Chi-Square test, which examines the null hypothesis that the data adhere to the specified distribution against the alternative hypothesis that they do not, is applied. This rigorous methodology ensures a comprehensive analysis of the data’s compliance with the chosen distribution.
Furthermore, to investigate the relationships between the studied variables and climatic factors, Pearson’s correlation analysis on a seasonal basis was conducted. This analysis provided insights into the strength and direction of linear relationships among the variables. Furthermore, we employed cluster analysis, a prominent unsupervised pattern recognition technique in chemometrics. Utilising hierarchical clustering, this method operates on the principle that objects show greater similarity to those in close proximity than to those positioned further away. The algorithm relied on an increase in the error sum of squares criterion (ESS) as a factors metric for information loss. Throughout this analysis, we considered each possible pair of clusters and merged the two whose combination resulted in the smallest rise in ESS, ultimately visualising the resulting clusters at varying distances through a dendrogram.
To augment analytical capabilities, dimensionality reduction was applied via principal component analysis (PCA). This technique aims to capture a substantial portion of the variance present in the data while reducing the number of variables to a limited set of uncorrelated components. Through the identification of variables based on their factor loadings, indicative of the correlations between the variables and the principal components, PCA facilitates the categorisation of individuals according to their top component scores. The findings were effectively illustrated using a biplot, which conveys both the principal component scores and loadings, providing a comprehensive visual representation of the data’s structure.

3. Results and Discussion

3.1. Microbial Population Within Soil

3.1.1. The Fluctuation of Bacterial Populations in Soil Throughout the Seasons

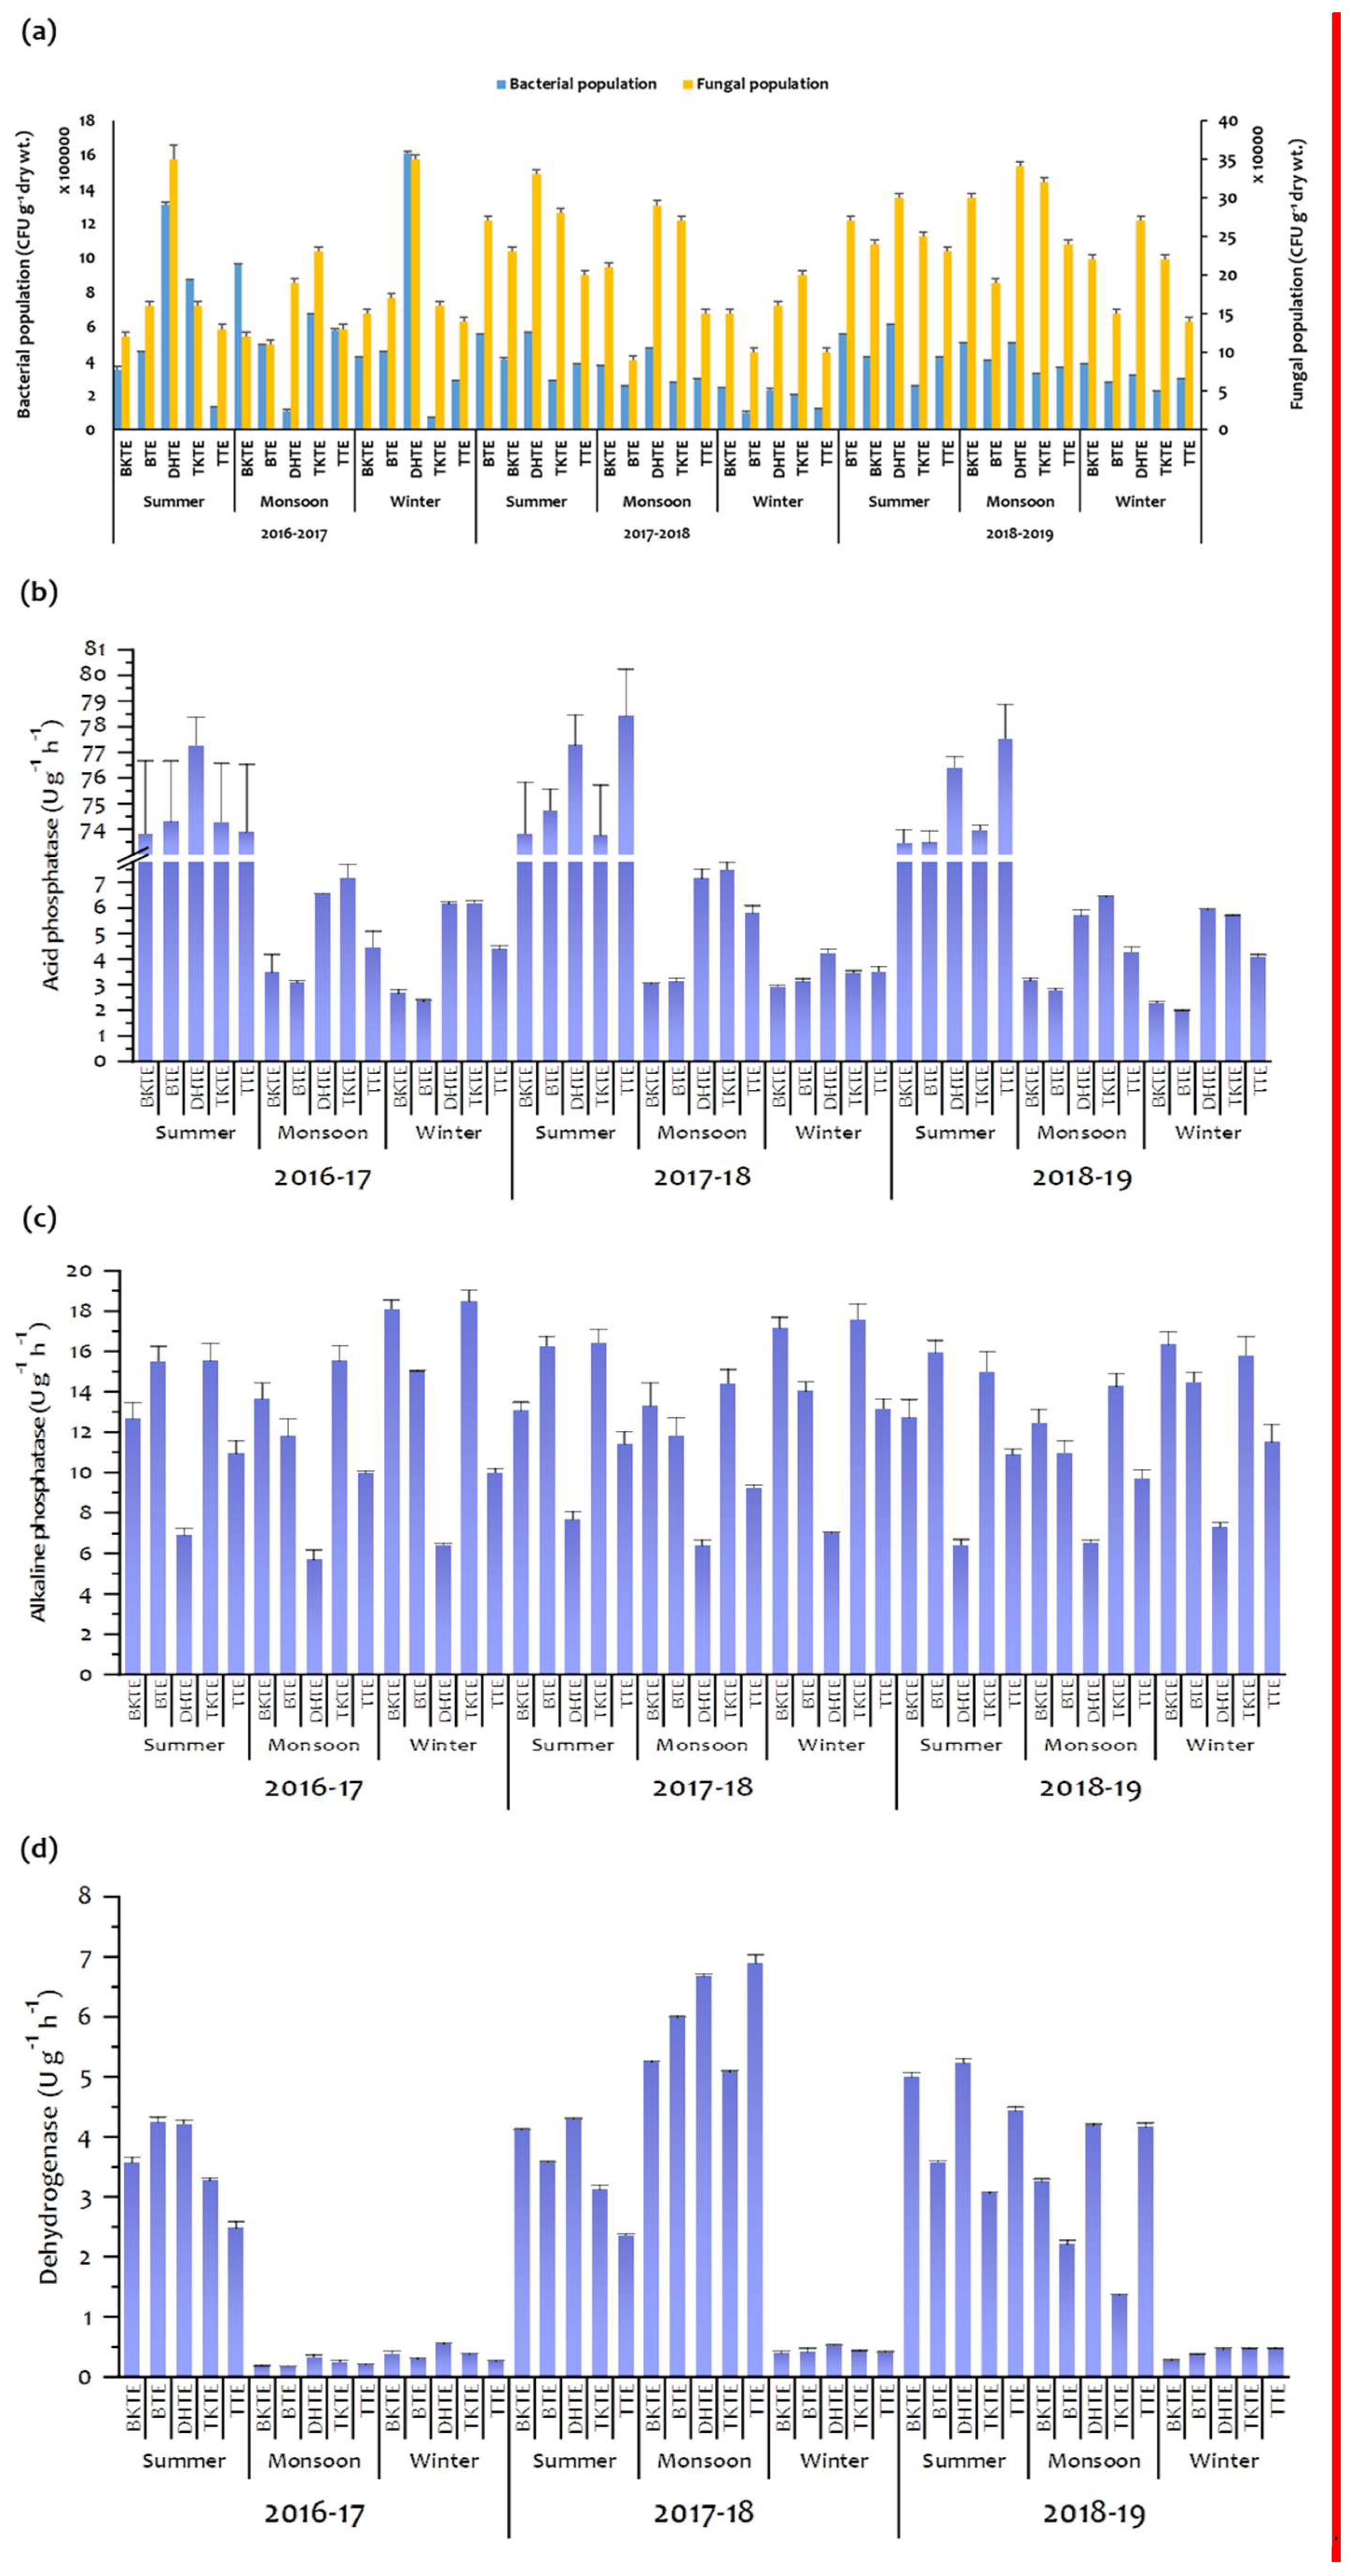
The seasonal dynamics of bacterial populations in the experimental treatment environment are depicted in Figure 3a. Notably, these bacterial populations exhibited significant variation across different seasons. During the experimental period, the lowest bacterial population was recorded at 7 × 10⁴ CFU g−1, observed in a soil sample collected from TKTE during the winter season of 2016–2017. In stark contrast, the highest population, measured at 16.1 × 10⁵ CFU g−1 was identified in soil samples from DHTE during the same winter season.
Analysing the bacterial population load over three consecutive years, viz., 2016–2017, 2017–2018, and 2018–2019, revealed ranges of 7.00 × 10⁴ to 1.31 × 10⁶, 1.00 × 10⁵ to 1.61 × 10⁶, and 2.20 × 10⁵ to 6.10 × 10⁵ CFU g−1, respectively. These data indicate a significant decline in overall bacterial populations from 2016–2017 to 2018–2019, suggesting an underlying trend that necessitates further investigation.
Bacterial populations were generally more abundant during the summer months compared to the monsoon and winter seasons, highlighting a distinct seasonal pattern. Furthermore, bacterial populations consistently exceeded the fungal populations, as elaborated in Section 3.1.2. This finding resonates with observations made by Ishaq et al. [52], who emphasised the impact of various factors, especially seasonal variation, on bacterial communities in agricultural soils. Their research indicated that fluctuations in temperature, precipitation, soil moisture, and solar radiation—driven by seasonal changes—significantly modulate rates of soil microbial metabolism and respiratory processes.
Research by Bag et al. [53] elucidates a direct relationship between bacterial species and populations in the rhizosphere of tea-growing soils and various soil environmental variables, including moisture content and temperature. Previous investigations, including work by Bagyalakshmi et al. [54], demonstrated that bacterial populations in 180 rhizospheres from diverse tea-growing districts in southern India exhibited significant correlations with environmental parameters, such as rainfall, temperature, relative humidity, and sunlight hours.
The findings suggest that the average bacterial population density in tea soils peaks during the monsoon season, followed by winter and summer. This observed pattern can be attributed to the conducive conditions for bacterial growth during the rainy season, whereas the arid summer months, characterised by reduced soil moisture and elevated temperatures, lead to a notable decline in bacterial populations [55]. Moreover, Donhauser et al. [56] identified approximately 27 and 30 °C as the optimal temperature for bacterial growth, supporting these observations. Additionally, Shen and Lin [57] noted that the acidic conditions prevalent in tea plantations create unique niches that favour bacterial proliferation. The pronounced abundance of bacterial populations within Jorhat tea garden soils can thus be associated with its acidic pH. This bacterial population is integral to soil fertility and serves as a potential indicator of soil quality, particularly as it tends to respond more rapidly to changes in soil management practices and climatic variations compared to soil organic matter [58,59,60,61,62].
Beneficial microbes, particularly plant growth-promoting bacteria, play a critical role in enhancing nutrient availability for tea plants [63]. A recent investigation by Arafat et al. [64] conducted on the south coast of Fujian province identified Burkholderia and Pseudomonas as predominant genera, while plant growth-promoting bacteria such as Prevotella, Bacillus, and Sphingomonas were found to be significantly less abundant in the 30Y tea garden. Further studies have also examined the dynamics of bacterial community dynamics in the tea rhizosphere and their interactions with environmental variables. For instance, Pandey and Palni [65] reported that Bacillus species constituted the dominant bacterial population within the established rhizosphere of tea bushes in the Himalayan region.

3.1.2. Seasonal Variation in Soil Fungi

The seasonal dynamics of the fungal populations within the experimental TEs are depicted in Figure 3a. Over the periods of 2016–2017, 2017–2018, and 2018–2019, the minimum fungal populations observed in the experimental soils were 1.10 × 10⁵, 9.00 × 10⁴, and 1.40 × 10⁵ CFU g−1, respectively. Conversely, the maximal fungal populations during the same years were documented at 3.50 × 10⁵, 3.30 × 10⁵, and 3.40 × 10⁵ CFU g−1. Among the five TEs studied, the DHTE exhibited the highest fungal population during the winter of 2016–2017, while the BTE recorded its lowest fungal population during the monsoon season of 2017–2018. These findings suggest pronounced seasonal fluctuations in soil fungal populations. Similar trends were reported by Yu et al. [66], who conducted soil sampling in a hilly region of western Sichuan, China, where four tea cultivars have been continuously cultivated for various land-use conservation initiatives since the 1950s. Notably, maximum fungal populations were consistently observed during the monsoon season across the study years.
Supporting this, Pandey et al. [67] noted that fungi in the tea rhizosphere flourish within a mesophilic temperature range of 15 °C to 35 °C, based on soil sampling from five TEs in the Indian Himalayan region from 1990 to 1998. Their research identified Penicillium and Trichoderma as the predominant genera in the rhizosphere of established tea bushes, specifically highlighting species such as Penicillium erythromellis, P. janthinellum, P. raistrickii, Trichoderma pseudokoningii, and T. koningii in close association with tea roots. The findings indicated a strong correlation between fungal populations and climatic variables, particularly temperature.
Throughout the study period from 2016 to 2019, overall data demonstrated that the highest microbial populations were present during the summer months, contrasting with the lowest populations recorded in winter. This seasonal trend may be attributed to enhanced nutrient availability and adequate soil moisture during the summer, whereas winter conditions marked by reduced moisture content, diminished organic matter degradation, and lower temperatures are likely responsible for the observed decline in fungal populations [68].
The fluctuations in fungal populations can predominantly be ascribed to their responses to natural environmental mechanisms, as posited Ji et al. [69]. Climatic factors significantly influence fungal community composition through both direct and indirect effects on soil and plant parameters, according to Zeng et al. [70]. Furthermore, factors such as host diversity, resource abundance, and habitat complexity within tropical ecosystems contribute to augmented fungal diversity [71]. Additionally, the proliferation of bacteria in response to increased availability of labile organic substrates may exert antagonistic effects on fungal growth [72]. Consequently, the intrinsically lower abundance of fungi in relation to bacteria, along with the inhibiting influence of bacteria, compounded by the inhibitory effects of bacterial populations, may elucidate the nonsignificant differences in fungal diversity across the studied TEs.

3.2. Soil Enzyme Activity

3.2.1. Acid Phosphatase (AcP)

Figure 3b depicts the seasonal variation in AcP activity across five TEs. During the study period, AcP activity exhibited a range from 1.99 to 78.43 μg p-nitrophenol released g−1 soil h−1 (μg p-NP g−1 soil h−1). Specifically, during the years 2016–2017, 2017–2018, and 2018–2019, soil AcP levels were recorded between 73.46 and 78.43, 2.79 and 7.49, and 1.99 and 6.18 μg p-NP g−1 soil h−1, respectively.
The data indicate a notable fluctuation in AcP activity throughout the seasons from 2016 to 2019, attributable to a variety of factors, including the degradation of organic matter in soil, variations in environmental temperature, annual precipitation, and humidity levels. Remarkably, the highest AcP activity was recorded during the summer months, whereas activity decreased during winter. The elevated AcP activity observed in summer suggests lower bioavailability of phosphorus in the form of phosphate ions (PO43−) in the soil, corroborating the present findings of this research and further supported by Rocabruna et al. [73].
Research conducted by Serrano-Grijalva et al. [74] emphasises the significance of microbial extracellular enzymes in the soil ecosystems, as they facilitate a variety of biochemical reactions contributing to carbon and nutrient cycling. Furthermore, Burns et al. [75] highlighted that the dynamics and turnover rates of enzymes involved in enzyme-mediated decomposition are contingent upon their specific functions and origins, which are influenced by microbial abundance.
Enzymatic activities in soil are intimately related to soil properties, including pH, bulk density, nutrient concentrations, and organic matter content [76]. Hydrolases such as phosphatase, sulfatase, β-glucosidase, and urease are regarded as indicators of phosphorus, sulphur, carbon, and nitrogen cycling, respectively [76]. Due to their sensitivity to alterations in soil conditions, soil enzymes serve as valuable indicators of soil quality and health, as concluded by Chen et al. [77].
In summary, these findings indicate that the Borbhetta tea estate exhibited the lowest AcP activity, with a mean value of 2.358 ± 0.058 μg p-NP g−1 soil h−1 during the winter, while the Tocklai tea estate displayed the highest AcP activity of 78.431 ± 0.139 μg p-NP g−1 soil h−1 in the summer season. A similar trend was observed in soil DH activity, aligning with the observations made by Vishwakarma et al. [78]. Additionally, a statistically significant positive correlation was identified between AcP activity and microbial populations in this study.

3.2.2. Alkaline Phosphatase (ALP)

The soil ALP activity was quantified within a range of 5.70 to 18.48 μg p-NP g−1 soil h−1, as depicted in Figure 3c. During the monsoon season, ALP levels were recorded between 5.70 and 18.11 μg p-NP g−1 soil h−1. In comparison, during the summer and winter seasons, ALP activity varied between 6.42 and 16.43 μg p-NP g−1 soil h−1 and between 6.44 and 18.48 μg p-NP g−1 soil h−1, respectively. Throughout the study period from 2016 to 2019, ALP activity demonstrated a degree of consistency across all seasons. Notably, the Deha tea estate exhibited the lowest mean ALP activity, with values of 5.70 μg p-NP g−1 soil h−1 in the monsoon of the first year, 6.39 μg p-NP g−1 soil h−1 in the monsoon of the second year, and 6.42 μg p-NP g−1 soil h−1 during summer in the third year. Conversely, the Teok tea estate recorded the highest ALP activity, particularly with a mean value of 16.43 μg p-NP g−1 soil h−1 during the summer seasons of both the first and second years.
It is noteworthy that within the Deha tea estate, the variation in enzyme activity was consistently lower throughout the entire study period. Data pertaining to ALP activities indicated a significant correlation between ALP activity in the rhizosphere of tea plants and the P concentration in the surrounding soil. This observation corroborates findings from previous research by Zhou and Zhou [79], which suggested that ALP activity increased during periods of P depletion in summer. Similar results were also reported by Maseko and Dakora [80] regarding native legumes growing in phosphorus-deficient soil within the Cape fynbos region of South Africa. Hence, the present findings imply that elevated ALP activity in the rhizosphere of tea plants enhances the availability of inorganic phosphorus derived from organic sources, particularly when contrasted with bulk soil, which exhibited lower enzyme activity and, subsequently, diminished phosphorus concentrations.

3.2.3. Dehydrogenase (DH) Activity

The investigation evaluated DH activity, revealing a range from 0.17 µg TPF g−1 soil h−1 and 6.90 µg TPF g−1 soil h−1, as depicted in Figure 3d. Seasonal variations were observed, with monsoon DH activity fluctuating between 0.17 ± 0.01 µg TPF g−1 soil h−1 and 0.3 ± 0.02 µg TPF g−1 soil h−1, while winter DH values spanned from 0.26 ± 0.04 µg TPF g−1 soil h−1 to 0.55 ± 0.06 µg TPF g−1 soil h−1. In contrast, in summer, DH activity was significantly elevated, averaging 2.36 ± 0.06 µg TPF g−1 soil h−1 to 4.29 ± 0.01 µg TPF g−1 soil h−1. Overall trends indicated a close correlation between DH activity and AcP throughout the study period from 2016 to 2019. Notably, the lowest DH activity was observed during winter at the Tocklai tea estate, averaging 0.264 ± 0.039 µg TPF g−1 soil h−1, while the highest activity was recorded in the Deha TEs during the summer, reaching 5.235 ± 0.071 µg TPF g−1 soil h−1. Fluctuations in DH activity were particularly pronounced during the monsoon season of 2017–2018.
Dehydrogenases function as critical enzymes serving as indicators of soil biological activity, engaging in reductive processes mediated by microorganisms [81]. These enzymes are produced by various rhizospheric microbes to mobilise carbon, nitrogen, energy, and other essential nutrients through the breakdown of complex polymers in tea-growing soils. Soil DH activity is frequently employed as a proxy for microbial activity, as noted by Daunoras et al. [82] and Garcia and Hernández [83]. The present results demonstrated a robust strong correlation between DH activity and both AcP and ALP activities.
Emerging research suggests that intercropping practices can enhance soil enzyme activities, such as DH and ALP [33]. However, certain studies indicated negligible differences in soil enzyme activities when comparing intercropped systems and monocultures [84]. The responses of soil enzymes to intercropping interventions appear to be enzyme-specific [84]. Moreover, seasonal temperature fluctuations significantly affect enzyme activities [85]. The divergent results concerning the effects of intercropping may be attributed to specific sampling times, leading us to hypothesise that the impact of intercropping on soil enzyme activities is most pronounced during the summer months. This phenomenon may be linked to nutrient mobilisation from deeper soil strata by the deep-rooted tea plants, facilitated by the decomposition of leaf and fine root litter [86]. These present findings corroborate previous research suggesting that intercropping enhances soil organic matter and total nitrogen content [84,87].
The analysis revealed significant seasonal dynamics in soil enzyme activities, markedly influenced by the timing of sampling and the tea plant populations. Ambient temperature is a crucial factor affecting enzyme activities [85]. Data indicated that soil enzymes, particularly DH, exhibited peak activity during the monsoon season in the study region. This heightened activity likely results from the accumulation of leaf and fine root litter from the preceding fall, stimulating enzyme production. The observed increase in decomposition-related enzyme activities under tea plants aligns with findings from other planting systems [33].

4. Statistical Interpretation

The analysis of seasonal datasets has yielded significant insights into the distributional characteristics of various environmental parameters, as summarised in Table 2. Across both summer and winter seasons, all parameters, except soil DH, conformed to a Cauchy distribution. Conversely, soil DH exhibited a Weibull distribution. Notably, during the winter season, soil AcP, ALP, soil DH, bacterial populations, and fungal populations were characterised by Log-normal, Weibull, Gamma, Logistic, and Cauchy, respectively.
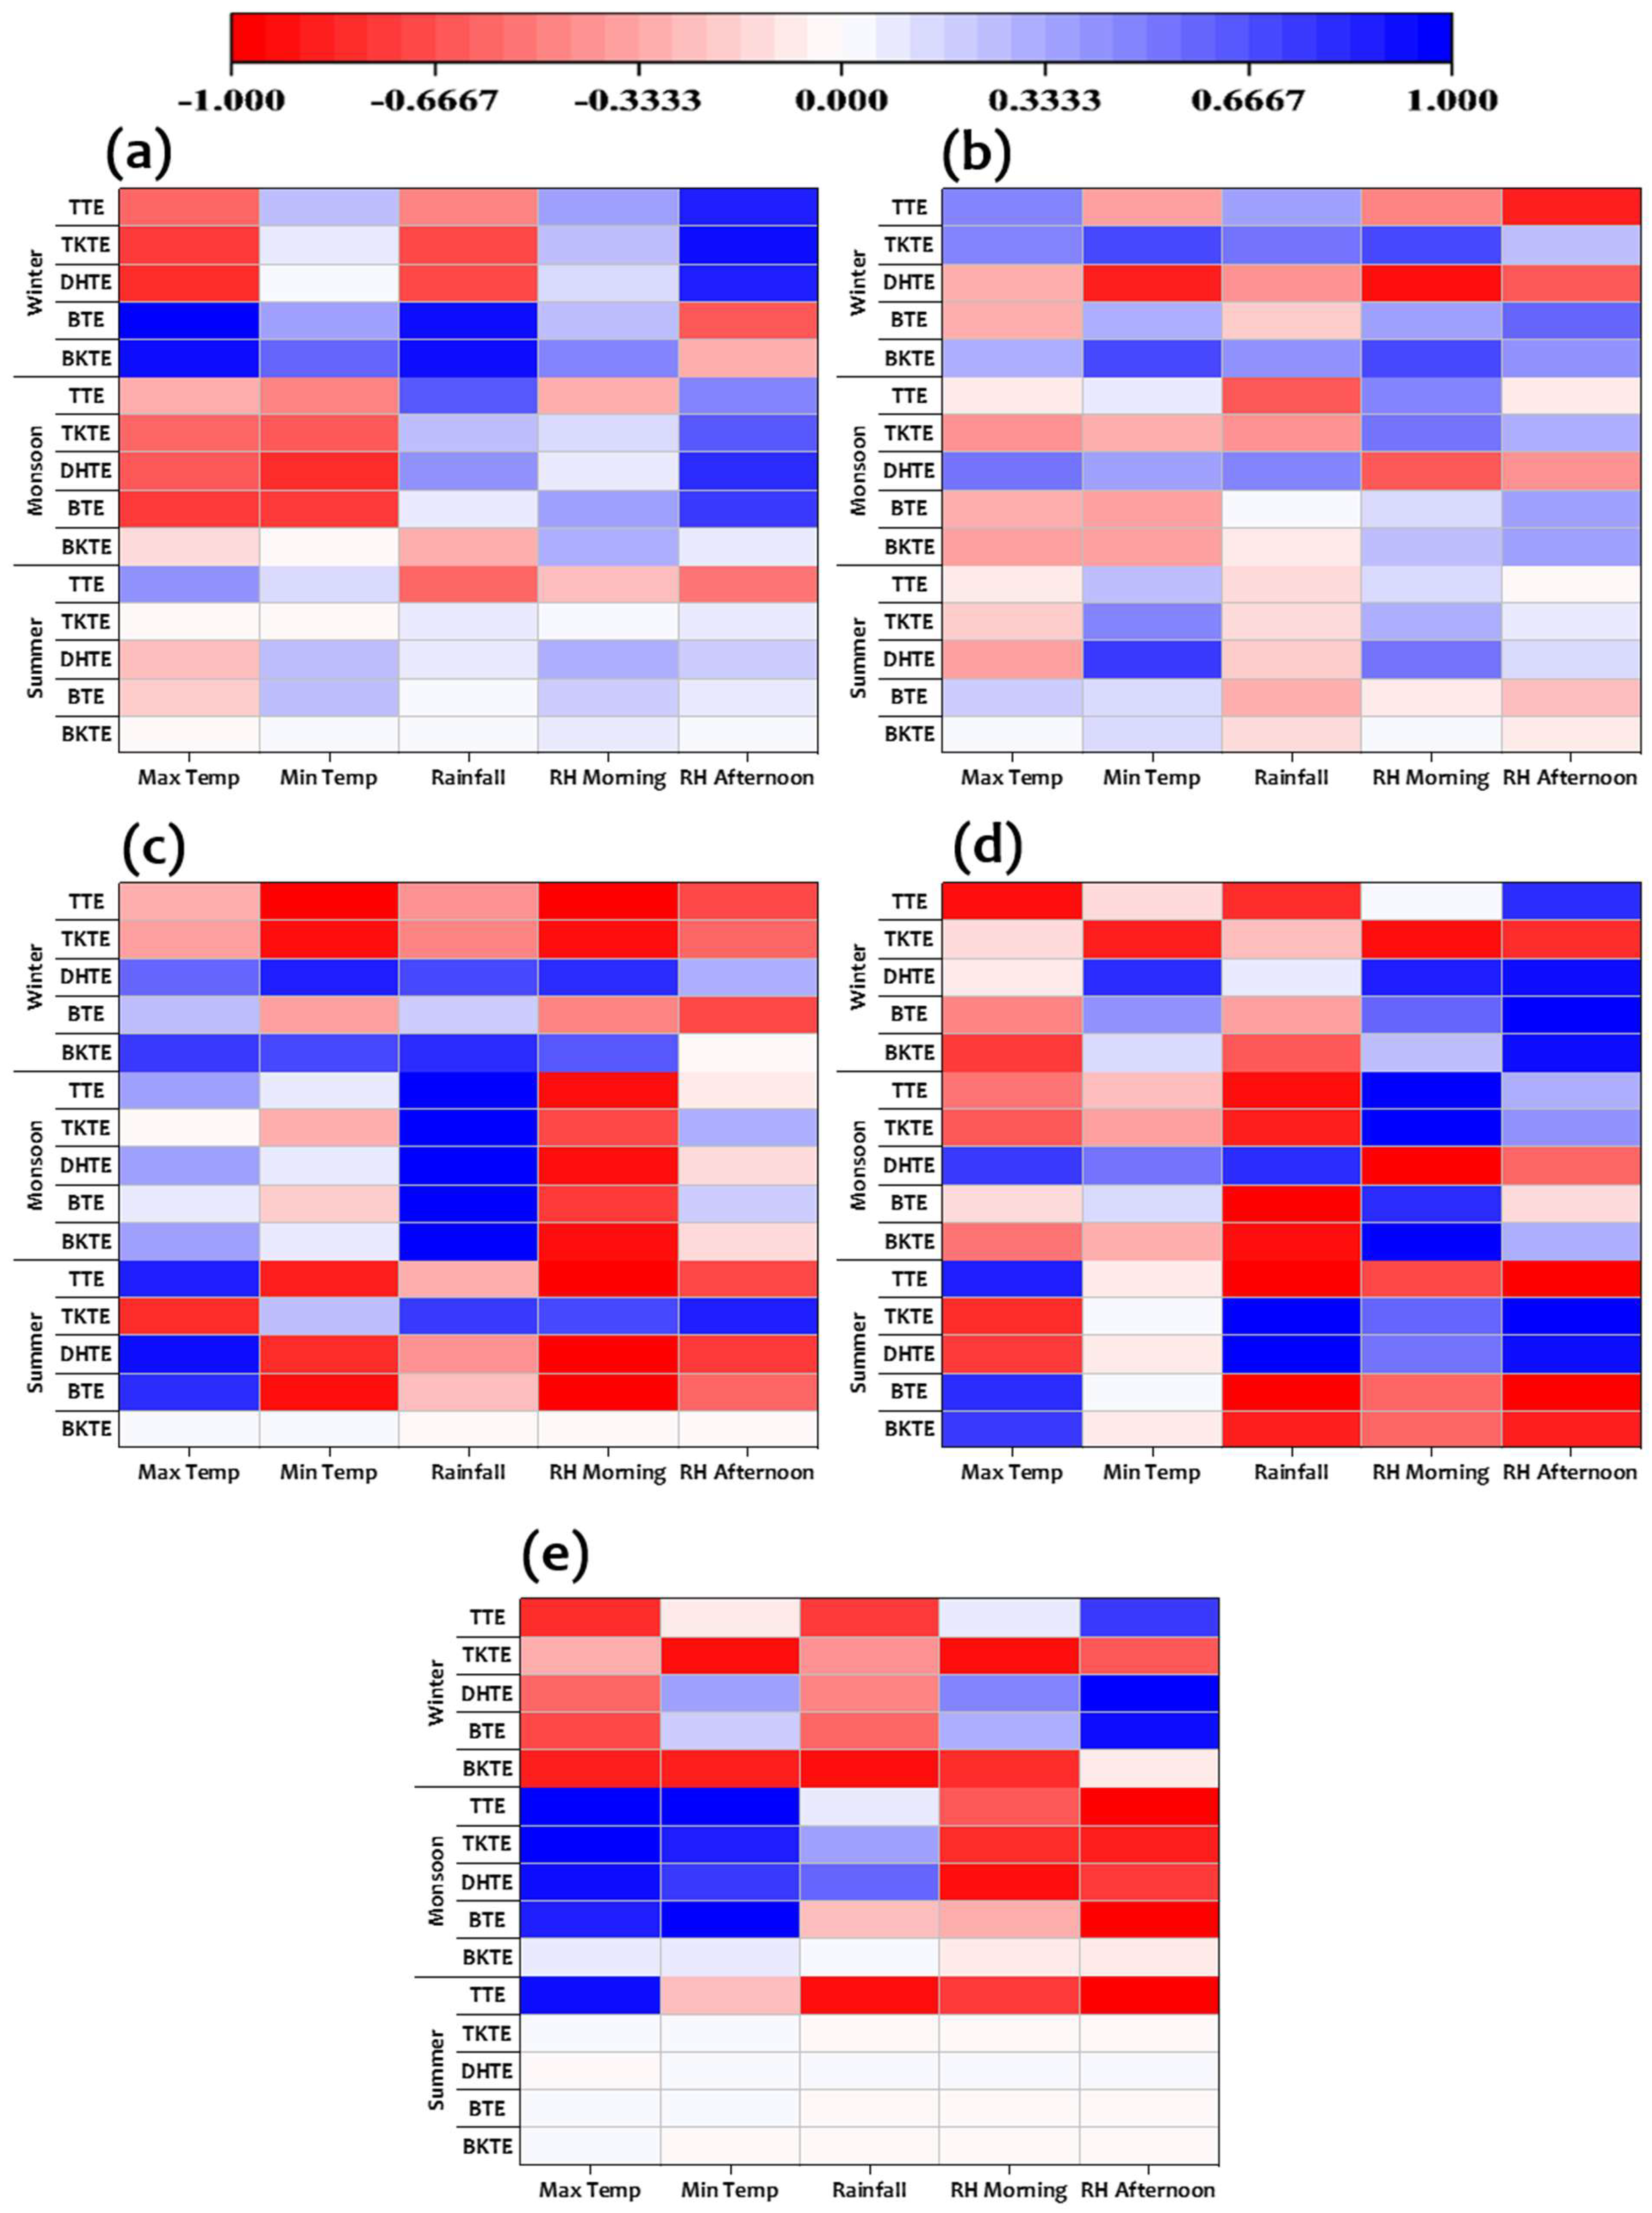
Correlation analyses, depicted as a heatmap in Figure 4, elucidate the relationships between the examined parameters and climate variables across each season. The use of blue and red colours in the heatmap signifies the strength of the correlations, with blue indicating stronger positive correlations and red indicating stronger negative correlations.
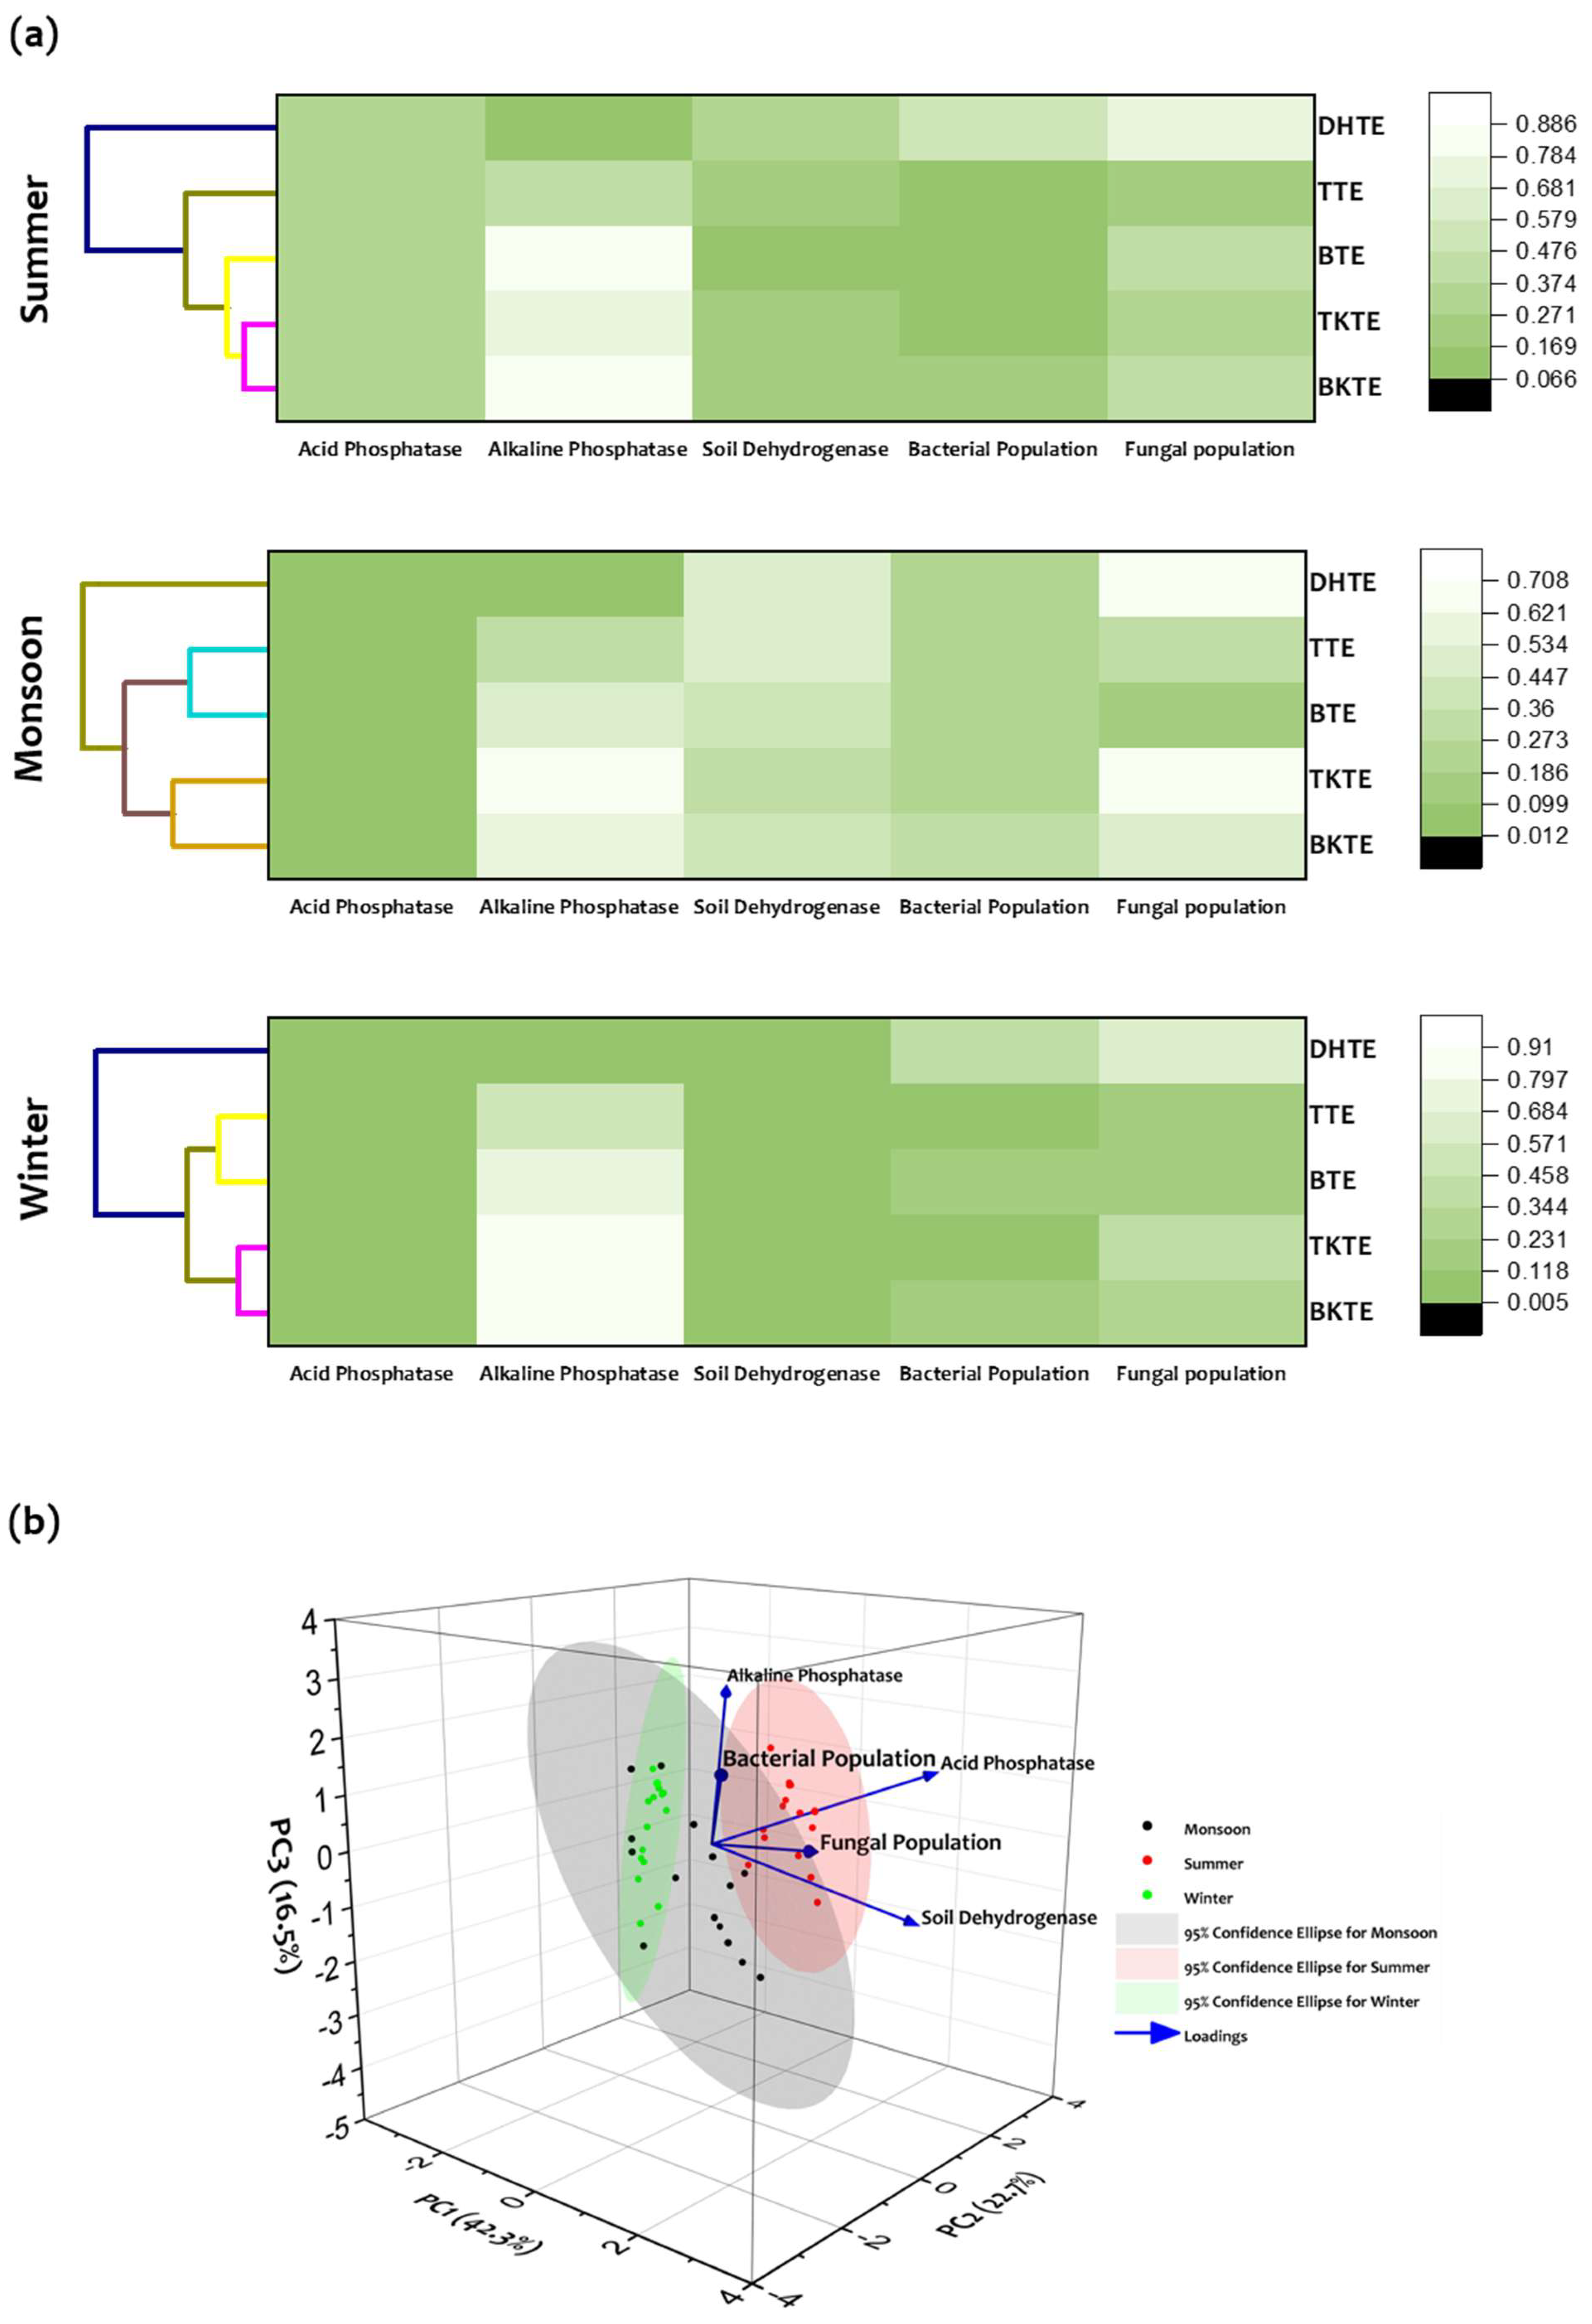
Moreover, hierarchical cluster analysis revealed two distinct groups of TEs based on their chemical soil properties, revealing bacterial and fungal populations. This classification is visually represented in the dendrogram illustrated in Figure 5a, indicating that the DHTE group is distinctly separated, while TTE, BTE, TKTE, and BKTE comprise a cohesive cluster across all three seasons.
To further elucidate the underlying patterns, Principal Component Analysis (PCA) was employed to reduce dimensionality by transforming the variables into principal components (PCs). The factor loadings and the correlations between the studied variables and PCs. Detailed factor loadings and correlations between the studied variables and PCs are presented in Table 3. The analysis revealed that the first three principal components collectively accounted for over 80% of the total variability within the dataset. Notably, variables such as DH and fungal populations exhibited higher loadings, with ALP and fungal populations demonstrating strong correlations with PC1. For PC2, significant loadings were observed for soil AcP and ALP, while soil AcP exhibited a notable correlation with bacterial populations. Additionally, PC3 was characterised by elevated loadings of bacterial population and ALP, with both soil AcP and bacterial populations showing significant correlation with this component. The biplot representing the distribution of these PCs is depicted in Figure 5b.

5. Conclusions

The total microbial population within tea-growing soils exhibited a pronounced peak during the summer months, indicating that elevated temperatures and enhanced moisture levels create optimal conditions for microbial proliferation. In contrast, the microbial population reached its lowest levels in the winter, thereby highlighting the detrimental impact of lower temperatures on soil health. This seasonal variation in microbial populations significantly influences the enhancement and maintenance of soil health conditions, which are essential for healthy tea cultivation. Throughout the investigation, the analysis of soil enzymatic activities proved to be crucial for evaluating the overall health status, structural integrity, and composition of the soil. These enzymes are sensitive biomarkers that reflect fluctuations in soil health conditions shaped by various environmental variables. A comprehensive understanding of the distribution of these factors is essential for examining patterns and acquiring insights into soil dynamics. In the current study, a majority of the examined variables demonstrated a propensity to adhere to a Cauchy distribution, with a secondary alignment observed with the Weibull distribution. This finding is particularly significant, as it implies the presence of complex underlying mechanisms governing microbial population dynamics and enzymatic activity in diverse environmental contexts. Furthermore, the application of multivariate techniques, such as hierarchical cluster analysis and principal component analysis, effectively delineated the existence of homogenous groups among the assessed tea-related variables. Notably, DHTE exhibited distinct characteristics compared with other evaluated enzymes across all seasons, warranting its classification as an independent group. Conversely, the remaining four TEs manifested a cohesive and homogenous behaviour, indicating similar responses under varying climatic influences. This detailed analysis highlights the critical interplay among microbial activities, enzyme dynamics, and overall soil health in the domain of tea cultivation.

Supplementary Materials

The following supporting information can be downloaded at: https://www.mdpi.com/article/10.3390/environments13060314/s1, Table S1: Parameters of the grid soil sampling protocol.

Author Contributions

B.P., R.K.P., M.Y., S.P., R.P. and T.K., designed and conceived the study idea. B.P., completed the experiments. B.P., R.K.P., M.Y., A.S., C.S.M., S.P., M.D., R.P., J.S. and T.K., analysed the data and performed visualisations and statistical data analysis. R.K.P., M.Y., A.S., C.S.M., S.P., M.D., R.P., D.D., H.M., J.D., J.S. and S.D., wrote the original draft. S.P., J.S. and T.K., reviewed and edited the manuscript. S.P. and T.K., reviewed the manuscript and provided funds. T.K., provided the resources and supervision. All authors have read and agreed to the published version of the manuscript.

Funding

This research was supported by the Department of Biotechnology (DBT), Government of India, as part of the “Unit of Excellence” project (T.K.) under Sanction Order No: BT/564/NE/U-Excel/2016.

Data Availability Statement

The datasets generated and/or analysed during the current study are not publicly available because they are part of an ongoing research project. Consequently, they cannot be shared until the study is completed. However, these datasets (including raw data) can be accessed from the corresponding author upon reasonable request.

Acknowledgments

The authors wish to convey their sincere appreciation to the four anonymous reviewers for their insightful critiques and observations, which have substantially improved our manuscript. Their comprehensive evaluations and thought-provoking recommendations have elevated the quality of our work, and we are genuinely grateful for their significant contributions.

Conflicts of Interest

The authors declare no conflicts of interest.

Abbreviations

The following abbreviations are used in this manuscript:
AcPAcid phosphatase
ALPAlkaline phosphatase
BKTEBokahola Tea Estate
BTEBorbhetta Experimental Tea Estate
DHDehydrogenase
DHTEDeha Tea Estate
ESSError sum of squares
MUBModified universal buffer
NANutrient Agar
PCAPrincipal components Analysis
PNPp-nitrophenyl phosphate
RBCRose Bengal Chloramphenicol
TEsTea estates
TKTETeok Tea Estate
TPFTriphenyl formazan
TTC2,3,5 triphenyl tetrazolium chloride
TTETocklai Tea Estate

References

  1. Malakar, H.; Dutta, J.; Dihingia, T.; Das, A.; Bora, D.; Mondal, D.; Choudhary, C.S.; Paul, R.K.; Yeasin; Sarkar, A.; et al. Unveiling the intriguing array of soil acidity variations within sixteen captivating tea estates spread across Northeast India. Environ. Monit. Assess. 2025, 197, 303. [Google Scholar] [CrossRef]
  2. Gogoi, B.B.; Yeasin; Paul, R.K.; Borgohain, A.; Deka, D.; Malakar, H.; Saikia, J.; Rahman, F.H.; Panja, S.; Sarkar, A.; et al. The level of selected metals in made tea and tea infusion from the roadside tea plants and health risk assessment. Biol. Trace Elem. Res. 2024, 202, 2900–2920. [Google Scholar] [CrossRef]
  3. Malakar, H.; Timsina, G.; Dutta, J.; Borgohain, A.; Deka, D.; Babu, A.; Paul, R.K.; Yeasin; Rahman, F.H.; Panja, S.; et al. Sick or rich: Assessing the selected soil properties and fertility status across the tea-growing region of Dooars, West Bengal, India. Front. Plant Sci. 2022, 13, 1017145. [Google Scholar] [CrossRef] [PubMed]
  4. Karak, T.; Paul, R.K.; Sonar, I.; Nath, J.R.; Boruah, R.K.; Dutta, A.K. Nickel dynamics influenced by municipal solid waste compost application in tea (Camellia sinensis L.): A cup that cheers? Int. J. Environ. Sci. Technol. 2016, 13, 663–678. [Google Scholar] [CrossRef]
  5. Karak, T.; Bhagat, R.M. Trace elements in tea leaves, made tea and tea infusion: A review. Food Res. Int. 2010, 43, 2234–2252. [Google Scholar] [CrossRef]
  6. Karak, T.; Paul, R.K.; Kutu, F.R.; Mehra, A.; Khare, P.; Dutta, A.K.; Bora, K.; Boruah, R.K. Comparative assessment of copper, iron and zinc contents in selected Indian (Assam) and South African (Thohoyandou) tea (Camellia sinensis L.) samples and their infusion: A quest for health risks to consumer. Biol. Trace Elem. Res. 2017, 175, 475–487. [Google Scholar] [CrossRef]
  7. Karak, T.; Abollino, O.; Bhattacharyya, P.; Das, K.K.; Paul, R.K. Fractionation and speciation of arsenic in three tea gardens soil profiles and distribution of As in different parts of tea plant (Camellia sinensis L.). Chemosphere 2011, 85, 948–960. [Google Scholar] [CrossRef]
  8. Wei, J.; Zhou, H.; Liu, Q.; Bai, L.; Han, M.; Liu, G.; Pei, S.; Zhang, F.; Tian, X.; Zhang, G. Distribution and Enrichment Regularity of Trace Elements in Meitan Cuiya Tea and Soil. Toxics 2025, 13, 741. [Google Scholar] [CrossRef]
  9. Zong, F.; Yang, Z.; Xiao, L.; Tong, Y.; Shen, L.; Dong, Z.; Zhou, J.; Cheng, H.; Wang, W.; Liu, D. Chemical Drivers of Flavor Variation Across Cultivars and Grades of Fujian White Tea Revealed by Integrated Volatile and Non-Volatile Metabolomics. Foods 2026, 15, 458. [Google Scholar] [CrossRef]
  10. Huang, H.; Kfoury, N.; Orians, C.M.; Griffin, T.; Ahmed, S.; Cash, S.B.; Stepp, J.R.; Xue, D.; Long, C.; Robbat, A. 2014–2016 seasonal rainfall effects on metals in tea (Camelia sinensis (L.) Kuntze). Chemosphere 2019, 219, 796–803. [Google Scholar] [CrossRef]
  11. Kanrar, B.; Kundu, S.; Sengupta, S.; Yeasin; Paul, R.K.; Karak, T. Assessment and health risk of fluoride from Northeast Indian tea (Camellia sinensis L.): Fixing up the maximum residue level of fluoride in tea. J. Food Compos. Anal. 2023, 127, 105928. [Google Scholar] [CrossRef]
  12. Lloyd, A.J.; Finch, J.; Warren-Walker, A.; Watson, A.; Lyons, L.; Martinez Martin, M.P.; Wilson, T.; Beckmann, M. Chemical Attributes of UK-Grown Tea and Identifying Catechin and Metabolite Dynamics in Green and Black Tea Using Metabolomics and Machine Learning. Metabolites 2026, 16, 84. [Google Scholar] [CrossRef]
  13. Chang, Y.; Jiang, F.; Peñuelas, J.; Sardans, J.; Wu, Z. Assessment of Heavy Metals in Tea Plantation Soil and Their Uptake by Tieguanyin Tea Leaves and Potential Health Risk Assessment in Anxi County in Southeast China. Agriculture 2024, 14, 1907. [Google Scholar] [CrossRef]
  14. Deka, H.; Sarmah, P.P.; Chowdhury, P.; Rajkhowa, K.; Sabhapondit, S.; Panja, S.; Karak, T. Impact of the Season on Total Polyphenol and Antioxidant Properties of Tea Cultivars of Industrial Importance in Northeast India. Foods 2023, 12, 3196. [Google Scholar] [CrossRef]
  15. FAOSTAT. Crops and Livestock Products; Food and Agriculture Organization of the United Nations: Rome, Italy, 2023; Available online: https://www.fao.org/faostat/en/#data/QCL (accessed on 9 March 2024).
  16. Mondal, T.K. Breeding and Biotechnology of Tea and Its Wild Species; Springer: Berlin/Heidelberg, Germany, 2014. [Google Scholar]
  17. Sarmah, M.; Borgohain, A.; Gogoi, B.B.; Yeasin; Paul, R.K.; Malakar, H.; Handique, J.G.; Saikia, J.; Deka, D.; Khare, P.; et al. Insights into the effects of tea pruning litter biochar on major micronutrients (Cu, Mn, and Zn) pathway from soil to tea plant: An environmental armour. J. Hazard. Mater. 2023, 442, 129970. [Google Scholar] [CrossRef]
  18. Ji, C.; Han, Z.; Zheng, F.; Wu, S.; Wang, J.; Wang, J.; Zhang, H.; Zhang, Y.; Liu, S.; Li, S.; et al. Biochar reduced soil nitrous oxide emissions through suppressing fungal denitrification and affecting fungal community assembly in a subtropical tea plantation. Agric. Ecosyst. Environ. 2022, 326, 107784. [Google Scholar] [CrossRef]
  19. Sadeghi, S.; Petermann, B.J.; Steffan, J.J.; Brevik, E.C.; Gedeon, C. Predicting microbial responses to changes in soil physical and chemical properties under different land management. Appl. Soil Ecol. 2023, 188, 104878. [Google Scholar] [CrossRef]
  20. Védère, C.; Gonod, L.V.; Nunan, N.; Chenu, C. Opportunities and limits in imaging microorganisms and their activities in soil microhabitats. Soil Biol. Biochem. 2022, 174, 108807. [Google Scholar] [CrossRef]
  21. Bollmann-Giolai, A.; Malone, J.G.; Arora, S. Diversity, detection and exploitation: Linking soil fungi and plant disease. Curr. Opin. Microbiol. 2023, 70, 102199. [Google Scholar] [CrossRef]
  22. Koga, K.; Suehiro, Y.; Matsuoka, S.; Takahashi, K. Evaluation of growth activity of microbes in tea field soil using microbial calorimetry. J. Biosci. Bioeng. 2003, 95, 429–434. [Google Scholar] [CrossRef]
  23. Zhang, Y.; Wang, B.; Wang, G.; Zheng, Z.; Chen, Y.; Li, O.; Peng, Y.; Hu, X. Acidification induce chemical and microbial variation in tea plantation soils and bacterial degradation of the key acidifying phenolic acids. Arch. Microbiol. 2024, 206, 239. [Google Scholar] [CrossRef] [PubMed]
  24. Wei, S.; Liu, B.; Ni, K.; Ma, L.; Shi, Y.; Leng, Y.; Zheng, S.; Gao, S.; Yang, X.; Ruan, J. Rhizosphere microbial community shows a greater response than soil properties to tea (Camellia sinensis L.) cultivars. Agronomy 2023, 13, 221. [Google Scholar] [CrossRef]
  25. Yang, W.; Li, C.; Wang, S.; Zhou, B.; Mao, Y.; Rensing, C.; Xing, S. Influence of biochar and biochar-based fertilizer on yield, quality of tea and microbial community in an acid tea orchard soil. Appl. Soil Ecol. 2021, 166, 104005. [Google Scholar] [CrossRef]
  26. Ma, Y.; Fu, S.; Zhang, X.; Zhao, K.; Chen, H.Y.H. Intercropping improves soil nutrient availability, soil enzyme activity and tea quantity and quality. Appl. Soil Ecol. 2017, 119, 171–178. [Google Scholar] [CrossRef]
  27. Venkatesan, S.; Senthurpandian, V.K. Comparison of enzyme activity with depth under tea plantations and forested sites in south India. Geoderma 2006, 137, 212–216. [Google Scholar] [CrossRef]
  28. Campos, J.A.; Jesús, D.; Peco, E.G. Antigerminative comparison between naturally occurring naphthoquinones and commercial pesticides. Soil dehydrogenase activity used as bioindicator to test soil toxicity. Sci. Total Environ. 2019, 694, 133672. [Google Scholar] [CrossRef]
  29. Wolińska, A.; Stępniewska, Z. Dehydrogenase Activity in the Soil Environment; InTech.: Orlando, FL, USA, 2012. [Google Scholar] [CrossRef]
  30. Singh, A.K.; Jiang, X.-J.; Yang, B.; Wu, J.; Rai, A.; Chen, C.; Ahirwal, J.; Wang, P.; Liu, W.; Singh, N. Biological indicators affected by land use change, soil resource availability and seasonality in dry tropics. Ecol. Indic. 2020, 115, 106369. [Google Scholar] [CrossRef]
  31. Jafarian, N.; Mirzaei, J.; Omidipour, R.; Kooch, Y. Effects of micro-climatic conditions on soil properties along a climate gradient in oak forests, west of Iran: Emphasizing phosphatase and urease enzyme activity. Catena 2023, 224, 106960. [Google Scholar] [CrossRef]
  32. Basílio, F.; Dias, T.; Santana, M.M.; Melo, J.; Carvalho, L.; Correia, P.; Cruz, C. Multiple modes of action are needed to unlock soil phosphorus fractions unavailable for plants: The example of bacteria- and fungi-based biofertilizers. Appl. Soil Ecol. 2022, 178, 104550. [Google Scholar] [CrossRef]
  33. Hauggaard-Nielsen, H.; Jensen, E.S. Facilitative root interactions in intercrops. Plant Soil 2005, 274, 237–250. [Google Scholar] [CrossRef]
  34. Karak, T.; Sonar, I.; Paul, R.K.; Frankowski, M.; Boruah, R.K.; Dutta, A.K.; Das, D.K. Aluminium dynamics from soil to tea plant (Camellia sinensis L.): Is it enhanced by municipal solid waste compost application? Chemosphere 2015, 119, 917–926. [Google Scholar] [CrossRef]
  35. Karak, T.; Paul, R.K.; Sonar, I.; Sanyal, S.; Ahmed, K.Z.; Boruah, R.K.; Das, D.K.; Dutta, A.K. Chromium in soil and tea (Camellia sinensis L.) infusion: Does soil amendment with municipal solid waste compost make a sense? Food Res. Int. 2014, 64, 114–124. [Google Scholar] [CrossRef] [PubMed]
  36. Bandyopadhyay, S.; Dutta, D.; Chattopadhay, T.; Reza, S.K.; Dutta, D.P.; Baruah, U.; Sarkar, D.; Singh, S.K. Characterization and classification of some tea-growing soils of Jorhat district, Assam. Agropedology 2014, 24, 138–145. [Google Scholar]
  37. Li, J.; Huang, W.; Lin, X.; Khan, W.; Zhao, H.; Sun, B.; Liu, S.; Zheng, P. Study on Soil Nutrients and Microbial Community Diversity in Ancient Tea Plantations of China. Agronomy 2025, 15, 1608. [Google Scholar] [CrossRef]
  38. Joergensen, R.G.; Wichern, F. Alive and kicking: Why dormant soil microorganisms matter. Soil Biol. Biochem. 2017, 116, 419–430. [Google Scholar] [CrossRef]
  39. Jonczak, J.; Jankiewicz, U.; Kondras, M.; Kruczkowska, B.; Oktaba, L.; Oktaba, J.; Olejniczak, I.; Pawłowicz, E.; Polláková, N.; Raab, T.; et al. The influence of birch trees (Betula spp.) on soil environment—A review. For. Ecol. Manag. 2020, 477, 118486. [Google Scholar] [CrossRef]
  40. Lorenz, N.; Dick, R.P. Sampling and Pretreatment of Soil before Enzyme Analysis. In Methods of Soil Enzymology; Dick, R.P., Ed.; SSSA Book Series; Soil Science Society of America: Madison, WI, USA, 2011; pp. 85–101. [Google Scholar]
  41. Wollum, A.G., II. Soil Sampling for Microbiological Analysis. In Methods of Soil Analysis: Part 2—Microbiological and Biochemical Properties; Weaver, R.W., Angle, S., Bottomley, P., Bezdicek, D., Smith, S., Tabatabai, A., Wollum, A., Eds.; SSSA Book Series; Soil Science Society of America: Madison, WI, USA, 1994; pp. 1–14. [Google Scholar]
  42. Vieira, F.C.S.; Nahas, E. Comparison of microbial numbers in soils by using various culture media and temperatures. Microbiol. Res. 2005, 160, 197–202. [Google Scholar] [CrossRef]
  43. Bosmans, L.; Moerkens, R.; Wittemans, L.; De Mot, R.; Rediers, H.; Lievens, B. Rhizogenic agrobacteriain hydroponic crops: Epidemics, diagnostics and control. Plant Pathol. 2017, 66, 1043–1053. [Google Scholar] [CrossRef]
  44. Chesters, C.G.C.; Thornton, R.H. A comparison of techniques for isolating soil fungi. Trans. Br. Mycol. Soc. 1956, 39, 301–313. [Google Scholar] [CrossRef]
  45. Johnson, L.F.; Curl, E.A. Methods for Research on the Ecology of Soil-Borne Plant Pathogens; Burgess Publishing Company: Minneapolis, MN, USA, 1972. [Google Scholar]
  46. Case, C.L.; Johnson, T.R. Laboratory Experiments in Microbiology; Benjamin/Cummings Publishing Company: San Francisco, CA, USA, 1984. [Google Scholar]
  47. Skujiņš, J.J. Enzymes in soil. In Soil Biochemistry; McLaren, A.D., Peterson, G.H., Eds.; Marcel Dekker: New York, NY, USA, 1967; pp. 371–414. [Google Scholar]
  48. Takano, Y.; Mori, H.; Kaneko, T.; Ishikawa, Y.; Marumo, K.; Kobayashi, K. Phosphatase and microbial activity with biochemical indicators in semi-permafrost active layer sediments over the past 10,000 years. Appl. Geochem. 2006, 21, 48–57. [Google Scholar] [CrossRef]
  49. Tabatabai, M.A.; Bremner, J.M. Use of p-nitrophenyl phosphate for assay of soil phosphatase activity. Soil Biol. Biochem. 1969, 1, 301–307. [Google Scholar] [CrossRef]
  50. Tabatabai, M.A. Soil Enzymes. In Methods of Soil Analysis, Part 2. Chemical and Microbiological Properties—Agronomy Monograph No. 9, 2nd ed.; Page, A.L., Miller, R.H., Keeney, D.R., Eds.; SSSA Book Series; Soil Science Society of America: Madison, WI, USA, 1982; pp. 903–947. [Google Scholar]
  51. Casida, L.E. Microbial metabolic activity in soil as measured by dehydrogenase determinations. Appl. Environ. Microbiol. 1977, 34, 630–636. [Google Scholar] [CrossRef] [PubMed]
  52. Ishaq, S.L.; Seipela, T.; Yeomanb, C.J.; Menalleda, F.D. Soil bacterial communities of wheat vary across the growing season and among dryland farming systems. Geoderma 2020, 358, 113989. [Google Scholar] [CrossRef]
  53. Bag, S.; Mondal, A.; Banik, A. Exploring tea (Camellia sinensis) microbiome: Insights into the functional characteristics and their impact on tea growth promotion. Microbiol. Res. 2022, 254, 126890. [Google Scholar] [CrossRef] [PubMed]
  54. Bagyalakshmi, B.; Ponmurugan, P.; Balamurugan, A. Potassium solubilization, plant growth promoting substances by potassium solubilizing bacteria (KSB) from southern Indian Tea plantation soil. Biocatal. Agric. Biotechnol. 2017, 12, 116–124. [Google Scholar] [CrossRef]
  55. Panda, T.; Panda, B.; Prasad, B.K.; Mishra, N. Influence of soil environment and surface vegetation on soil micro flora in a coastal sandy belt of Orissa, India. Hum. Ecol. 2009, 27, 69–73. [Google Scholar] [CrossRef]
  56. Donhauser, J.; Niklaus, P.A.; Rousk, J.; Larose, C.; Frey, B. Temperatures beyond the community optimum promote the dominance of heat-adapted, fast growing and stress resistant bacteria in alpine soils. Soil Biol. Biochem. 2020, 148, 107873. [Google Scholar] [CrossRef]
  57. Shen, F.T.; Lin, S.H. Priming effects of cover cropping on bacterial community in a tea plantation. Sustainability 2021, 13, 4345. [Google Scholar] [CrossRef]
  58. Marzouk, S.H.; Kwaslema, D.R.; Omar, M.M.; Mohamed, S.H. Harnessing the power of soil microbes: Their dual impact in integrated nutrient management and mediating climate stress for sustainable rice crop production. A systematic review. Heliyon 2025, 11, e41158. [Google Scholar] [CrossRef]
  59. Górska, E.B.; Stępień, W.; Hewelke, E.; Lata, J.-C.; Gworek, B.; Gozdowski, D.; Sas-Paszt, L.; Bazot, S.; Lisek, A.; Gradowski, M.; et al. Response of soil microbiota to various soil management practices in 100-year-old agriculture field and identification of potential bacterial ecological indicator. Ecol. Indic. 2023, 158, 111545. [Google Scholar] [CrossRef]
  60. Joos, L.; De Tender, C.; Holderbeke, A.; Clement, L.; Vandecasteele, B.; Debode, J. Exploring the microbial response as a potential bio-indicator for soil health: Insights from a controlled incubator experiment. Agric. Ecosyst. Environ. 2023, 356, 108634. [Google Scholar] [CrossRef]
  61. Bhaduri, D.; Sihi, D.; Bhowmik, A.; Verma, B.C.; Munda, S.; Dari, B. A review on effective soil health bio-indicators for ecosystem restoration and sustainability. Front. Microbiol. 2022, 13, 938481. [Google Scholar] [CrossRef] [PubMed]
  62. Mishra, P.; Singh, P.P.; Singh, S.K.; Verma, H. Sustainable agriculture and benefits of organic farming to special emphasis on PGPR. In Role of Plant Growth Promoting Microorganisms in Sustainable Agriculture and Nanotechnology; Kumar, A., Singh, A.K., Choudhury, K.K., Eds.; Woodhead Publishing: Cambridge, UK, 2019; pp. 75–87. [Google Scholar]
  63. Bharadwaj, P.; Devi, C.J.; Thakur, D. Unlocking rhizosphere dynamics: Exploring mechanisms of plant–microbe interactions for enhanced tea (Camellia sinensis (L.) O. Kuntze) productivity. Curr. Microbiol. 2025, 82, 257. [Google Scholar] [CrossRef] [PubMed]
  64. Arafat, Y.; Din, I.U.; Tayyab, M.; Jiang, Y.; Chen, T.; Cai, Z.; Zhao, H.; Lin, X.; Lin, W.; Lin, S. Soil sickness in aged tea plantation is associated with a shift in microbial communities as a result of plant polyphenol accumulation in the tea gardens. Front. Plant Sci. 2020, 11, 601. [Google Scholar] [CrossRef]
  65. Pandey, A.; Palni, L.M.S. Bacillus species: The dominant bacteria of the rhizosphere of established tea bushes. Microbiol. Res. 1997, 152, 359–365. [Google Scholar] [CrossRef]
  66. Yu, L.; Wang, S.; Li, T.; Han, L. Response of soil faunal communities to tea tree cultivars in the hilly region of western Sichuan. China. Sci. Hortic. 2021, 275, 109701. [Google Scholar] [CrossRef]
  67. Pandey, A.; Palni, L.M.S.; Bisht, D. Dominant fungi in the rhizosphere of established tea bushes and their interaction with the dominant bacteria under in situ conditions. Microbiol. Res. 2001, 156, 377–382. [Google Scholar] [CrossRef]
  68. Sarkar, S.; Das, D.K.; Singh, A.; Laik, R.; Singh, S.K.; van Es, H.M.; Krishnan, K.; Singh, A.K.; Das, A.; Singh, U.; et al. Seasonal variations in soil characteristics control microbial respiration and carbon use under tree plantations in the middle gangetic region. Heliyon 2024, 10, e35593. [Google Scholar] [CrossRef]
  69. Ji, L.; Yang, Y.; Yang, N.; Khan, A.; Yang, L. Seasonal variation of diversity and co-occurrence patterns of arbuscular mycorrhizal fungal communities in mixed broadleaf-conifer forests. Appl. Soil Ecol. 2021, 158, 103782. [Google Scholar] [CrossRef]
  70. Zeng, Q.; Liu, Y.; Xiao, L.; An, S. Climate and soil properties regulate soil fungal communities on the Loess Plateau. Pedobiologia 2020, 81–82, 150668. [Google Scholar] [CrossRef]
  71. Xiao, D.; Gai, S.; He, X.; Zhang, W.; Hu, P.; Soromotin, A.V.; Kuzyakov, Y.; Wang, K. Habitat heterogeneity drives arbuscular mycorrhizal fungi and shrub communities in karst ecosystems. Catena 2023, 233, 107513. [Google Scholar] [CrossRef]
  72. Wang, C.; Kuzyakov, Y. Mechanisms and implications of bacterial-fungal competition for soil resources. ISME J. 2024, 18, wrae073. [Google Scholar] [CrossRef] [PubMed]
  73. Rocabruna, P.C.; Domene, X.; Matteazzi, A.; Figl, U.; Fundneider, A.; Fernández-Martínez, M.; Venir, E.; Robatscher, P.; Preece, C.; Peñuelas, J.; et al. Effect of organic fertilisation on soil phosphatase activity, phosphorus availability and forage yield in mountain permanent meadows. Agric. Ecosyst. Environ. 2024, 368, 109006. [Google Scholar] [CrossRef]
  74. Serrano-Grijalva, L.; van der Putten, W.H.; Ochoa-Hueso, R.; Margenot, A.J.; van Rijssel, S.Q.; Koorneef, G.J.; Veen, G.C. Soil extracellular enzyme activity increases during the transition from conventional to organic farming. Agric. Ecosyst. Environ. 2024, 375, 109202. [Google Scholar] [CrossRef]
  75. Burns, R.G.; De Forest, J.L.; Marxsen, J.; Sinsabaugh, R.L.; Stromberger, M.E.; Wallenstein, M.D.; Weintraub, M.N.; Zoppini, A. Soil enzymes in a changing environment: Current knowledge and future directions. Soil Biol. Biochem. 2013, 58, 216–234. [Google Scholar] [CrossRef]
  76. Dai, L.; Liu, C.; Yu, L.; Song, C.; Peng, L.; Li, X.; Tao, L.; Li, G. Organic matter regulates ammonia-oxidizing bacterial and archaeal communities in the surface sediments of Ctenopharyngodonidellus aquaculture ponds. Front. Microbiol. 2018, 9, 2290. [Google Scholar] [CrossRef]
  77. Chen, Y.P.; Tsai, C.F.; Rekha, P.D. Agricultural management practices influence the soil enzyme activity and bacterial community structure in tea plantations. Bot. Stud. 2021, 62, 8. [Google Scholar] [CrossRef]
  78. Vishwakarma, K.; Kumar, N.; Shandilya, C.; Mohapatra, S.; Bhayana, S.; Varma, A. Revisiting plant-microbe interactions and microbial consortia application for enhancing sustainable agriculture: A review. Front. Microbiol. 2020, 11, 560406. [Google Scholar] [CrossRef]
  79. Zhou, Y.; Zhou, X. Seasonal variation in kinetic parameters of alkaline phosphatase activity in a shallow Chinese freshwater lake (Donghu Lake). Water Res. 1997, 31, 1232–1235. [Google Scholar] [CrossRef]
  80. Maseko, S.T.; Dakora, F.D. Plant enzymes, root exudates, cluster roots and mycorrhizal symbiosis are the drivers of P nutrition in native legumes growing in P deficient soil of the Cape fynbos in South Africa. J. Agric. Sci. Technol. 2013, A, 331–340. [Google Scholar]
  81. Chaudhary, P.; Khati, P.; Chaudhary, A.; Maithani, D.; Kumar, G.; Sharma, A. Cultivable and metagenomic approach to study the combined impact of nanogypsum and Pseudomonas taiwanensis on maize plant health and its rhizospheric microbiome. PLoS ONE 2021, 16, e0250574. [Google Scholar] [CrossRef]
  82. Daunoras, J.; Kačergius, A.; Gudiukaitė, R. Role of soil microbiota enzymes in soil health and activity changes depending on climate change and the type of soil ecosystem. Biology 2024, 13, 85. [Google Scholar] [CrossRef]
  83. Garcia, C.; Hernández, T. Biological and biochemical indicators in derelict soils subject to erosion. Soil Biol. Biochem. 1997, 29, 171–177. [Google Scholar] [CrossRef]
  84. Wang, Z.-G.; Bao, X.-G.; Li, X.-F.; Jin, X.; Zhao, J.-H.; Sun, J.-H.; Christie, P.; Li, L. Intercropping maintains soil fertility in terms of chemical properties and enzyme activities on a timescale of one decade. Plant Soil 2015, 391, 265–282. [Google Scholar] [CrossRef]
  85. Wallenstein, M.D.; McMahon, S.K.; Schimel, J.P. Seasonal variation in enzyme activities and temperature sensitivities in Arctic tundra soils. Glob. Change Biol. 2009, 15, 1631–1639. [Google Scholar] [CrossRef]
  86. Hume, A.; Chen, H.Y.H.; Taylor, A.R.; Kayahara, G.J.; Man, R.Z. Soil C:N:P dynamics during secondary succession following fire in the boreal forest of central Canada. For. Ecol. Manag. 2016, 369, 1–9. [Google Scholar] [CrossRef]
  87. Chander, K.; Goyal, S.; Nandal, D.P.; Kapoor, K.K. Soil organic matter, microbial biomass and enzyme activities in a tropical agroforestry system. Biol. Fertil. Soils 1998, 27, 168–172. [Google Scholar] [CrossRef]
Figure 1. A comprehensive bar plot illustrating the minimum and maximum temperatures (°C), rainfall (mm), and relative humidity (%) during both morning and afternoon periods for the Jorhat District in Assam, India. This analysis covers climatic data from 2016 to 2019, providing a detailed overview of environmental conditions in the region. The data utilised for this study are sourced from the Climate and GIS Lab at the Tocklai Tea Research Institute, part of the Tea Research Association in Jorhat, Assam.
Environments 13 00314 g001
Figure 2. The experimental sites are strategically located within the scenic Jorhat District of Assam, India. Characterised by its lush green landscapes, this region presents a diverse array of natural beauty and biodiversity, thereby providing an optimal environment for research and experimentation.
Environments 13 00314 g002
Figure 3. The seasonal variation in microbial populations and soil enzyme activity was examined in detail, focusing on (a) the bacterial population expressed as colony-forming units per gram of dry weight (CFU g−1 dry wt.) and the fungal population also measured in CFU g−1 dry wt.; (b) soil acid phosphatase activity; (c) soil alkaline phosphatase activity; and (d) soil dehydrogenase activity. This data covers three consecutive years: 2016–2017, 2017–2018, and 2018–2019, with samples collected from five distinct tea estates located in the Jorhat District of Assam, India. Each bar in the graphs represents the mean of three independent replicates, and the accompanying error bars indicate the standard error (±SE) of the mean, providing a clear representation of the variability in the data. This comprehensive analysis sheds light on the dynamics of soil health and microbial community responses to seasonal changes in this unique agro-ecological region.
Environments 13 00314 g003
Figure 4. A seasonal correlation plot of the garden with each climate factor for the respective season for (a) acid phosphatase, (b) alkaline phosphatase, (c) soil dehydrogenase, (d) bacterial population, and (e) fungal population.
Environments 13 00314 g004
Figure 5. Homogeneous grouping through multivariate approaches is illustrated in two key analyses. (a) The season-wise dendrogram from hierarchical cluster analysis visually represents the relationships among treatments, with each group distinguished by a unique coloured node to signify shared characteristics. (b) The PCA biplot displays the first three principal components (PC1, PC2, and PC3) along with their respective factor loadings, providing insights into the underlying structure of the data. In this plot, seasonal variations are clearly delineated, with the monsoon depicted in black, summer in red, and winter in green, allowing for an immediate visual interpretation of seasonal effects on the dataset.
Environments 13 00314 g005
Table 1. Selected physico-chemical properties of the surface (0–15 cm) soils across five tea estates for the present investigation.
ParametersTea Estates
BKTEBTEDHTETKTETTE
pH (soil–water:1.0:2.5)4.254.434.614.544.25
Electrical conductivity (EC; soil:water:1.0:5.0; dS m−1)0.110.120.090.100.09
CEC (cmol kg−1)12.111.311.49.2311.2
Organic carbon (%)1.251.291.281.321.24
Sand (%)63.242.649.352.149.2
Silt (%)23.618.914.520.319.6
Clay (%)13.238.536.227.631.2
TextureSandy loamClay LoamSandy ClaySandy Clay LoamSandy Clay Loam
Water-holding capacity (%)50.755.552.355.650.2
Available N (mg kg−1)95.2115.1112.4105.390.8
Available P (mg kg−1)13.724.333.216.815.6
Available K (mg kg−1)106.6105.7121.9122.4107.1
Available S (mg kg−1)12.620.841.232.825.6
Exchangeable Ca (mg kg−1)438.3361.9520.2428.7425.8
Exchangeable Mg (mg kg−1)122.193.4219.6112.9110.3
BKTE: Bokahola Tea Estate; BTE: Borbhetta Experimental Tea Estate; DHTE: Deha Tea Estate; TKTE: Teok Tea Estate; and TTE: Tocklai Tea Estate.
Table 2. An analysis of the optimal distribution of parameters for each season, accompanied by its corresponding probability density function.
ParametersSeasonDistributionProbability Density FunctionTest Statisticp-Value
AcP SummerCauchy f x = 1 1.74 π × 1.74 2   1.74 2 + ( x 74.82 ) 2 4.310.37
MonsoonLog normal f x = 1 x × 0.37 2 π   e x p ( l n ( x ) 1.52 ) 2 2 0.37 2   5.260.31
WinterCauchy f x = 1 0.94 π × 0.94 2 0.94 2 + x 3.50 2 5.630.23
ALP SummerCauchy f x = 1 2.30 π × 2.30 2 2.30 2 + x 13.16 2 4.630.33
MonsoonWeibull f x = 4.13 12.20 × x 12.20 3.13 e x p x 12.20 4.13 4.320.37
WinterCauchy f x = 1 2.42 π × 2.42 2 2.42 2 + x 2.42 2 7.480.11
DH SummerWeibull f x = 4.10 5.23 × x 5.23 3.10 e x p x 5.23 4.10 4.580.35
MonsoonGamma f x = x 0.15 e x p x 0.28 0.28 0.85 × Γ 0.85 6.970.13
WinterWeibull f x = 0.44 5.33 × x 5.33 0.56 e x p x 5.33 4.13 1.810.77
Bacterial populationSummerCauchy f x = 1 101,994.87 π × 101,994.87 2 101,994.87 2 + x 430,047.50 2 7.820.10
MonsoonLogistics f x = e x p x 419,233.06 104,741.98   104,741.98   ( 1 + e x p x 419,233.06 104,741.98 2 ) 6.030.14
WinterCauchy f x = 1 70,106.68 π × 70,106.68 2 70,106.68 2 + x 256,263.69 2 0.690.95
Fungal populationSummerCauchy f x = 1 100,072.90 π × 100,072.90 2 100,072.90 2 + x 212,988.63 2 4.170.32
MonsoonCauchy f x = 1 65,917.85 π × 65,917.85 2 65,917.85 2 + x 210,825.65 2 7.440.09
WinterCauchy f x = 1 24,725.82 π × 24,725.82 2 24,725.82 2 + x 155,863.97 2 4.040.34
Acp: Acid phosphatase. ALP: Alkaline phosphatase. DH: Dehydrogenase.
Table 3. The factor loadings obtained from Principal Component Analysis (PCA) along with the correlations of the first three principal components, PC1, PC2, and PC3, in relation to various parameters.
ParametersFactor LoadingsCorrelation
PC1PC2PC3PC1PC2PC3
ACP0.4010.6090.2730.583−0.5570.686
ALP−0.3830.4860.6100.6480.5180.464
DH0.4720.436−0.4410.2470.553−0.400
Bacterial population0.427−0.4250.5790.583−0.5570.686
Fungal population0.537−0.1530.1580.6480.5180.464
Disclaimer/Publisher’s Note: The statements, opinions and data contained in all publications are solely those of the individual author(s) and contributor(s) and not of MDPI and/or the editor(s). MDPI and/or the editor(s) disclaim responsibility for any injury to people or property resulting from any ideas, methods, instructions or products referred to in the content.