1. Introduction
Soil pollution is defined as the introduction and accumulation of one or more contaminants in the soil at concentrations and for a duration sufficient to adversely alter its physical, chemical, and biological properties, posing risks to human health, ecological systems, plants, and the built environment [
1]. Various forms of soil pollution originate from urban, industrial, and agricultural activities. These contaminants can overwhelm the soil’s natural self-purification capacity, ultimately causing detrimental changes to the soil, water, and air environments [
1]. Crude oil and its refined derivatives represent one of the most prevalent and consequential sources of global soil contamination. The environmental significance of petroleum hydrocarbon contamination is further amplified by increasing global energy demands, which intensify extraction, refining, and transportation activities. According to the International Energy Agency (IEA), global oil consumption is projected to reach 101.8 million barrels per day in 2024, a figure that accounts for derivatives of coal and natural gas but excludes biofuels. According to the International Energy Agency (IEA) data, the United States recorded the highest oil consumption in 2024 at 19 million barrels per day (MB/D), marking a slight decrease of 0.1% from the previous year. China followed as the second-largest consumer with 16.4 MB/D, experiencing a more pronounced annual decline of 1.2% [
2].
Following a spill, petroleum contaminants migrate vertically through the soil profile under the influence of gravity, posing an imminent risk to groundwater resources. Upon reaching the water table, these contaminants are transported laterally by groundwater flow and can subsequently re-contaminate the adjacent soil zones via capillary rise and seasonal fluctuations in the water table [
1]. Petroleum hydrocarbons exhibit relative chemical inertness and immiscibility with water, leading to their persistence in the soil matrix as discrete pools of non-aqueous phase liquids (NAPLs) trapped within the pore spaces. These contaminants significantly alter the soil’s physical and mechanical properties, including its texture, structure, and shear strength [
3]. The magnitude of these alterations is governed by three key factors: soil type (e.g., grain size distribution, clay mineralogy), the chemical characteristics of the petroleum product, and the concentration of the contaminant [
4,
5].
The impact of different levels of oil contamination on the engineering behavior of granular and cohesive soils has been extensively studied in the geotechnical literature [
4,
5,
6,
7,
8,
9,
10,
11,
12,
13,
14,
15,
16,
17,
18,
19,
20,
21,
22,
23,
24,
25].
In their experimental study on Kuwaiti sand, Al-Sanad et al. [
8] revealed that crude oil contamination reduced both permeability and shear strength, with the magnitude of the reduction being dependent on the contaminant concentration.
In an experimental investigation on three soil types (CL, SM, SP) from southern Iran, Khamehchiyan et al. [
9] systematically evaluated the effects of crude oil contamination. Their results demonstrated that increasing the crude oil content consistently reduced the permeability, the optimum moisture content, the maximum dry density and the plasticity index across all the soils. The unconfined compressive strength response was non-monotonic, exhibiting a slight initial increase at low contamination levels followed by a subsequent decrease. The shear strength parameters showed a distinct soil-dependent behavior: the cohesion increased for the SP and SM soils but decreased for the CL soil. Furthermore, the friction angle correlated positively with the oil content in the CL soil, whereas a reverse relationship was discovered in the SP and SM soils.
The impact of hydrocarbon contamination on soil hydromechanical behavior has been documented in several studies. Fallah et al. [
10] demonstrated that diesel contamination alters the soil–water retention curve (SWRC), increasing the water holding capacity at matric suctions below 1 bar compared to clean specimens, while also noting a shift in the soil pH. Complementing these findings, Wei et al. [
11] highlighted the role of the oil composition, reporting that organic compounds can reduce the water retention capacity of sand–silt soils under higher pressure conditions. Collectively, these studies underscore that the effect of oil on water retention is complex and contingent on both the soil type and the specific contaminant properties.
Kermani and Ebadi [
12], investigating CL soil from a Tehran oil refinery site, found that increasing the crude oil content elevated the maximum dry density, the plastic limits and the friction angle while reducing the cohesion and the optimum moisture content. Khosravi et al. [
13] observed that in diesel-contaminated kaolinite, the soil cohesion experienced a marginal increase with increasing diesel content, whereas the internal friction angle and the overall shear strength exhibited a decreasing trend. The research on fine-grained soils has demonstrated that hydrocarbon contamination induces significant microstructural alterations. Izdebska-Mucha and Trzciński [
14] reported that hydrocarbons can substantially modify the soil texture, leading to an increase in both the quantity and the size of the pores in the contaminated specimens compared to clean soil. Expanding on these macro-scale observations, Trzciński et al. [
15] specifically examined the microstructure of diesel-contaminated clay and found that contamination reduces the interparticle repulsive electrostatic forces, providing a mechanistic explanation for the previously observed textural changes. Nasehi et al. [
4] investigated the effects of diesel contamination on CL clay, reporting that it increased the cohesion and the Atterberg limits but reduced the compaction efficiency and the internal friction angle. Furthermore, the uniaxial compressive strength (UCS) tests revealed a non-monotonic response: the strength initially increased at low contamination levels before declining at higher diesel concentrations. Consistent with the findings of Hosseini et al. [
16], who reported a reduction in the shear strength of clay soil due to crude oil contamination, Safehian et al. [
17] further demonstrated that diesel contamination in illite clay (CH) similarly degrades the geotechnical properties, including compaction properties and key shear strength behavior. Kererat [
18], investigating diesel-contaminated SM soil, reported an increase in soil cohesion due to hydrocarbon contamination. Sarmadi et al. [
19] experimentally evaluated the impact of kerosene contamination on SP sand. Their results indicated a non-monotonic relationship with the maximum dry density, which initially increased at low contamination levels (3–6%) before decreasing at higher concentrations. Furthermore, kerosene contamination was found to decrease the internal friction angle, the optimum moisture content, and the permeability while increasing the soil cohesion. This differential behavior underscores a fundamental principle in contaminated soil mechanics: the engineering properties of granular soils (e.g., SP sand) are primarily governed by particle characteristics and pore fluid physics, whereas clay soil behavior is dominated by texture, structure, and physico-chemical pore fluid interactions, as previously established by Zhao [
20]. Mekkiyah et al. [
21] reported that hydrocarbon contamination significantly reduced the liquid limit of silty loam and sandy loam soils by 38% and 16%, respectively. The study also documented a corresponding decrease in the soil permeability due to oil contamination. In geotechnical engineering, mechanical soil reinforcement using geosynthetics has been predominant [
26,
27,
28]. However, since the late 20th century, the advent of nanotechnology has spurred extensive laboratory and field research, demonstrating the effective use of nanoparticles for soil improvement [
29,
30,
31]. In a comprehensive review, Bahmani et al. [
32] systematically analyzed the influence of nanosilica particle size and replacement content on the chemical, physical and microstructural properties of cemented residual soil. Their analysis revealed that finer nanosilica particles accelerated early-stage reactions, whereas larger particles demonstrated enhanced effectiveness after 14 days of curing. Ali Zomorodian et al. [
33] evaluated the efficacy of nanoclay and nanosilica additives in enhancing the strength of both clean and kerosene-contaminated sandy lean clay. Their findings indicated that the addition of 0.5–2.5% of either nanomaterial significantly improved the strength of the uncontaminated soil. For the samples contaminated with 12 wt% kerosene, the maximum peak strength was attained with 2% nanoclay and 2.5% nanosilica.
The existing studies on the geotechnical characteristics of contaminated soils have largely examined granular and cohesive soils in isolation. Notably, cohesive and clayey soils exhibit particularly complex behavior when subjected to oil contamination due to fundamental differences in composition and chemical characteristics between soil minerals and hydrocarbon compounds, leading to diverse and often contradictory alterations in soil properties. On the other hand, no previous study has systematically investigated the simultaneous effects of diesel contamination and nanosilica treatment on the geotechnical properties of a sand–clay mixture. Diesel contamination induces hydrophobicity and reduces clay–water interactions, whereas nanosilica being highly hydrophilic with a large specific surface area act in the opposite direction. The interplay between these two opposing mechanisms (diesel-induced hydrophobicity versus nanosilica induced hydrophilicity) has not been previously reported. The present study provides a set of experimental data on the combined effect of these mechanisms in a real sand–clay mixture, which has not been documented so far.
Here, the sand–kaolinite mixtures were selected for investigation for three main reasons. First, natural soils predominantly exist as mixtures of granular and cohesive fractions. Second, kaolinite represents one of the most prevalent clay minerals globally. Third, while existing literature on contaminated soils primarily focuses on pure sand or clay, studies on natural soils remain limited. Consequently, the specific role of clay content in governing the behavior of contaminated soil mixtures is not yet well-established, a gap this research aims to address.
Scope of the Problem and Research Significance
The Persian Gulf and the Sea of Oman region, home to extensive oil resources, hosts numerous refineries that release vast quantities of fuel into the market daily. Compounded by widespread fuel smuggling, these activities have led to significant environmental challenges. In particular, diesel fuel introduced either through deliberate discharge or leakage from transmission systems has caused severe soil contamination. Consequently, investigating the behavior of diesel-contaminated soils and developing accurate behavioral models are both crucial and necessary. In this study, a sand–clay mixture was artificially contaminated with varying percentages of diesel fuel and treated with three different nanosilica content levels to assess the resulting geotechnical and behavioral changes in the soil.
2. Materials and Experiments
This study investigates the effect of diesel contamination on the geotechnical characteristics of a loamy sand soil through the comprehensive laboratory testing of both uncontaminated and contaminated samples. The samples were prepared by mixing clay and sand at a fixed ratio of 40:60 by weight. The experimental variables were diesel contamination (0, 2, 4, 6, 8, and 10 wt%) and nanosilica content (0, 1, and 2 wt%). This resulted in a total of 18 distinct sample compositions. To ensure reliability, all the experiments were performed in replicate. A systematic naming convention was adopted where each sample is identified by its diesel (D) and nanosilica (N) content. For instance, D0-N0 denotes the clean soil (0% diesel, 0% nanosilica), D1-N1 represents soil with 1% diesel and 1% nanosilica, and D10-N2 indicates soil with 10% diesel and 2% nanosilica.
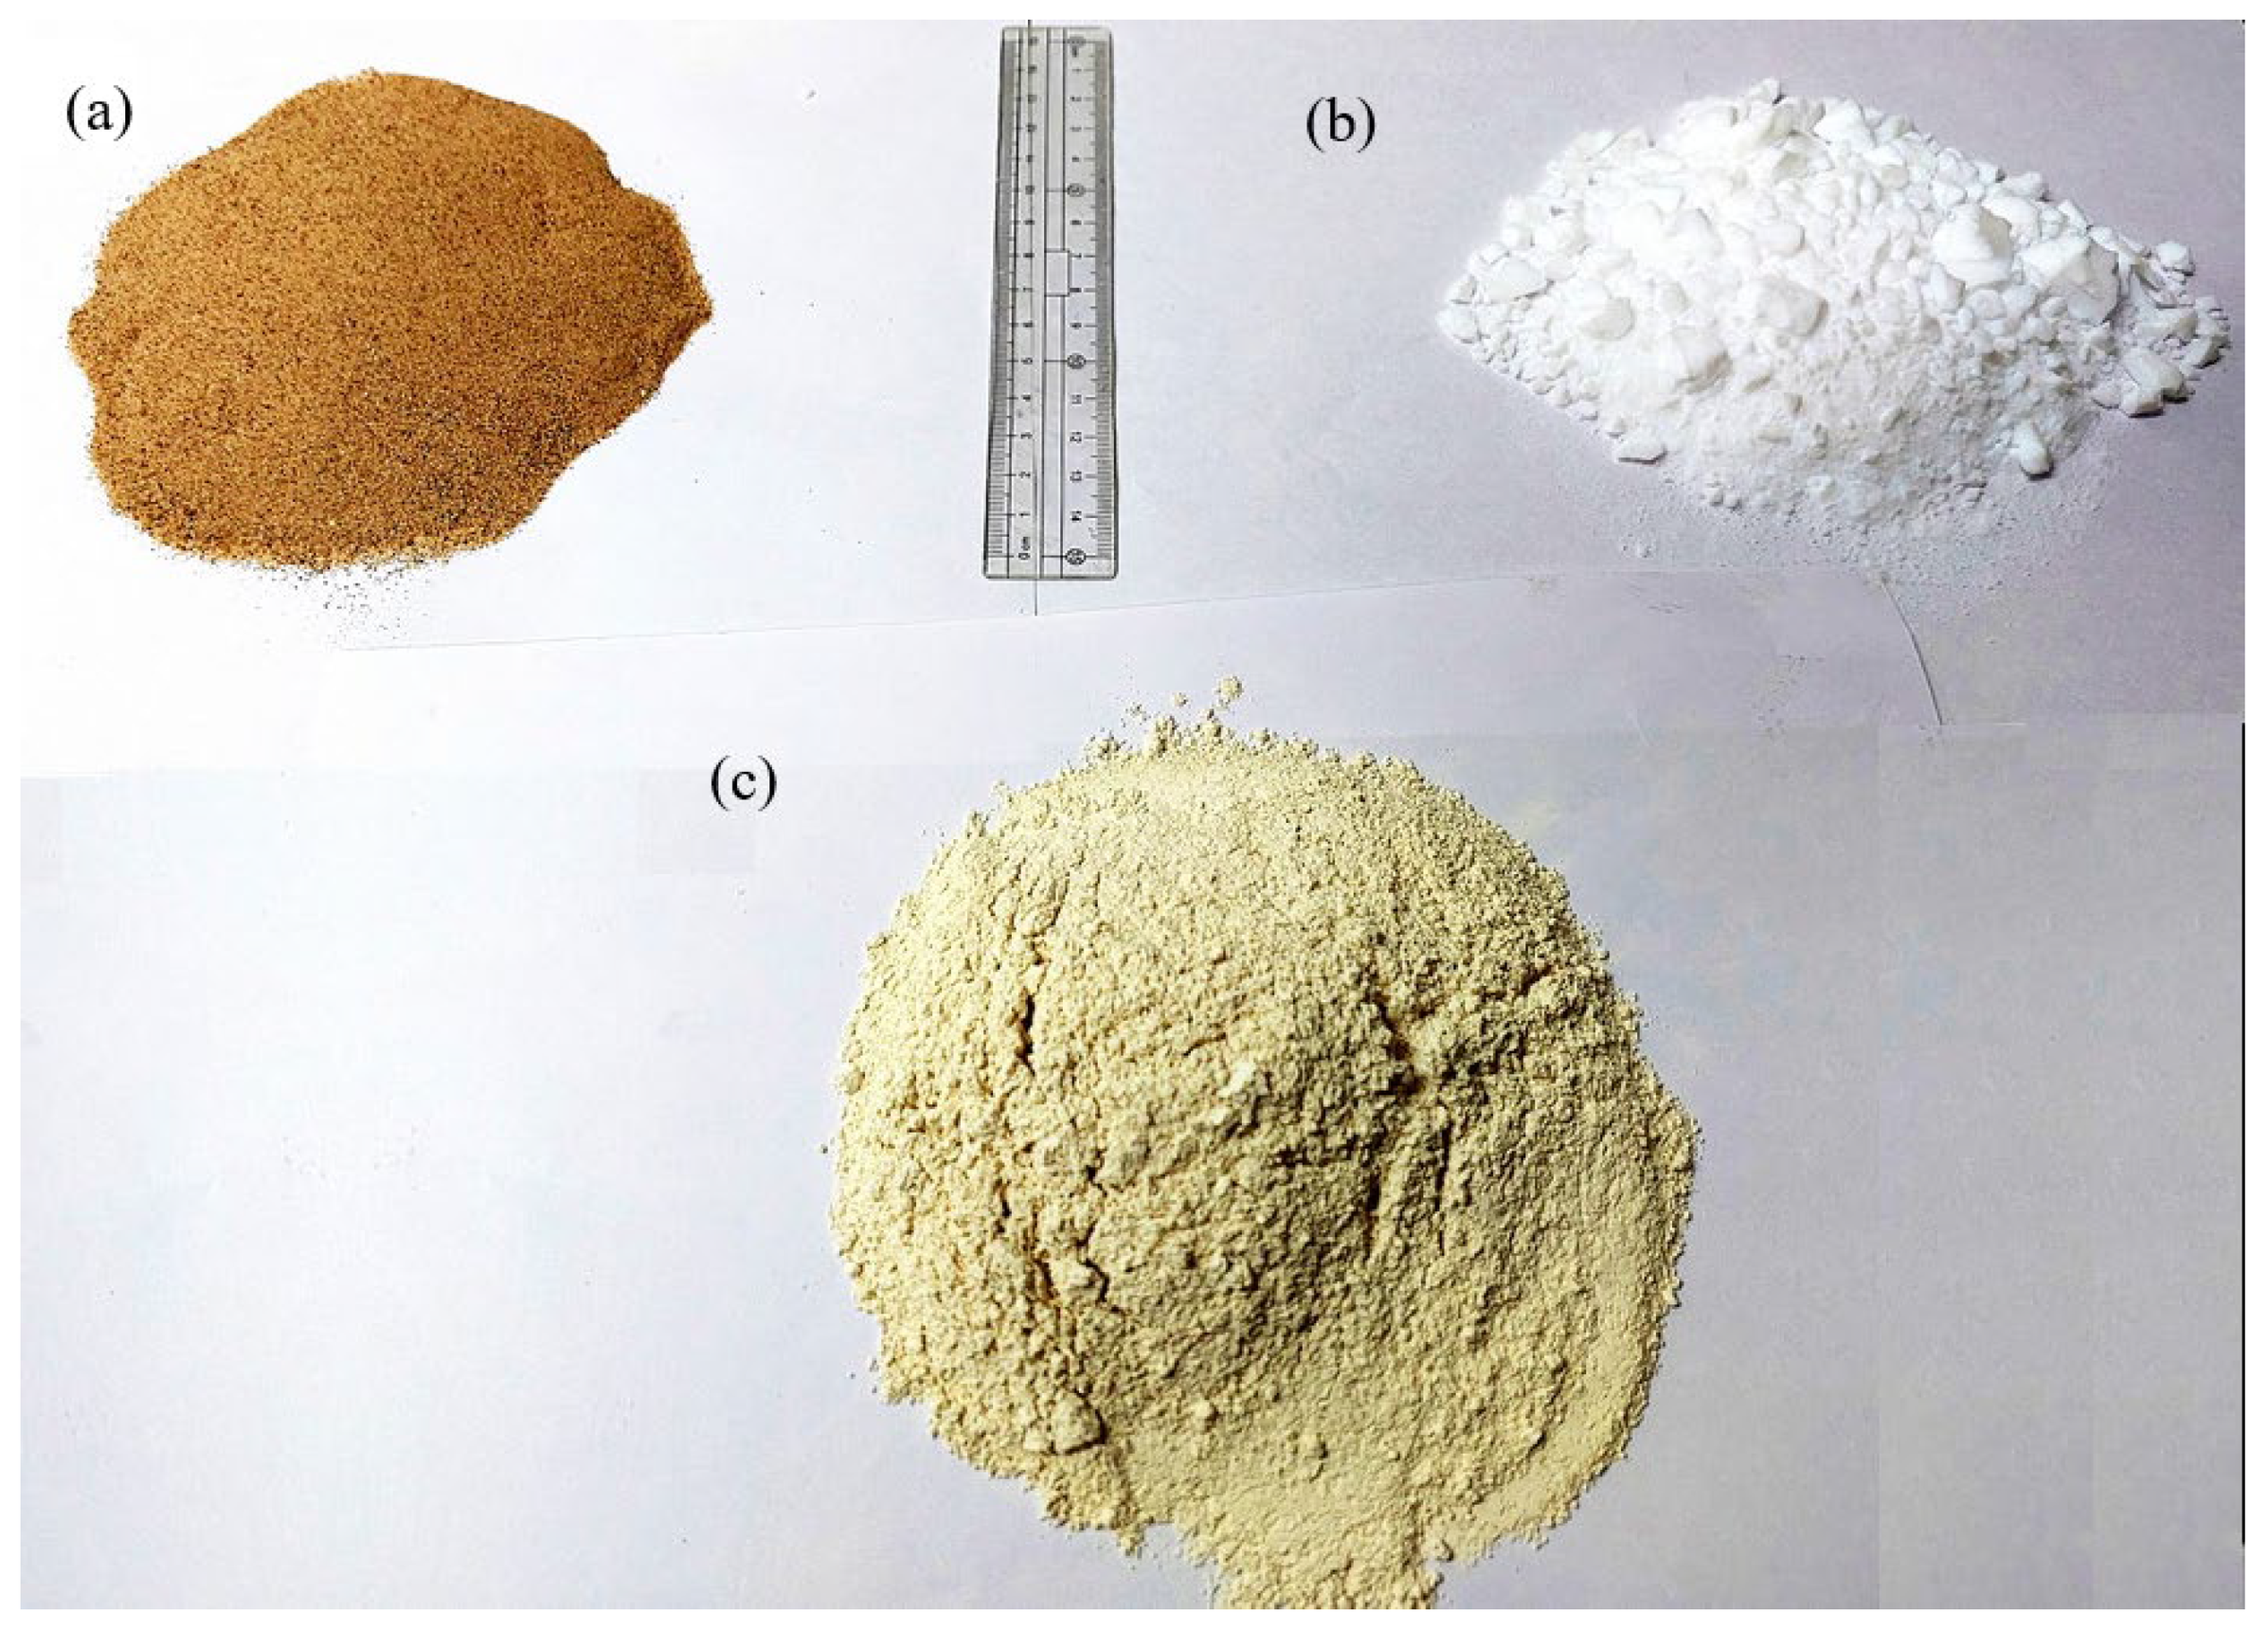
The sand was uniform-grain silica sand (Firuzkuh No. 171) sourced from the Firuzkuh mine in northeastern Tehran, Iran. The clay (kaolinite) was supplied by the Iran China Clay Industries Corporation and originated from the Jolfa mine in northwestern Iran (
Figure 1).
The x-ray diffraction (XRD) analysis was conducted to identify the primary mineral composition of the sand and kaolinite. Additionally, the x-ray fluorescence (XRF) analysis was conducted to determine the chemical composition of the kaolinite and sand; the findings are displayed in
Table 1.
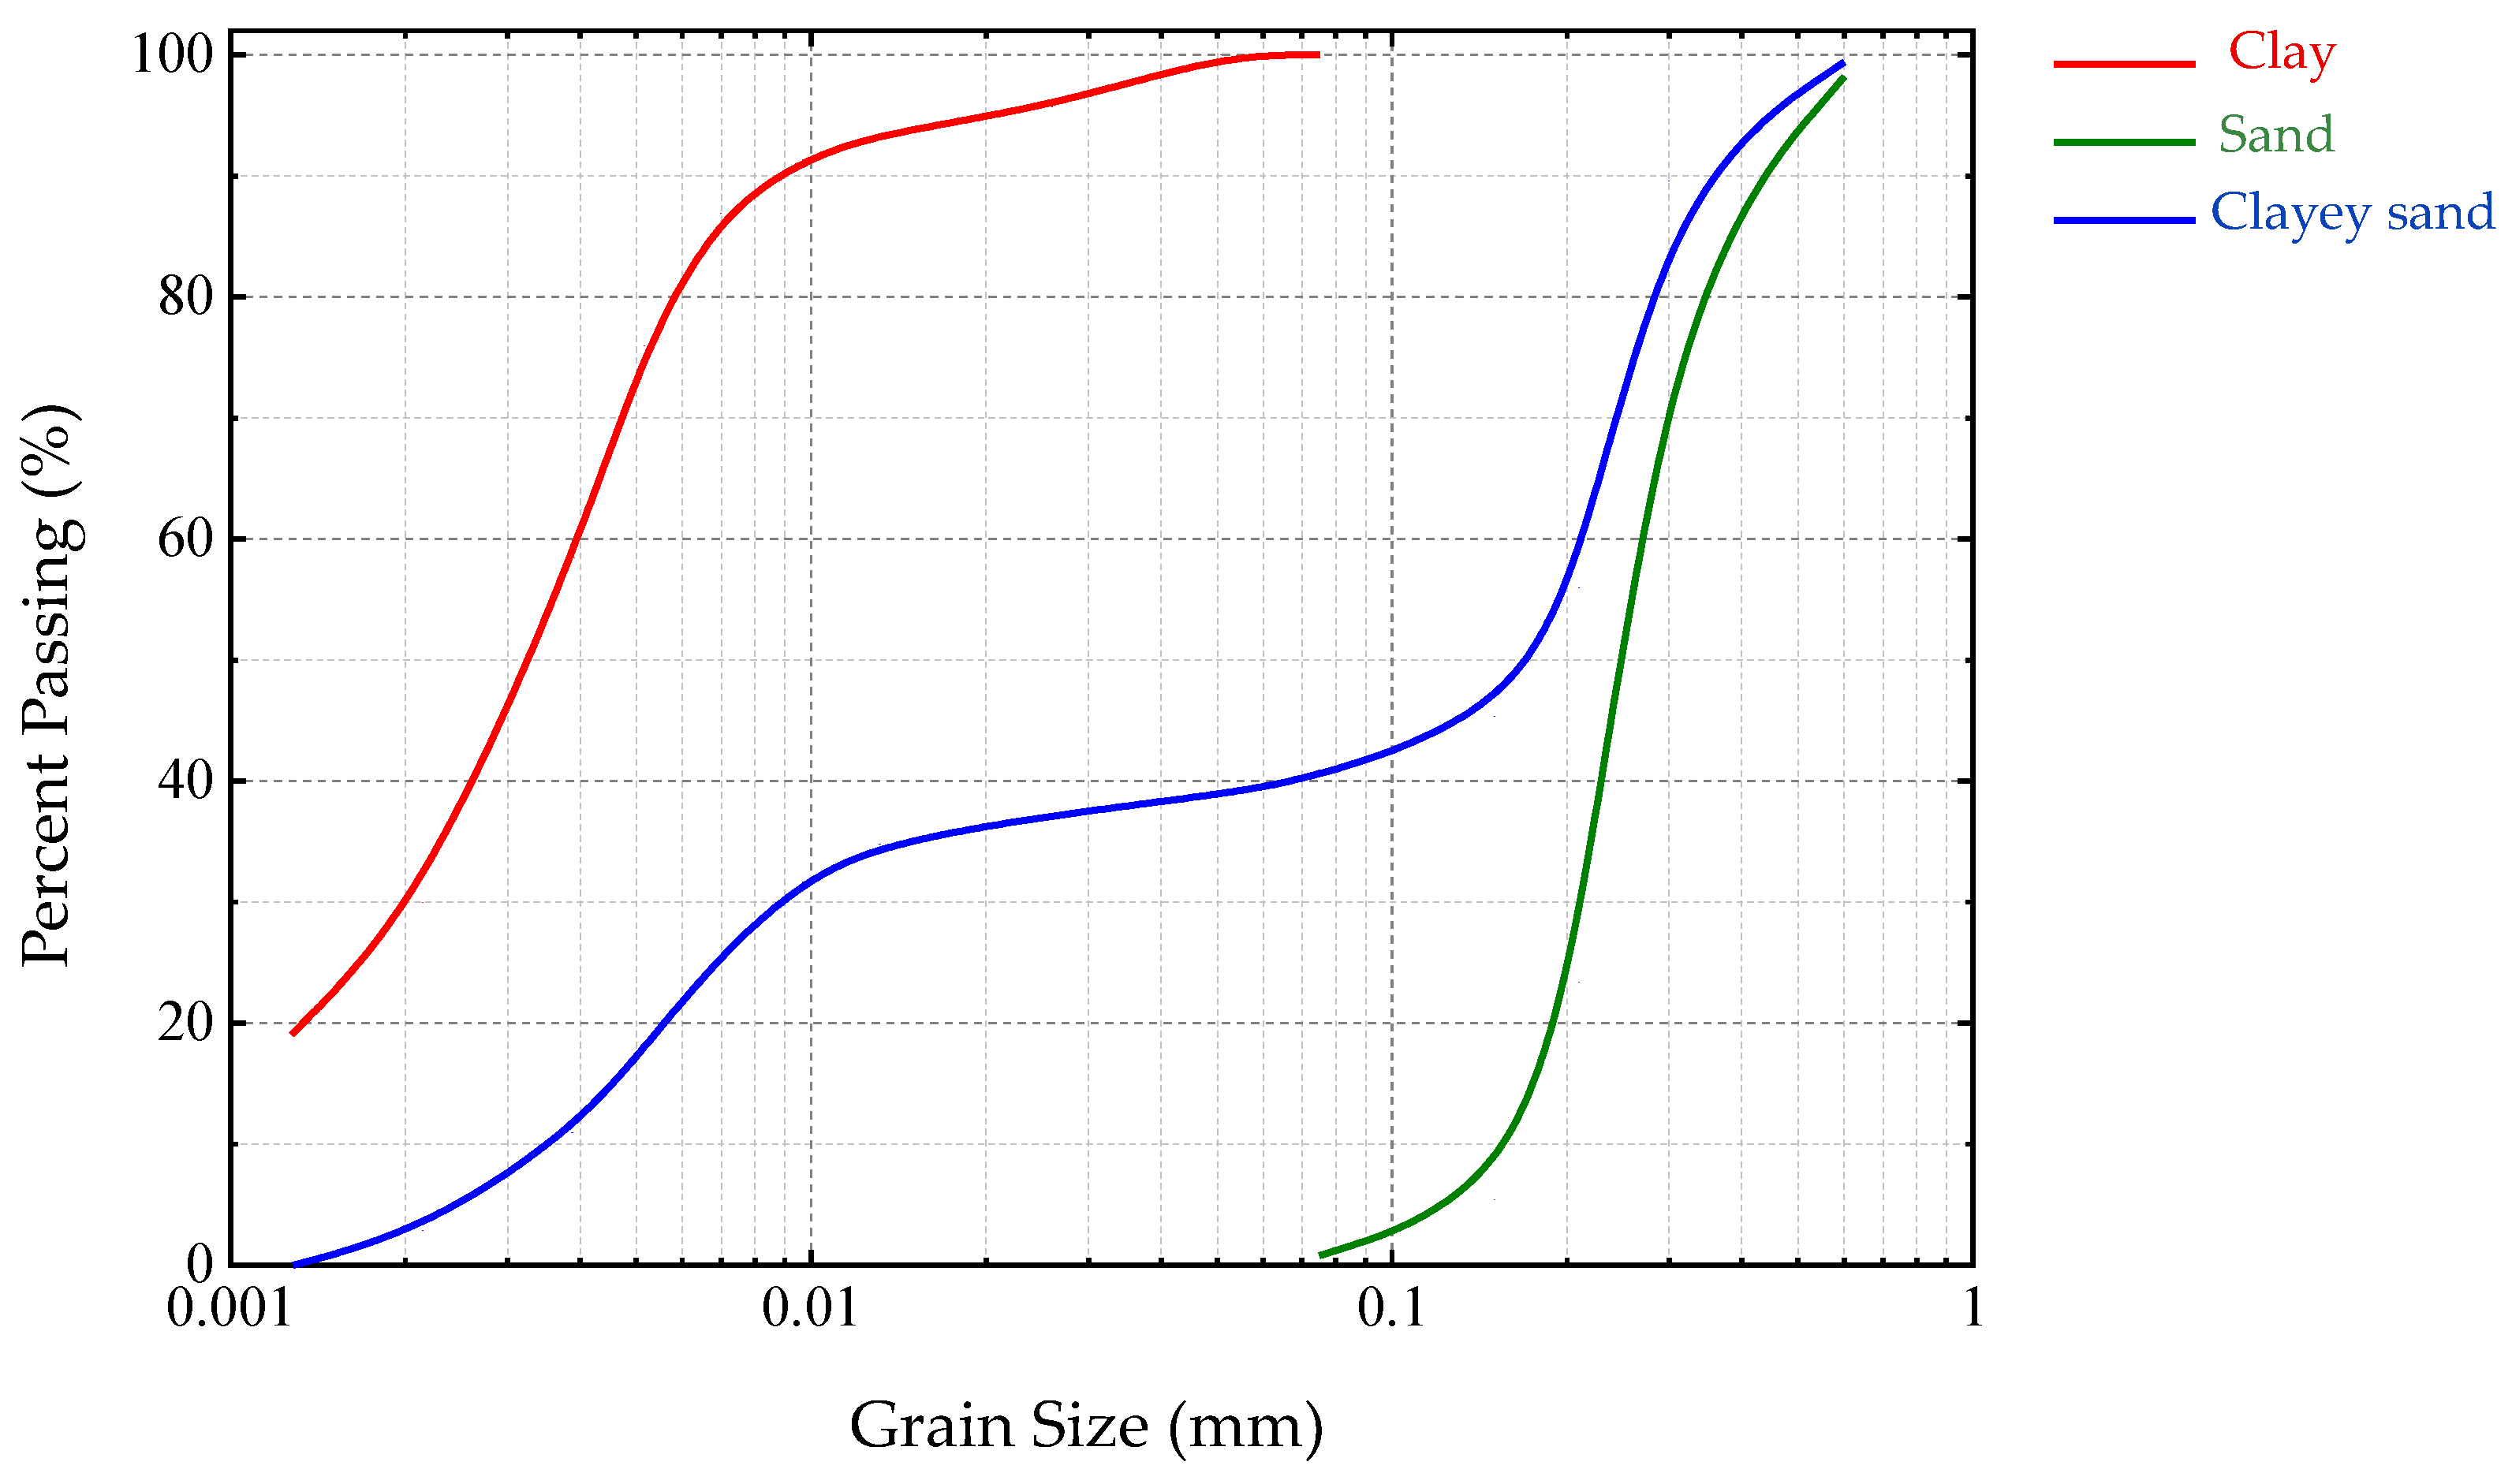
The grain size distribution and hydrometer tests were carried out on the sandy and kaolinite soils in accordance with the ASTM [
34]. The particle size distribution curves for the sand, clay, and sand–clay mixture are provided in
Figure 2. According to the Unified Soil Classification System (USCS), sand type SP, clay type CL, and sand–clay mixtures are classified as SC.
The nanosilica was obtained from the Iranian Nanomaterials Research Company, and its physicochemical properties are listed in
Table 2. The fundamental characteristics of the diesel fuel used in this research, which was acquired from a local fuel station, are provided in
Table 3.
2.1. Mixture Preparation
Before mixing the soils in the specified proportions, the sand and the kaolinite were separately dried in an oven at 110 °C for 24 h. The dried materials were then combined at a ratio of 60% sand to 40% clay by weight. To prepare the diesel-contaminated specimens, diesel fuel was introduced gradually at concentrations of 2%, 4%, 6%, 8%, and 10% of the dry soil mass. Hernández-Mendoza et al. [
35], investigating unsaturated clay soil, reported that the soil retains a maximum diesel content of only 12.6%, with any excess being expelled.
A two-stage mixing procedure consisting of an initial manual mixing (approximately 3–5 min) followed by mechanical mixing was employed to ensure a homogeneous mixture. The mechanical mixing stage was performed using a standard laboratory mortar mixer at a rotation speed of 300 ± 10 rpm for 15 min. A curing time of one month, which is generally accepted in the scientific literature for hydrocarbon- and oil-contaminated soils, was applied in the present study. Accordingly, the contaminated soil mixtures were sealed in thick plastic bags and stored under controlled laboratory conditions protected from sunlight to achieve equilibrium. Diesel is a middle distillate fuel with a low vapor pressure. Unlike gasoline, diesel evaporates slowly and incompletely under typical laboratory conditions. Studies indicate that even thin films on open surfaces may take 24 to 48 h to lose only their lightest fractions, whereas diesel absorbed into a porous soil matrix persists for weeks or months. Since the samples in this study were stored in sealed containers with minimal headspace, evaporation was further suppressed. Therefore, evaporative losses over the one-month curing period are considered negligible for the purposes of this study. Following the initial curing period, nanosilica was added to select specimens at 1% and 2% by dry weight. These amended specimens were then stored for an additional 72 h to allow for curing and to reach a new equilibrium. This 3-day curing period was chosen for several reasons. First, it is a well-established timeframe for evaluating early-age strength development in nanosilica-treated soils. Second, the scientific literature indicates that nanosilica can accelerate the consolidation process compared to traditional additives. Research has shown that nanosilica reduces volume change properties within a relatively short period while providing a significant increase in the engineering strength, with measurable improvements observed within the first few days of curing. Third, the 72 h period is practically relevant for understanding the primary physical mechanisms—namely, filler effect, flocculation, and electrostatic interactions—that dominate strength improvement in our low-calcium system. Given that significant pozzolanic reactions are not expected in this system, the increase in the initial strength occurs rapidly due to particle agglomeration and flocculation, mechanisms that take place mainly within the first 72 h.
2.2. Experimental Methodologies
The experimental program encompasses the determination of fundamental index properties (specific gravity and Atterberg limits), compaction characteristics, strength parameters (uniaxial compressive strength and CBR), permeability, and consolidation behavior.
The specific gravity (G
s) of a soil is defined as the ratio of the mass of a given volume of soil solids to the mass of an equal volume of distilled water at a specified temperature, typically 23 °C. This property is fundamental for establishing the relationship between the weight and volume of a soil mass. Consequently, with knowledge of the void ratio (e) and the specific gravity, one can calculate the dry or moist unit weight of the soil. The unit weight (or density) of a soil is a critical parameter in solving various geotechnical engineering problems, including those related to settlement and slope stability. Furthermore, specific gravity is an essential input for calculations in numerous laboratory tests, such as the consolidation test. In this study, the specific gravity for all the soil samples was determined in accordance with the ASTM standard [
36].
The standard compaction test was performed in accordance with the ASTM [
37] to determine the compaction properties of the soil mixtures. The maximum dry density (MDD) and the optimum moisture content (OMC) for both the clean and contaminated specimens were established after a one-month curing period. These parameters were subsequently utilized to fabricate the specimens for the subsequent experiments, ensuring consistent and comparable conditions across all the tests. All the test specimens were prepared at their respective OMCs using soils with identical composition and contaminant concentrations.
The California Bearing Ratio (CBR) test was conducted in accordance with the ASTM [
38] and AASHTO [
39] standards, following the Proctor compaction test.
The Atterberg limits of the soil fraction passing the No. 200 sieve (0.075 mm) were determined following the ASTM standard [
40].
The falling-head permeability test was conducted in accordance with the ASTM [
41] to assess the hydraulic conductivity of the samples containing varying dosages of diesel and nanosilica. A rigid wall permeameter with a cylindrical mold (61 mm in height and 100 mm in diameter) was employed for this purpose.
The unconfined compressive strength (UCS) of the samples was tested in accordance with the ASTM [
42] to evaluate their resistance behavior.
The one-dimensional oedometer consolidation tests were conducted in accordance with the ASTM [
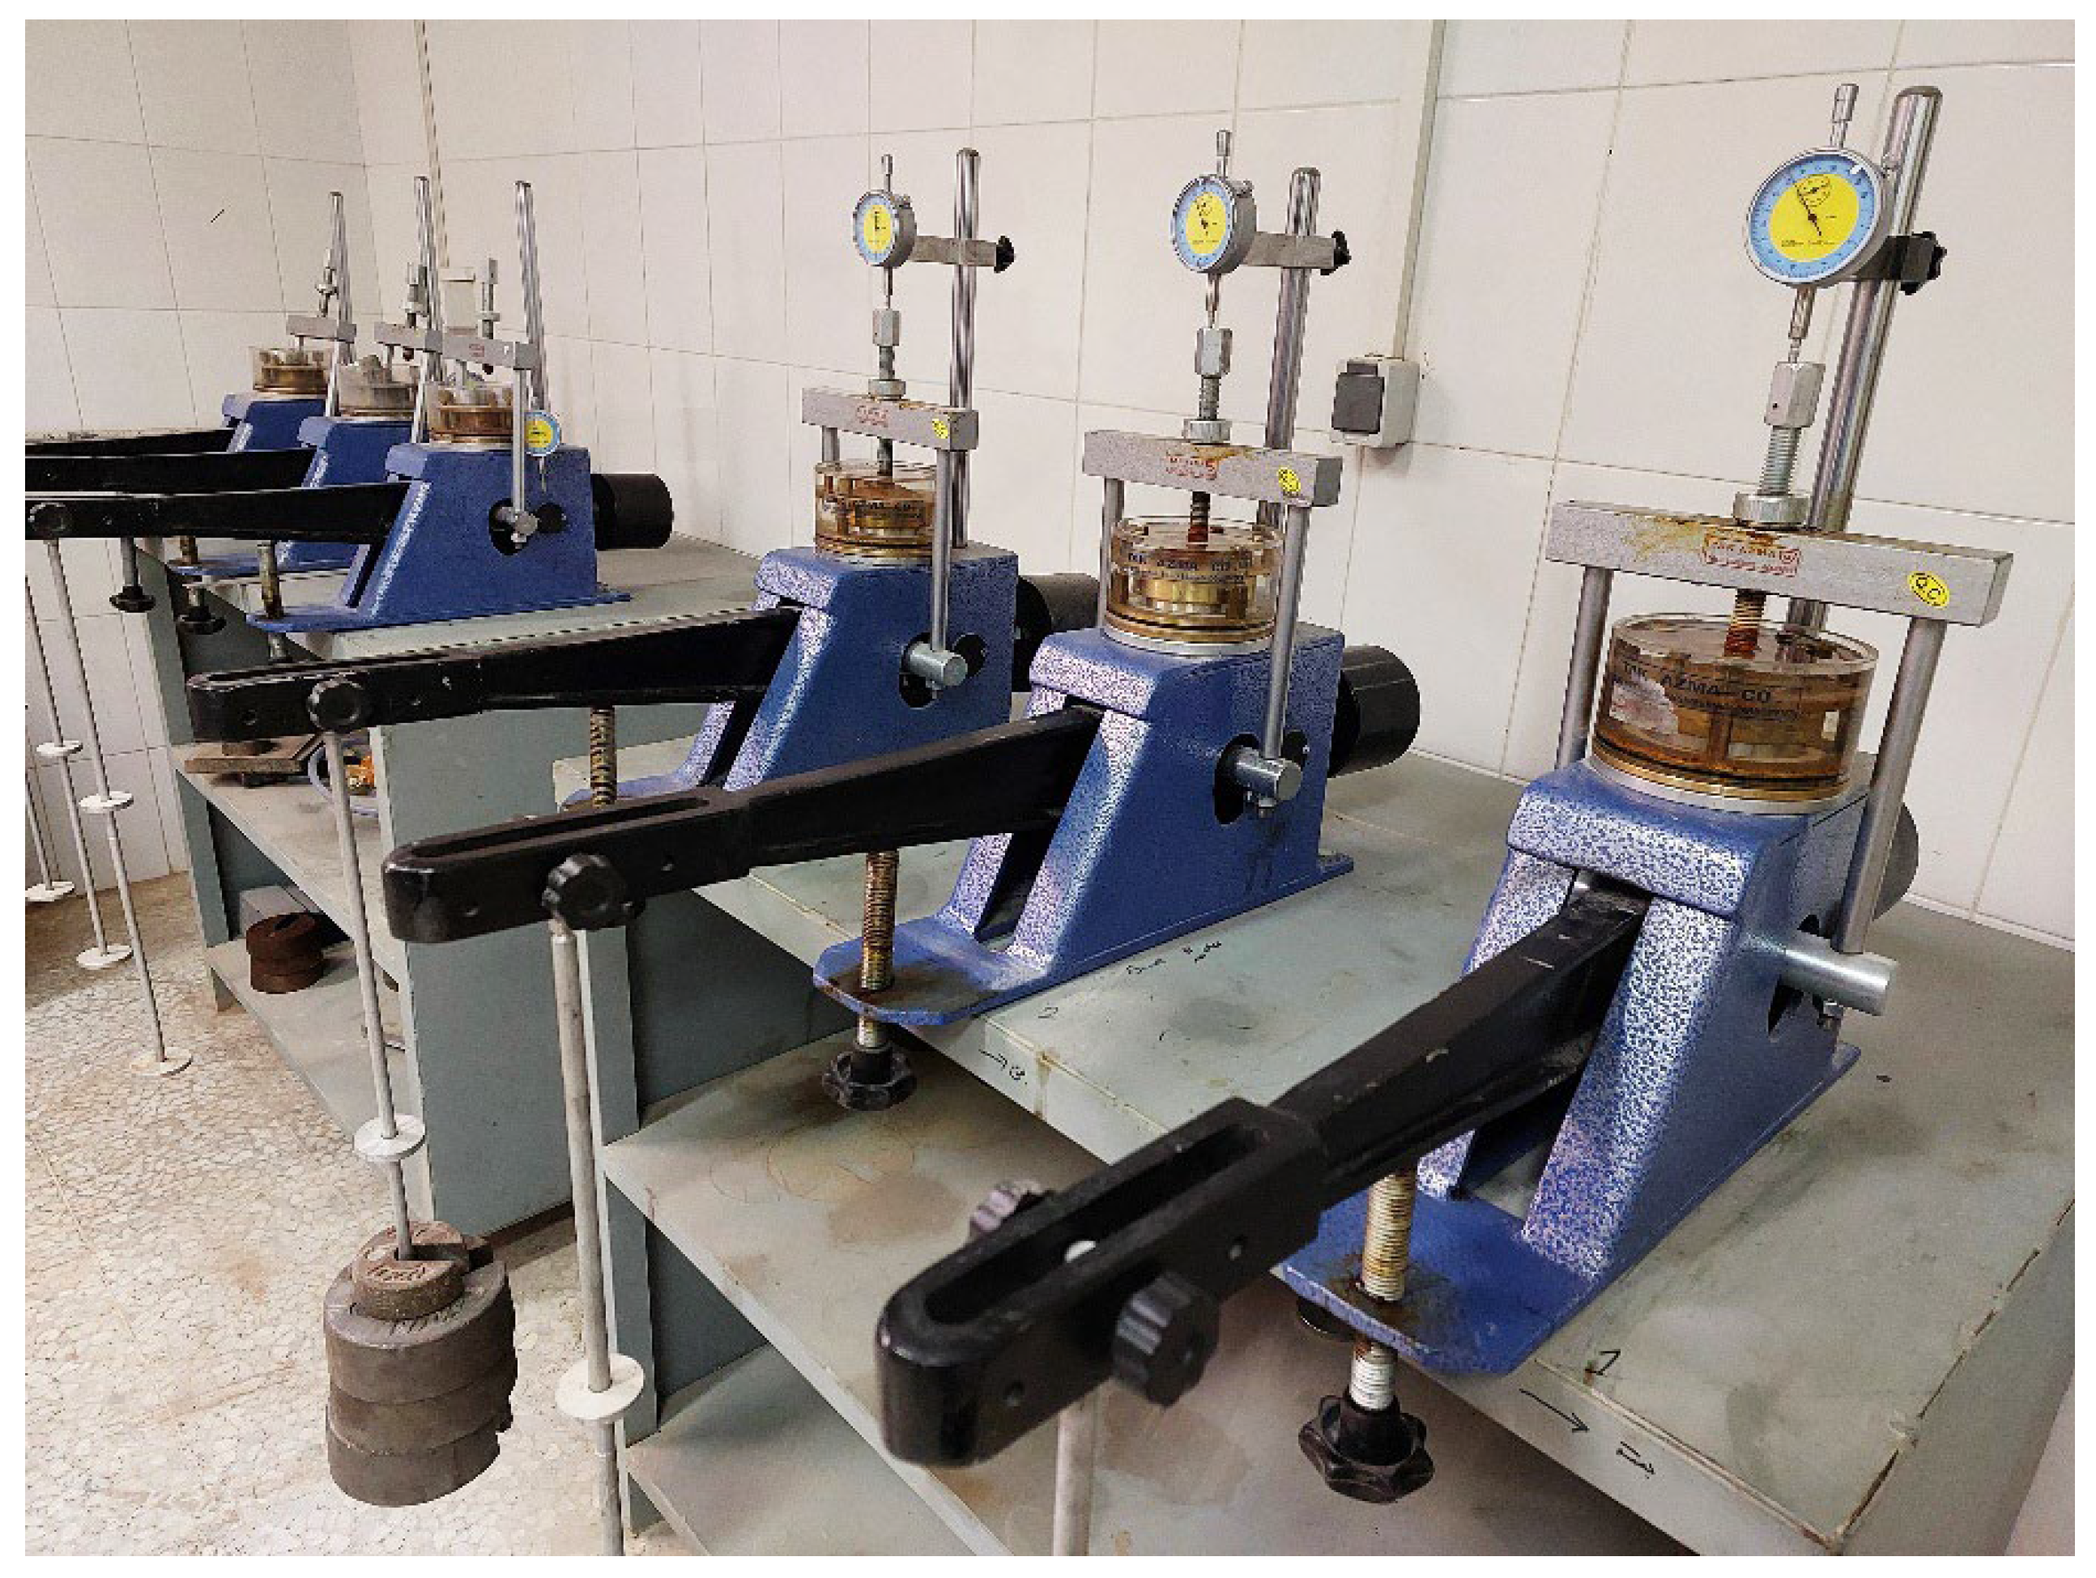
43] to investigate the settlement behavior in both the clean and diesel-contaminated soil samples. The samples, with a height of 20 mm and a diameter of 50 mm, were prepared at their maximum dry unit weight and OMC, followed by saturation with distilled water prior to loading. To minimize side friction, the inner wall of the consolidation ring was coated with a thin layer of silicone grease. Special measures were also implemented to prevent the evaporation of the pore fluid from the top of the consolidation cell. The applied consolidation pressure ranged from 49 kPa to 1569 kPa, with each pressure increment maintained for 24 h. Upon completing the final loading stage, the samples were unloaded to evaluate the soil swelling characteristics. The consolidation test apparatus used in this study is presented in
Figure 3. The compression index (C
c) was assumed as the compressibility property, which is as follows:
where
is the final void ratio after primary consolidation corresponding to a specific consolidation stress
.
The soil pH was measured using a 1:2.5 (w/v) soil-to-deionized water ratio. The air-dried soil samples were passed through a 2 mm sieve, and 10 g of the prepared soil was mixed with 25 mL of deionized water in a beaker. The suspension was stirred for 30 min using a magnetic stirrer to achieve equilibrium. After calibration of the pH meter with standard buffer solutions (pH 4.0, 7.0, and 10.0) at room temperature, the pH of the suspension was measured while stirring gently. The electrode was rinsed with deionized water between measurements. All the analyses were performed in triplicate, and the average values were reported.
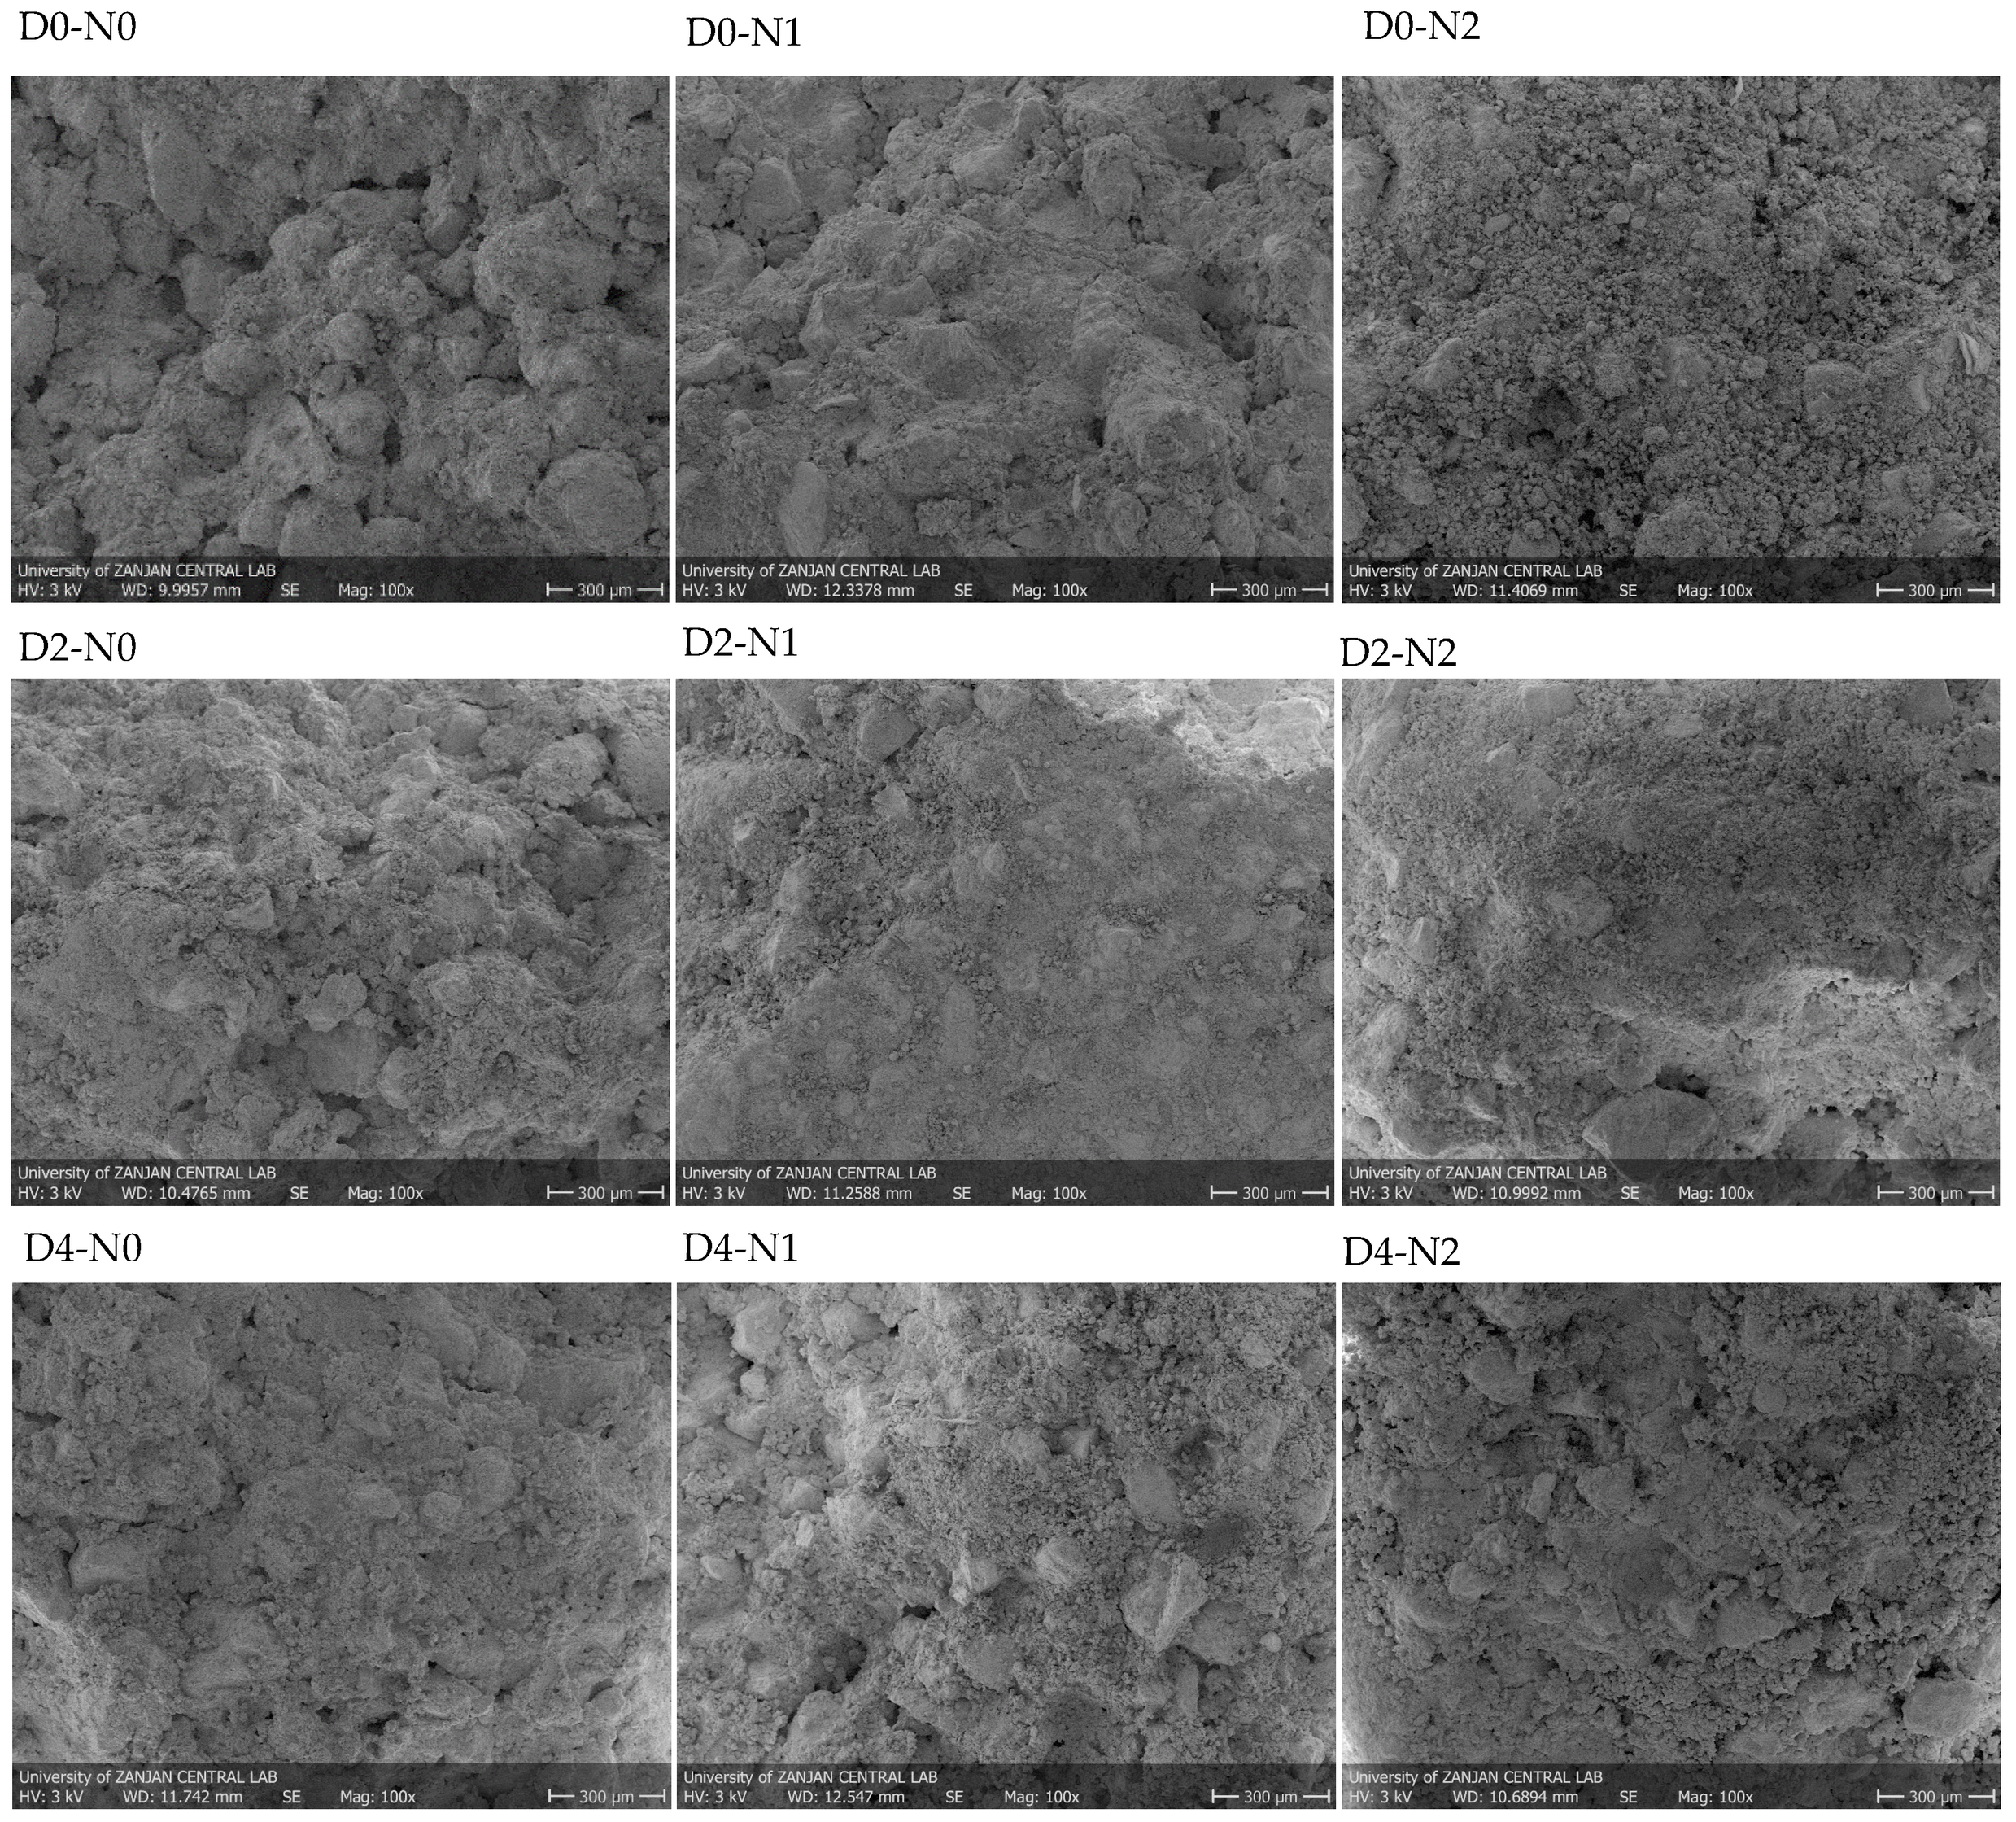
The macroscopic behavior of soil is fundamentally governed by microstructural interactions among its constituent minerals and components. Techniques such as computed tomography (CT) scanning, optical microscopy and scanning electron microscopy (SEM) are commonly employed to characterize these interactions, particularly between soil particles and additives. In the present paper, a scanning electron microscopy (SEM) analysis was performed on specimens representing different treatment levels of diesel and nanosilica to examine the microstructural alterations, particularly the interactions among hydrocarbon contaminants, clay platelets, and sand particles.
3. Results
In accordance with the mineralogical tests described in the
Section 2, the results indicate that quartz is the dominant mineral in the sand, whereas kaolinite, magnetite, and quartz are the main minerals in the clay. The results of the physical and mechanical tests performed on the sand–clay mixtures treated with nanosilica are presented below.
3.1. SEM Observations of Fabric Changes in Soil Due to Diesel Contamination and Nanosilica Treatment
Soil texture is a fundamental factor governing the mechanical behavior of soils, particularly in clay-rich systems. As illustrated in
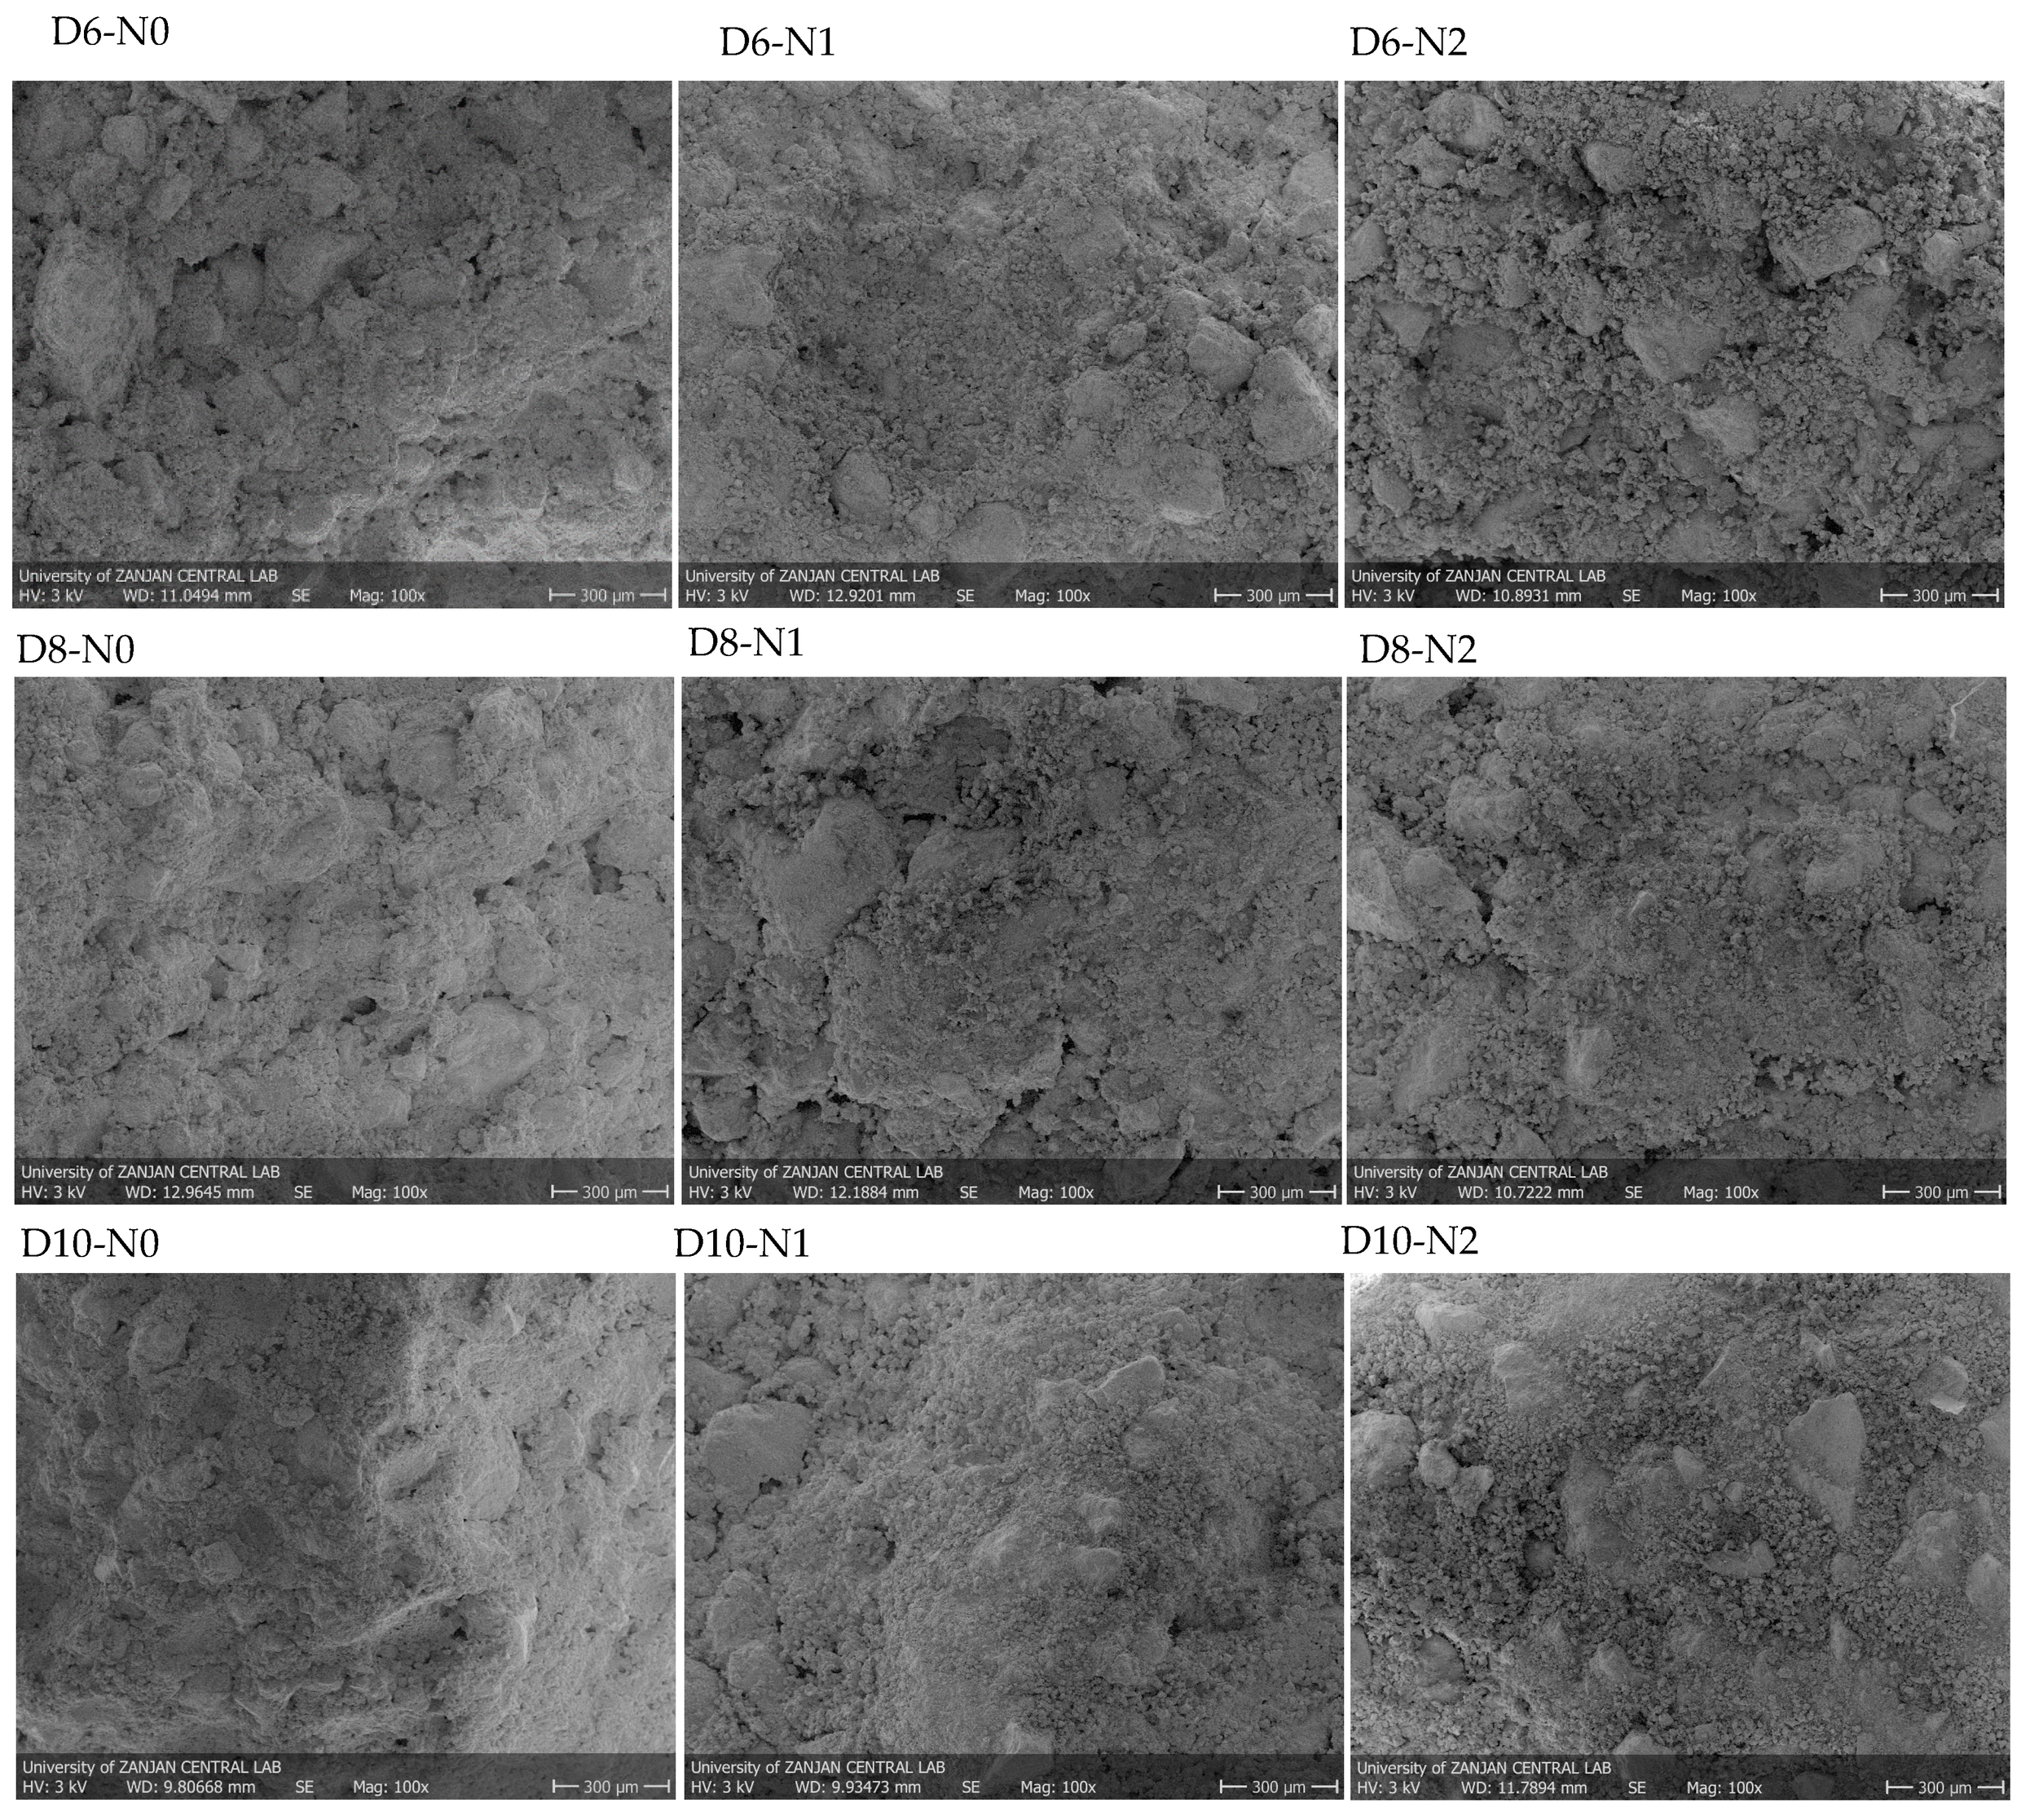
Figure 4 and
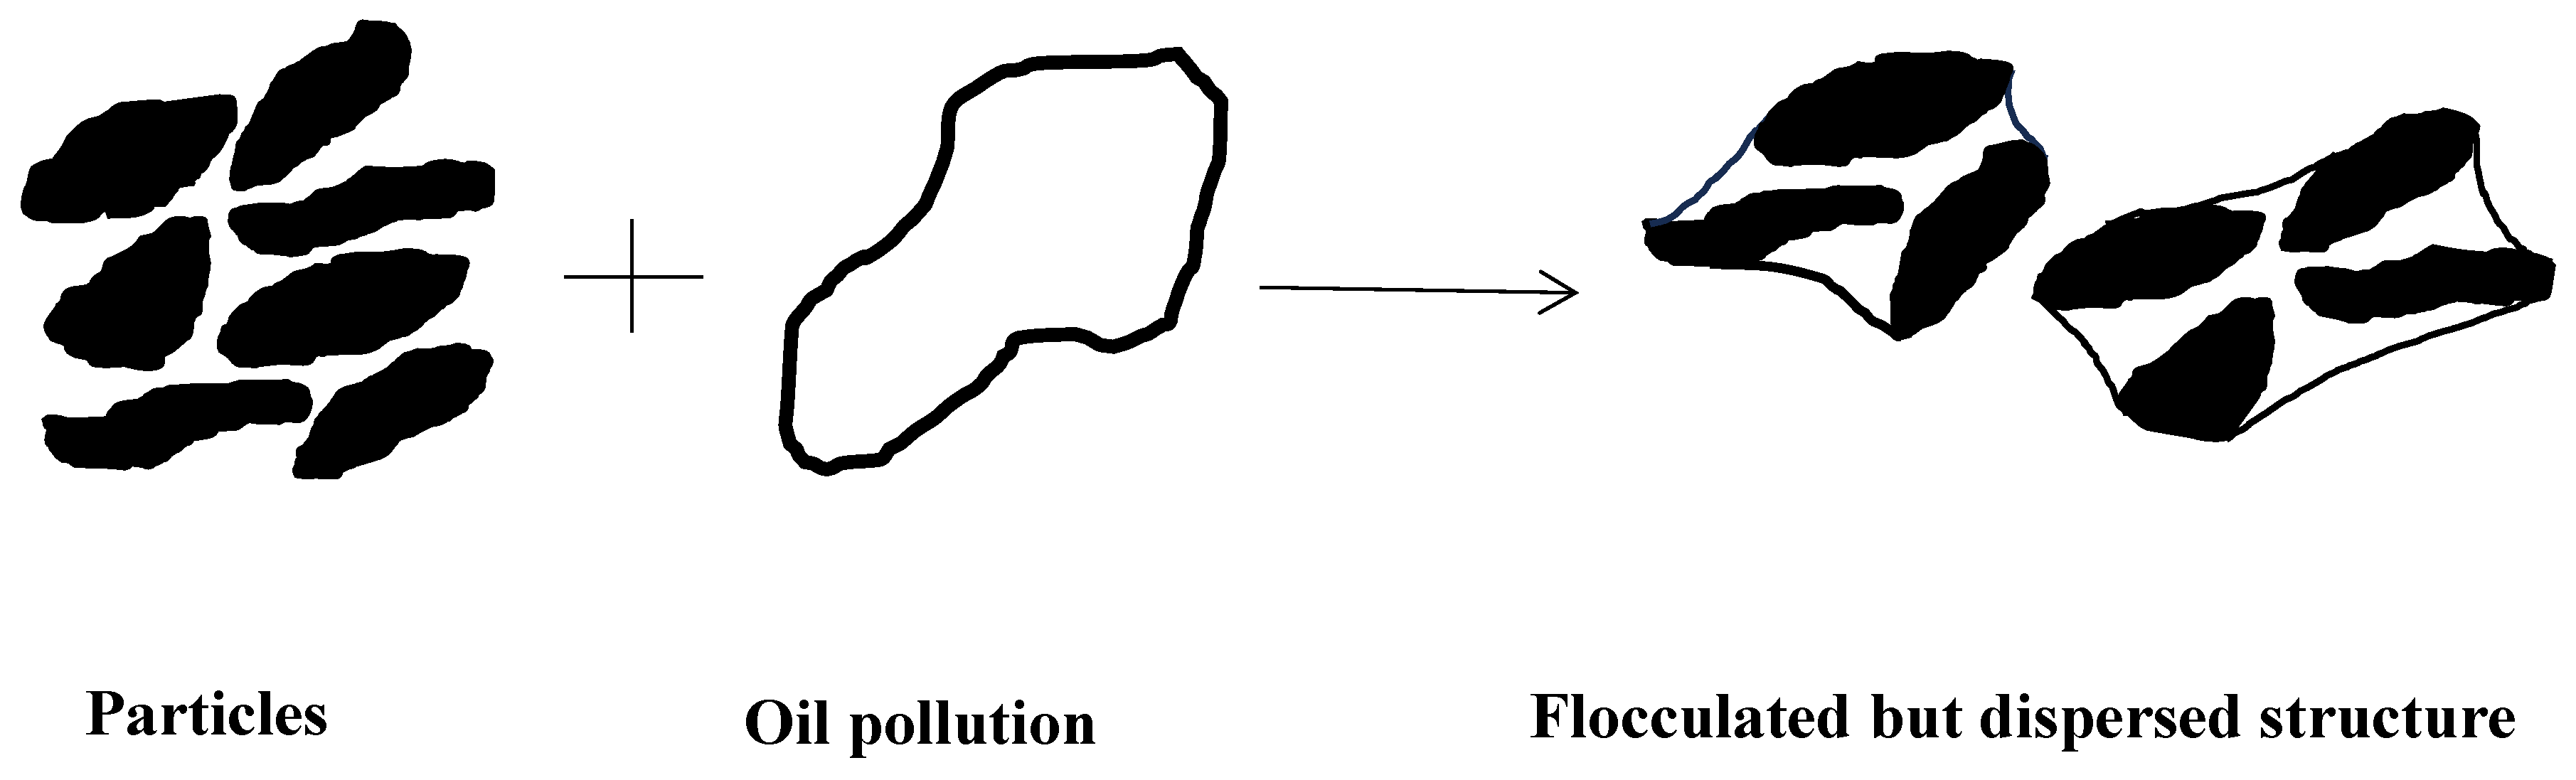
Figure 5, the intergranular voids between the sand particles are occupied by fine clay minerals in the uncontaminated sample (D0-N0). Clay minerals exhibit surface negative charges, generating electromagnetic forces between the particles. A comparison of sample D0-N0 with the diesel-contaminated samples (D2-N0 to D10-N0) reveals that diesel addition induces clay particle flocculation. This behavior is attributed to the net interparticle forces controlling the soil structure [
44]. In the uncontaminated specimens, water, with its high dielectric constant, promotes a dispersed clay structure. In contrast, diesel’s low dielectric constant reduces the thickness of the diffuse double layer surrounding the clay particles, thereby diminishing repulsive forces and enhancing attractive interactions [
45]. The resulting net attraction brings the particles closer together, forming a flocculated fabric, a process consistent with double-layer contraction leading to flocculation [
46,
47]. This mechanism is illustrated schematically in
Figure 6.
Furthermore, the micrographs indicate that the flocculated structure is characterized by larger aggregates and correspondingly larger pores, reflecting a reduction in micropores and an increase in macropores within the contaminated specimens. In such fabrics, the clay aggregates attain dimensions comparable to those of the silt and sand particles. The extent of aggregation correlates directly with the diesel-to-water ratio: as the diesel content increases, the population of flocculated particles increases, thereby amplifying the macroporosity of the contaminated soil.
The SEM observations revealed that adding 1% nanosilica to the diesel-contaminated sand–clay mixture noticeably improved the soil fabric, evidenced by denser particle arrangement, enhanced interparticle bonding, and reduced void spaces. However, when the nanosilica content was increased to 2%, the soil exhibited a reverse behavior, and the microstructure became more dispersed. This degradation in the fabric can be attributed to several mechanisms. At higher concentrations, nanosilica introduces excessive negative surface charge, which increases electrostatic repulsion among the clay particles and promotes dispersion rather than aggregation. Moreover, the formation of thick silica gel coatings around the grains separates the particles instead of bridging them, thereby weakening the interparticle contacts. Excess nanosilica also tends to agglomerate, forming inactive clusters that disrupt the continuity of the soil structure and creating localized weak zones. Additionally, the overfilling of grain-to-grain contact points reduces the effectiveness of particle interlocking and frictional resistance. Consequently, while small amounts of nanosilica enhance the bonding and the fabric quality, excessive addition leads to microstructural deterioration, as clearly observed in the SEM images.
3.2. Influence of Diesel Contamination and Nanosilica on Soil Specific Gravity, Gs
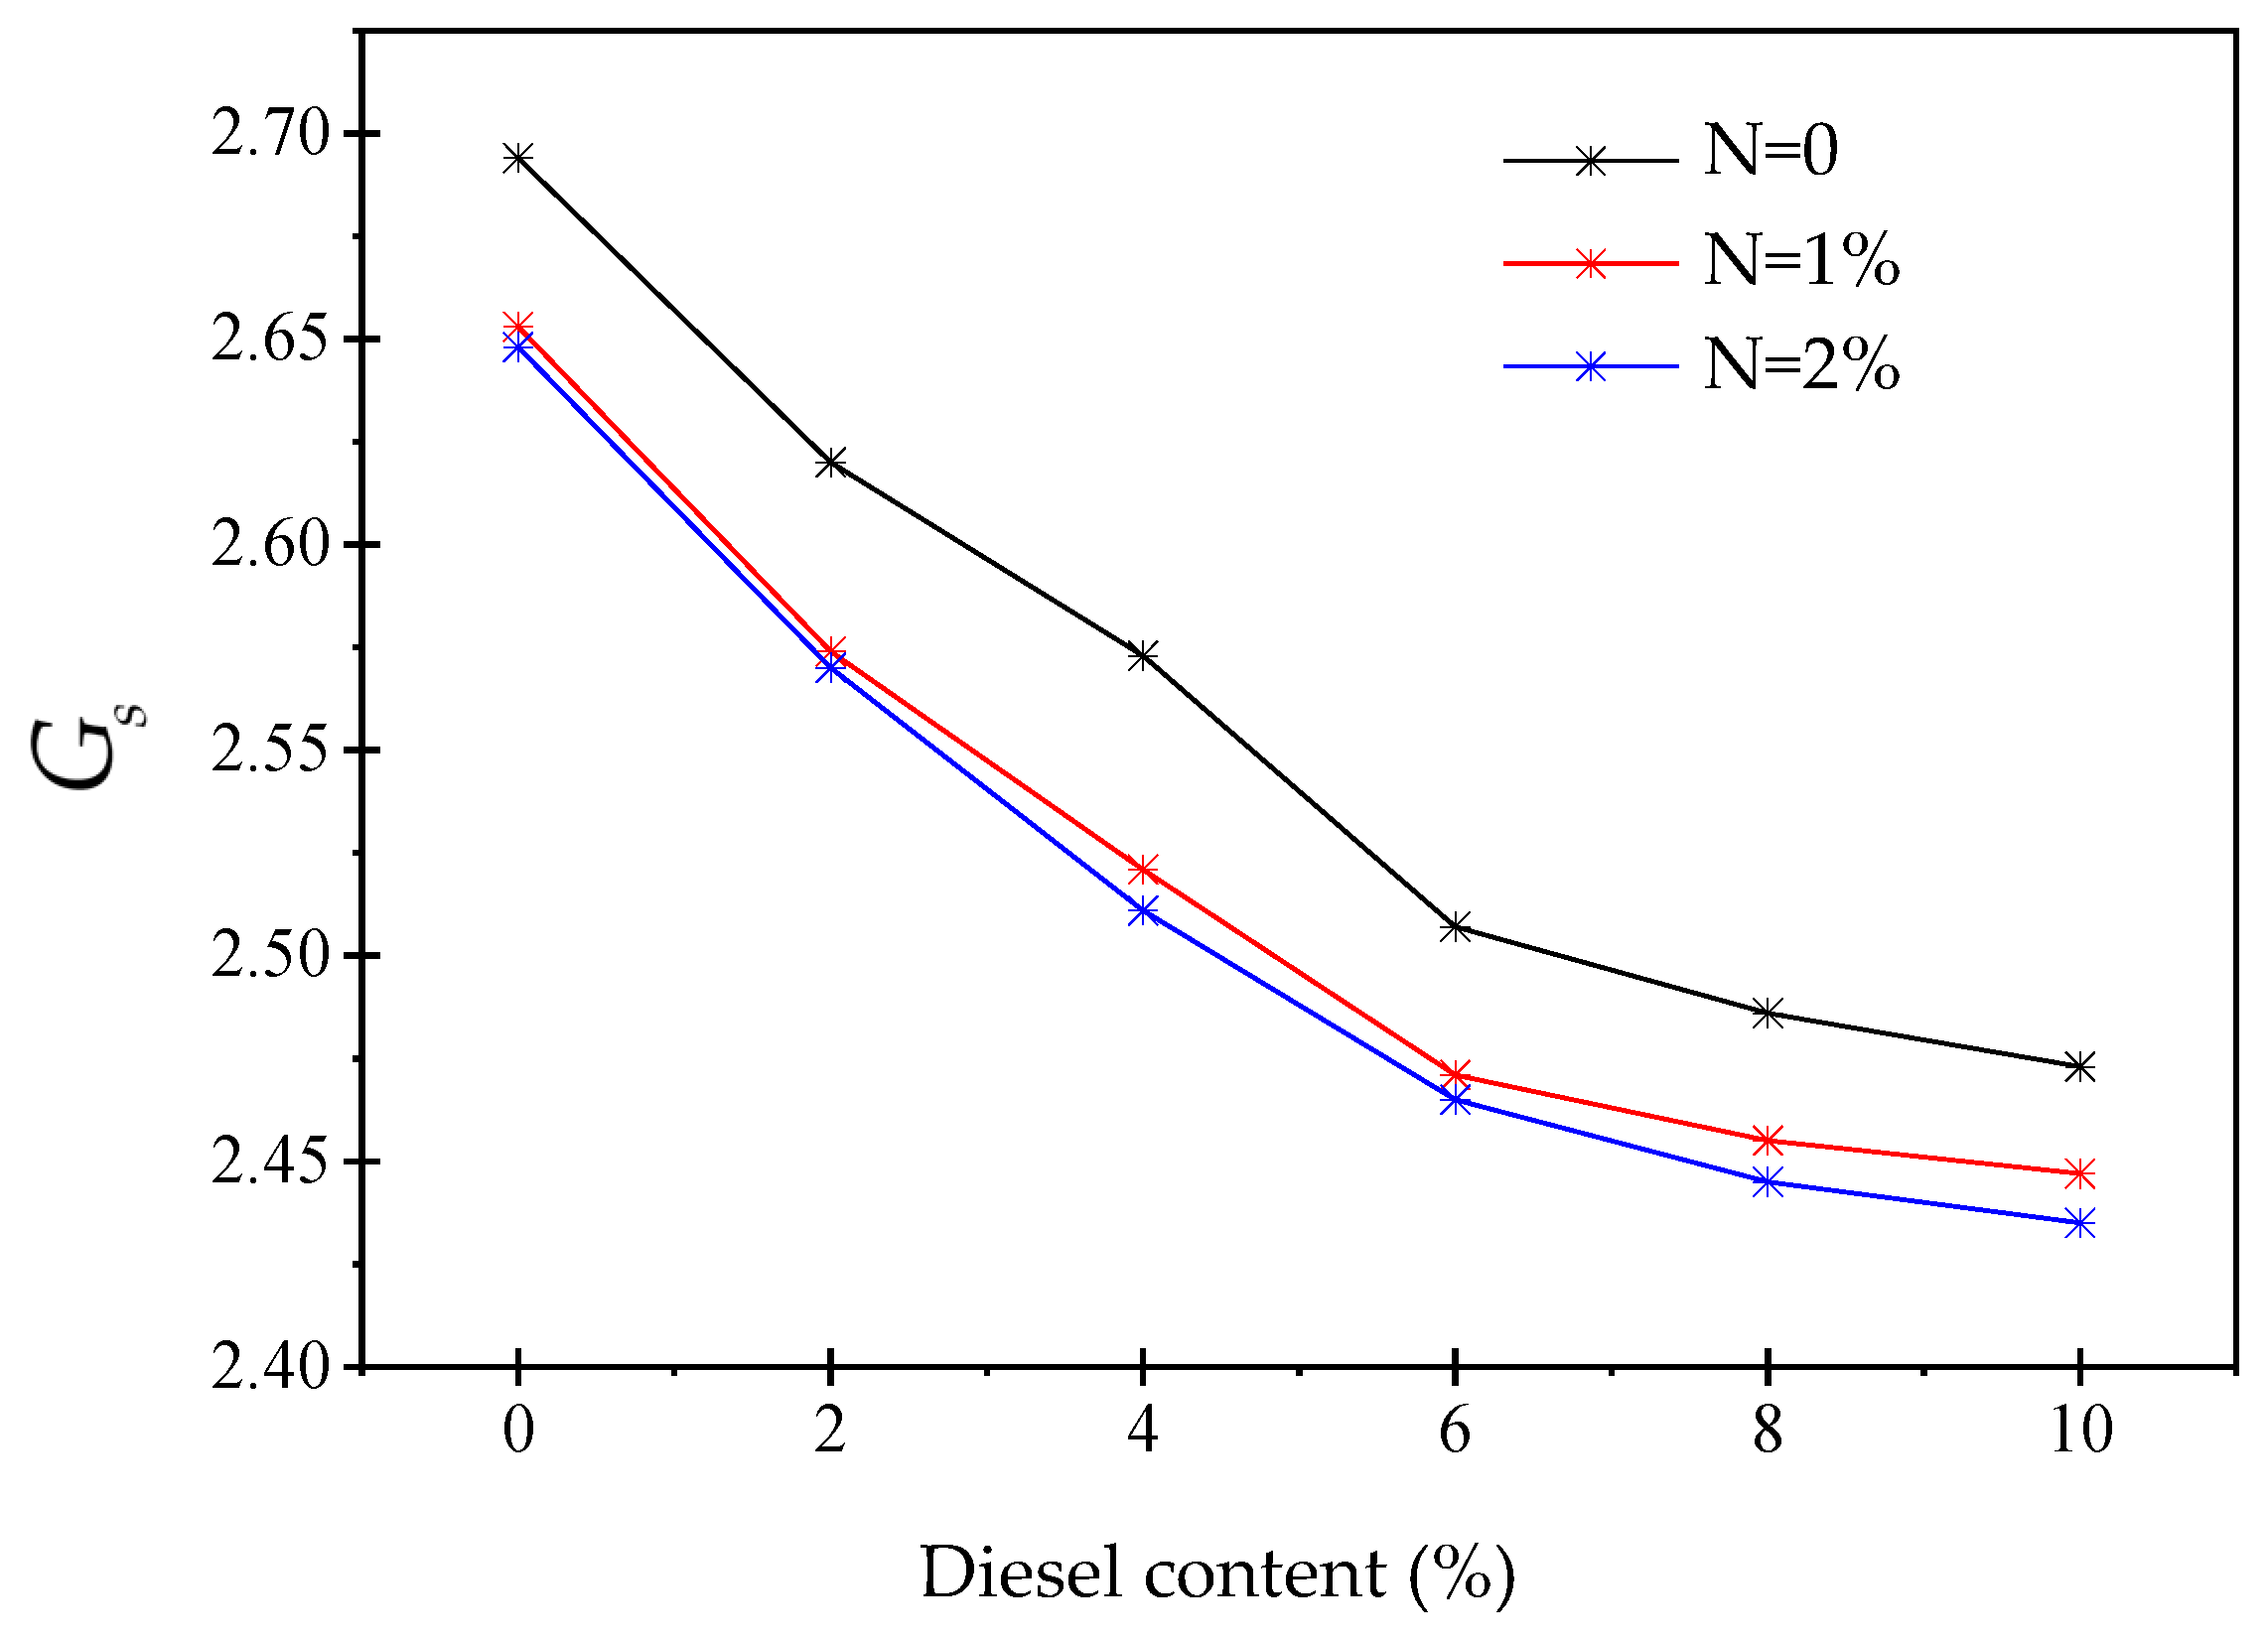
Figure 7 illustrates the impact of diesel contamination on the specific gravity of a sand–clay mixture (60% sand, 40% clay) for three conditions: untreated soil (N = 0), soil treated with 1% nanosilica (N = 1%), and soil treated with 2% nanosilica (N = 2%). A consistent reduction in the specific gravity is observed with increasing diesel content for all the mixtures. This reduction is primarily attributed to the replacement of heavier mineral grains with a lighter hydrocarbon phase, as well as the adsorption of diesel onto the soil particles. This process introduces low-density organic films around the grains and increases micro-voids within the structure. The untreated soil (N = 0) shows the highest specific gravity values across all the contamination levels because no additional fine or reactive material is present to alter the particle interactions. In contrast, the nanosilica-treated soils exhibit a slightly lower specific gravity, with N = 2% showing the lowest values. This slight reduction is explained by the very low density of nanosilica and its strong surface reactivity. These properties enhance the particle coating and increase the proportion of lightweight amorphous silica relative to the minerals in the mixture. The small difference between the 1% and 2% nanosilica curves suggests that beyond a minimal threshold, additional nanosilica contributes marginally to the overall mass volume characteristics, and its influence on the specific gravity becomes secondary to the dominant effect of diesel contamination.
Mekkiyah et al. [
21] reported similar trends in specific gravity to those obtained in the present study. Investigating silty loam and sandy loam soils contaminated with 5%, 10%, and 15% crude oil, they observed that
decreased significantly with increasing contamination. They attributed this reduction to the agglomeration behavior of soil particles, which controls the pore size distribution. They argued that the greater thickness (or viscosity) of crude oil causes the particles to cluster, leading to the formation of larger voids and consequently a decrease in the specific gravity.
3.3. Compaction Characteristics of Diesel-Contaminated Clayey Sand Soil Modified with Nanosilica
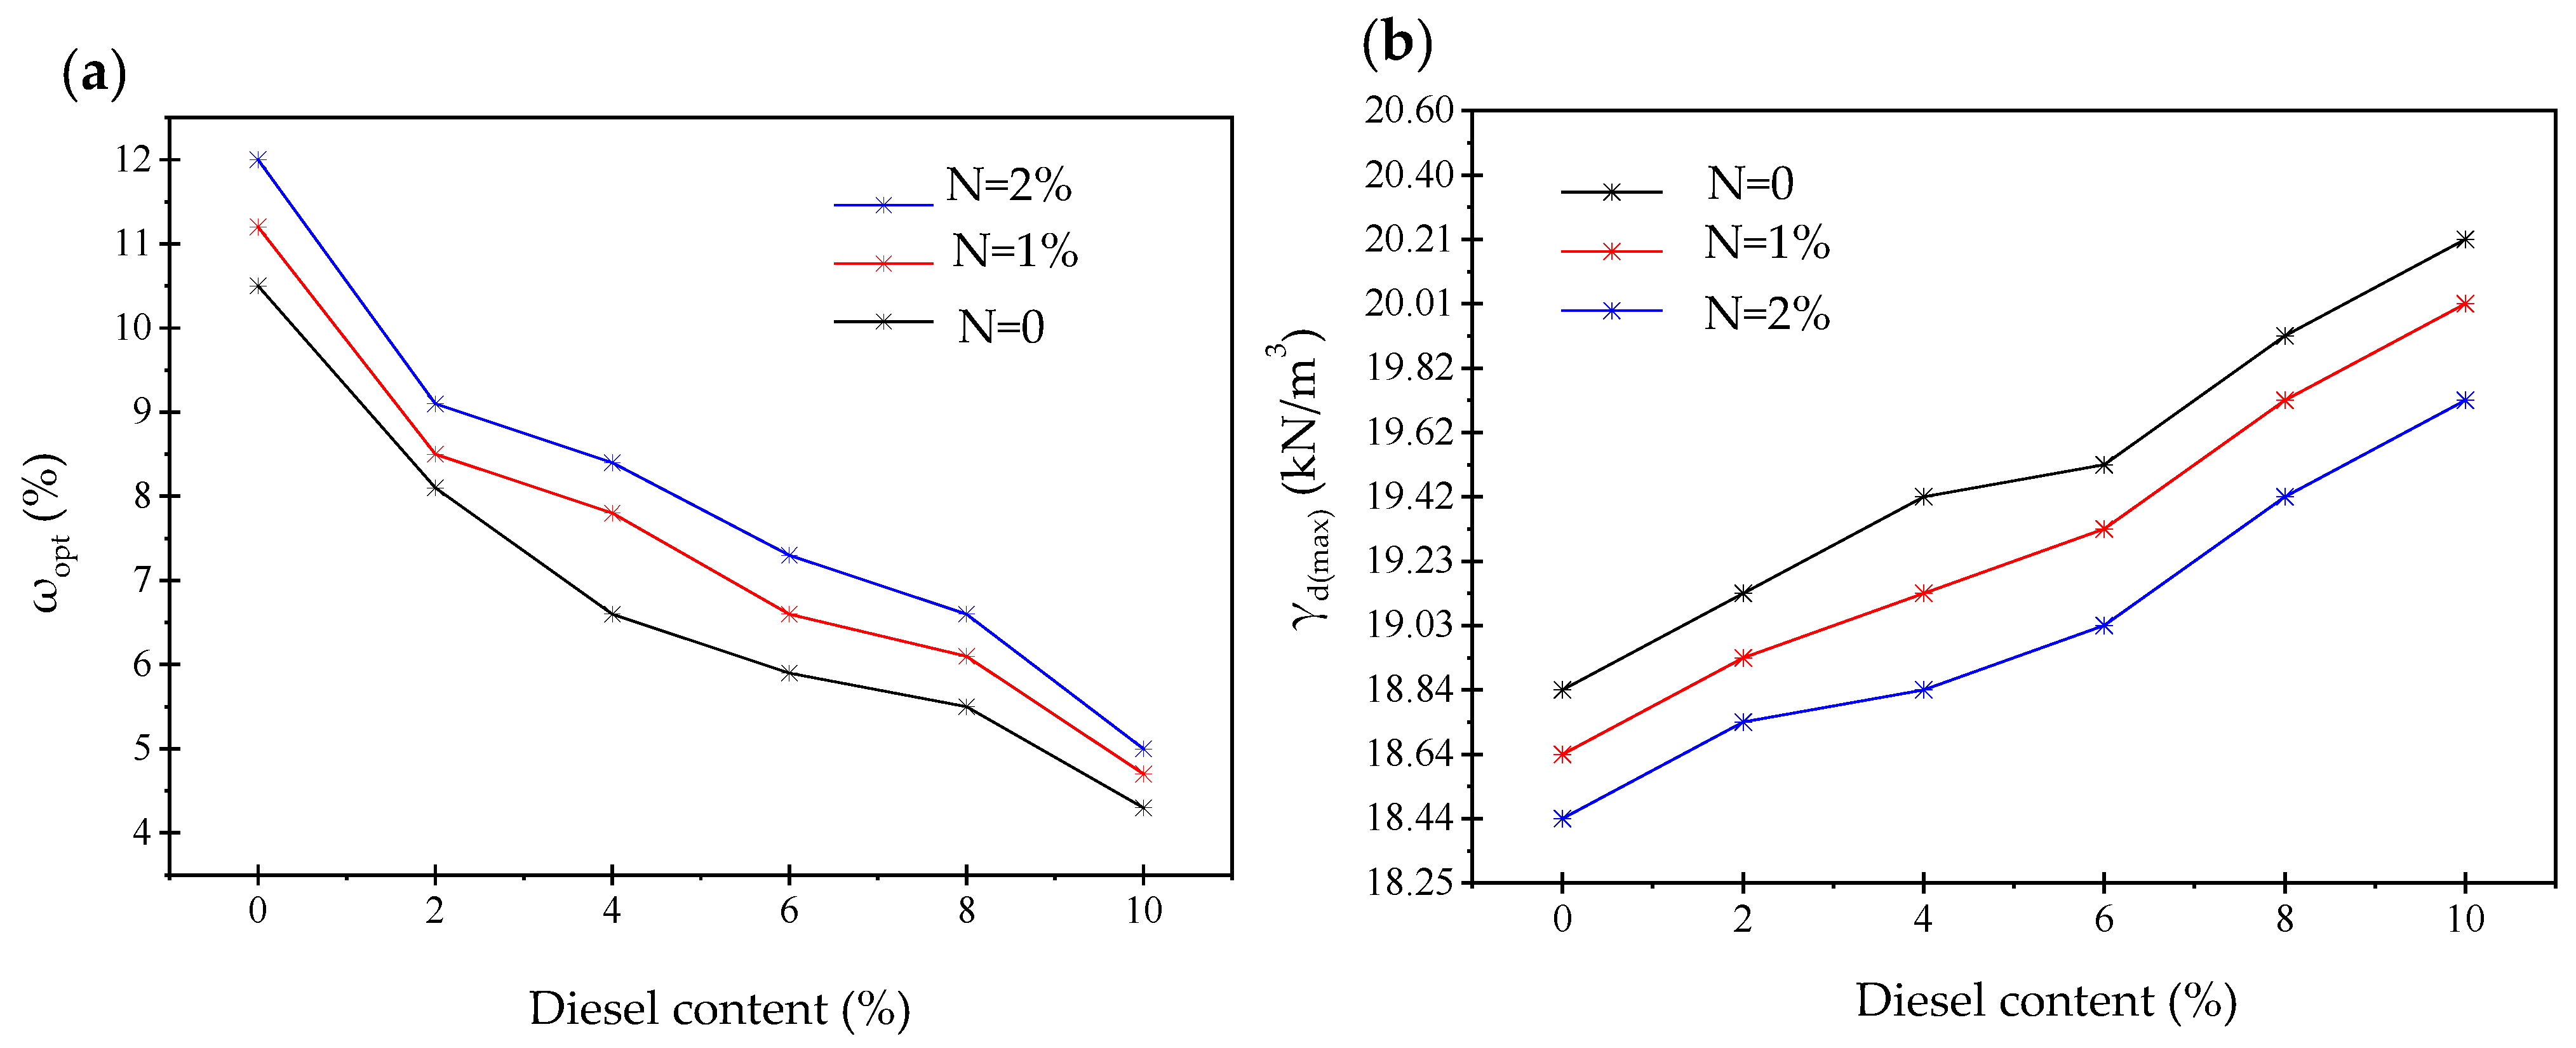
Figure 8 presents the variations in the OMC and the maximum dry unit weight of the sand–clay mixture (60% sand, 40% clay) under different levels of diesel contamination and nanosilica content (0%, 1%, and 2%). As shown in
Figure 8a, the OMC consistently decreases with increasing diesel content for all the mixtures. This trend is attributed to the hydrophobic nature of diesel, which coats soil particles and blocks water adsorption sites, thereby reducing the amount of water required for lubrication and compaction. Additionally, diesel acts as a light, low viscosity fluid that partially replaces water in filling micro-voids, further lowering the OMC. The curves indicate that the samples containing nanosilica (N = 1% and N = 2%) require a slightly higher optimum moisture compared with the untreated soil, particularly at lower contamination levels. This is explained by the high surface reactivity and hydrophilicity of the nanosilica particles, which increase the water demand through adsorption and the formation of flocculated microstructures. The higher OMC in N = 2% relative to N = 1% suggests that increasing the nanosilica leads to an increased surface area requiring moisture, though the difference diminishes at high diesel contents where hydrophobic effects dominate.
The experimental results demonstrate a non-intuitive relationship between diesel contamination and compaction behavior. As shown in
Figure 8b, the maximum dry unit weight
increases with the diesel content. This appears contradictory, given the measured decrease in the specific gravity of solids
with diesel addition, a factor which, in isolation, would theoretically lower
. The observed increase is attributed to the dominant role of diesel as a lubricant, which reduces interparticle friction and capillary forces. This lubrication facilitates a more efficient particle rearrangement under compactive effort, leading to a denser packing state that outweighs the effect of the reduced
.
In contrast, the introduction of nanosilica exhibits an opposing effect. The untreated soil (N = 0) consistently yields the highest values. The samples amended with nanosilica, particularly at 2% (N = 2%), show a clear reduction in the maximum dry unit weight. This is likely due to the nanosilica-induced micro-aggregation of the clay particles and the consequent increase in microscale internal friction. These effects slightly impede optimal particle reorientation during compaction. The marginal differences between the 1% and 2% nanosilica curves suggest that beyond a certain threshold, additional nanosilica has a negligible impact on the compaction characteristics, especially within a diesel-contaminated matrix.
Al-Aghbari et al. [
48] reported similar findings regarding the influence of contamination on the maximum dry unit weight and the OMC. In their study on sand mixed with 0%, 5%, and 10% gasoline and diesel, they observed that the OMC decreased with increasing contaminant content. Conversely, the maximum dry unit weight increased as the level of contamination increased.
3.4. Effects of Diesel Contamination and Nanosilica on Atterberg Limits
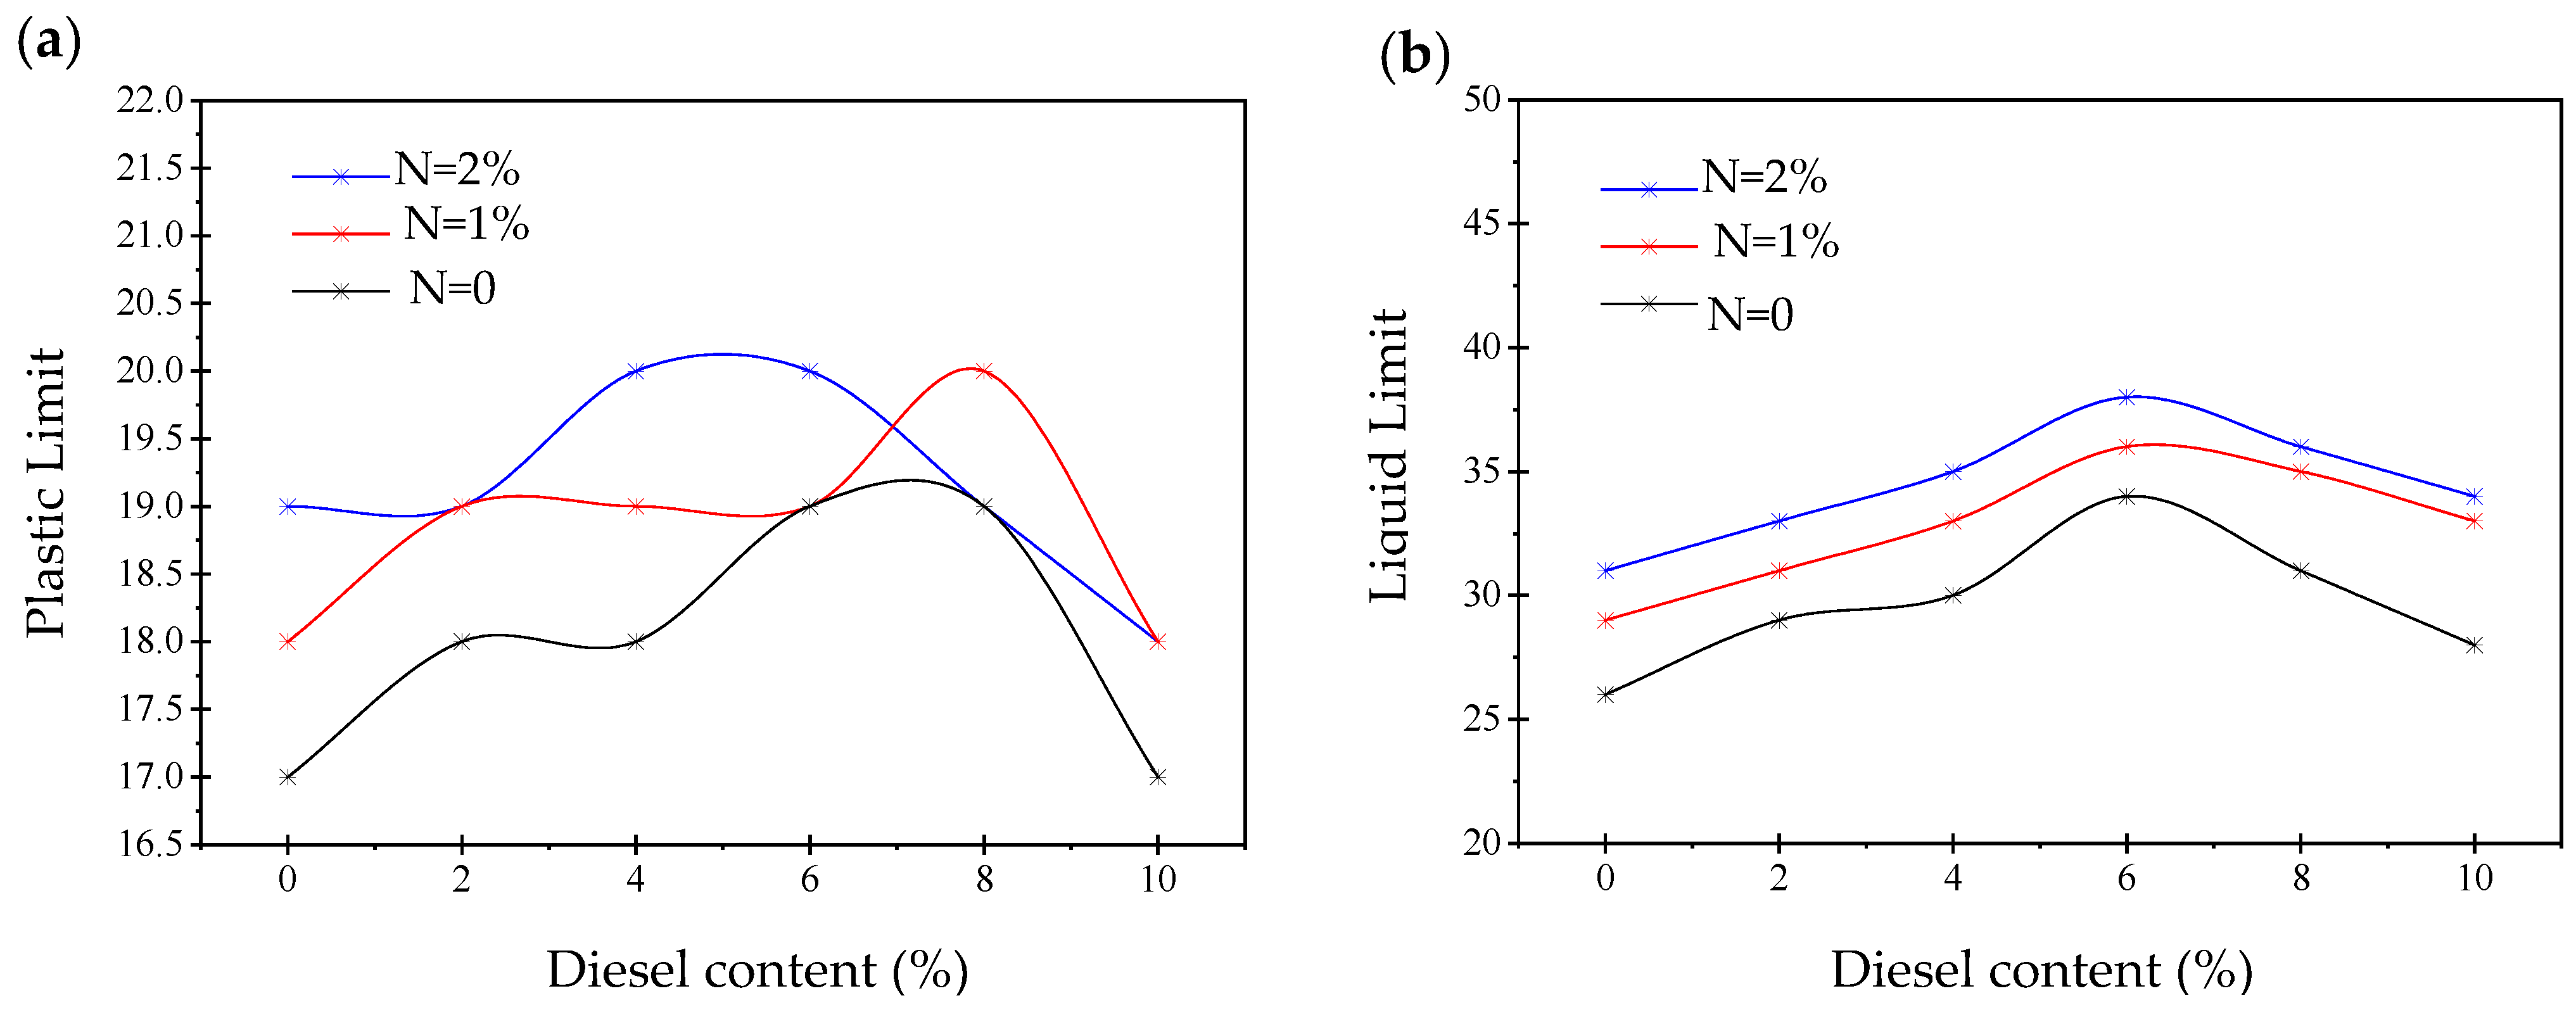
Figure 9 shows the variations in the plastic limit (PL) and the liquid limit (LL) of the 60% sand–40% kaolinitic clay mixtures as a function of diesel contamination for three nanosilica contents (0%, 1% and 2%). Two consistent features emerge from the data. First, the LL exhibits a non-monotonic response to increasing diesel content, increasing up to a moderate contamination level (around 6%) and then slightly decreasing at higher diesel contents. Second, the samples containing nanosilica (N = 1% and N = 2%) generally show higher LL values than the untreated soil (N = 0), with the 2% nanosilica samples giving the largest LL throughout most of the contamination range. The PL data show a similar but less pronounced pattern, with the peaks shifted slightly depending on the nanosilica content.
These observations can be rationalized by the competing interparticle and surface adsorption effects introduced by diesel and nanosilica. At low to moderate diesel content, the hydrocarbon occupies the micro-voids within the soil. It also acts as a lubricating film, promoting particle rearrangement. This increases the amount of water required to reach the liquid state. Consequently, an initial increase in the liquid limit (LL) is observed. As the diesel content continues to increase, hydrophobic molecules progressively coat the particle surfaces. This coating reduces the availability of the adsorbed water films. It also diminishes the clay–water interactions. Consequently, both the liquid limit (LL) and the plastic limit (PL) tend to decrease at high contamination levels. The present result aligns with the findings of Mustafa et al. [
49], who examined marl samples (classified as SC under the Unified Soil Classification System) from eastern Saudi Arabia contaminated with diesel fuel. They reported that the liquid limit increased with rising contamination levels up to 9%, after which further increases in contamination led to a reduction in the liquid limit.
Nanosilica modifies these trends through two main mechanisms. First, it increases the effective surface area and introduces additional hydrophilic adsorption sites. The high specific surface of nanosilica adsorbs more water. Second, it promotes flocculation and bridging between the clay and silt particles. As a result, both the liquid limit (LL) and the plastic limit (PL) increase compared to the untreated samples. The slightly larger effect observed for 2% nanosilica, compared to 1%, reflects its greater available surface area and higher water retention capacity. However, the N = 1% and N = 2% curves are similar in some contamination ranges. This similarity indicates that beyond a modest dosage, the incremental effect on Atterberg limits becomes limited. This is especially true when the dominant influence of diesel-induced hydrophobicity prevails.
3.5. Effects of Diesel Contamination and Nanosilica on Permeability
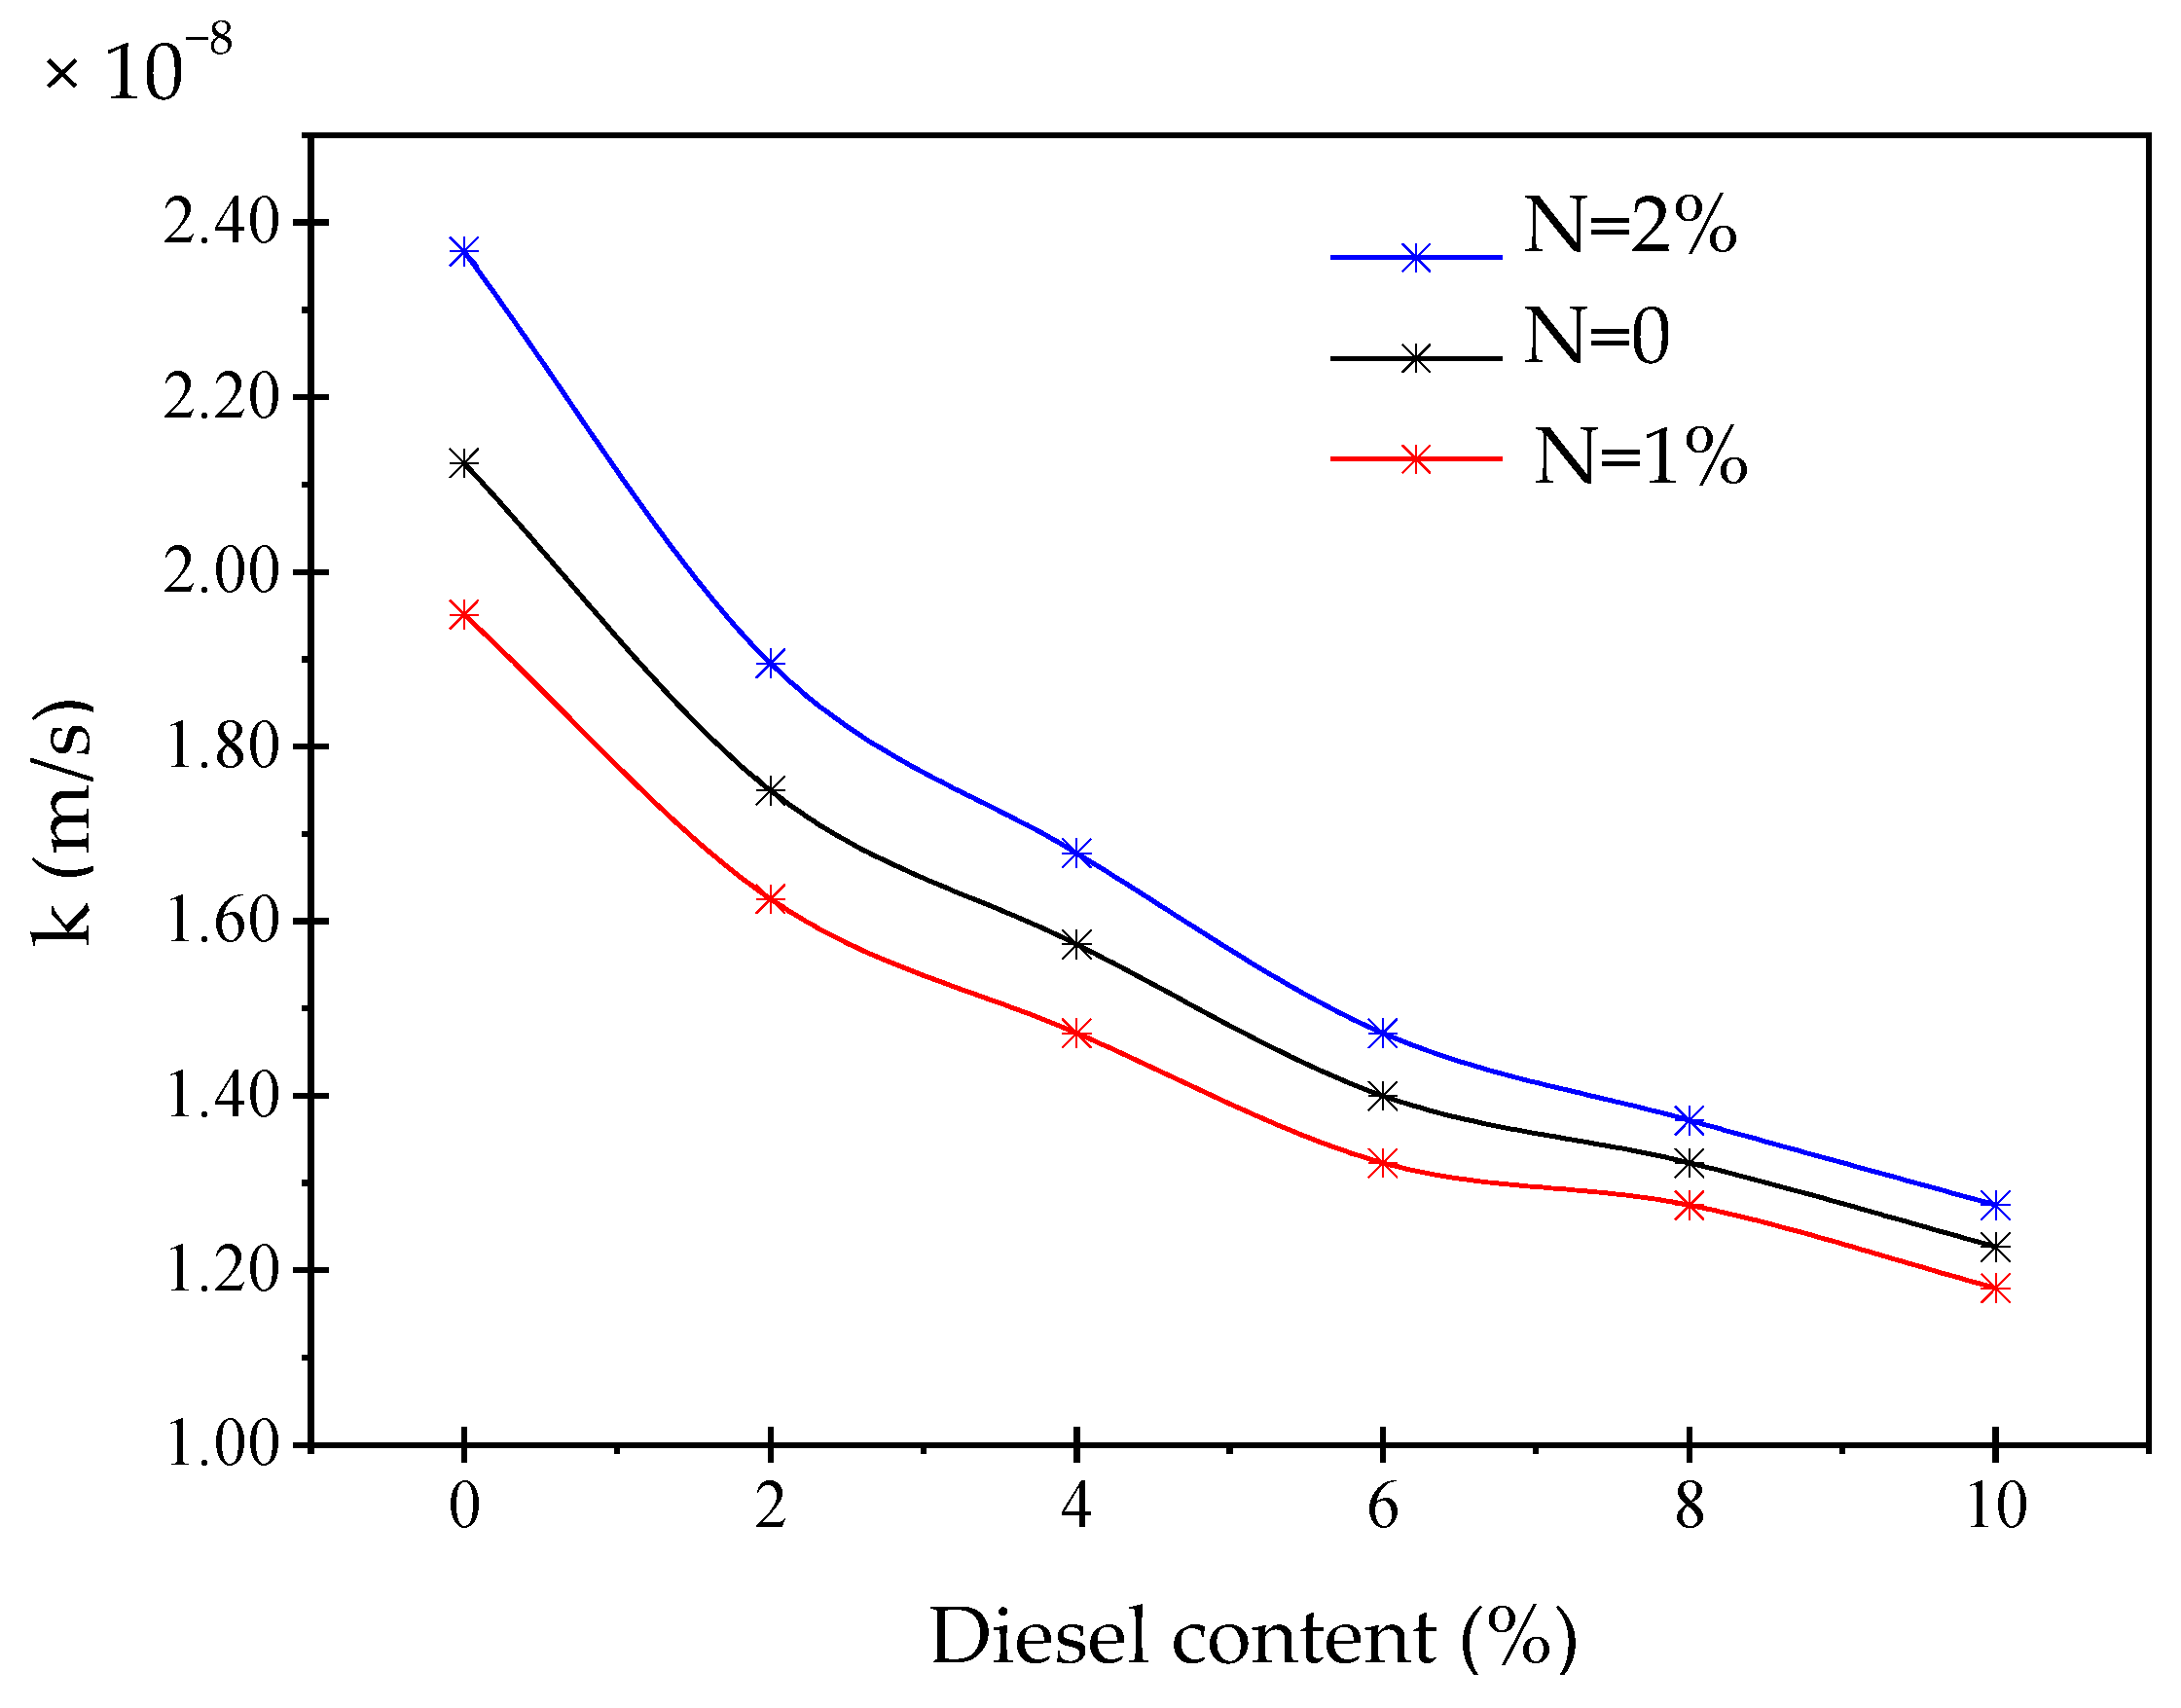
Figure 10 presents the relationship between the permeability coefficient and diesel contamination. The results indicate a consistent decrease in permeability as the diesel content increases. The reduction in permeability with increasing diesel content results from several synergistic mechanisms. First, diesel molecules, being hydrophobic, coat the soil particle surfaces and fill the micro-voids, thereby blocking the pore channels and directly reducing the effective flow area. Second, although diesel-induced flocculation promotes the formation of larger clay aggregates, the pore connectivity is severely disrupted by the hydrophobic hydrocarbon films that act as barriers between the pores. Additionally, diesel contamination reduces the thickness of the adsorbed water films around the clay particles, which further contributes to pore constriction. Third, the higher dynamic viscosity of diesel compared to water (approximately 3–4 times greater) reduces the hydraulic conductivity according to Darcy’s law. Consequently, despite the formation of larger aggregates through flocculation, the combined effects of pore blockage, disrupted hydraulic connectivity, reduced water film thickness, and increased viscosity outweigh any permeability increase that might otherwise result from aggregate formation. Thus, the hydraulic conductivity decreases with increasing diesel content.
The effect of nanosilica produces noticeable differences among the three curves. The 2% nanosilica samples consistently exhibit the highest permeability values, whereas the 1% nanosilica samples show the lowest permeability throughout the contamination range. This behavior can be explained by the dual microstructural role of nanosilica: at moderate contents (N = 1%), nanosilica particles disperse into the clay matrix and increase the specific surface area, promoting flocculation and reducing pore connectivity. This consequently lowers permeability. However, at higher contents (N = 2%), the agglomeration of nanosilica particles becomes more significant. These agglomerates create localized micro-voids and prevent complete clogging of the pore channels by the diesel–clay clusters, resulting in a slightly higher permeability relative to the 0% and 1% nanosilica mixtures.
Similar to the findings of the present study regarding the effect of contamination on permeability, Al-Sanad et al. [
8] reported that the permeability of Kuwaiti sand decreases with increasing oil contamination. Likewise, Al-Aghbari et al. [
48] observed a reduction in permeability in sand specimens mixed with 0%, 5%, and 10% gasoline and diesel, indicating that the hydraulic conductivity declines as the contaminant content increases. Azam et al. [
50] also observed that, in a study on silty clayey soil, permeability generally decreases with increasing oil contamination.
3.6. Effects of Diesel Contamination and Nanosilica on Consolidation Properties of Soil
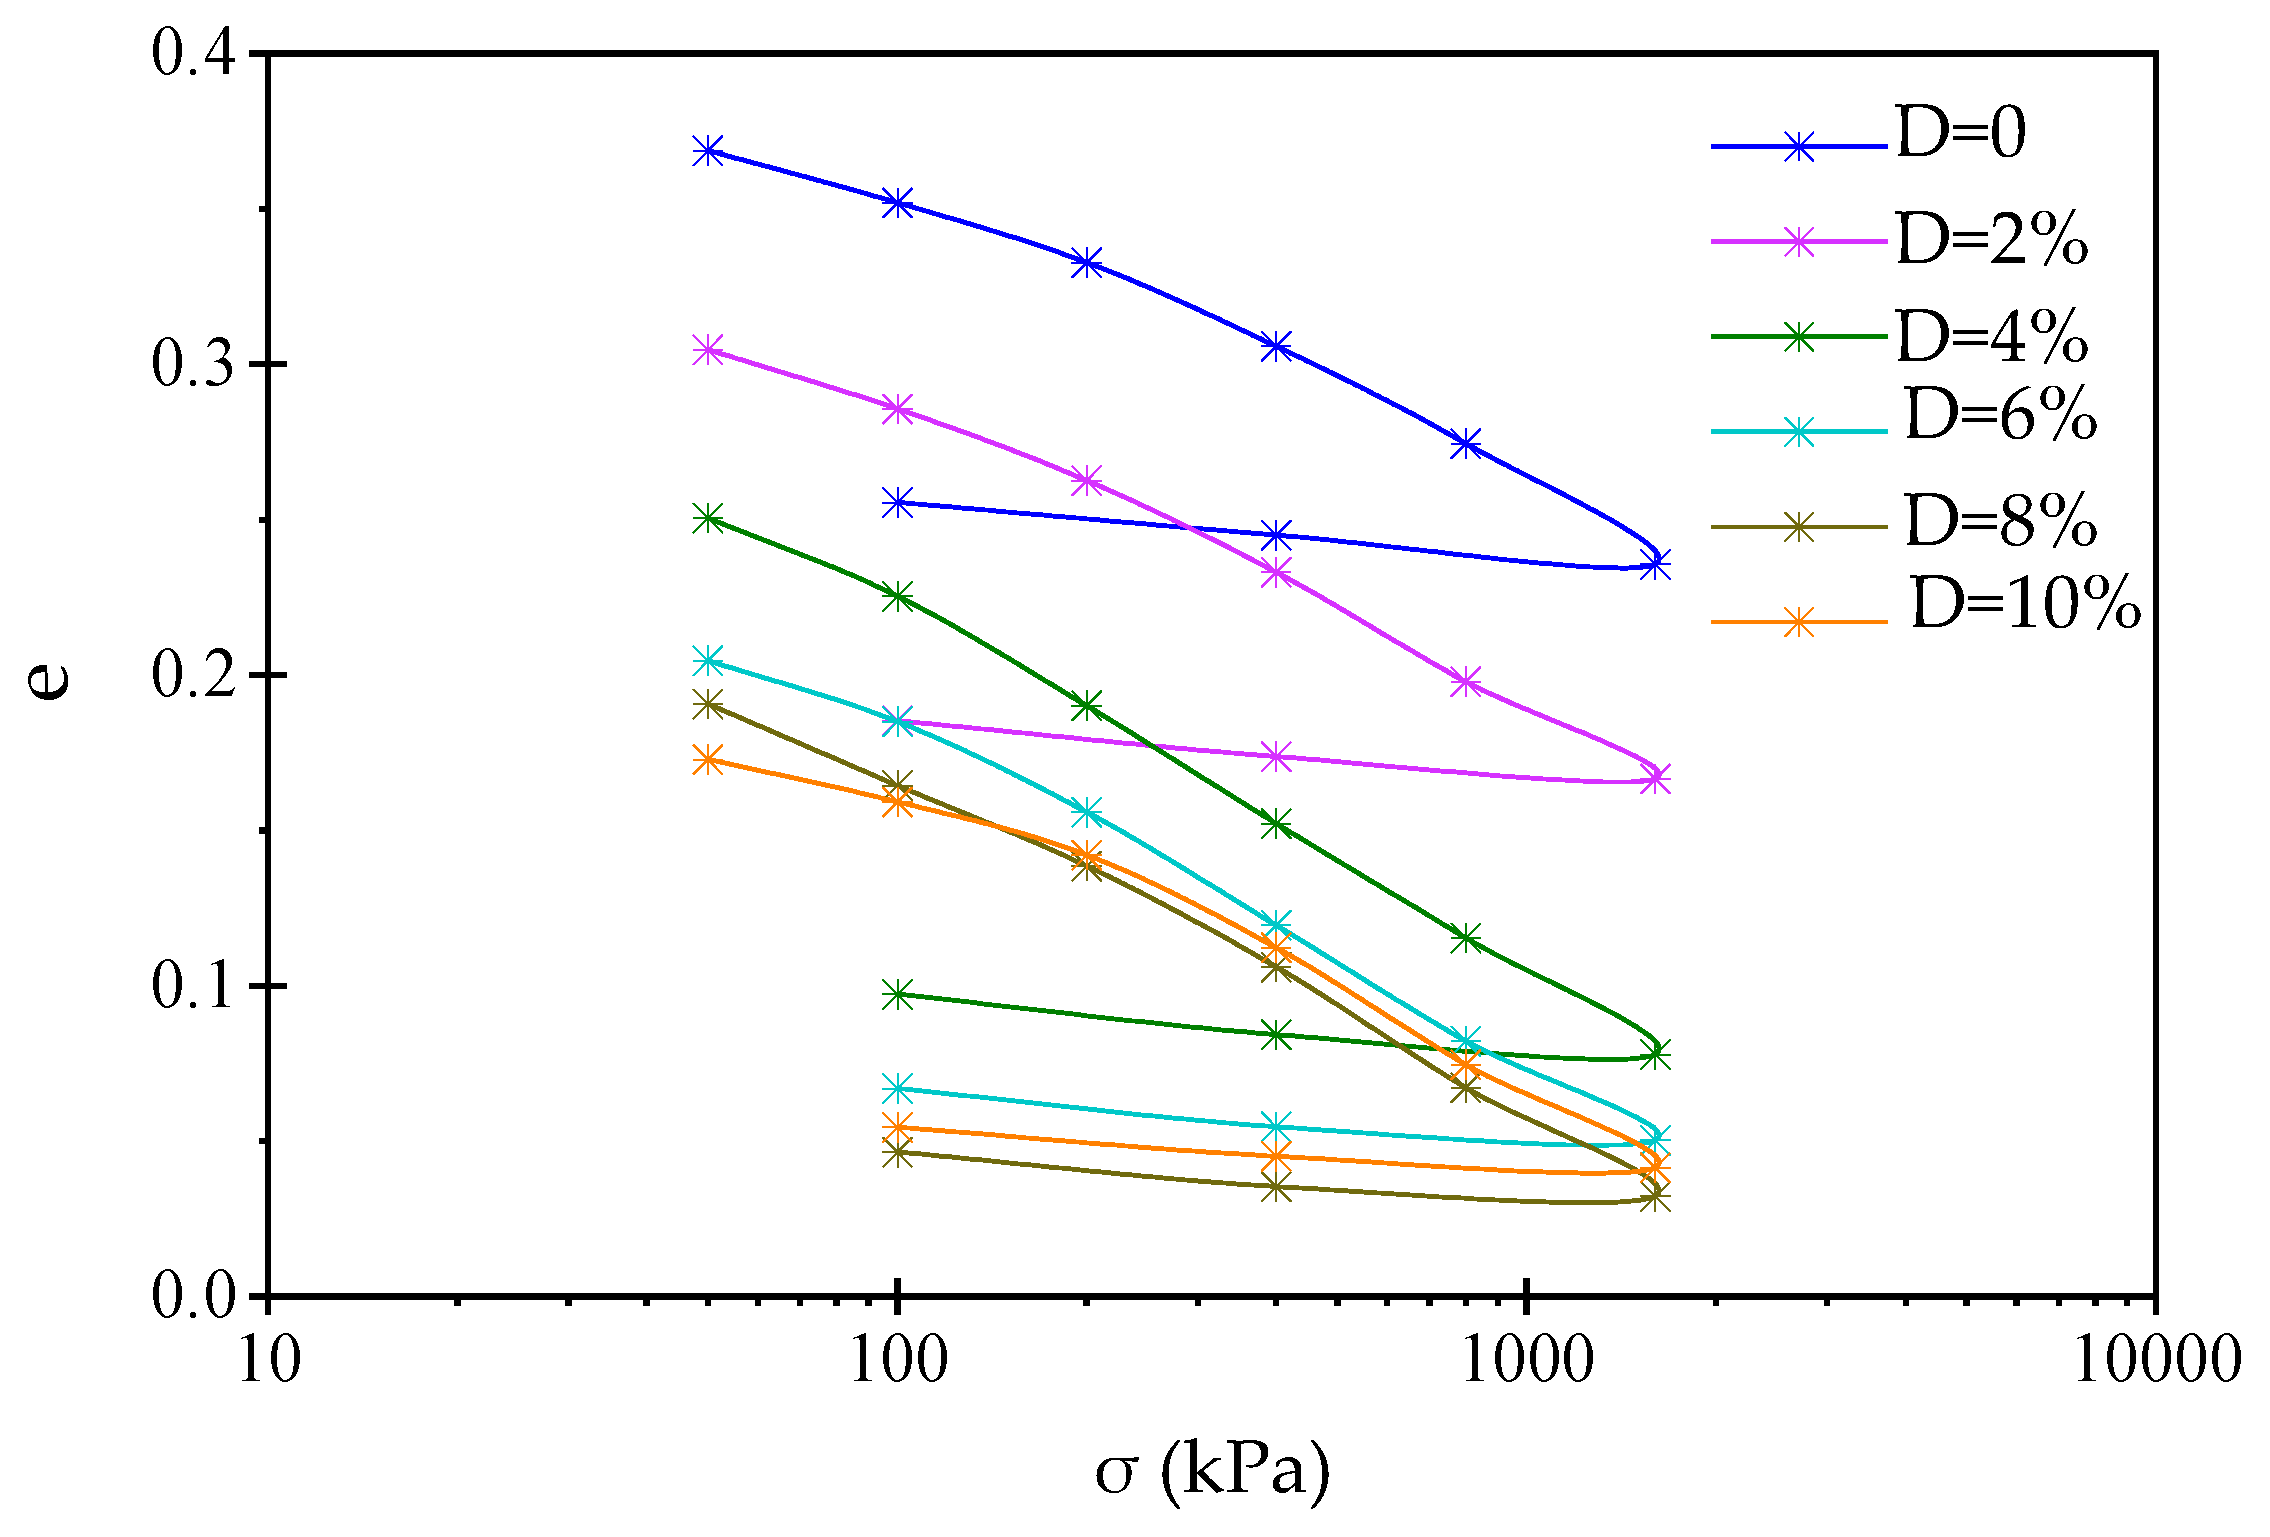
Figure 11 illustrates the effect of diesel contamination on the e–logσ consolidation curves of the sand–kaolinite mixture compacted at the optimum moisture content. As the diesel content increases from 0% to 8%, the consolidation curves shift downward and become progressively closer. This downward shift indicates a systematic reduction in the initial void ratio and the compressibility of the soil.
The downward movement of the curves can be attributed to the replacement of the pore water by diesel, which reduces the thickness of the diffuse double layer and weakens the interparticle repulsive forces. In addition, diesel acts as a lubricating agent at low to moderate contents, facilitating particle rearrangement during compaction and resulting in a denser soil fabric prior to loading. Consequently, lower void ratios are observed throughout the stress range. At higher contamination levels, however, a competing mechanism becomes dominant. When the diesel content reaches 10%, excessive hydrocarbon occupies the pore spaces and increases the viscosity of the pore fluid. This impedes effective pore pressure dissipation and restricts further particle rearrangement under load. As a result, the 10% diesel specimen exhibits slightly higher void ratios than the 8% specimen. This behavior reflects a transition from a lubrication-controlled regime at moderate diesel contents to a pore-blocking and viscosity-controlled regime at higher contamination levels.
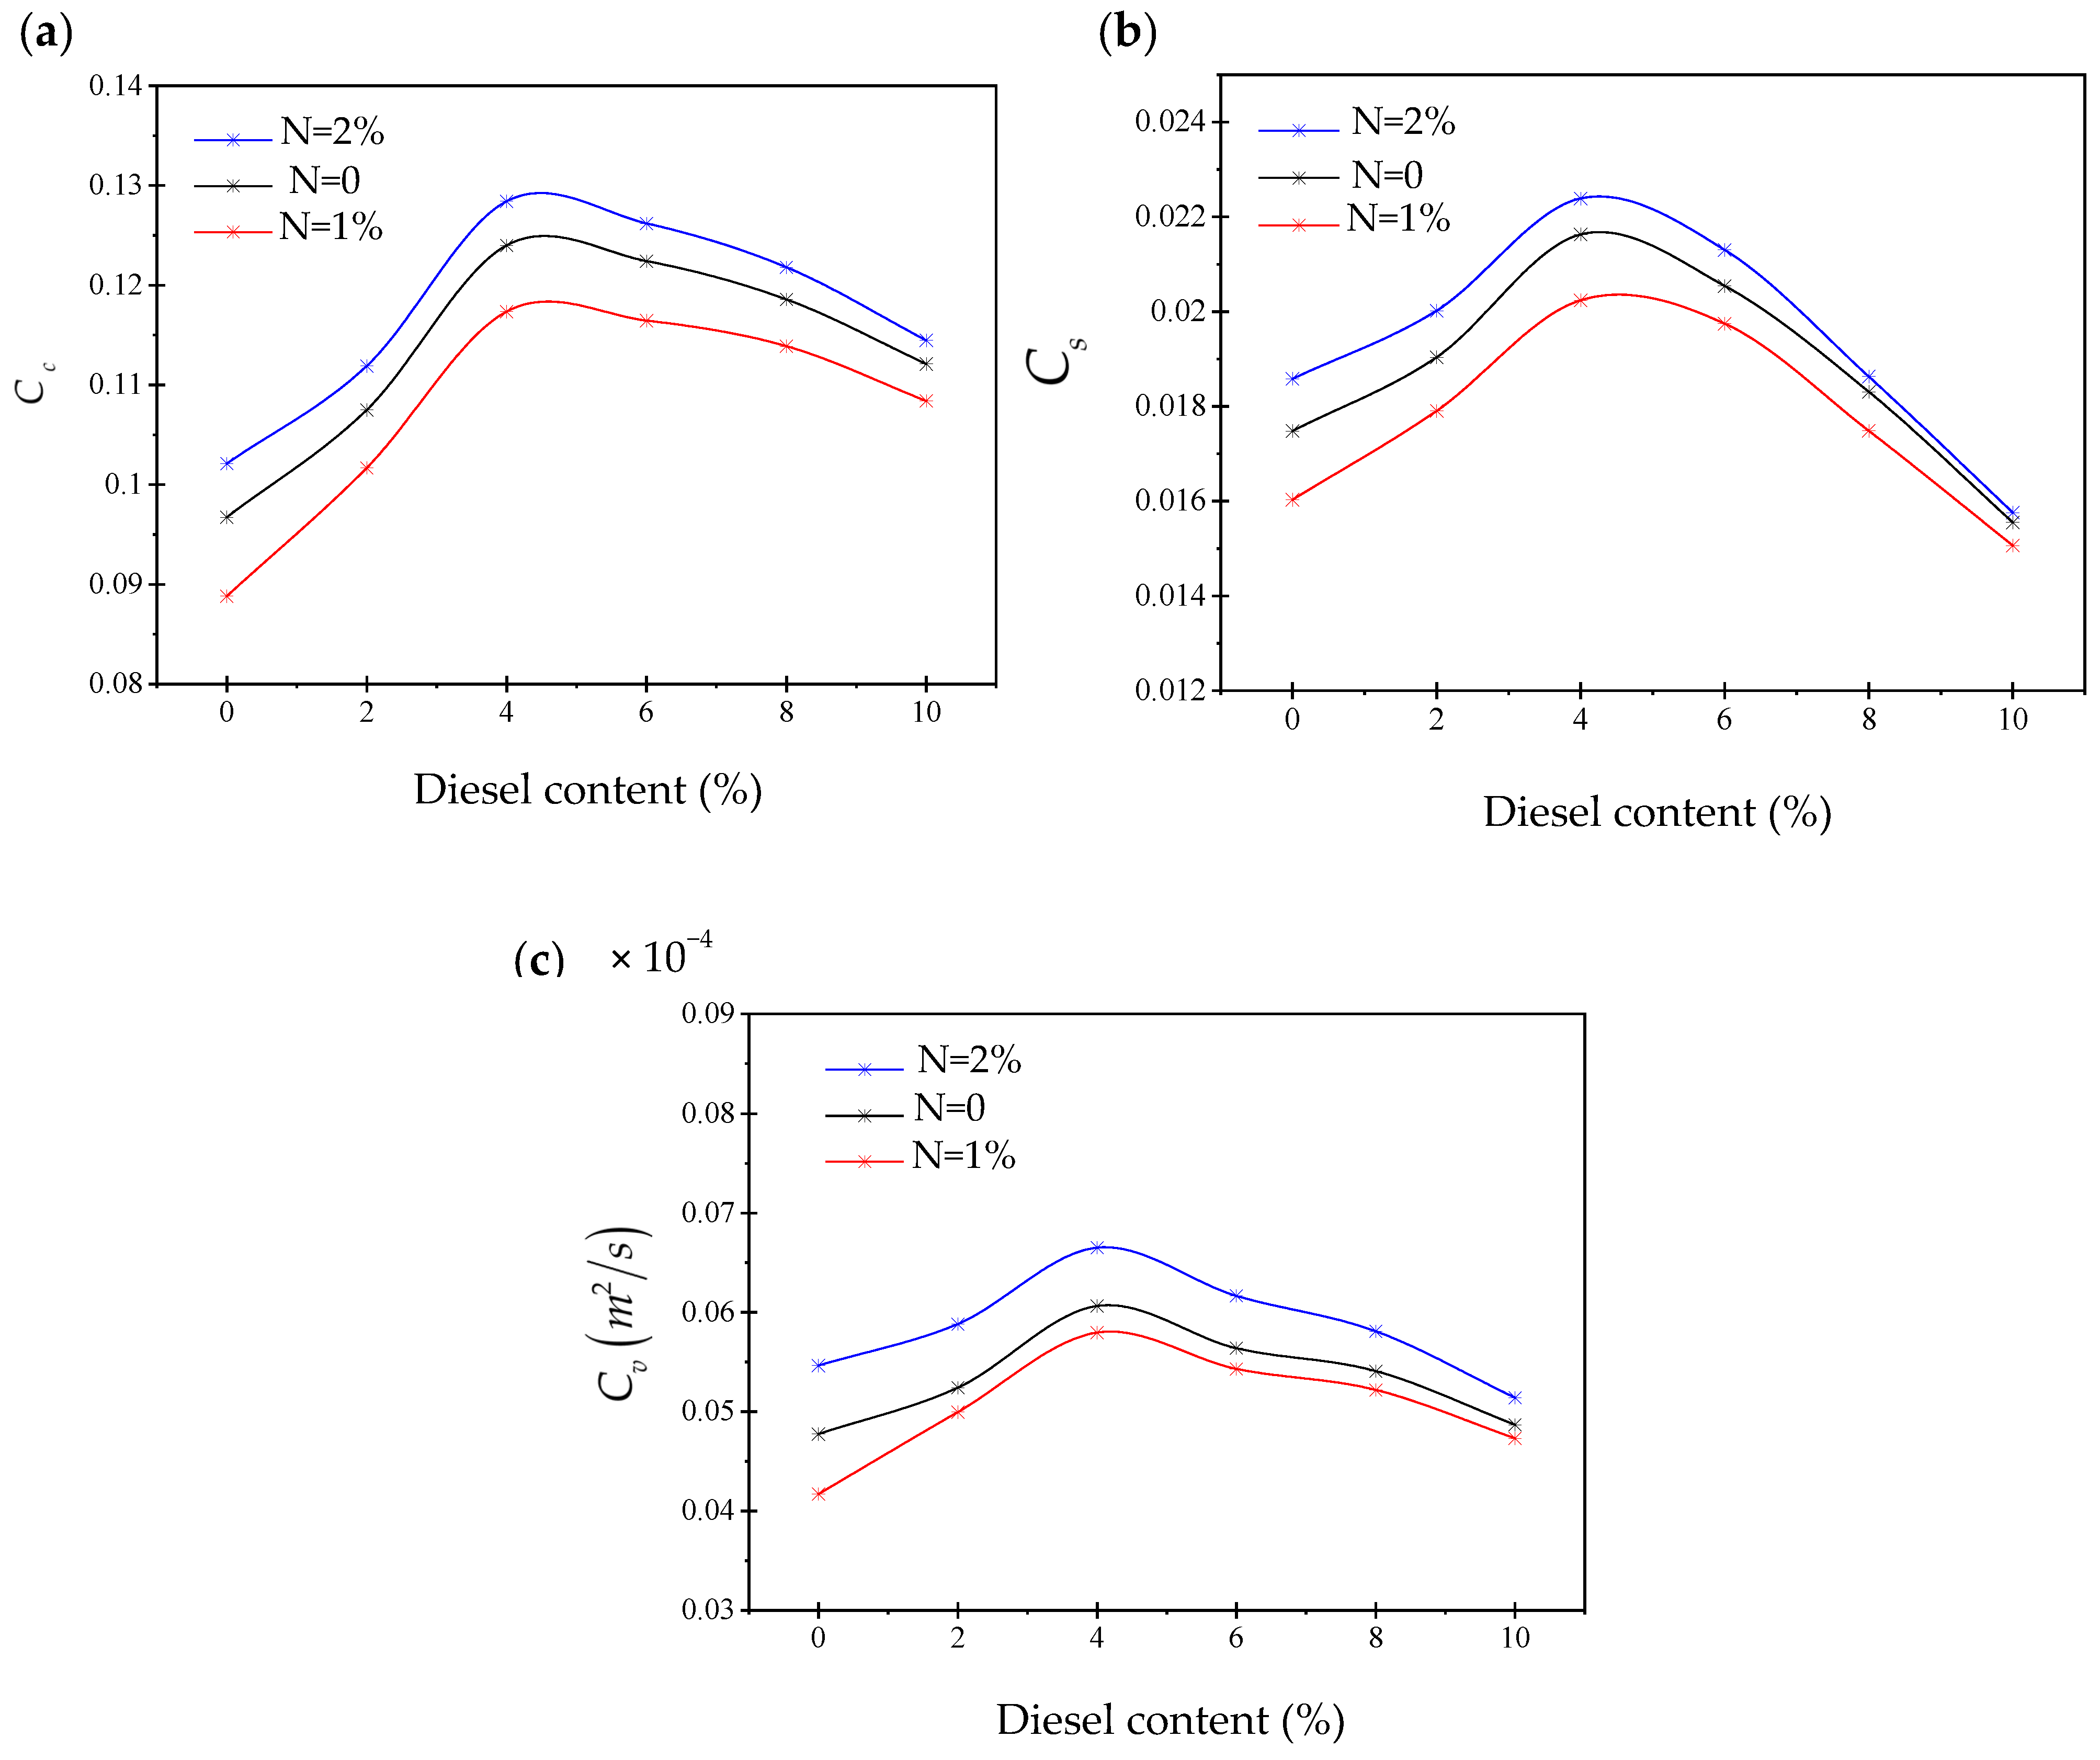
The non-monotonic variation of the compression index
, swell index
, and coefficient of consolidation
versus diesel contamination can be attributed to competing physicochemical mechanisms. These mechanisms govern the soil structure and the pore fluid behavior, as shown in
Figure 12.
At low diesel contents, the hydrocarbon forms a thin coating on the soil particles, reducing interparticle repulsive forces and enhancing particle rearrangement under load. This leads to higher compressibility and swelling potential, resulting in increased and values. In addition, the modified pore structure and reduced permeability contribute to higher values.
However, at higher diesel contents, the pore spaces become increasingly filled with diesel, which hinders effective water–particle interaction and increases the viscosity of the pore fluid. This suppresses pore pressure dissipation and limits further particle rearrangement, leading to a reduction in and . The observed peak behavior therefore reflects a transition from a rearrangement-dominated regime at low contamination levels to a pore-blocking and viscosity-controlled regime at higher diesel contents.
A comparison between
Figure 10 and
Figure 12c reveals the dual effect of diesel contamination. While permeability (k) decreases monotonically, the coefficient of consolidation
initially increases at low diesel contents due to a dominant reduction in the compressibility
. It then decreases at higher contamination levels, as the permeability reduction becomes the controlling factor.
The differences between the nanosilica-treated and untreated soils arise from the microstructural modifications induced by the nanoparticles. Nanosilica, owing to its high specific surface area, enhances the interparticle bonding and fills the micro-voids, resulting in a denser and more integrated soil fabric. Consequently, the soils containing 2% nanosilica exhibit the highest values of and , followed by the untreated soil and the soil with 1% nanosilica. This indicates that an optimal nanosilica content improves the particle contact efficiency and the deformation capacity under consolidation loading.
3.7. Effects of Diesel Contamination and Nanosilica on Unconfined Compressive Strength
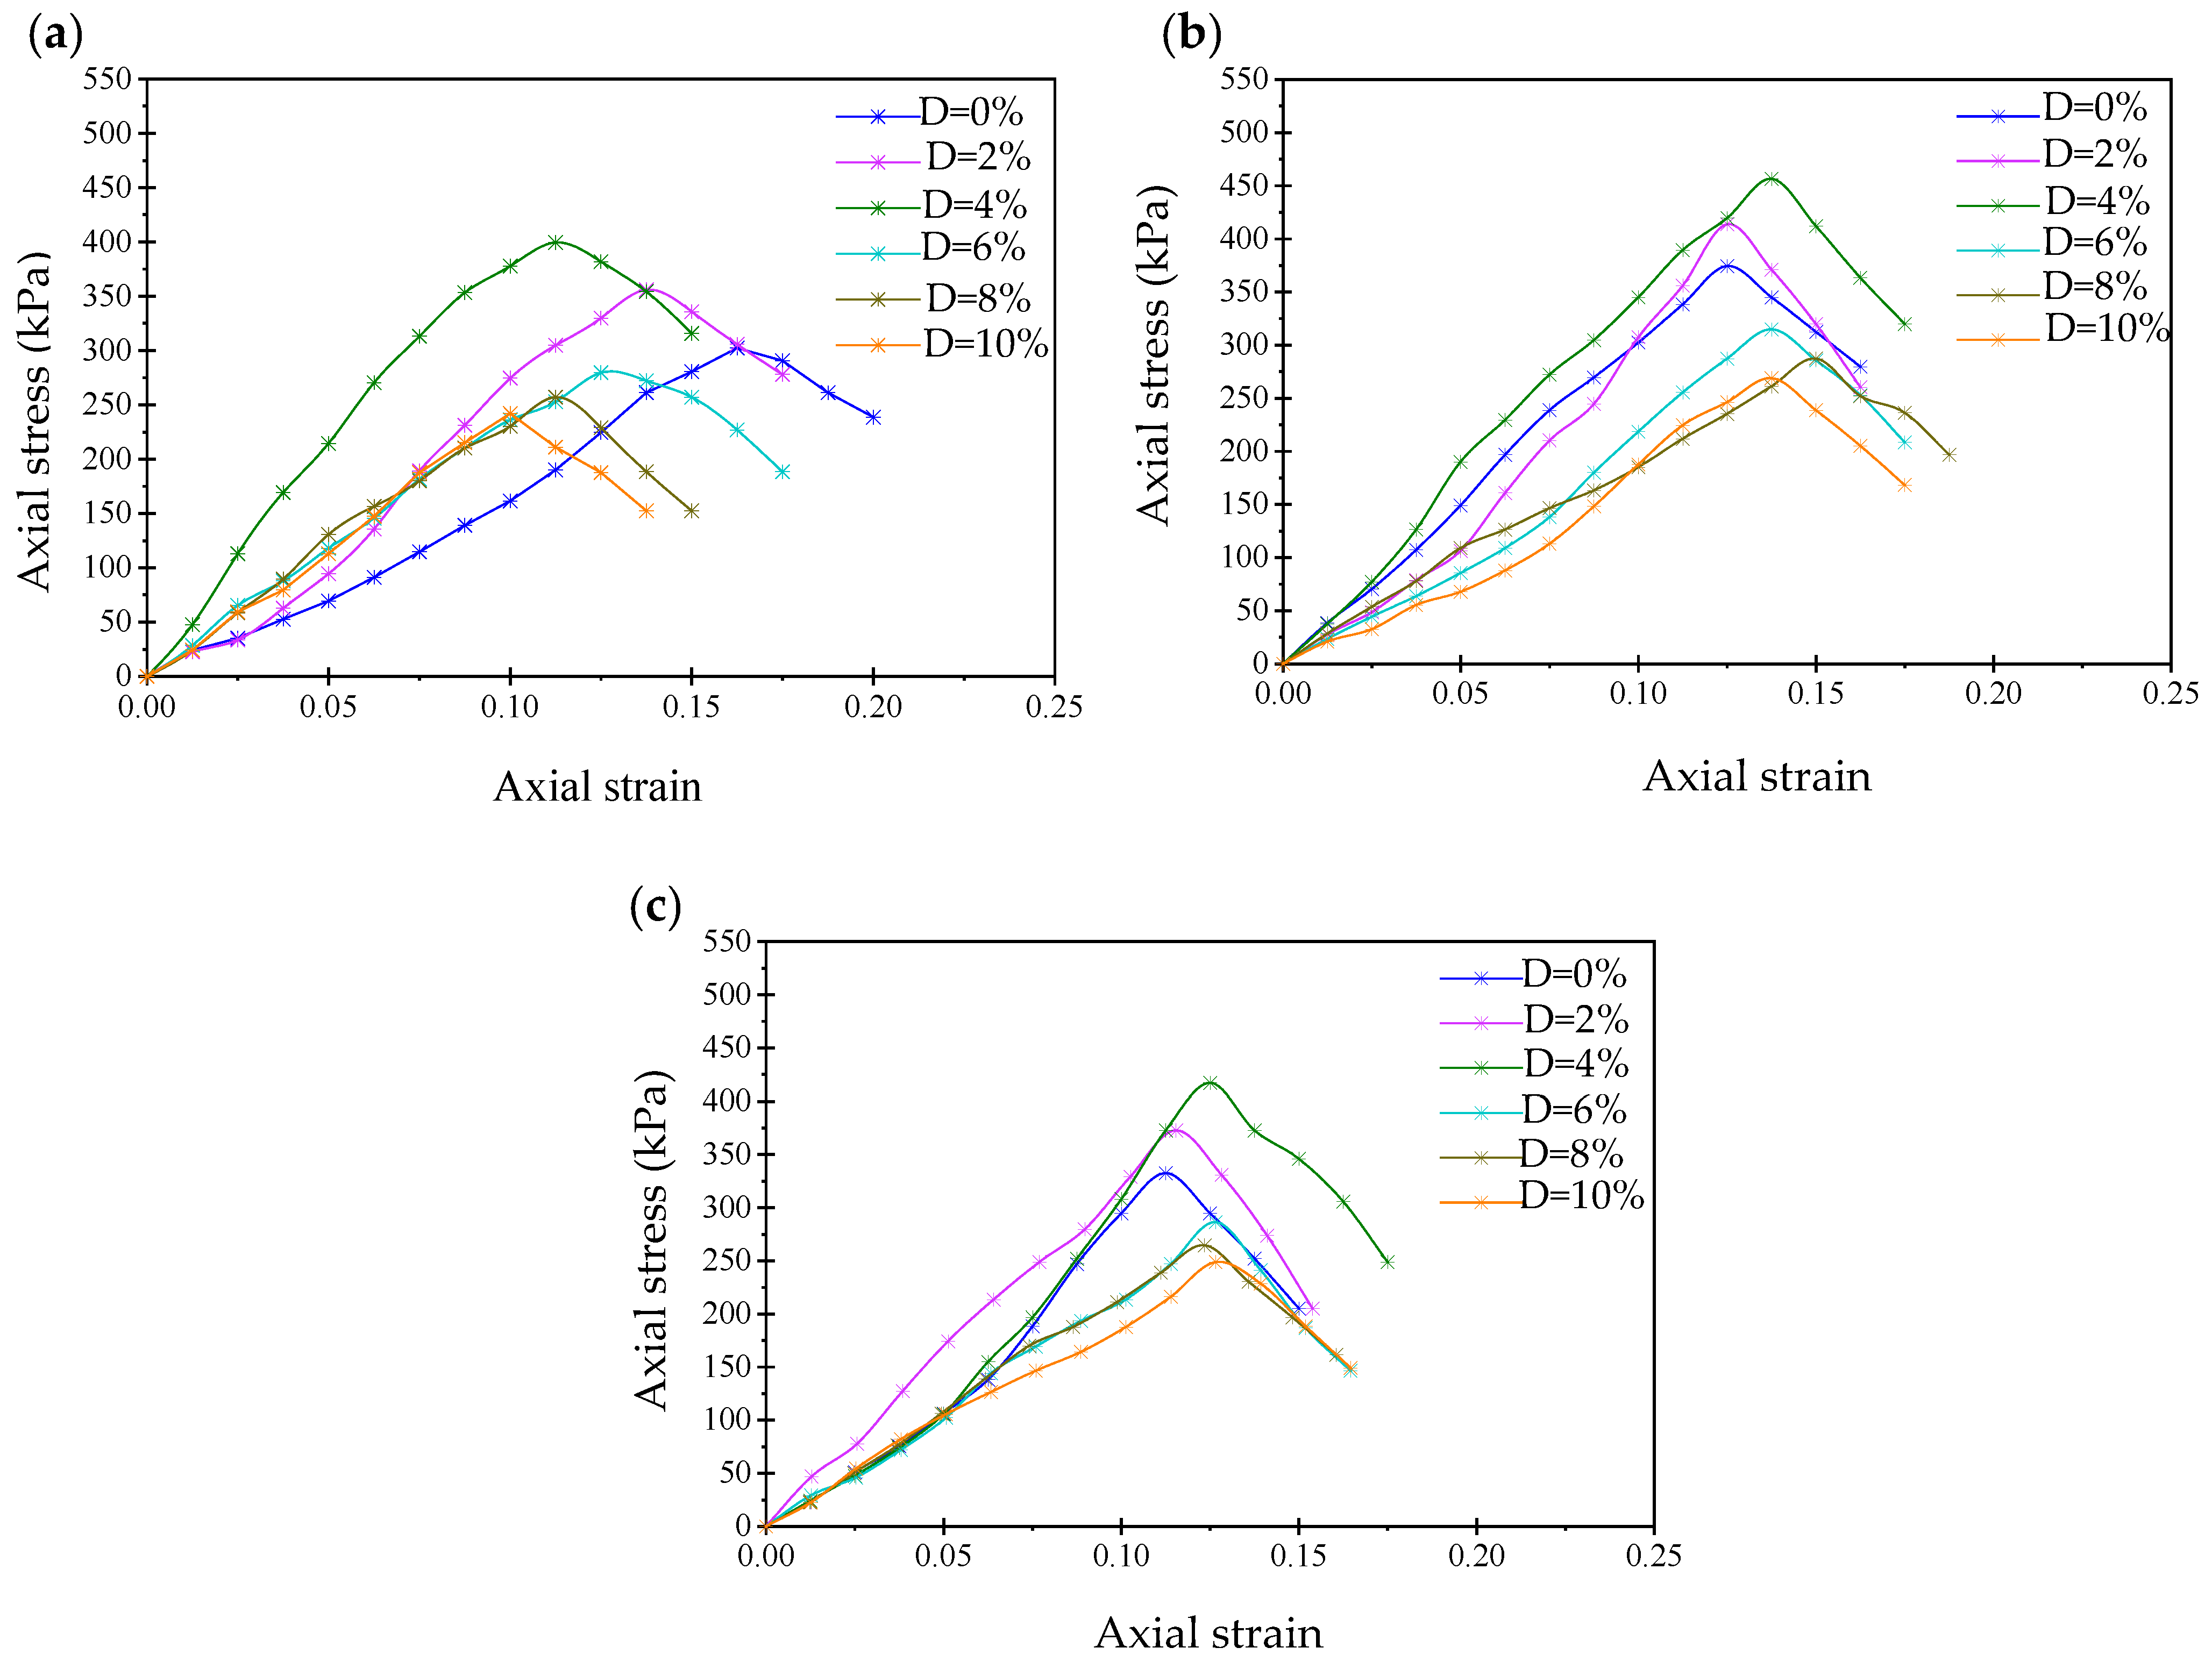
Figure 13 presents the axial stress–strain curves derived from the unconfined compressive strength tests. It can be observed that as the contamination level increases, the strength initially increases and then declines, with the initial stiffness of the samples following a similar trend. However, the post-peak behavior of the samples remains unaffected by the degree of contamination. A summary of the strengths obtained from the curves in
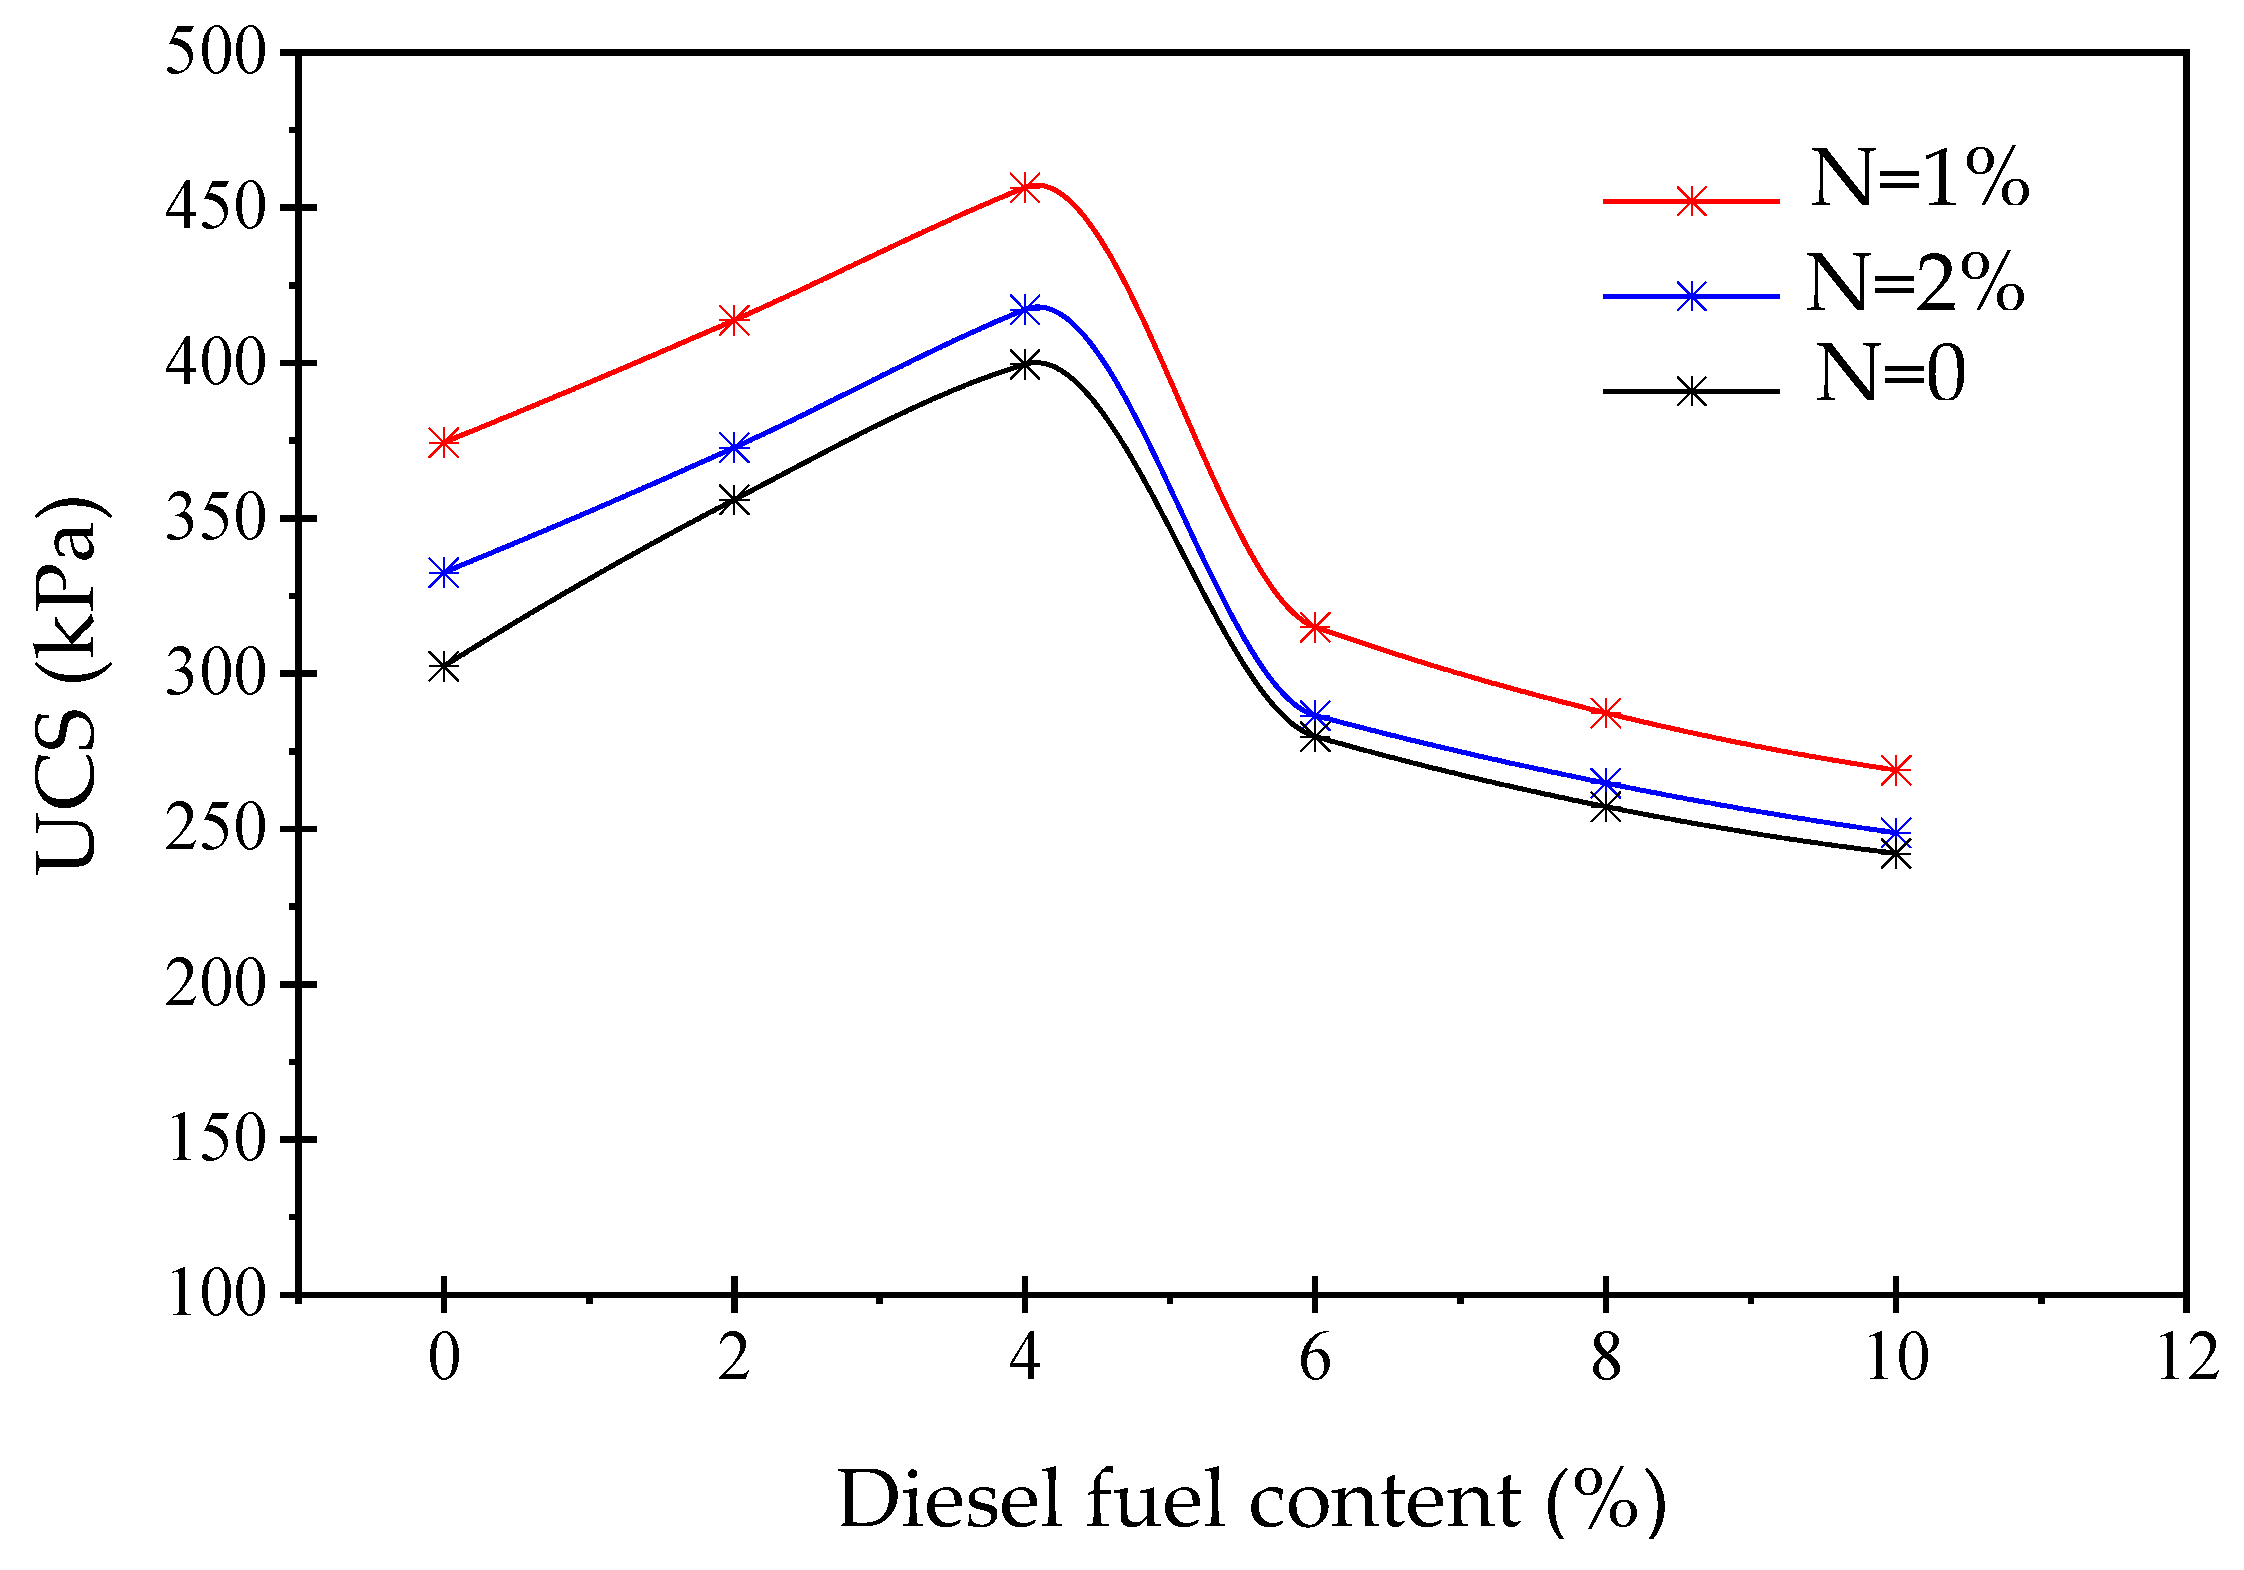
Figure 13 is provided in
Figure 14.
Figure 14 presents the variation of the unconfined compressive strength (UCS) with increasing diesel contamination. The results indicate that the UCS increases progressively as the diesel content increases from 0% to approximately 4%, after which a noticeable reduction in strength occurs. A sample contaminated with 10% diesel exhibits a 25% reduction in UCS relative to an uncontaminated sample. The initial increase in the UCS can be attributed to the lubricating effect of diesel, which reduces the interparticle friction and facilitates a denser packing of the soil particles during compaction at the optimum moisture content. This densification, which is consistent with the observed increase in the maximum dry unit weight at low diesel contents, leads to a stiffer and more coherent soil structure, thereby enhancing the compressive strength. However, at diesel contents above approximately 4%, the excessive coating of the soil particles with diesel disrupts the interparticle bonding, reduces the effective cohesion within the clay matrix, and weakens the soil skeleton. This results in the observed strength reduction. A similar result was obtained by Correia et al. [
51] in a study on SC soil samples from the São Paulo region of Brazil. They observed that, with increasing diesel contamination, the unconfined compressive strength (UCS) initially increases and subsequently decreases, reaching its maximum value at a contamination level of 4%. Furthermore, the specimen contaminated with 10% diesel exhibited a 45% reduction in strength compared to the natural soil sample. Mustafa et al. [
49] also studied SC soil and observed that the uniaxial compressive strength of diesel-contaminated soil increased significantly at 3% contamination; however, further increases in the contamination level up to 9% led to a reduction in strength.
The influence of nanosilica is also clearly reflected in the UCS results. For any given diesel content, the highest strength is obtained for the mixture containing 1% nanosilica, followed by the mixture with 2% nanosilica. The soil without nanosilica exhibits the lowest UCS. The superior performance of the 1% nanosilica mixture suggests an optimal nanoparticle content at which the micro-pore filling and the particle bonding are most effective. At higher nanosilica content (N = 2%), the partial particle agglomeration may reduce the dispersion efficiency and create localized weak zones, resulting in a slightly lower UCS compared with the 1% mixture. Overall, the combined effects of diesel-induced densification, diesel-induced weakening at higher concentrations, and nanosilica-induced microstructural modification govern the observed UCS trends.
3.8. Effects of Diesel Contamination and Nanosilica on California Bearing Ratio
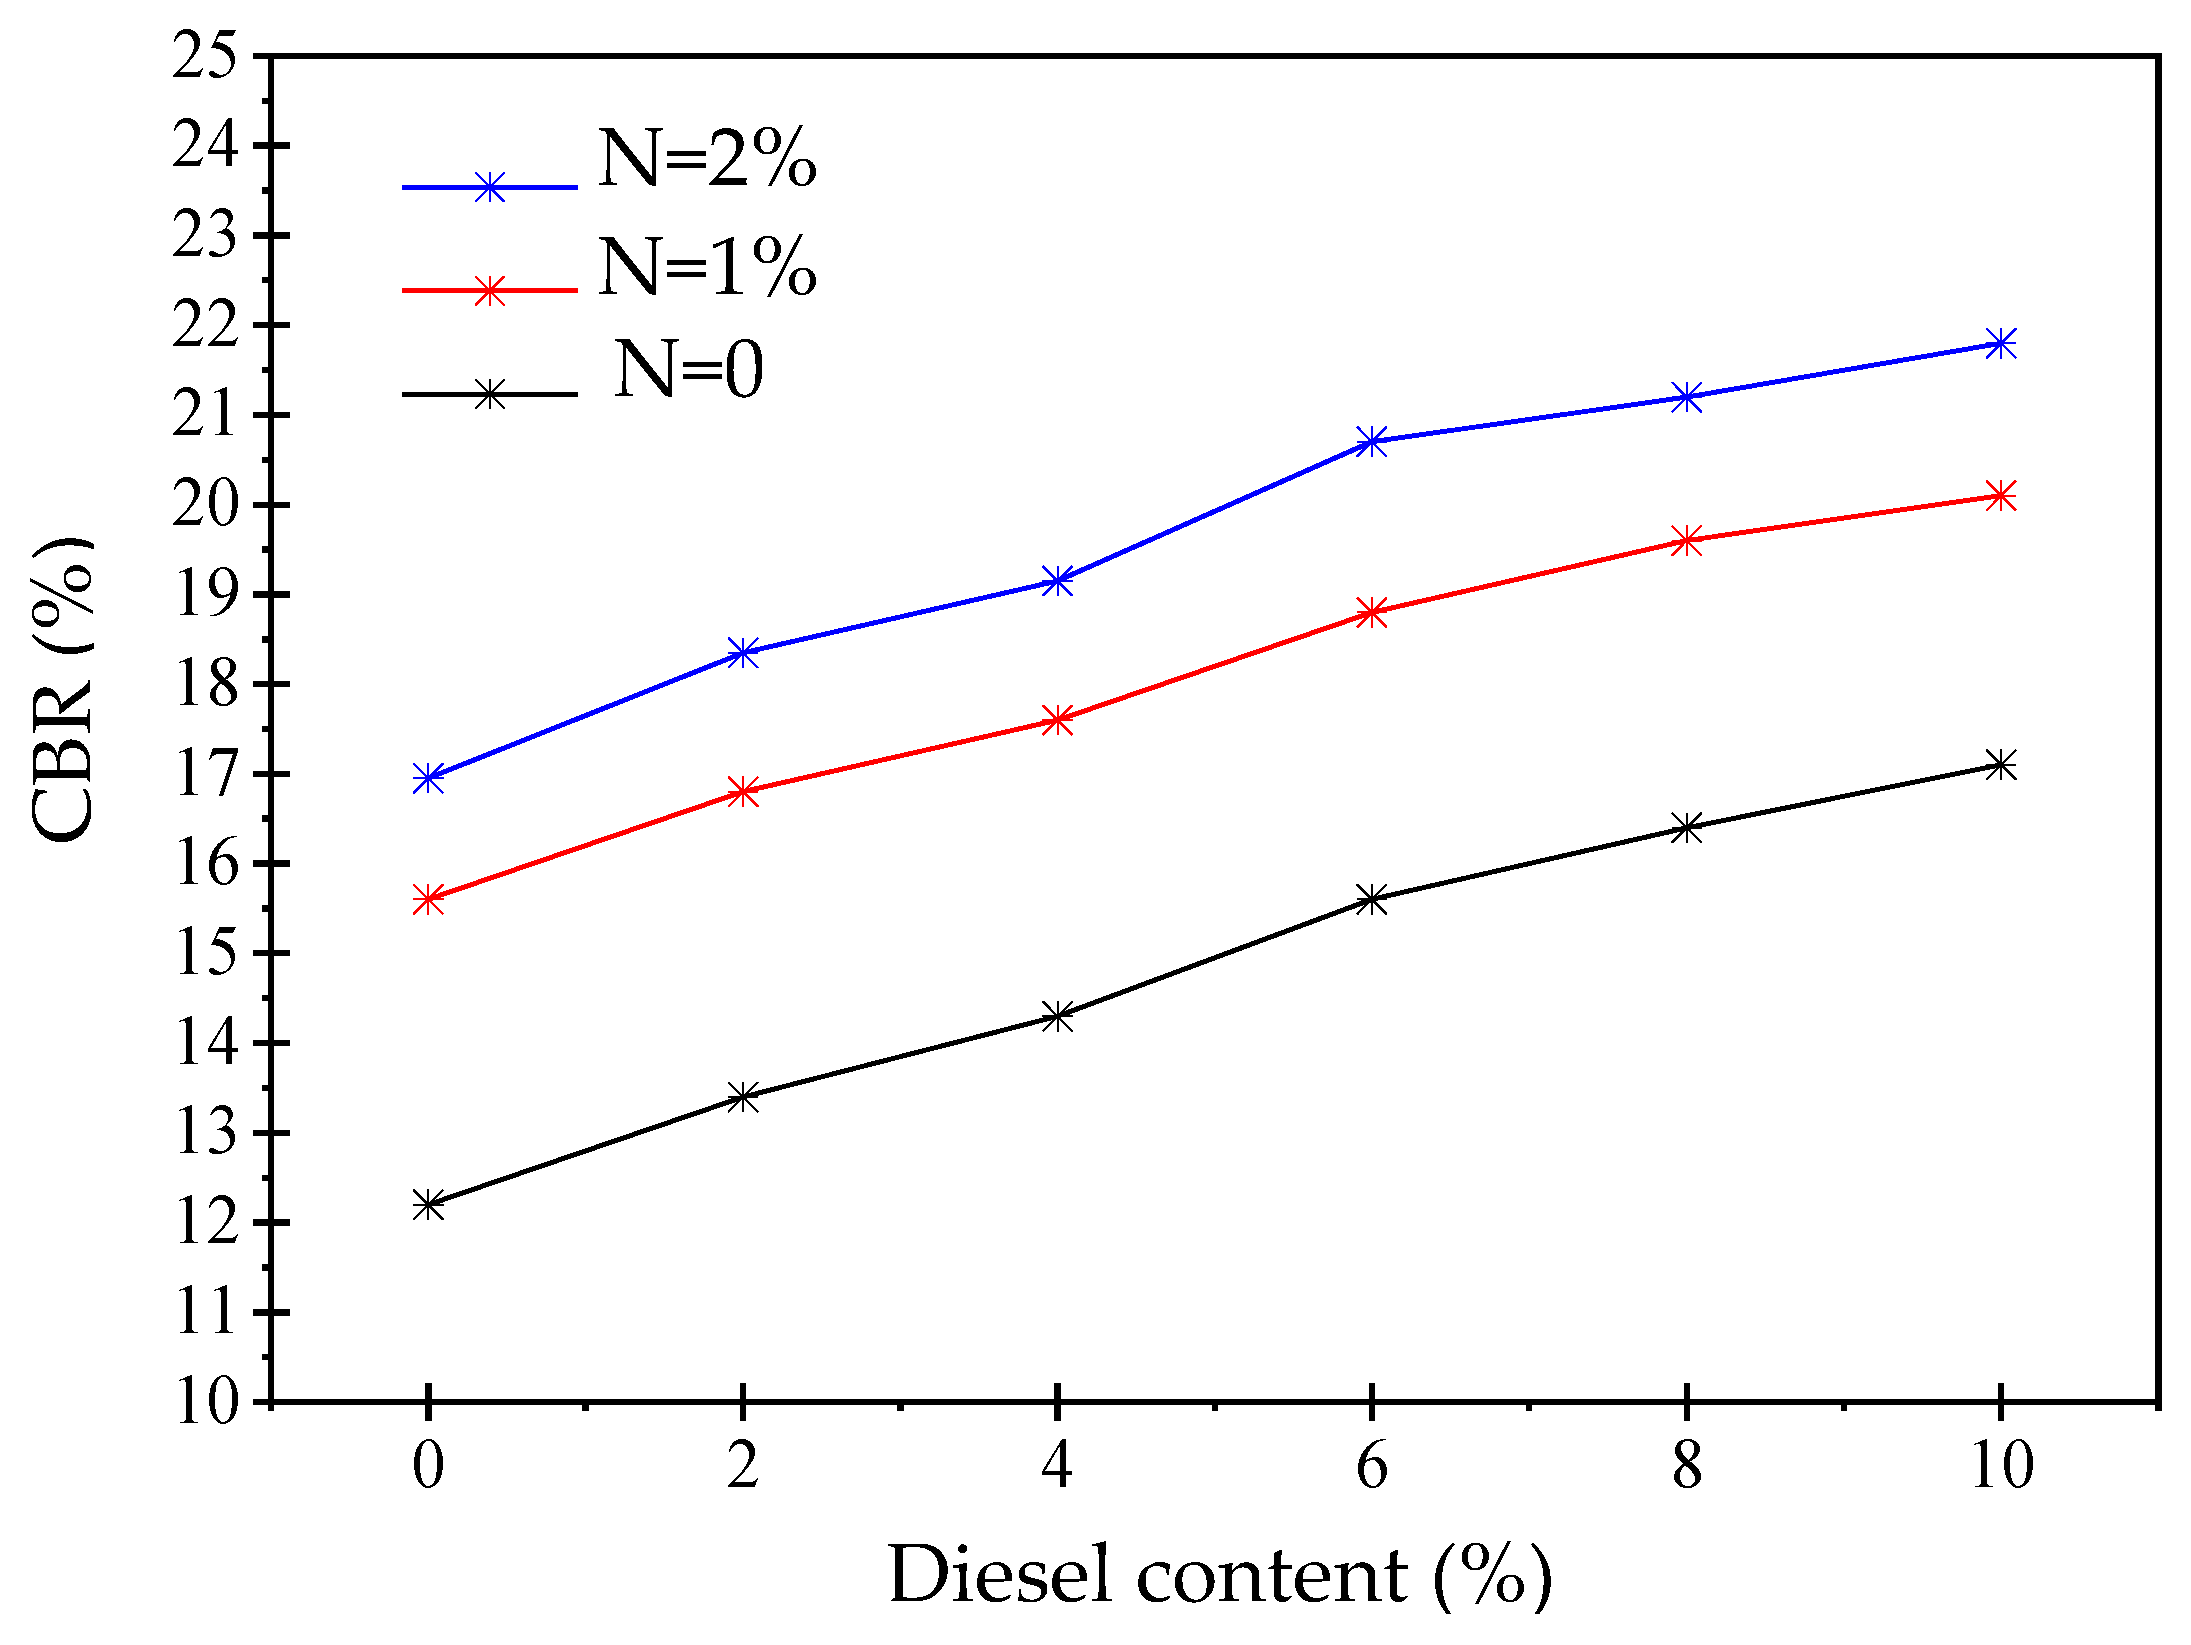
Figure 15 illustrates the variation of the California Bearing Ratio (CBR) with increasing diesel contamination. The results show that the CBR increases consistently as the diesel content increases from 0% to 10%. The increase in the CBR values is explained as a physical change. This study did not include chemical tests, although such tests would be advisable for future research, considering the chemical behavior of the clays. This upward trend can be attributed primarily to the lubrication effect of diesel, which reduces the interparticle friction and enables a denser packing during compaction. Since all the samples were compacted at their optimum moisture content and in a dry condition, the enhanced packing efficiency results in a higher maximum dry unit weight. This directly contributes to the increased CBR values. Furthermore, diesel reduces the affinity of clay minerals for water and suppresses the diffuse double-layer expansion, resulting in a stiffer soil fabric and an improved resistance to penetration during the CBR test. Studying clayey gravel and sand soil contaminated with gasoline, Quiñones-Bolaños and Bustillo-Lecompte [
52] also observed a steady increase in the CBR as the contaminant concentration rose from zero to 10 percent. The results of the study by Echeverri-Ramírez et al. [
53] should also be considered. They found that for soil samples composed primarily of kaolinite, quartz and muscovite, changes occurred in the relative proportions of these minerals due to the heterogeneity of the soil being contaminated. However, no formation of new minerals was observed.
The effect of nanosilica is also evident in
Figure 15. For any given diesel content, the samples containing 2% nanosilica exhibit the highest CBR values, followed by the samples with 1% nanosilica, while the untreated soil shows the lowest CBR. Although the addition of nanosilica slightly reduces the dry unit weight of the specimens, according to
Figure 8b, it is observed in this Figure that the CBR strength of the specimens increases with increasing nanosilica content. This behavior can be attributed to the microstructural role of nanosilica. By filling micropores and creating interparticle bonds through its surface reactivity (rather than pozzolanic reactions, which are negligible due to the low calcium content), nanosilica increases the stiffness and the load-bearing capacity of the soil. The slight reduction in the dry unit weight is compensated by the improvement in interparticle bonding and the formation of a more integrated microstructure. A further increase in the nanosilica content from 1% to 2%, without significant agglomeration, continues this trend and exhibits a higher strength compared to the 1% nanosilica mixture.
3.9. Effects of Diesel Contamination and Nanosilica on pH
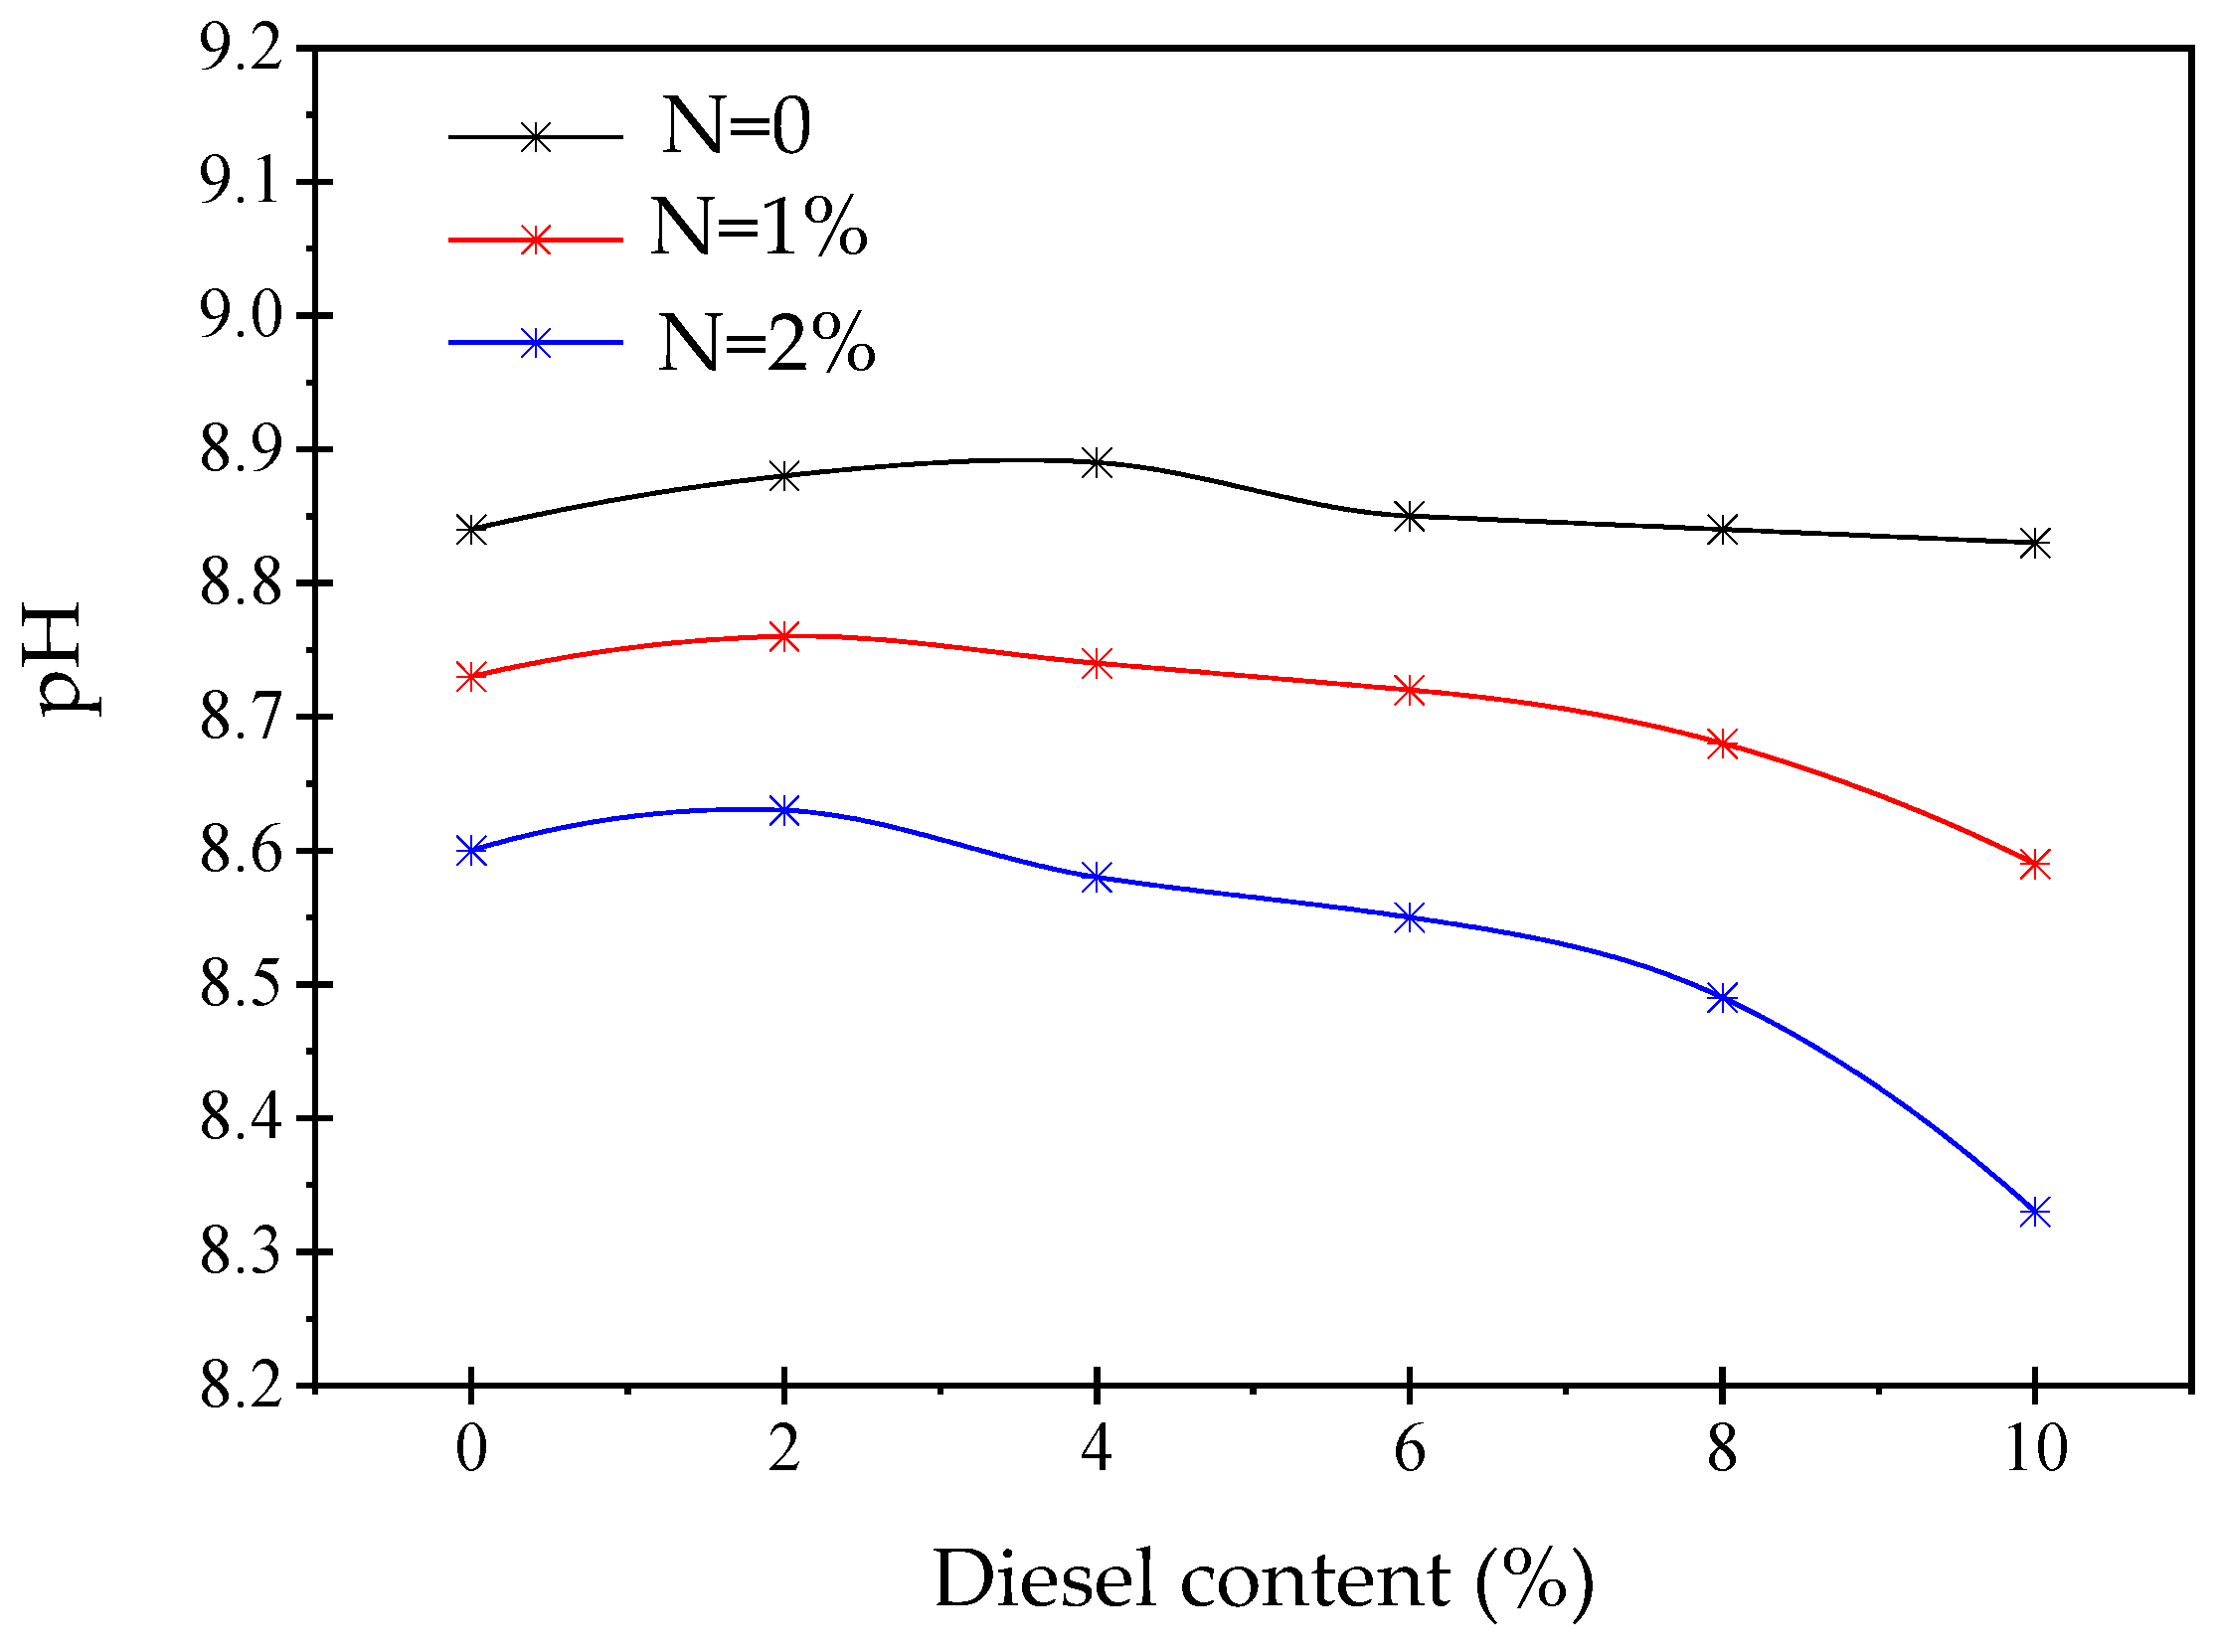
Figure 16 illustrates the variation of soil pH with diesel fuel content. As shown in this Figure, the pH values remain within the alkaline range for all the samples. However, a slight decreasing trend is observed with increasing diesel contamination, particularly at higher diesel contents. The initial minor increase or near constant pH at low diesel percentages (up to about 2–4%) may be attributed to the buffering capacity of the soil matrix and the alkaline nature of kaolinite-dominated systems. At higher diesel contents, the gradual reduction in pH is likely related to the adsorption of diesel hydrocarbons onto clay surfaces. This adsorption alters the surface chemistry and reduces the availability of alkaline exchange sites.
A clear distinction can be observed among the curves corresponding to different nanosilica contents. The untreated soil (N = 0%) exhibits the highest pH values, while soils treated with 1% and 2% nanosilica show progressively lower pH levels. This behavior is primarily attributed to the high surface activity of the nanosilica particles. This high surface activity promotes the adsorption of hydroxyl ions and enhances surface protonation reactions. Increasing the nanosilica content intensifies these effects due to the larger specific surface area and the higher density of reactive silanol (Si–OH) groups, leading to a reduction in the soil alkalinity. Moreover, nanosilica may facilitate physicochemical interactions between diesel hydrocarbons and clay minerals, further modifying the pore water chemistry. As a result, soils with a higher nanosilica content exhibit a more pronounced decrease in pH, particularly at elevated diesel contamination levels.
4. Discussion
A direct comparison of the unconfined compressive strength (UCS) and California Bearing Ratio (CBR) results reveals an apparent contradiction. UCS increases up to 4% diesel contamination and then decreases, whereas CBR increases monotonically with diesel content across all nanosilica percentages. This discrepancy arises from the fundamentally different mechanical mechanisms governing each test. UCS is primarily controlled by interparticle bonding and fabric cohesion. At low diesel contents (0–4%), the hydrocarbon acts as a mild dispersant and lubricant. It facilitates better contact between nanosilica-coated particles and promotes a more uniform distribution of the silica gel network, which enhances apparent cohesion and compressive strength. However, beyond 4% diesel, excess hydrocarbon molecules coat particle surfaces, swell the diffuse double layer of kaolinite, and physically interfere with nanosilica-induced aggregation. This degrades interparticle bonds and causes a sharp decline in UCS. In contrast, CBR is governed largely by frictional resistance, particle interlocking, and local densification under confined, high-strain penetration loading. Diesel, even at high concentrations, serves as an effective boundary lubricant that reduces frictional constraints at particle contacts. This allows particles to slide and rearrange into a denser and more interlocked configuration beneath the penetration plunger. This lubricant-induced densification outweighs any bond degradation effects during the CBR test, leading to a continuous increase in bearing ratio with increasing diesel content. Therefore, the contrasting trends of UCS and CBR reflect a fundamental shift from bond-dominated to friction-dominated mechanical behavior. The loading condition changes from unconfined, quasi-static compression to confined, high-strain penetration, causing this shift.
The optimum nanosilica content differs among compaction, unconfined compressive strength (UCS), and California Bearing Ratio (CBR) tests due to the distinct mechanical mechanisms governing each response. This is particularly relevant given the absence of significant pozzolanic reactions owing to the low calcium availability in the kaolinite–sand mixture. For compaction (
Figure 8b), the maximum dry density decreases progressively with increasing nanosilica content, with the highest density observed at 0% nanosilica. This indicates that nanosilica addition impairs particle packing efficiency during dynamic compaction by promoting micro-aggregation, increasing interparticle friction, and retaining more water due to the high specific surface area of nanosilica. These effects thus hinder optimal densification. In contrast, for the UCS (
Figure 14), the optimum nanosilica content is 1%, where the highest peak strength (at 4% diesel contamination) is achieved. The UCS is governed primarily by interparticle adhesion, fabric stability, and the formation of a cohesive silica gel network that binds the soil particles together. A moderate amount of nanosilica (1%) provides a sufficient silica gel to coat the particle contacts and enhance the tensile bonding without causing excessive aggregation or water retention. However, 2% nanosilica leads to over-flocculation, the formation of large, weak micro-aggregates, and increased water demand, which reduces the effective contact area and lowers the unconfined strength. For the CBR (
Figure 15), however, the optimum nanosilica content is 2%, yielding the highest bearing ratio across all the diesel levels. The CBR involves high-strain, confined penetration loading where frictional resistance, particle interlocking, and resistance to localized shear failure dominate. A higher nanosilica content (2%) produces a more aggregated and frictionally stable soil skeleton due to the formation of a pervasive silica gel network. This network binds the micro-aggregates into a stiff matrix that resists punch-through failure. Additionally, the lubricating effect of diesel facilitates local densification under the plunger, further enhancing the CBR. Therefore, the shift in the optimum nanosilica content reflects a transition from a packing-dominated (compaction) to a bond-dominated (UCS) to a friction-and-stiffness-dominated (CBR) mechanical response. In all the cases, nanosilica acts primarily through silica gel formation and physical–chemical bonding rather than pozzolanic cementation.
Although some trends may appear counterintuitive (e.g., decreasing specific gravity alongside increasing dry unit weight, or flocculated fabrics with reduced permeability), all the observed behaviors are consistent when the competing roles of lubrication, particle rearrangement, interparticle bonding, and pore blocking are considered. The experimental results indicate that diesel contamination and nanosilica modification govern soil behavior through distinct but interacting microstructural mechanisms rather than through a single controlling factor.
A limitation of this study is that chemical experiments were not conducted. Considering the chemical behavior of clays, the inclusion of such analyses is strongly recommended for future investigations.