Article

Multiscale Geophysical Characterization of Leachate and Gas Plumes in a Tropical Landfill Using Electrical Resistivity Tomography for Environmental Analysis and Diagnosis

by
Omar E. Trujillo-Romero
1,*,
Gloria M. Restrepo
1 and
Jorge E. Corrales-Celedon
2
1
Center for Research on Environment and Development (CIMAD), University of Manizales, Manizales 170001, Colombia
2
Department of Environmental Engineering, Faculty of Engineering, Universidad del Magdalena, Santa Marta 470004, Colombia
*
Author to whom correspondence should be addressed.
Environments 2025, 12(9), 337; https://doi.org/10.3390/environments12090337
Submission received: 5 August 2025 / Revised: 7 September 2025 / Accepted: 17 September 2025 / Published: 21 September 2025

Abstract

Monitoring environmental risks in operational landfills that contain closed cells requires non-invasive techniques capable of accurately characterizing subsurface contaminant dynamics. Electrical Resistivity Tomography (ERT) was selected because it enables continuous imaging across capped cells without intrusive drilling, with high sensitivity to the strong conductivity/resistivity contrasts that differentiate leachate (very low resistivity) from landfill gas or dry waste (high resistivity). This study employed ERT to spatially characterize contaminant distribution in closed cells within a landfill system in the Caribbean region of Colombia. Fifteen geophysical survey lines were acquired using Wenner, Dipole–Dipole, and Gradient arrays and processed through 2D, 2.5D, and 3D inversion models. The results revealed extensive low-resistivity zones (<2.1 Ω·m) in the southeastern sector, interpreted as leachate accumulations, some reaching the surface. Conversely, high-resistivity anomalies (>154 Ω·m) were identified in the southwestern area, associated with potential biogas pockets. Although these high-resistivity volumes represent <1.1% of the total modeled volume, their location and depth may pose geoenvironmental risks due to internal pressure build-up and preferential migration pathways. Existing leachate and gas collection systems showed adequate performance, though targeted corrective actions are recommended. ERT proved to be a precise, scalable, and cost-effective method for mapping subsurface contamination, offering critical insights for post-closure landfill management in tropical settings.

1. Introduction

The diagnosis and monitoring of contaminated sites have become an increasingly pressing concern in contemporary environmental management, particularly in urban and peri-urban contexts where sanitary landfills represent potential sources of pollution for surface water bodies, soil, and groundwater aquifers [1,2]. Although designed as final disposal solutions for solid waste, these sites contain reactive materials and biochemical conditions conducive to the generation of leachate and landfill gases [3,4,5].
In Latin America, many sanitary landfills were constructed during periods when technical and regulatory knowledge on environmental protection was limited. As a result, these facilities often lack effective impermeable barriers or accurate records regarding depth, waste types, and precise spatial delimitation [6,7]. Even in more recently constructed landfills designed according to modern engineering standards, vertical and lateral leachate migration has been documented, impacting soil and groundwater quality [8,9].
Traditionally, landfill impacts on geological and hydrological systems have been assessed through drilling, water chemistry monitoring, and piezometric surveys [4,10]. While effective, these methods are invasive, expensive, and offer limited spatial coverage. In contrast, geophysical methods—particularly Electrical Resistivity Tomography (ERT)—offer notable advantages: they are non-destructive, cost-effective, and capable of modeling subsurface structures with high spatial resolution [11,12,13,14].
ERT is based on the measurement of the electrical resistivity of the ground, which depends on properties such as moisture content, salinity, porosity, and the presence of conductive materials such as leachate [15,16]. Zones with accumulated leachate typically exhibit low resistivity values (<15 Ω·m), while regions with biogas accumulation or dry materials tend to show high resistivity values (>45 Ω·m) [17,18]. These contrasts allow the identification of leachate plumes, ruptured impermeable layers, or zones of trapped gas.
In addition to ERT, other geophysical methods have been successfully applied to landfill characterization. Ground Penetrating Radar (GPR) has been used to map shallow stratigraphy and buried waste deposits, although its effectiveness decreases in conductive, leachate-rich environments [19,20]. Electromagnetic induction (EM) methods provide rapid surface surveys of conductivity anomalies and have been effective in detecting leachate plumes and moisture variations [21,22]. Seismic approaches, including refraction, MASW, and HVSR surveys, have been employed to evaluate waste thickness, compaction, and geomechanical stability [23]. More recently, magnetotelluric methods have enabled the detection of deep conductive pathways associated with leachate migration [24], while induced polarization (IP) tomography has improved the delineation of zones with elevated ionic content [25]. Magnetic surveys have also been used as a complementary tool to identify buried ferrous materials and waste distribution patterns [26]. Together, these approaches demonstrate that a multi-method geophysical framework can significantly enhance the understanding of subsurface heterogeneity in landfill environments, thereby reducing interpretation uncertainty and strengthening environmental diagnostics.
However, resistivity values are relative and depend on the geoelectrical properties of shallow deposits. Variations in lithology, grain size, porosity, and fluid saturation create overlapping resistivity ranges, complicating the distinction between leachate-impacted zones, natural clay-rich horizons, and dry waste layers. This intrinsic variability introduces uncertainty into anomaly interpretation, particularly in heterogeneous tropical landfill environments where unconsolidated sediments and fluctuating water contents prevail. Recent approaches—such as geo-constrained clustering of ERT data—have enabled the delineation of distinct resistivity signatures corresponding to different shallow lithological units, offering a quantitatively grounded pathway to reduce interpretive ambiguity [27]. Alongside classical foundational studies [28,29] and recent geotechnical applications [11], acknowledging this variability is essential for integrating ERT into a robust geoenvironmental framework.
Recent studies have applied ERT in sanitary landfills in both urban and rural settings across Europe, Asia, and the Americas, successfully modeling 2D and 3D subsurface leakage zones. For example, Martí et al. [24] in Spain combined magnetotellurics and resistivity to map leachate migration in a karstic massif. In Argentina, Pomposiello et al. [30] characterized contamination zones in both active and closed landfills using electrical tomography. In France, Bichet [31] identified vertical leakage beyond the designed confinement zones.
Beyond these case-specific applications, a growing body of research has consolidated the role of ERT as a standard geophysical tool for environmental diagnostics. Wilkinson et al. [32] demonstrated its ability to detect conductive leachate plumes, while Mauria et al. [17] mapped leachate migration in detail using 2D and 3D ERT correlated with ionic strength data. Helene et al. [18] identified infiltration pathways and flow directions of leachate in landfill cells, and Bichet et al. [31] spatially characterized leachate plumes in sites with both old and new waste deposits. In addition, Zhan et al. [33] applied ERT to detect the distribution of leachate and gas in large-scale landfill cells, and Godio et al. [34] used ERT for geophysical monitoring of leachate injection in pretreated waste landfills. Collectively, these studies highlight how ERT has evolved into a replicable methodology for environmental risk assessment, capable of integrating statistical inversion, 3D volumetric modeling, and hydrogeochemical validation.
Despite these advances, important knowledge gaps remain in the application of ERT to landfill investigations. Most previous research has been limited to individual array configurations or two-dimensional sections, with scarce integration of volumetric models, statistical validation, or long-term monitoring. As a result, uncertainties persist in distinguishing leachate from biogas and lithological heterogeneities, particularly in tropical environments where high rainfall and unconsolidated sediments increase subsurface complexity. Furthermore, the incorporation of ERT findings into regulatory monitoring frameworks in Latin America has been limited, leaving a gap between geophysical evidence and operational management strategies. The present study addresses these limitations by integrating Wenner, Dipole–Dipole, and Gradient arrays with 2D, 2.5D, and 3D inversion models, supported by statistical analyses and indirect validation with existing monitoring infrastructure. This multiscale approach aims to reduce interpretive uncertainty, provide volumetric estimates of leachate and gas anomalies, and generate actionable insights for post-closure environmental management in tropical landfill settings.
The environmental management of sanitary landfills in Colombia is regulated by the Ministry of Environment and Sustainable Development through Decree 838/2005, Resolution 1541/2013, and the Technical Guidelines for Leachate Management in Sanitary Landfills [35]. These regulatory instruments establish mandatory monitoring of leachate, groundwater, and landfill gas, as well as specific requirements for the post-closure management of landfill cells. Within this framework, the implementation of non-invasive geophysical methods such as ERT offers a robust technical approach to support the diagnosis and monitoring of environmental risks.
Some of the largest landfills in the Caribbean region have been subject to technical monitoring by both regulatory authorities and private operators. Within this framework, the present study aims to apply the ERT method to closed landfill cells (specifically cells 1, 2, and 3) in a tropical setting, in order to identify resistivity anomalies associated with leachate and biogas, generate three-dimensional subsurface models, and contribute to the environmentally sustainable management of post-closure landfill infrastructure.
The main objective of this research is therefore the delineation of leachate and biogas plumes under tropical landfill conditions using ERT as a non-invasive diagnostic tool. The inclusion of multiple electrode arrays (Wenner, Dipole–Dipole, and Gradient) is not intended as a comparative analysis of acquisition geometries, but rather as a complementary strategy within the methodological framework to enhance subsurface resolution and reduce interpretive uncertainty.
The innovative contribution of this study lies in the development of a multiscale and replicable geophysical framework specifically tailored to tropical landfill conditions. By combining Wenner, Dipole–Dipole, and Gradient arrays with 2D, 2.5D, and 3D inversion models, supported by statistical validation and indirect calibration with monitoring infrastructure, this research advances beyond previous case studies that mainly relied on single-array or two-dimensional surveys. The approach not only improves the discrimination between leachate, gas, and lithological heterogeneities but also provides volumetric estimates directly applicable to post-closure management. In doing so, it addresses both methodological gaps and the lack of advanced ERT applications in Latin American tropical landfills, thereby establishing a novel benchmark for environmental diagnostics in these challenging contexts.

2. Materials and Methods

2.1. Study Area Location

The study was conducted in a sanitary landfill located in the Caribbean region of Colombia, operating under tropical climatic conditions and designed for the final disposal of municipal solid waste. The facility has been in operation since 2009 and serves as a regional disposal site for several municipalities within a metropolitan area. It covers an approximate area of 135 hectares, of which 75 hectares are designated for the engineered disposal of around 1490 metric tons of solid waste per day.
The landfill infrastructure includes operational and closed cells, leachate collection and treatment systems, and facilities for biogas recovery and use. The ERT surveys conducted in this study focused on three closed cells within the site, where non-invasive subsurface characterization was applied to support post-closure environmental management.
The study area is located within a tropical lowland environment in the Colombian Caribbean region, characterized by relatively flat topography and unconsolidated sedimentary formations. These physical and operational conditions provided a representative setting for the spatial acquisition of geophysical data and enabled the analysis of subsurface contaminant dynamics through non-invasive techniques.
Geologically, the study area is located within the Caribbean alluvial plain, where unconsolidated Quaternary sediments overlie sedimentary sequences of the Las Perdices Formation, mainly composed of interbedded sandstones and claystones. These lithologies generate alternating layers of contrasting permeability: sandstone strata favor preferential flow and vertical infiltration, while claystone horizons act as semi-confining layers that retain moisture and contaminants. The stratigraphic heterogeneity, typical of fluvio-lacustrine depositional environments, plays a decisive role in the electrical resistivity response of the subsurface. Clay-rich intervals are expected to exhibit low resistivity values due to their fine grain size and high ionic content, whereas sandstone-rich or gravelly sectors display more resistive behavior, which can be further enhanced by gas accumulation in unsaturated zones. This geological context is essential to support the interpretation of resistivity anomalies identified in the closed landfill cells.

2.2. ERT Survey Design and Line Deployment

A total of fifteen (15) ERT profiles were conducted over the three closed landfill cells. Each line was approximately 570 m in length and arranged longitudinally with a uniform spacing of 10 m. This geometry was chosen to optimize both the spatial resolution and the vertical penetration depth of the electrical signal [36].
Each profile consisted of 48 stainless-steel electrodes installed at a constant spacing of 10 m, which allowed an average depth of investigation of 60–70 m depending on the array employed. The electrode stakes were pre-wetted to reduce contact resistance, and multicore cables were connected to an automatic switching unit to facilitate sequential measurements. The selected spacing and number of electrodes provided sufficient overlap between adjacent lines, ensuring lateral continuity in the integrated models.
The geographic coordinates of the initial and final electrodes (positions 1 and 47) of each line were recorded using differential GPS, ensuring sub-meter accuracy in georeferencing (Table 1). Spatial positioning was visualized using Grapher, Version 20.2 (Golden Software, LLC, Golden, CO, USA), overlaid on satellite imagery from Google Earth (2024) (Figure 1).

2.3. Operational Principles and Data Acquisition

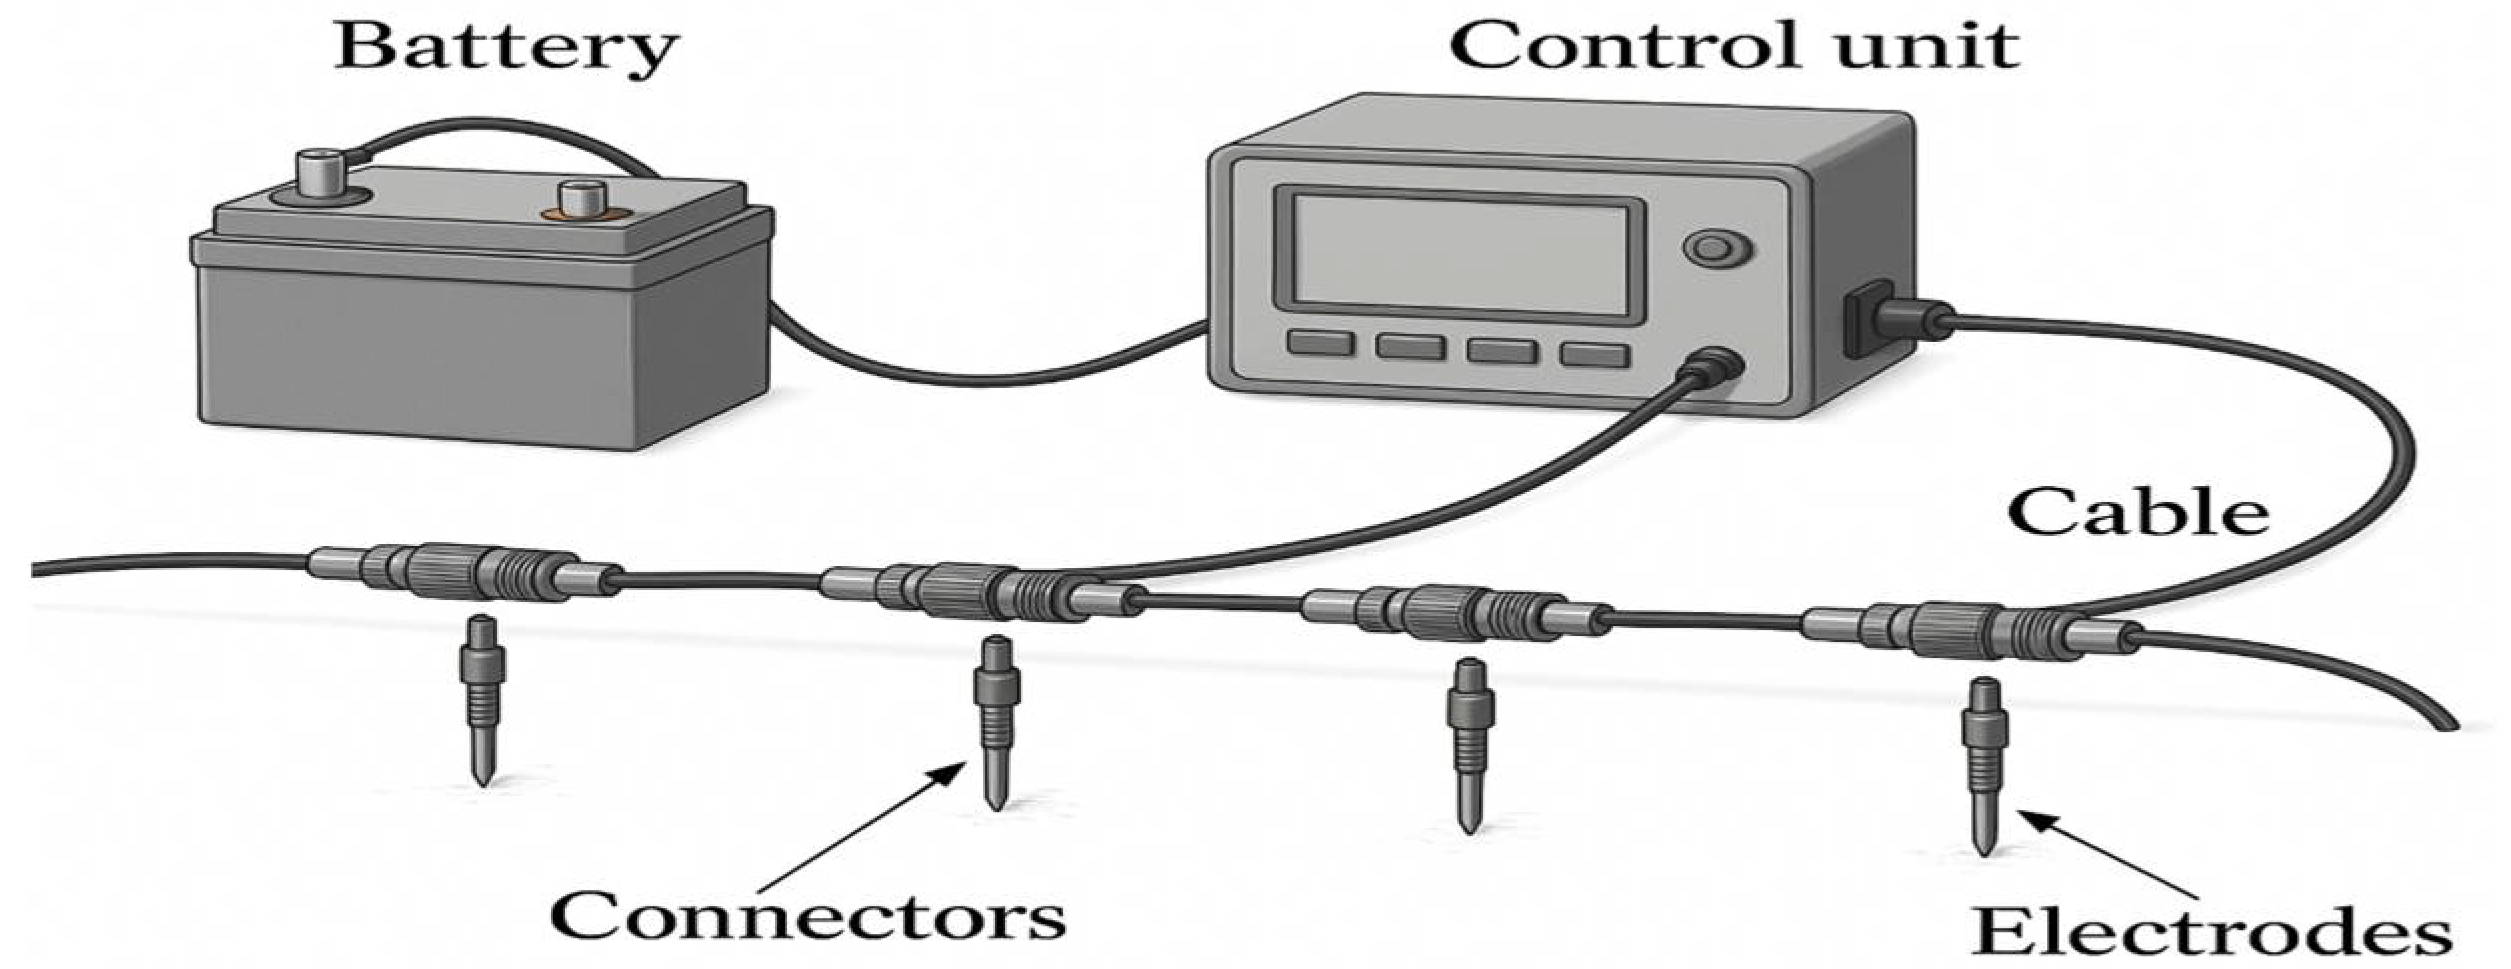
The ERT method consisted of injecting electrical current through pairs of current electrodes and measuring the induced potential difference at pairs of potential electrodes (Figure 2). Apparent resistivity values (ρa) were obtained using an automated multi-electrode system and subsequently corrected for topography [37].
Three electrode array configurations were employed:
  • Wenner—High vertical sensitivity
  • Dipole–Dipole—High lateral resolution
  • Gradient—Rapid acquisition and uniform coverage
Each line generated hundreds of measurements, stored in the instrument’s binary format for subsequent processing. During acquisition, three to five current stacks per measurement improved the signal-to-noise ratio. The injected current and contact resistance were monitored in real time, and measurements deviating more than ±5% from the nominal current were discarded to ensure data reliability.
Data inversion was carried out using RES2DINV v4.10 and RES3DINV v3.14 (Geotomo Software. Penang, Malaysia) [38]. A smoothness-constrained least-squares algorithm was applied, with 5–8 iterations on average. The regularization parameter was tuned to balance model roughness and misfit, and the convergence criterion was set at an RMS error < 5%. Final outputs included 2D resistivity sections, interpolated pseudo-3D slices, and integrated 3D volumetric models, all corrected for topography and georeferenced with differential GPS data.

2.4. Processing, Inversion, and Modeling

Data processing was carried out using RES2DINV and RES3DINV (Geotomo Software) [39], which implement regularized least-squares iterative inversion algorithms, following Equation (1)
Φ = i = 1 n [ ( d _ obs , i d _ calc , i ) / σ i ] 2 + λ j = 1 m ( m j ) 2
where
d_obs,i: measured apparent resistivity at position i;
d_calc,i: modeled resistivity value at position i;
σi: estimated error of measurement i;
λ: regularization parameter controlling model smoothness;
mj: model resistivity value in cell j;
mj: spatial gradient in cell j.
Each resistivity model required at least five iterations, with λ adjusted through sensitivity testing to balance data fidelity and stability. The convergence criterion was a root mean square error (RMS) below 5%, a condition met in over 90% of the processed profiles.
The resulting 2D models were integrated using linear spatial interpolation between adjacent sections to generate 2.5D (layered horizontal slices) and 3D volumetric models [40,41]. This integration was applied as a methodological procedure to highlight subsurface zones with contrasting resistivity values. Low-resistivity anomalies were parameterized as potential leachate-saturated areas, whereas high-resistivity anomalies were defined as indicators of possible biogas accumulations.

2.5. Experimental Support and Statistical Analysis

To ensure the robustness and reliability of the resistivity inversion models, various statistical and experimental validation techniques were applied. Model fit was assessed using the root mean square error (RMS) calculated at the end of each inversion iteration in RES2DINV and RES3DINV, with an acceptance threshold set at RMS < 5%.
Sensitivity analysis was used to evaluate the relative influence of each observed data point on the final model solution. Sensitivity maps were generated from Jacobian matrices provided by the inversion software, allowing the identification of zones with high uncertainty or low information content.
To quantify the uncertainty of estimated resistivity values per model cell, a 95% confidence interval analysis was conducted using bootstrapping with 500 random permutations. This procedure established plausible upper and lower bounds for resistivity values based on input data variability. Additionally, the statistical homogeneity of the dataset was evaluated prior to processing. The Kolmogorov–Smirnov test was applied to the field-measured apparent resistivity values to verify adherence to a normal distribution. This step was essential to justify the use of inversion methods based on least-squares minimization.

2.6. Spatial Integration and Visualization of Resistivity Models

Electrical resistivity models were obtained through numerical inversion using RES2DINV v4.10 (Geotomo Software), based on data acquired with Wenner, Dipole–Dipole, and Gradient arrays [42]. Each profile was accurately georeferenced in the field to enable subsequent spatial integration.
To represent the continuous distribution of subsurface resistivities, 2.5D and 3D models were generated through interpolation between parallel profiles. Interpolation was performed on a regular mesh, preserving the original horizontal resolution and applying smoothing algorithms to minimize edge artifacts. The volumetric models were constructed by integrating the inversion results from the three electrode configurations (Wenner, Dipole–Dipole, and Gradient), so that the complementary sensitivities of each array contributed to the final representation. Anomalous or unstable measurements were removed prior to interpolation in order to improve robustness. This process enabled the construction of interpretable 3D volumes from independent 2D sections.
Model visualizations were created using Surfer v25 (Golden Software), which enabled resistivity maps to be edited with logarithmic color scales, isoline generation, and depth/elevation controls. These graphical representations were subsequently used for structural analysis and environmental assessment of the study site.

2.7. Resistivity Interpretation Criteria

Interpretation of anomalies was based on resistivity ranges reported in the technical literature (Figure 3), which establish strong correlations between electrical resistivity, grain size, porosity, and water saturation [37,40,41]. Values below 20 Ω·m were interpreted as indicative of clay-rich, saturated, or leachate-impacted horizons, consistent with the high ionic content and fine-grained sediments reported in previous landfill studies [17,33]. Conversely, values above 100 Ω·m were associated with dry materials, coarse sands or gravels, or potential biogas accumulations, as documented in recent applications of ERT in waste disposal sites [43,44]. These thresholds were further cross-referenced with local field data, including water table levels, stratigraphic logs, and lithological descriptions, to ensure site-specific consistency. In particular, stratigraphic information from the Las Perdices Formation—composed of gray mudstones interbedded with fine-grained sandstones of Oligocene–Miocene age—was incorporated as part of the interpretation framework. This characterization, documented in regional geological syntheses of Colombia (Servicio Geológico Colombiano, [45]), was consistent with lithologies observed in stratigraphic logs at the site. Integrating this geological evidence provided an independent basis for validating resistivity anomalies. Low-resistivity zones were correlated with clay-rich, moisture-retaining horizons, whereas high-resistivity anomalies were consistent with sandstone-rich intervals and the presence of operational gas wells. This explicit geological validation strengthened anomaly classification, reduced interpretive ambiguity, and ensured that the geophysical models were firmly grounded in regional stratigraphic evidence.
The ranges shown in Figure 3 were selected based on classical geophysical references [37,40,41] and recent landfill-related studies. The selection criteria focused on including materials and compounds that are directly relevant to landfill environments under tropical conditions. Clay-rich soils, sands, and gravels were incorporated due to their prevalence in the local geology and their contrasting electrical responses. Highly conductive ranges associated with leachate were represented through saline and organic solutions, reflecting the elevated ionic content typically observed in municipal landfill leachate. Conversely, resistive ranges related to gas accumulations were illustrated with dry materials and hydrocarbon-bearing phases. This framework was intended to provide a practical reference for correlating field-measured resistivity anomalies with plausible subsurface conditions.
In addition, although this research was designed as a non-invasive geophysical survey, information from the landfill’s existing monitoring infrastructure was incorporated as a qualitative reference. The site is equipped with leachate collection wells and gas extraction points that are routinely monitored by the operator. While no new intrusive sampling campaigns were carried out for this study, records from these operational wells provided contextual evidence to support the interpretation of resistivity anomalies. In particular, leachate wells located near low-resistivity zones confirmed the presence of saturated and conductive materials, whereas gas extraction points in the vicinity of high-resistivity anomalies were consistent with the interpretation of potential biogas accumulations. This indirect validation helped strengthen the reliability of anomaly classification, while acknowledging that systematic integration of hydrogeochemical or compositional data will be necessary in future studies to fully cross-validate the geophysical results.

2.8. Volumetric Estimation of Gas from Resistivity Anomalies

To estimate the volume of potential gas accumulations, a geometric model based on triaxial ellipsoids was applied, fitted to high-resistivity anomalies (>100 Ω·m) identified in the three-dimensional electrical resistivity models. This approach is based on physico-mechanical criteria that describe the ellipsoidal morphology of gas bubbles in semi-solid media, where expansion is constrained by the structural anisotropy of the surrounding environment.
The volume V of each anomaly was calculated using Equation (2), which corresponds to the volume of a triaxial ellipsoid:
V = (4/3) ·π·a·b·c
where a, b, and c represent the major, intermediate, and minor semi-axes, respectively, determined from the lateral and vertical extent of the anomaly in the interpolated models. Measurements were performed directly on orthogonal cross-sections within the 3D environment using RES3DINV and Surfer v25 software, with a spatial resolution of ±0.5 m.
To ensure the robustness of this volumetric estimation, the triaxial ellipsoid fitting procedure was calibrated against reference resistivity thresholds reported in the literature. High-resistivity anomalies above 100 Ω·m were interpreted as potential gas accumulations, in line with classical geophysical criteria [46] and subsequent landfill studies that validated this threshold through geoelectrical monitoring [33,34]. Calibration was performed by constraining semi-axis measurements to orthogonal sections with a fixed spatial resolution (±0.5 m), ensuring that the ellipsoidal morphology reflected subsurface anisotropy rather than interpolation artifacts. To minimize misclassification, high-resistivity bodies were also cross-checked against lithological and operational information (e.g., cover soils and gas extraction wells), confirming that anomalies attributed to gas could not be explained by dry waste or gravel-rich horizons. Although no direct gas sampling was available, this indirect calibration—anchored in published thresholds and cross-validation with site infrastructure—provided a consistent methodological framework to approximate the volumetric extent of gas anomalies in closed landfill cells.

3. Results

3.1. Interpretation of Geophysical Models

3.1.1. Wenner Array Results

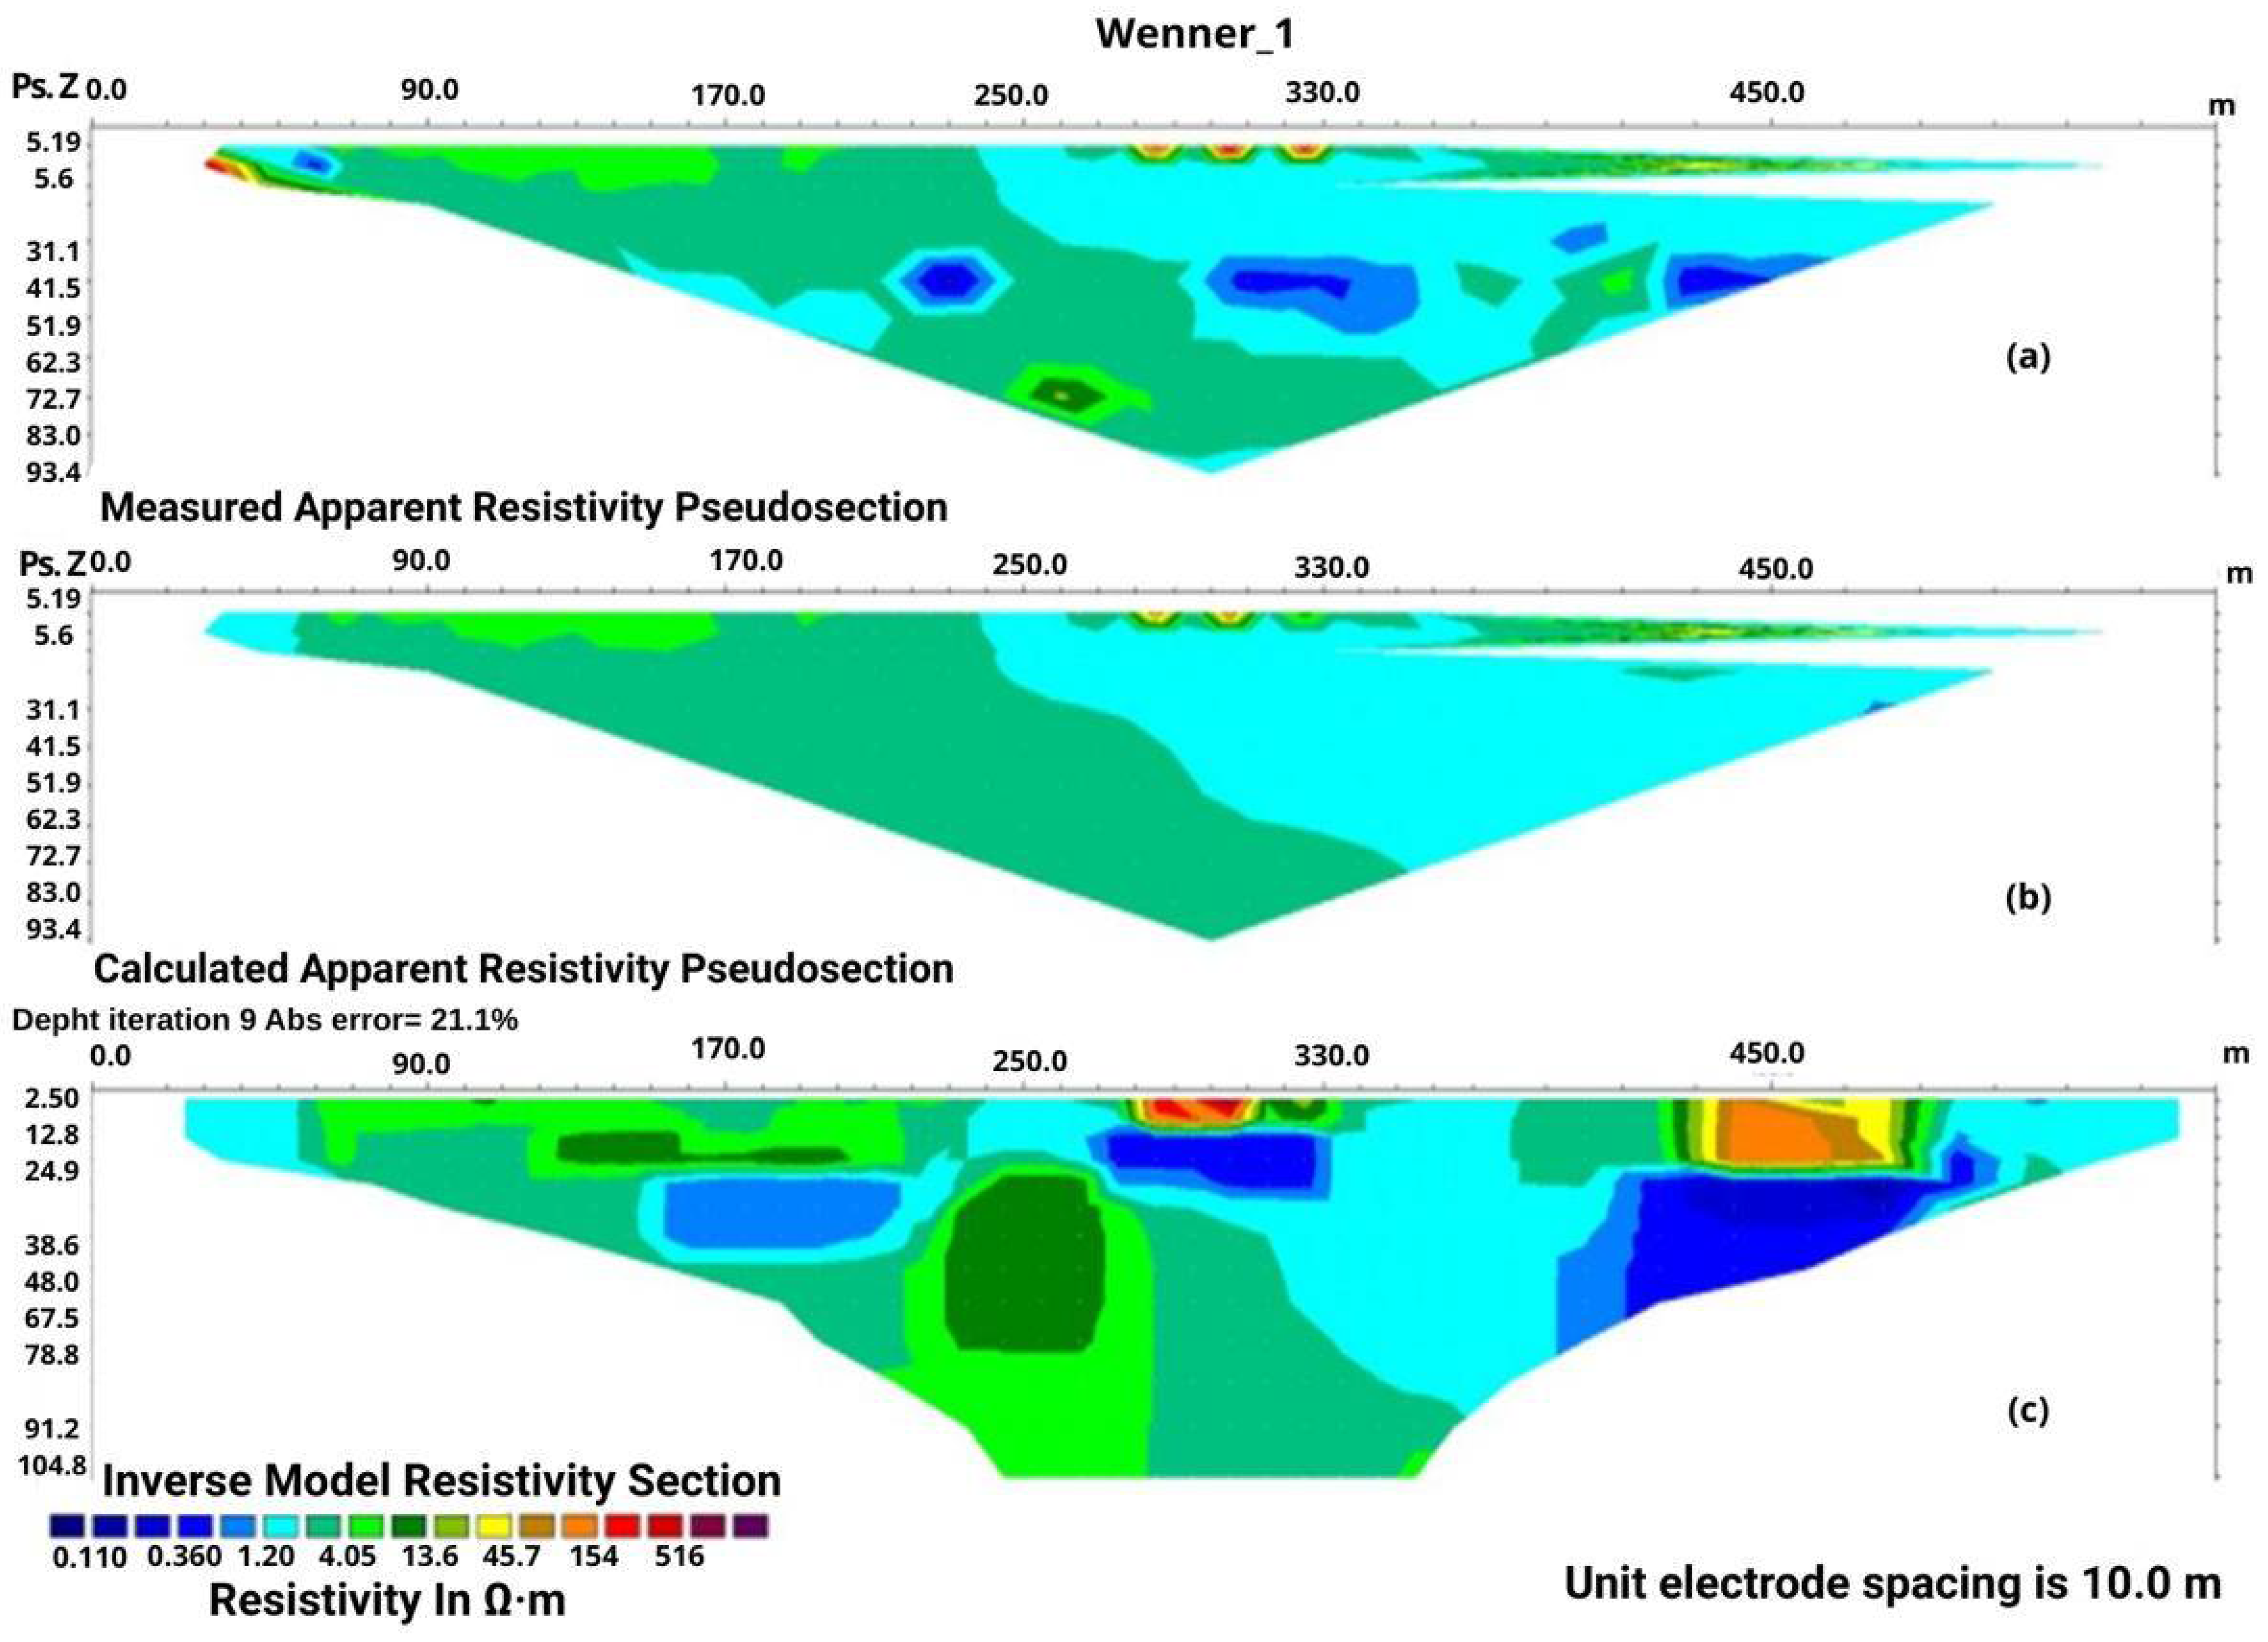
The Wenner array demonstrated a strong ability to resolve vertical stratigraphic contrasts within the tropical landfill. In the inverted sections, the uppermost layers exhibited resistivity values between 50 and 100 Ω·m, which are consistent with cover materials and compacted dry waste. Beneath these superficial horizons, conductive anomalies (<20 Ω·m) were recurrently identified at depths between 3 and 8 m, forming continuous subhorizontal bands across multiple profiles. These low-resistivity zones reflect high moisture content and ionic enrichment, conditions typically associated with leachate-impacted strata. The stratification confirms the Wenner array’s ability to resolve vertical layering and transitions between cover soils and saturated horizons. The inversion process, performed with RES2DINV, achieved an absolute error of 21.1%, confirming an acceptable level of model reliability for integration into higher-dimensional analyses (Figure 4; Supplementary Figures S1–S14).

3.1.2. Dipole–Dipole Array Results

The Dipole–Dipole array proved particularly effective in capturing lateral resistivity variations across the studied landfill. In several profiles—most prominently along lines 7 to 11—elongated conductive anomalies with resistivity values below 15 Ω·m were delineated. These anomalies extended laterally for tens of meters with irregular geometries, suggesting preferential pathways linked to basal sealing discontinuities or waste compaction heterogeneities. Compared to the Wenner array, the Dipole–Dipole configuration provided superior horizontal resolution, enabling a more detailed representation of lateral connectivity between conductive zones. The inversion models converged with a root mean square (RMS) error of 8.7%, which reflects both the robustness of the dataset and the suitability of this array for detecting shallow lateral heterogeneities in landfill environments (Figure 5; Supplementary Figures S15–S28).

3.1.3. Gradient Array Results

The Gradient array, while characterized by reduced vertical resolution, offered rapid acquisition and broad areal coverage, making it effective for preliminary screening of resistivity patterns. Inverted models revealed extensive low-resistivity zones (<20 Ω·m) concentrated along the peripheral sectors of the landfill cells. These anomalies were spatially consistent with edge-related infiltration, a pattern that suggests lateral leachate migration toward the boundaries of the engineered cells. Unlike the localized anomalies detected with the Dipole–Dipole array, the Gradient configuration emphasized broader conductive zones, reflecting its sensitivity to large-scale features rather than fine stratigraphic details. The inversion achieved convergence after nine iterations with an RMS error of 14.0%, which is within the expected range for landfill ERT surveys. These results underscore the value of the Gradient array as a complementary tool for delineating large-scale conductive anomalies that warrant subsequent, higher-resolution investigation (Figure 6; Supplementary Figures S29–S42).

3.1.4. Comparative Average Resistivity per Survey Line and Method

To complement the qualitative analysis of resistivity models obtained with the Wenner, Dipole–Dipole, and Gradient configurations, a statistical assessment of average electrical resistivity values per tomography line was performed. This analysis aimed to identify spatial patterns and contrasts associated with lithological or geochemical variations within the studied landfill. Resistivity values were extracted from the inversion models and processed using a Python 3.10 script, employing the Pandas and NumPy libraries to compute averages by line and method. The processed dataset was formatted as a table and exported in Excel (.xlsx) format to support subsequent analysis (Table 2).
The results reveal substantial variability in average resistivity values among methods. The Wenner configuration exhibited a range between 31.0 and 149.5 Ω·m. The Dipole–Dipole configuration recorded values ranging from 17.1 to 125.8 Ω·m, including the lowest resistivity measurements. The Gradient configuration yielded the highest values, surpassing 150 Ω·m in several lines (1, 2, 7, 8, 9, 13, and 14).

3.2. Spatial Analysis of Resistivity Distribution: Horizontal, Vertical, and Transverse Sections

The results presented in Figure 7, Figure 8, Figure 9, Figure 10 and Figure 11 correspond to integrated resistivity models constructed from the joint inversion of Wenner, Dipole–Dipole, and Gradient datasets. This multiconfigurational integration allowed the complementary sensitivities of each array to be combined, thereby enhancing both vertical and lateral resolution and reducing interpretive uncertainty compared to single-array models.

3.2.1. Shallow Horizontal Section (0–5 m)

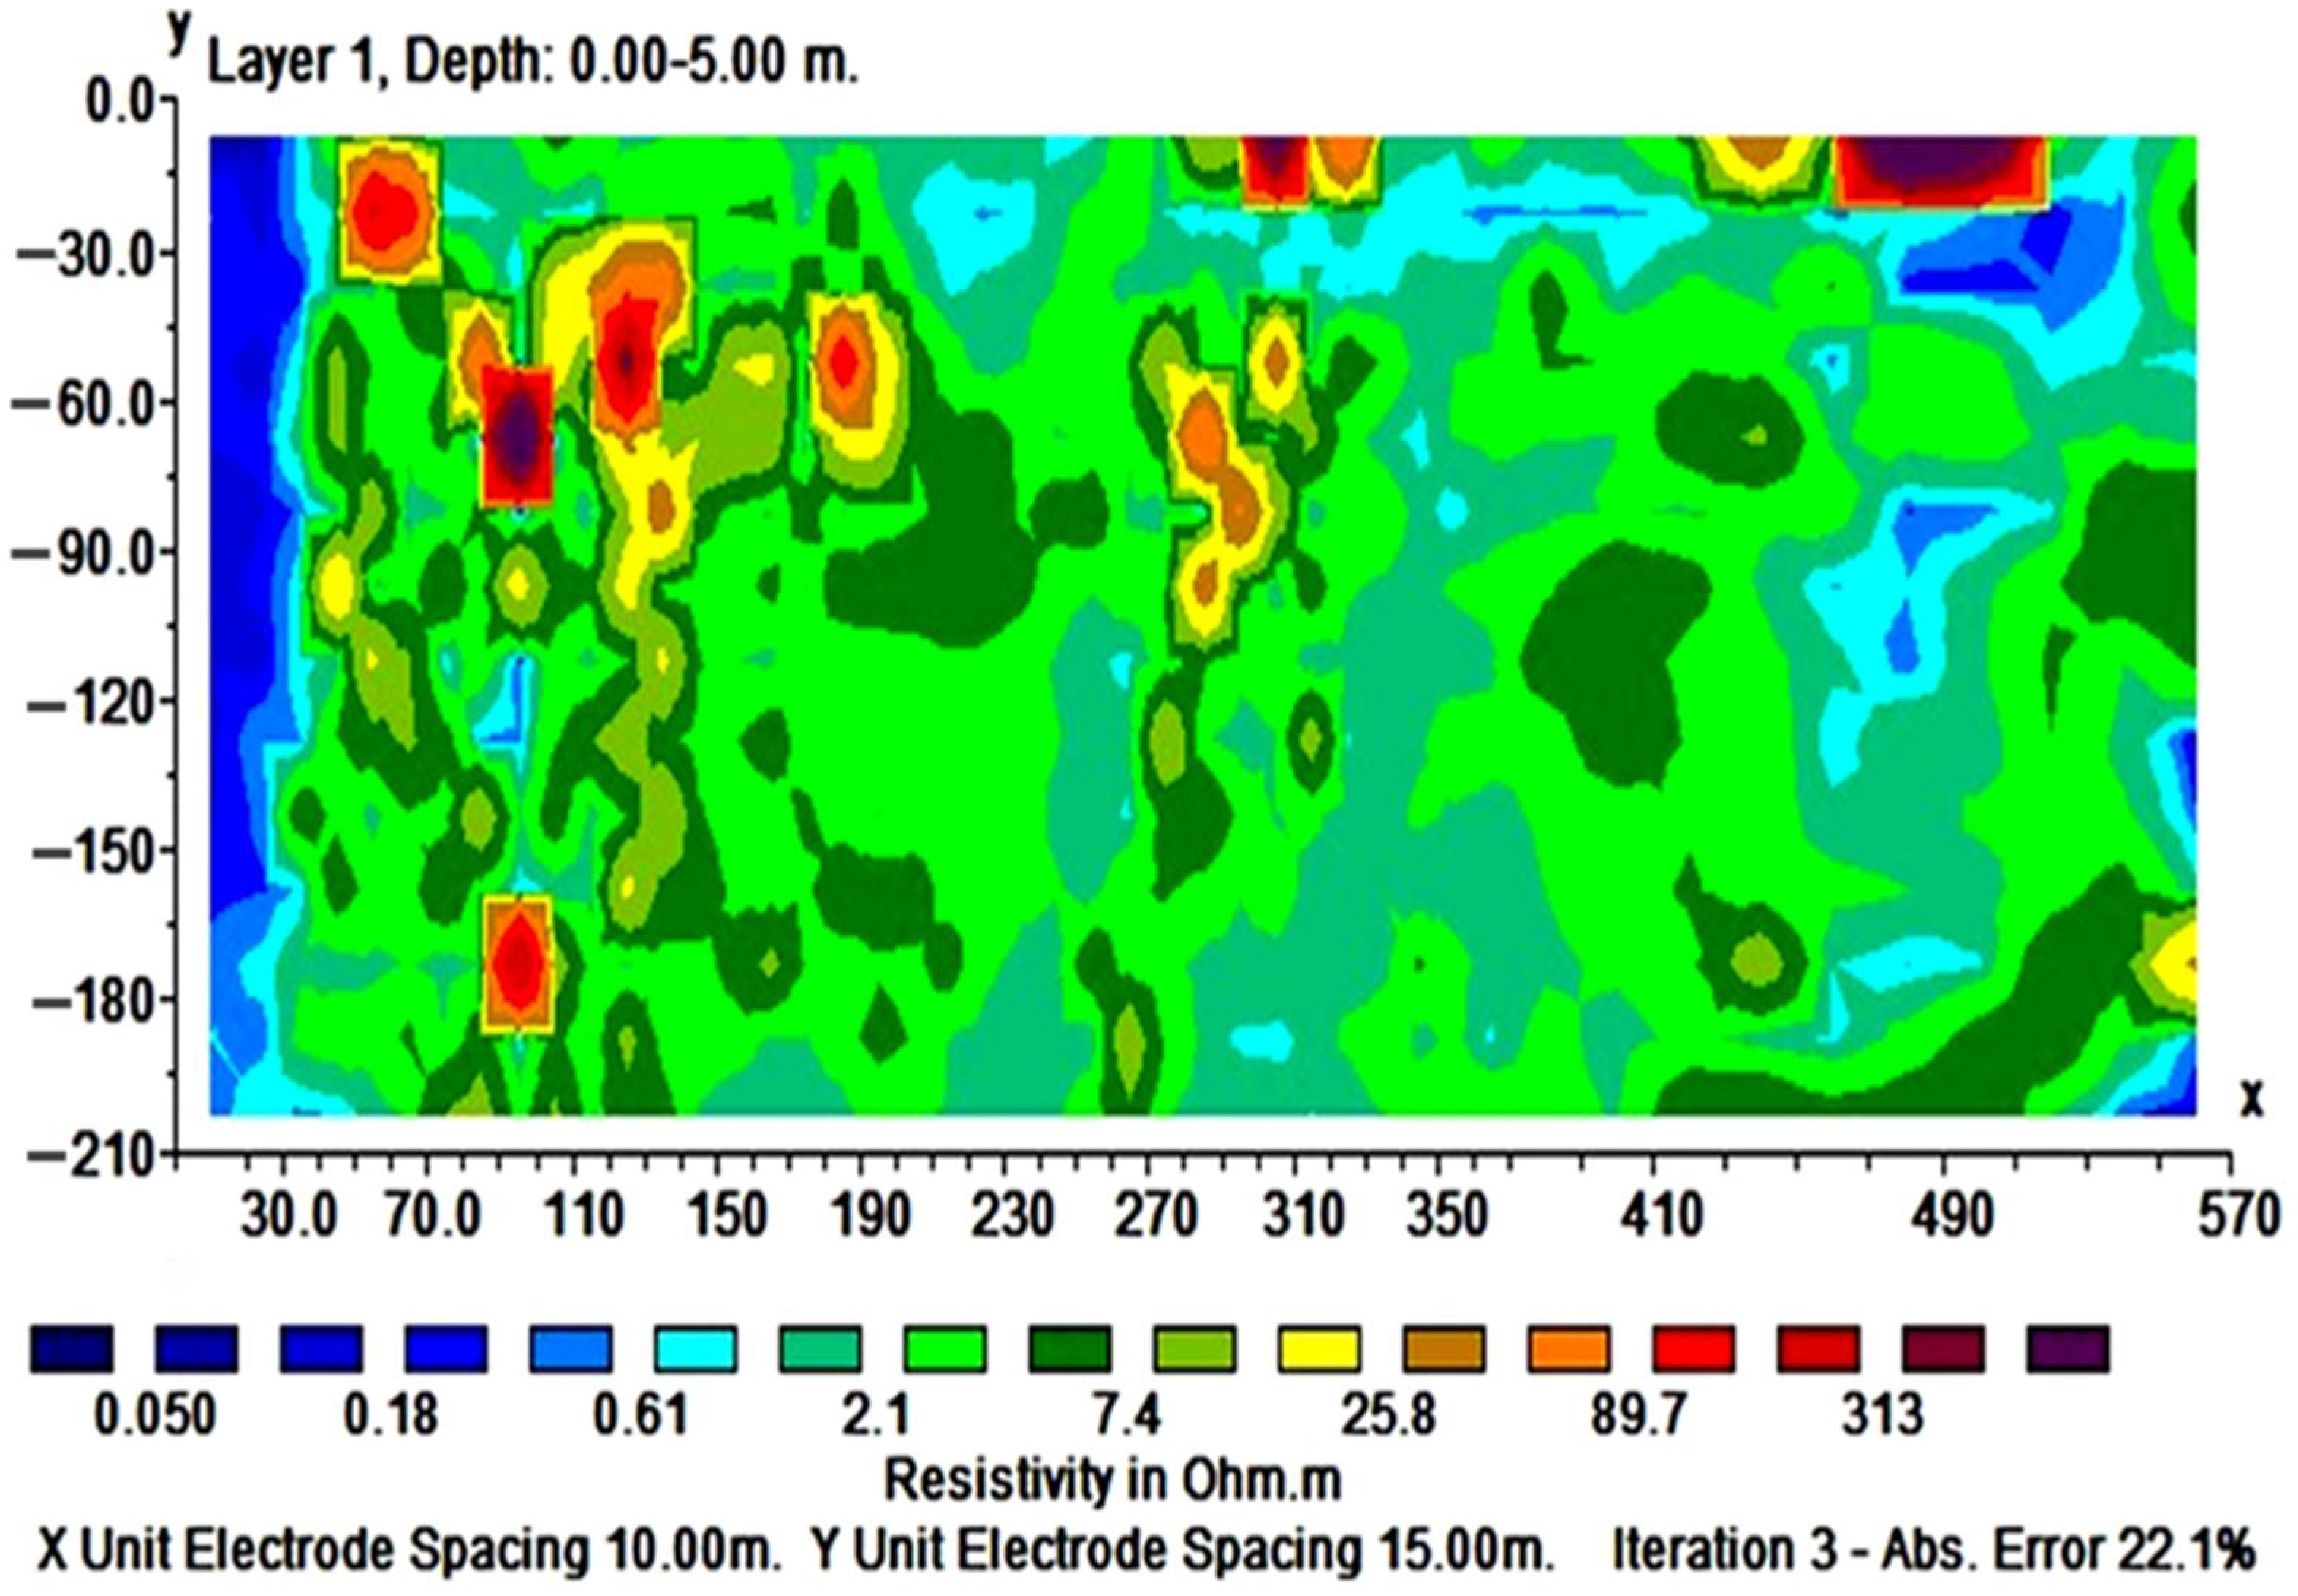
The horizontal resistivity slices (0–5 m depth) derived from integrated 3D inversion revealed the presence of extensive conductive anomalies ranging between 0.05 and 2.1 Ω·m. These anomalies were laterally continuous across the southeastern and central sectors of the landfill, delineating shallow horizons with elevated ionic content. Their geometry suggested near-surface leachate accumulation zones that extend laterally toward the periphery of the cells. In contrast, resistive anomalies (>89.7 Ω·m) were observed in localized clusters, mainly in the southwestern sector, and were interpreted as drier fill zones or areas influenced by biogas generation. The inversion yielded an RMS error of 22.1%, which, although higher than that of single-array inversions, remained within the expected range for integrated models and provided sufficient reliability to support spatial interpretation (Figure 7).

3.2.2. Representative Vertical Section

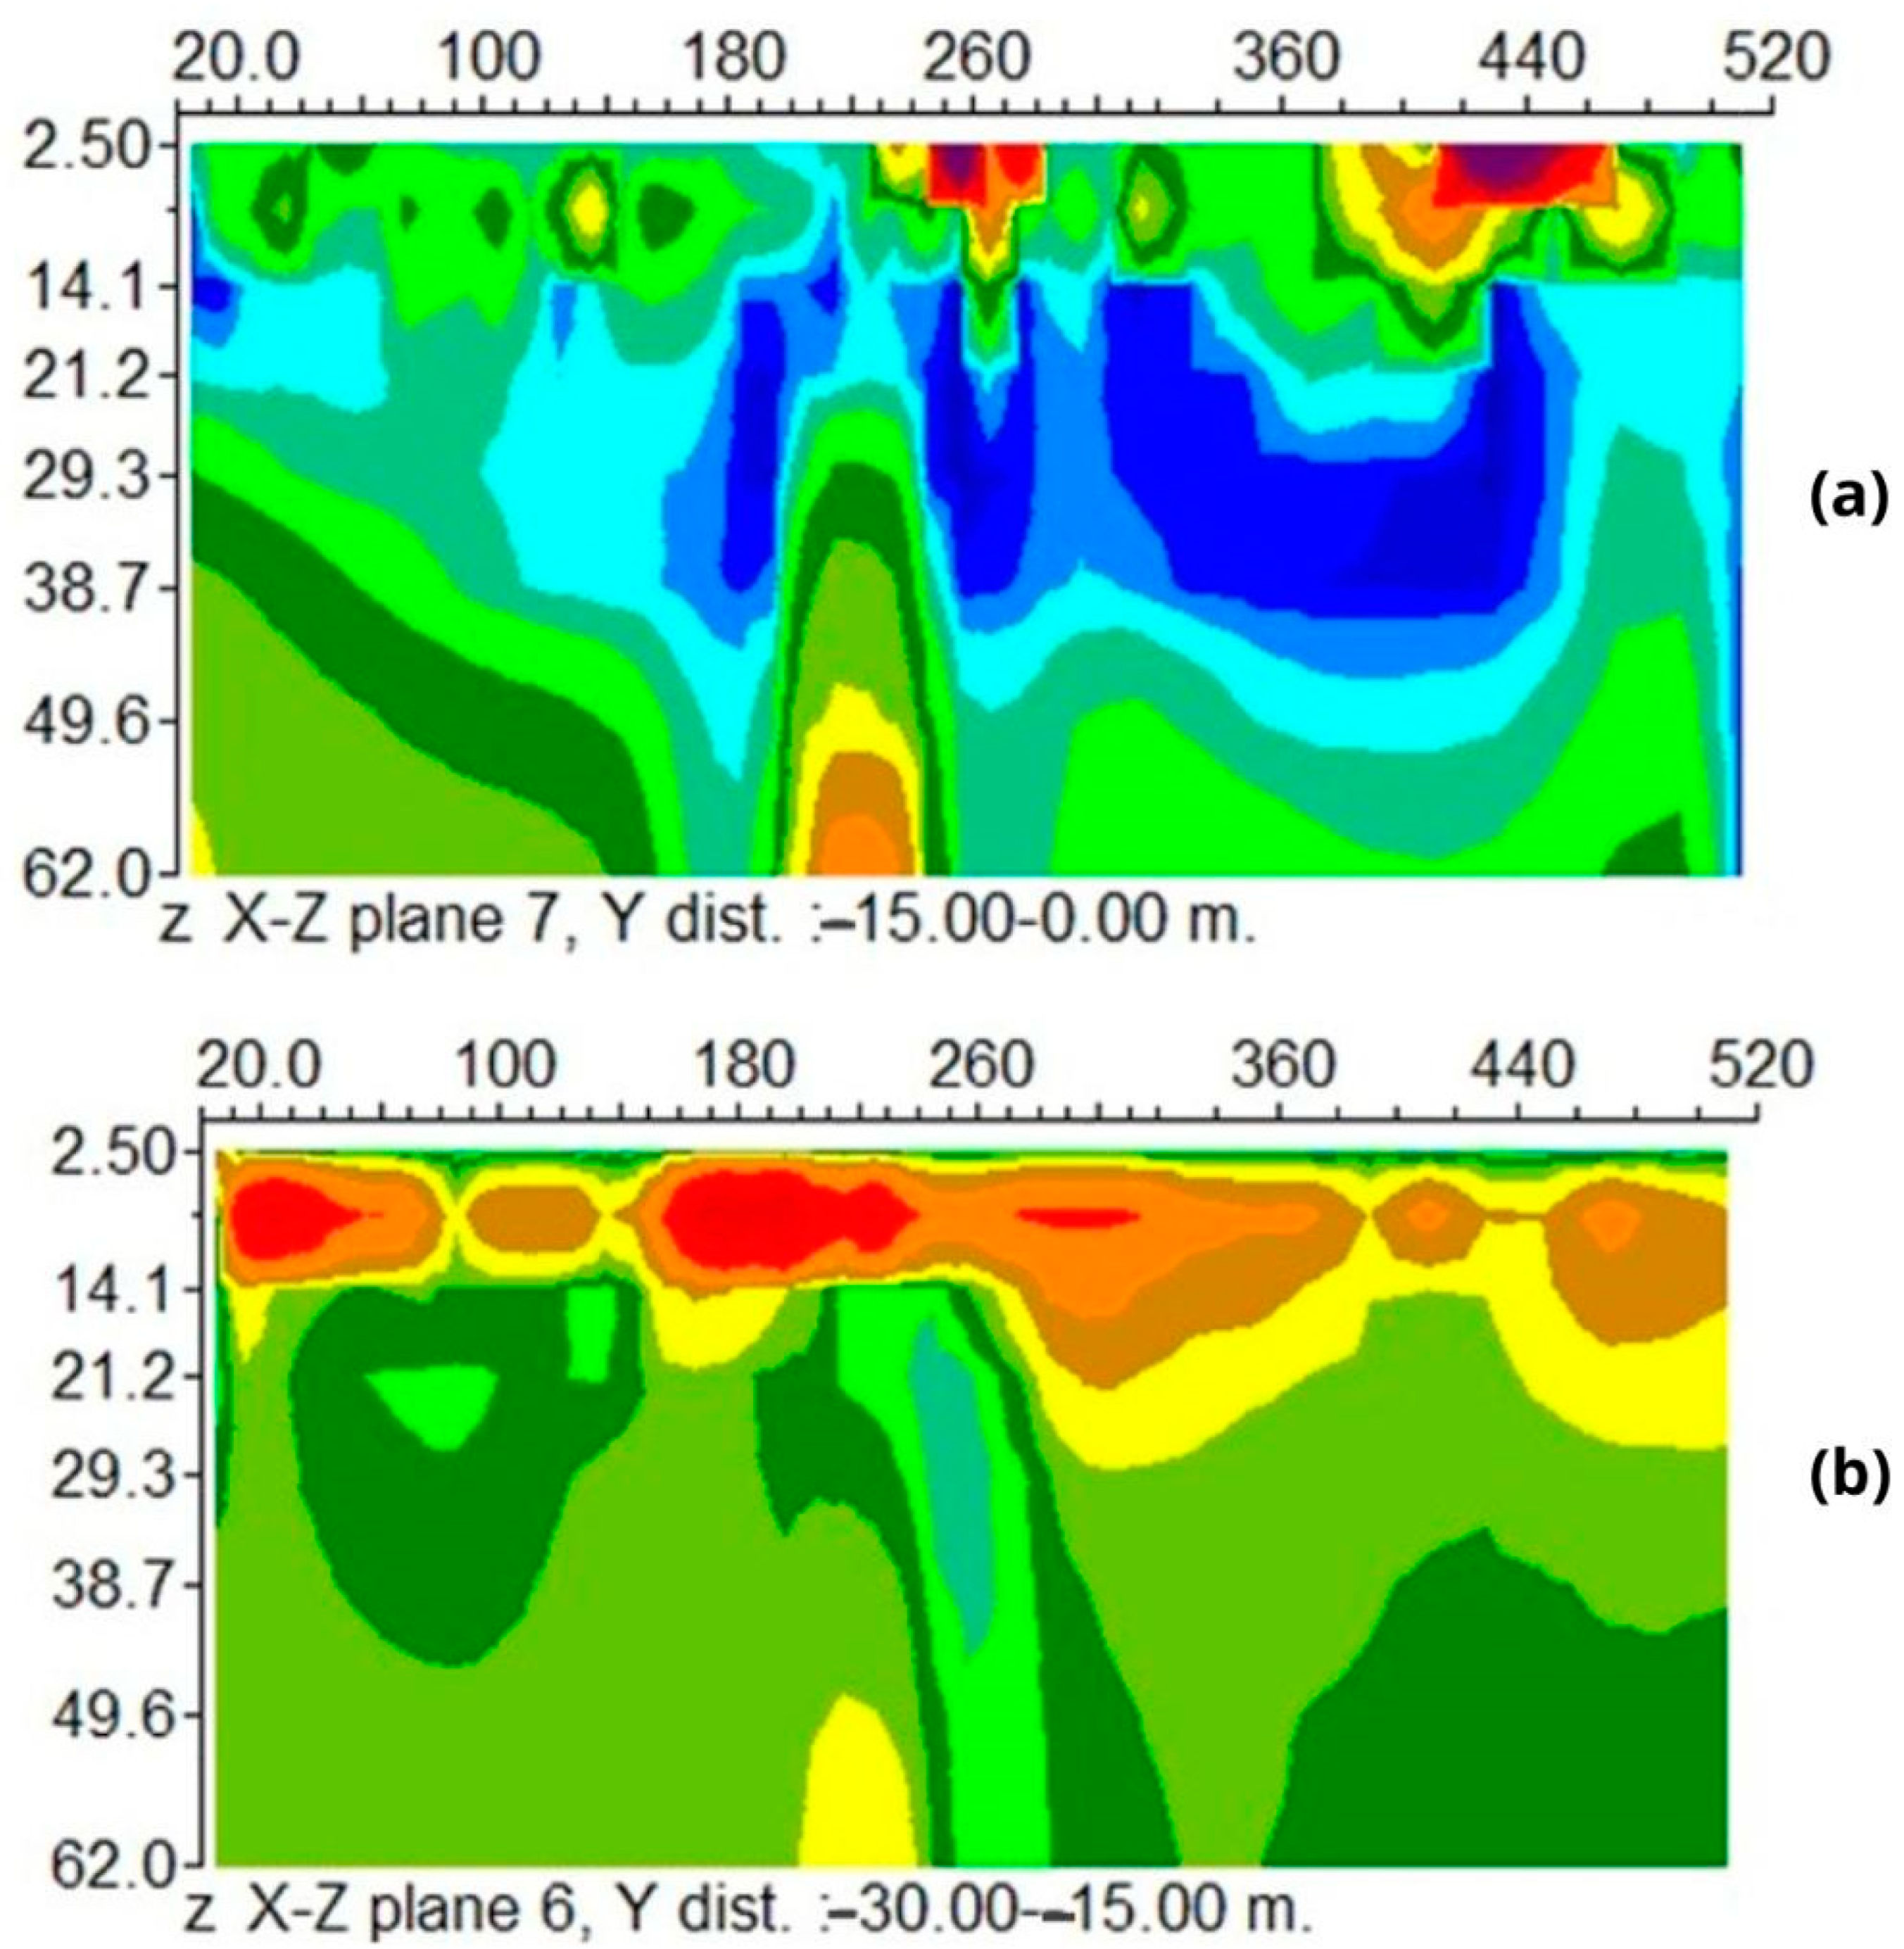
Vertical cross-sections of the 2.5D resistivity models highlighted stratigraphic transitions consistent with the geological context of alternating sandstone and claystone horizons. Resistivity values spanned from 13.6 to 45.7 Ω·m, reflecting moderately cemented layers, while conductive anomalies with values <2.1 Ω·m were recurrently detected at depth, suggesting vertical leachate percolation. These features were most pronounced in the central profiles, where conductive anomalies extended downward to depths of ~25–30 m, indicating possible pathways for leachate migration beyond superficial horizons. The integration of vertical slices thus provided a more nuanced view of stratigraphic variability and enhanced the delineation of subsurface conductive features compared to isolated 2D models (Figure 8).

3.2.3. Transverse Section

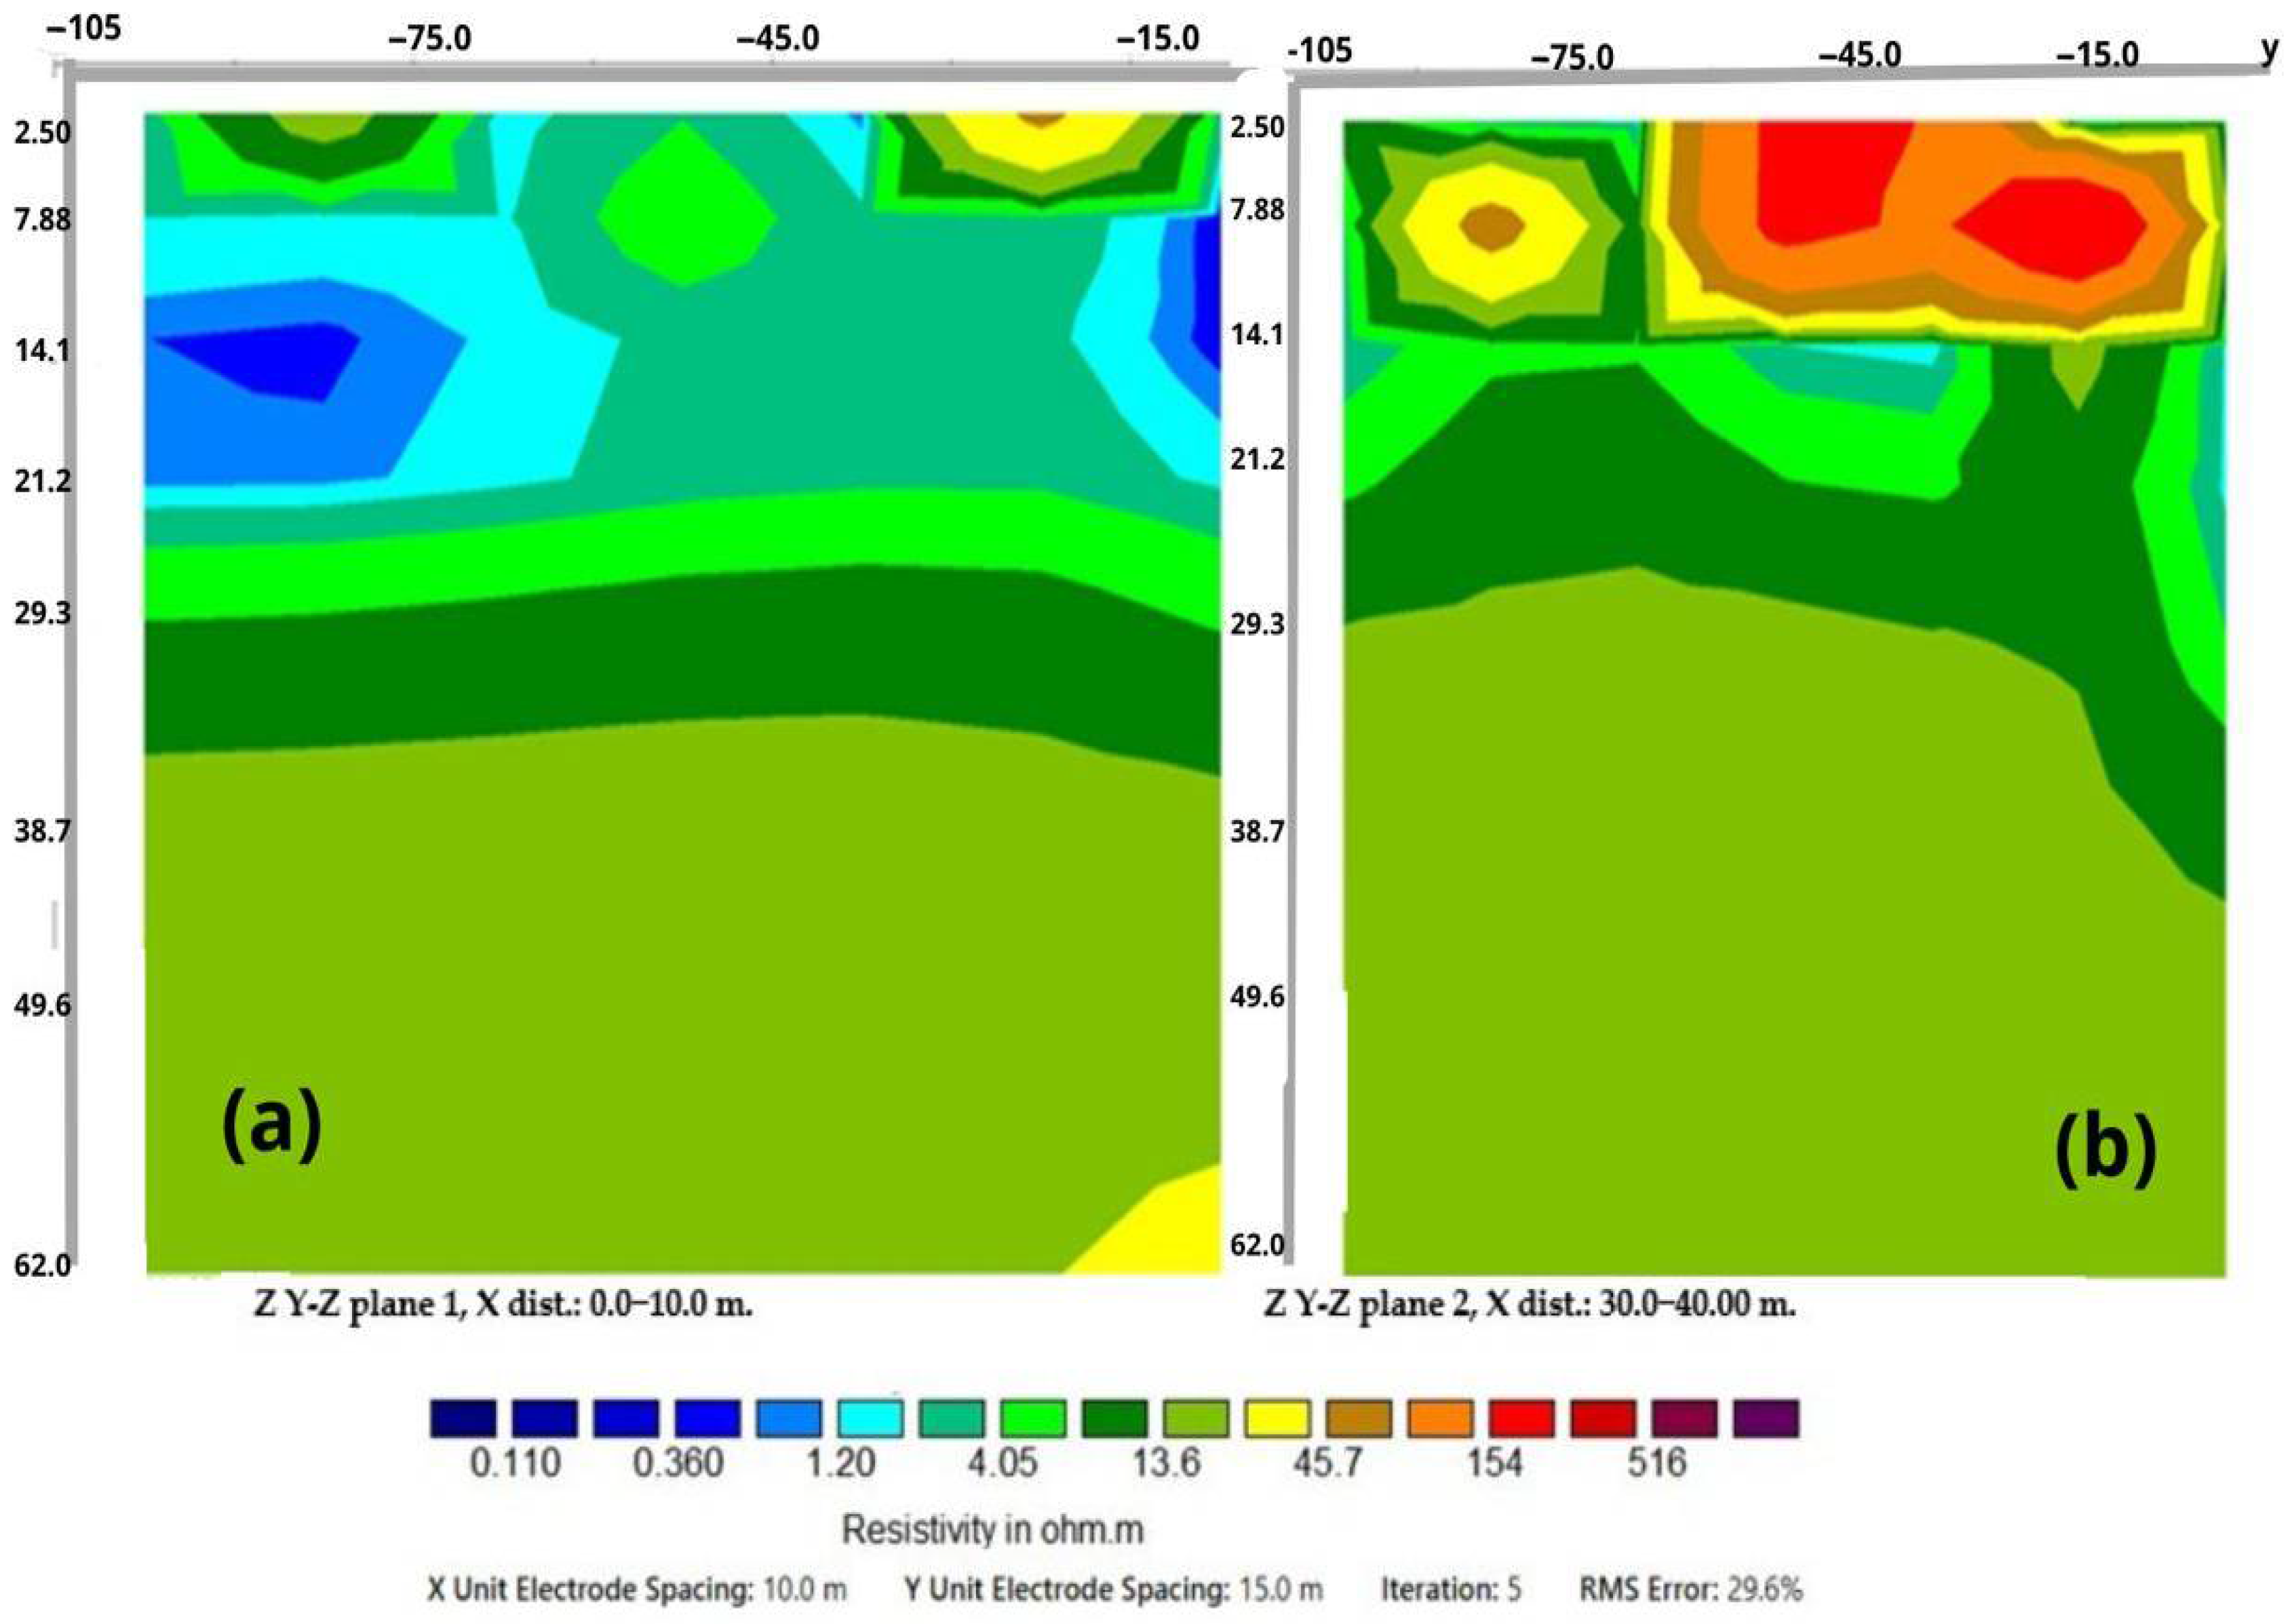
Transverse Y–Z sections revealed the vertical superposition of conductive and resistive zones, highlighting their spatial interrelationships. Conductive horizons (<13.6 Ω·m) dominated the upper 10–15 m, particularly near the landfill flanks, while underlying resistive anomalies (>89.7 Ω·m) were detected at intermediate depths (20–40 m). These patterns indicate leachate-impacted layers above and gas-bearing or compacted waste horizons below. The models converged with an RMS error of 20.9%, confirming the stability of the inversion and supporting the reliability of these patterns for subsequent environmental interpretation (Figure 9).

3.2.4. D Volumetric Model

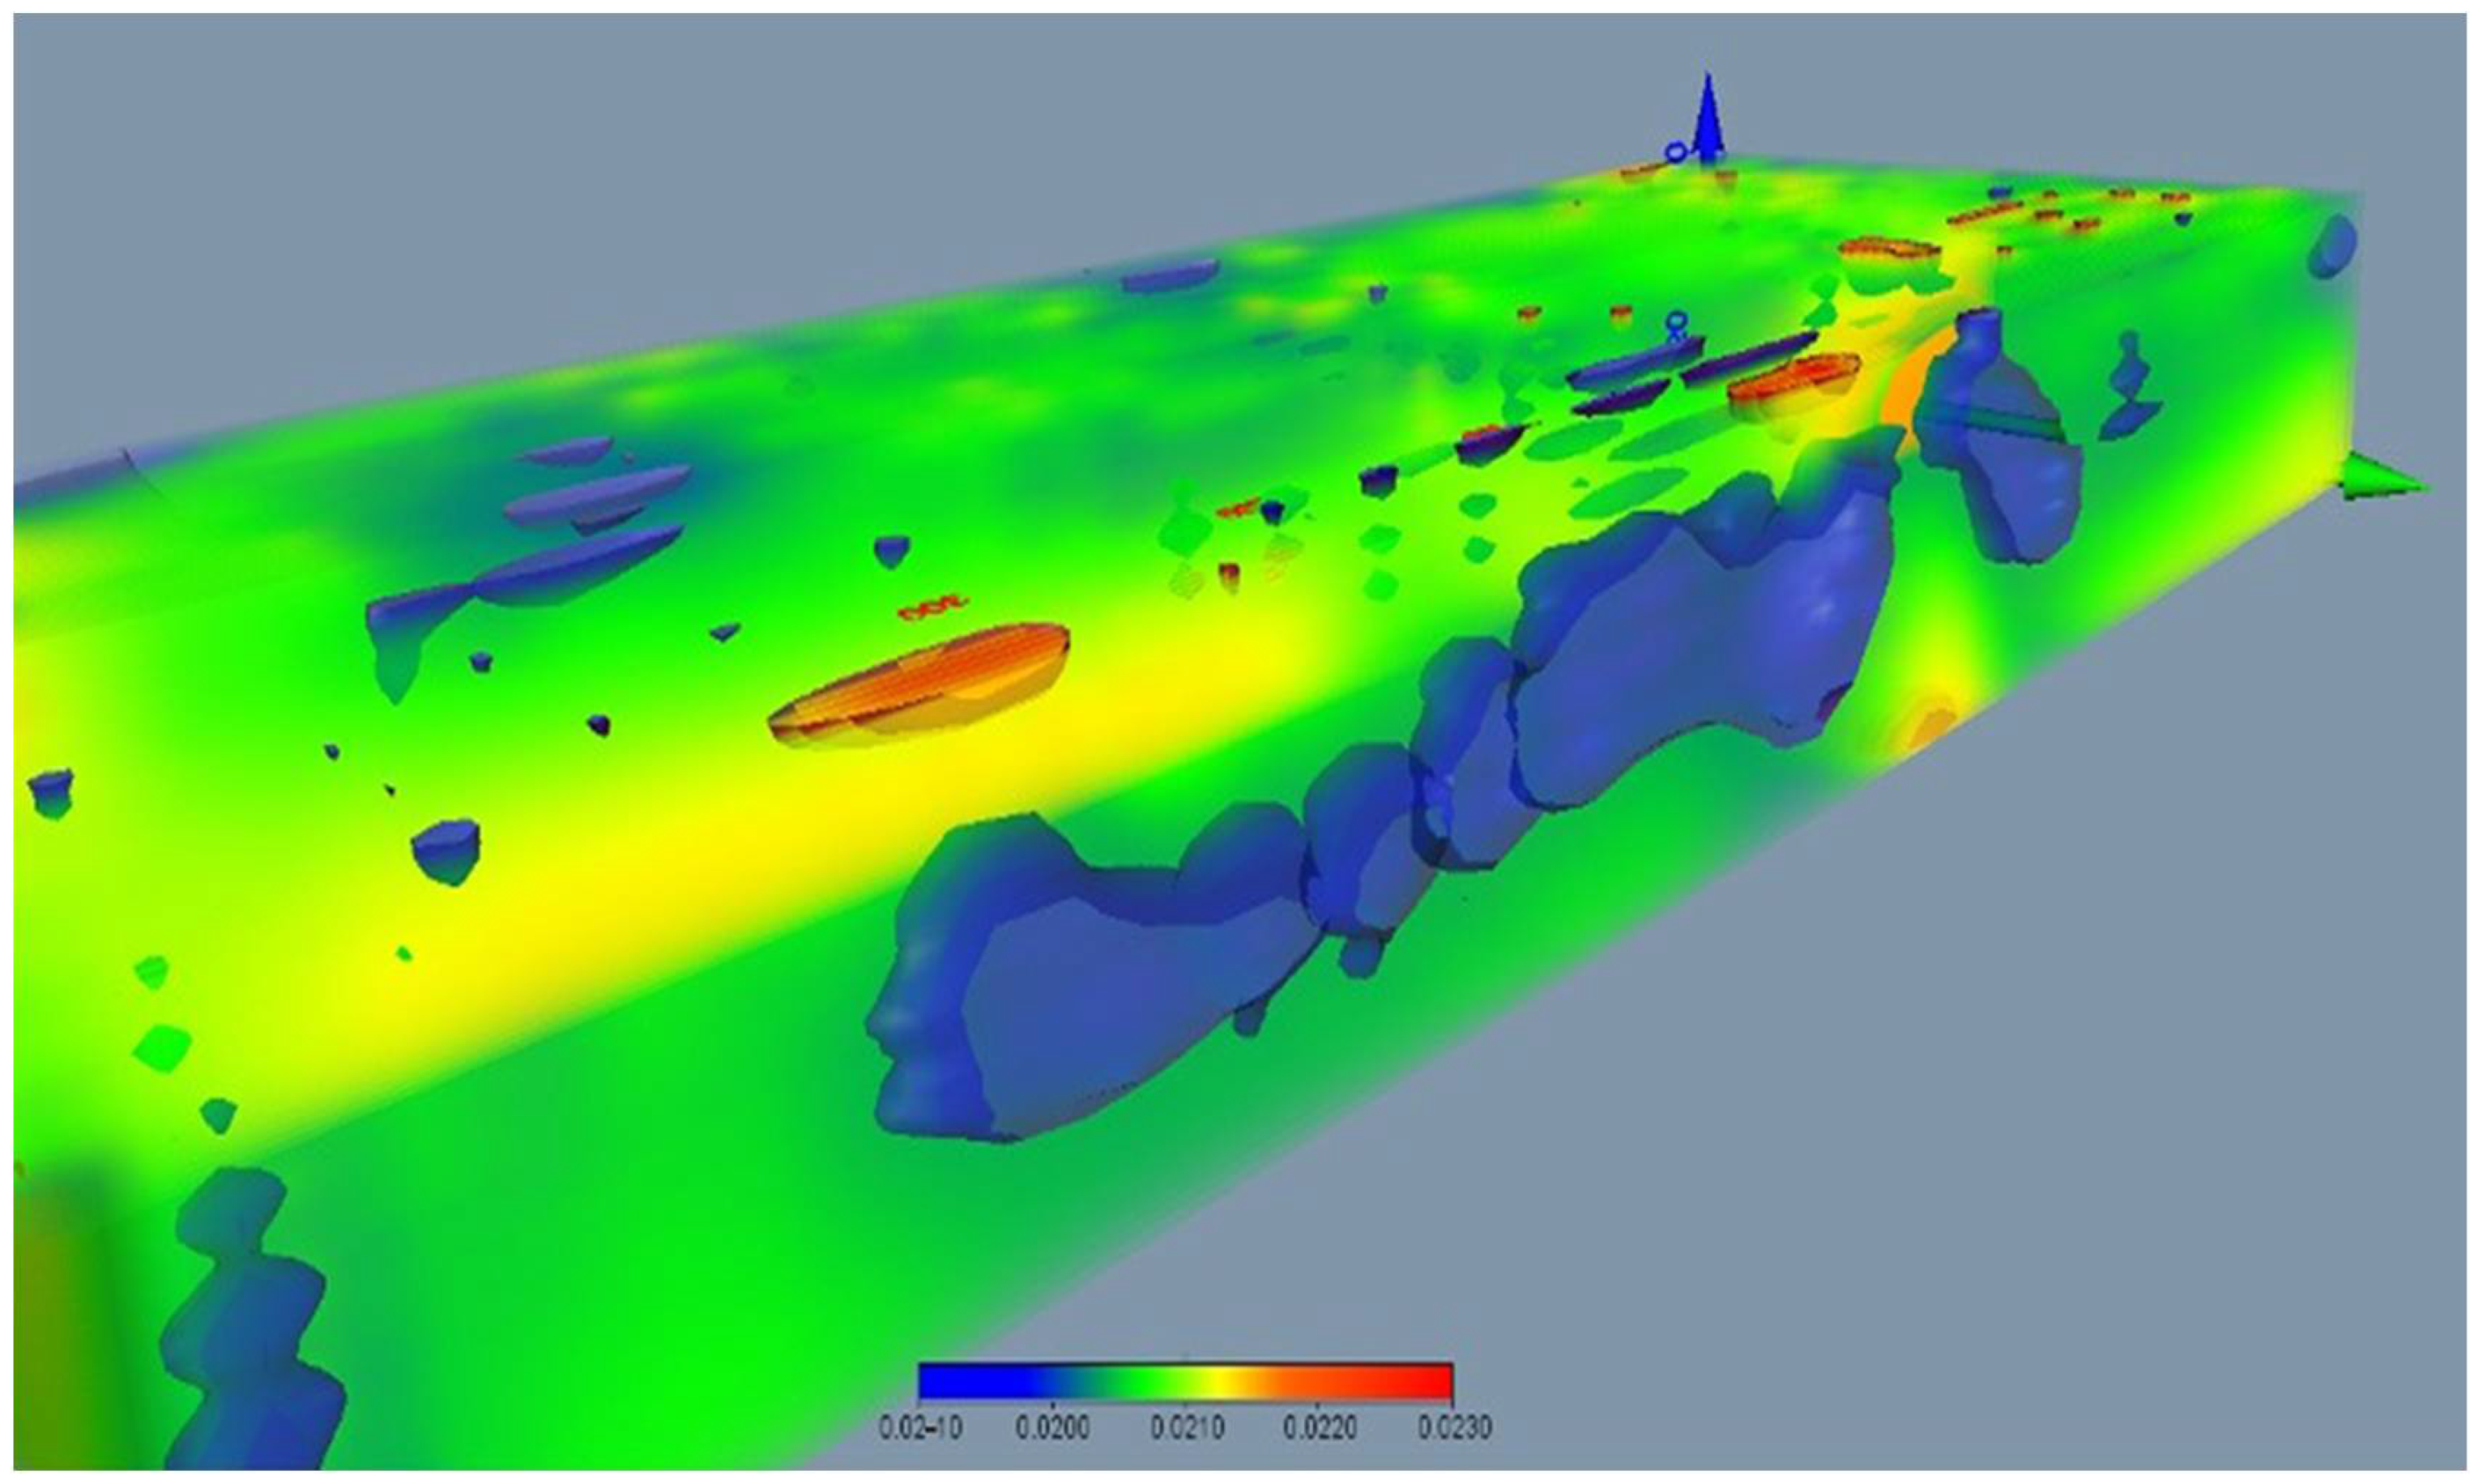
The three-dimensional resistivity model, constructed from RES3DINVx64-derived meshes and visualized in Voxler 4.0, enabled the spatial integration of anomalies across the closed landfill cells. Conductive volumes with values below 1.2 Ω·m were mapped predominantly in the southeastern cell, where they formed laterally continuous bodies indicative of extensive leachate saturation. In contrast, resistive anomalies exceeding 154 Ω·m appeared as discrete, ellipsoidal volumes located mainly in the southwestern sector, at intermediate depths of approximately 15–30 m, and were interpreted as confined biogas accumulations. Transparency filters enhanced the visibility of these thresholds, emphasizing their morphology and spatial context within semi-saturated waste matrices. Compared with 2D and 2.5D sections, the volumetric integration provided a higher-resolution framework for assessing the coexistence of conductive and resistive phases, offering a more comprehensive perspective on subsurface heterogeneity in tropical landfill conditions (Figure 10).

3.3. Volumetric Estimation of Gas Accumulations Based on Electrical Resistivity

The integration of 3D geophysical models obtained through ERT enabled the identification of five discrete resistive bodies with values exceeding 100 Ω·m, interpreted as potential gas accumulations. These anomalies were primarily located in the southwestern sector of the studied landfill and at intermediate depths, which is consistent with the generation and confinement dynamics of biogas in semi-saturated waste matrices.
To estimate the gas-influenced volume of each anomaly, a triaxial ellipsoidal geometry was fitted using Equation (2), as described in the methodology section. The semi-axis dimensions (a, b, c) were determined from horizontal and vertical slices of the interpolated resistivity models processed with RES3DINV and Surfer v25 [39].
Figure 11 presents the planimetric distribution of the identified anomalies in the superficial layer (0.00–5.00 m), with points P1 to P5 representing high-resistivity zones. The image is color-coded logarithmically to represent the resistivity spectrum, ranging from 0.050 Ω·m (blue) to 570 Ω·m (purple). Lower resistivity zones (<2.1 Ω·m) are associated with saturated leachate, while high-resistivity zones (>89.7 Ω·m) correspond to possible gas accumulations or dry compacted waste. The spatial resolution used for this model was 10 m in the X-direction and 15 m in the Y-direction, and the model was generated from the interpolated 3D mesh using Voxler and Surfer.
The volumetric estimations of each anomaly are summarized in Table 3, based on the fitted ellipsoidal geometries. The total estimated volume of these gas accumulation zones amounts to 20,208 m3, which represents approximately 1.09% of the total modeled landfill cell volume (~1,860,000 m3) [43].

4. Discussion

4.1. Implications of Geophysical Models in Landfill Characterization

4.1.1. Wenner Configuration

The results obtained with the Wenner array are consistent with its theoretical characteristics, as this configuration is recognized for its high vertical resolution due to symmetrical electrode coupling [37]. Recent studies have reinforced its applicability in landfill environments. For instance, [47] reported that the Wenner method was essential for identifying leachate accumulation zones within intermediate layers of valley-type landfills in China, achieving over 90% accuracy when compared with geochemical borehole data. Similarly, research in Nigeria [48] and Germany [49] has demonstrated that the Wenner configuration performs effectively in heterogeneous tropical landfills, where variations in waste compaction and moisture content generate strong vertical resistivity contrasts. Reference [34] further emphasized that the vertical resolution of this method is critical for identifying leachate-saturated zones and delineating operational interfaces, such as transitions between partially saturated and methane-rich layers.

4.1.2. Dipole–Dipole Configuration

These findings are consistent with the theoretical principles of the Dipole–Dipole configuration, known for its high sensitivity to lateral contrasts and its ability to detect inclined or irregularly shaped structures [37]. Several studies have reinforced its applicability in landfill settings. For instance, ref. [47] employed this configuration to map lateral leachate pathways in valley-type landfills in China, where structural variations in geomembranes and poorly compacted zones generated preferential flows that were clearly captured in Dipole–Dipole profiles. Similarly, ref. [49] in Germany reported that this array facilitated the identification of lateral leachate accumulation zones in old urban landfills, providing critical input for redesigning extraction and control systems.
In tropical environments, ref. [48] documented that the Dipole–Dipole method is particularly effective in characterizing lateral flows triggered by extreme rainfall events, where the hydrological regime promotes horizontal contaminant migration through heterogeneous interfaces. Moreover, ref. [34] emphasized that this configuration is valuable for complementing 3D volumetric models, as it refines the delineation of preferential trajectories and bypass zones in landfill sealing systems.
The comparative performance across arrays further highlights the strengths of the Dipole–Dipole configuration. In this study, it provided the highest lateral precision (RMS error = 8.7%), whereas the Wenner and Gradient arrays yielded higher errors of 21.1% and 14.0%, respectively. Other electrode arrangements, such as pole–dipole and nonconventional 3D arrays [25], have also been successfully applied in landfill contexts, demonstrating complementary strengths for delineating deeper or irregular contaminant pathways. Collectively, these comparisons confirm that integrating multiple arrays enhances the robustness of geoelectrical characterization in landfills.

4.1.3. Gradient Configuration

The results confirm the theoretical limitations and strengths of the Gradient array. While it provides reduced vertical resolution compared to Wenner or Dipole–Dipole [37], its capacity for rapid and extensive coverage makes it suitable for preliminary diagnostics in landfill environments.
Recent studies have reinforced this role. Lu et al. [47] demonstrated the usefulness of the Gradient configuration for detecting conductive anomalies related to fractures or failures in containment systems, particularly in older dumpsites with limited construction records. Ibraheem et al. [49] highlighted that when combined with 3D modeling, the Gradient method enables the identification of peripheral infiltration zones that may remain undetected in centralized 2D profiles. In urban landfill settings, these lateral infiltration zones are critical contamination pathways toward adjacent aquifers.
In tropical regions, ref. [48] applied the Gradient method following extreme rainfall events, showing its value for rapid evaluation of leachate migration. Similarly, ref. [34] argued that although the Gradient array may not provide detailed internal resolution of waste deposits, its ability to detect edge anomalies and transitional zones is essential for designing subsequent, more detailed monitoring programs.
At the studied site, the identification of edge-related low-resistivity zones (<20 Ω·m) is consistent with the ranges reported by [33] as indicators of active lateral infiltration. This finding underscores the importance of considering reinforcement strategies in boundary areas to mitigate hydrogeological risk.

4.1.4. Average Resistivity Distribution by Survey Line and Geophysical Method

The variability observed across methods highlights the distinct sensitivities of each geophysical configuration. The Wenner array demonstrated a balanced capacity to capture vertical heterogeneities, consistent with its symmetrical electrode arrangement. In contrast, the Dipole–Dipole configuration confirmed its higher sensitivity to lateral contrasts, as reflected in the lower values obtained along several survey lines. Meanwhile, the Gradient array displayed greater sensitivity to deeper features, producing the highest resistivity averages, particularly in profiles located near the landfill boundaries.
These findings are consistent with graphical observations from the inverted models, which also revealed marked vertical and lateral contrasts in the surveyed zones. The complementarity of the applied configurations underscores the importance of employing a multi-method approach in geoelectrical studies of landfills in tropical environments. Such integration enables a more robust and three-dimensional understanding of subsurface behavior, aligning with previous evidence that multi-array strategies enhance both the resolution and reliability of landfill characterization [33].

4.2. Spatial Implications of Integrated Resistivity Models

4.2.1. Shallow Horizontal Patterns and Leachate Dynamics

The detection of shallow, highly conductive zones (<2.1 Ω·m) is consistent with findings from pseudo-3D surveys in landfills of northern Argentina [30], where leachate accumulation was linked to ionic enrichment under humid climatic regimes. In tropical landfills, shallow saturation is often enhanced by seasonal rainfall and organic-rich waste, reinforcing the need for targeted monitoring and control strategies [47,48,49].

4.2.2. Vertical Stratigraphy and Preferential Flow

The vertical sections confirmed stratigraphic contrasts resembling the Las Perdices Formation, characterized by alternating sandstone and claystone layers [37]. Such geoelectrical heterogeneity reflects depositional variability typical of fluvio-lacustrine environments. Similarly to previous studies [34,46], the presence of low-resistivity anomalies at depth suggests preferential infiltration pathways, supporting the hypothesis of active leachate migration toward deeper horizons. A particularly relevant strength of this study is that stratigraphic logs from the site, which confirm the presence of clay-rich and sandstone-rich horizons consistent with the resistivity contrasts observed, explicitly supporting these interpretations. This geological validation provides robust evidence for the classification of anomalies, reduces interpretive ambiguity, and underscores the reliability of the integrated resistivity models.

4.2.3. Transverse Contrasts and Gas–Leachate Interactions

The coexistence of conductive and resistive anomalies in transverse profiles aligns with observations in long-operating tropical landfills (>20 years) [48,49]. These patterns highlight vertical stratification of liquid and gaseous phases, a condition that can compromise the effectiveness of containment systems and biogas recovery [34]. The detection of high-resistivity zones (>89.7 Ω·m) directly below conductive anomalies underscores the relevance of integrated 3D monitoring to evaluate risks for geotechnical stability and gas management. It should be emphasized that the interpretation of integrated resistivity models involves inherent uncertainties. Electrical resistivity is an indirect parameter affected not only by moisture content and ionic strength but also by lithological variability, compaction, and seasonal hydrological dynamics. In tropical landfill settings, these factors generate overlapping resistivity ranges, complicating the discrimination between leachate-saturated horizons, natural clay-rich strata, and dry waste deposits. Although the combined use of Wenner, Dipole–Dipole, and Gradient arrays, together with 2.5D and 3D inversions, enhances resolution and reduces ambiguity, residual uncertainty persists in anomaly classification. The absence of systematic hydrogeochemical and lithological sampling further limits cross-validation, underscoring that volumetric resistivity models should be considered robust yet probabilistic representations of subsurface heterogeneity rather than deterministic images.

4.3. Insights from 3D Volumetric Modeling

The use of 3D volumetric modeling provided an advanced perspective for interpreting contaminant migration and gas accumulation processes. Unlike 2D representations, three-dimensional models enable the identification of complex interaction zones between liquid and gaseous phases, which are particularly relevant in heterogeneous tropical landfill environments [33,48,49].
The resistivity thresholds identified in this study align with previous research. For example, ref. [30] reported values below 2 Ω·m in Chinese landfills associated with leachate infiltration into fractured substrates. Similarly, [34] emphasized that volumetric delimitation is critical for optimizing biogas collection and designing remediation strategies in operational and post-closure settings.
The correlation of high-resistivity anomalies (>154 Ω·m) with gas accumulations is consistent with European studies [49], which demonstrated that resistivity variations are influenced by both methane content and waste compaction. These parallels strengthen the interpretation of the resistive anomalies observed in the Colombian Caribbean landfill.
Finally, integrating volumetric resistivity models with hydrogeological and geochemical datasets in future studies will contribute to building a more robust conceptual model of landfill dynamics, supporting both environmental risk assessment and the design of sustainable management strategies.

4.4. Significance of Volumetric Gas Estimations

Although the volumetric proportion of gas-affected zones (≈1.09%) is relatively small, their spatial concentration in confined areas has critical implications. Localized gas accumulation can generate pressure build-up, potentially compromising geotechnical stability and containment barriers. These findings highlight the importance of strategically designing biogas extraction systems to mitigate localized risks.
Comparable studies show that volumetric ERT modeling is useful for optimizing gas management strategies. For example, Godio et al. [34] emphasized the role of volumetric delimitation in enhancing biogas collection efficiency, while European studies [49] validated the correlation between high-resistivity anomalies (>154 Ω·m) and methane-rich zones. These parallels strengthen the interpretation of resistive anomalies as confined gas accumulations in the studied landfill.
Future research should integrate hydrogeochemical analyses and direct gas composition data to refine volumetric models and validate the biogas generation dynamics. Such integration would advance the development of predictive frameworks for landfill gas management under tropical conditions.

4.5. Environmental Diagnosis and Monitoring in Hydrogeological Risk Contexts

The studied landfill is located within a Caribbean alluvial plain composed of alternating sandstones and claystones of the Las Perdices Formation, a setting that confers significant hydrogeological vulnerability due to the presence of shallow, unconfined aquifers with relatively high permeability. In similar geological environments, previous studies have demonstrated that leachate migration can occur both vertically and laterally, thereby posing risks to groundwater resources and surrounding agricultural or residential areas [48,50].
The application of ERT in closed landfill cells, as demonstrated in this study, provides a valuable tool for identifying active zones of leachate accumulation and gas retention that remain undetectable with conventional monitoring systems. This capacity is particularly relevant in post-closure phases, where surface cover layers and waste consolidation hinder the installation of intrusive monitoring devices [43,48].
Moreover, these findings align with the requirements of the Colombian Ministry of Environment, which mandates the identification of leachate pathways, gas accumulation zones, and potential barrier failures as part of official monitoring protocols for sanitary landfills. By integrating ERT into post-closure surveillance, this research not only supports compliance with national environmental policies but also strengthens technical strategies for sustainable landfill management.
The detection of low-resistivity anomalies (<2.1 Ω·m) at the edges and near-surface zones of the sealed cells is particularly concerning. These anomalies are indicative of lateral leachate infiltration, suggesting possible failures in containment systems or hydraulic bypasses triggered by intense rainfall events [43,48]. Similar conditions have been reported in other humid tropical landfills, where resistivity values as low as 1.5–5 Ω·m were recorded during rainy seasons, confirming the susceptibility of these zones to infiltration processes [48]. Given the proximity of the studied site to rural water sources and expanding mixed-use zones, the persistence of such anomalies represents a tangible threat to the geoenvironmental stability of the surrounding region [44,50].

4.6. Study Limitations and Scope

A key limitation of this study lies in the absence of direct hydrogeochemical and lithological data (e.g., heavy metal concentrations, ionic strength, stratigraphic cores, or microbiological indicators), which restricted the ability to fully cross-validate anomalies identified through ERT [12]. Although interpretations were indirectly supported by existing monitoring wells and stratigraphic logs, the lack of systematic geological or chemical sampling inevitably increases interpretive uncertainty, particularly in heterogeneous tropical landfill environments. While rigorous statistical procedures were applied—including sensitivity analysis, bootstrap confidence intervals, and normality tests—it must be acknowledged that the interpretation of integrated resistivity models inherently carries a degree of ambiguity.
Another limitation relates to the spatial resolution and acquisition geometry of the 3D volumetric model. Although the adopted electrode spacing and line deployment were suitable for delineating principal conductive and resistive structures, smaller-scale features such as microfractures, thin preferential leachate pathways, or sharply localized heterogeneities may have remained undetected at this level of discretization. Moreover, the static nature of the volumetric models does not account for temporal variability, particularly seasonal hydrological events such as heavy rainfall or prolonged droughts, which may significantly influence subsurface dynamics [48].
Despite these constraints, the scope of the study remains substantial. The proposed methodology is replicable and well-adapted to tropical landfill conditions, especially in sites with limited historical data or insufficient documentation of engineering design [51]. The combined use of multiconfigurational arrays, statistical inversion, and 3D visualizations constitutes a methodological advancement, providing a robust framework for the development of comprehensive management strategies in post-closure landfill contexts [30,49]. Moreover, this work establishes the foundation for future predictive models by integrating time-series resistivity data with hydrogeological and geochemical simulations, thereby advancing toward proactive and more reliable approaches in environmental risk management.

5. Conclusions

This study confirms the effectiveness of ERT as a non-invasive and scalable technique for the environmental diagnosis of closed landfill cells in tropical regions. The integration of Wenner, Dipole–Dipole, and Gradient arrays with 2D, 2.5D, and 3D inversion models provided complementary perspectives, enabling a differentiated characterization of resistivity contrasts associated with leachate and gas accumulation processes.
Extensive low-resistivity zones (<2.1 Ω·m) were detected in the southeastern sector of the landfill, interpreted as leachate accumulations, some extending close to the surface. Conversely, high-resistivity anomalies (>154 Ω·m) were identified in the southwestern sector, consistent with potential biogas pockets. The volumetric estimation of these anomalies yielded a total of 20,208 m3, equivalent to approximately 1.1% of the modeled landfill cell volume.
Among the tested configurations, the Dipole–Dipole array achieved the highest lateral accuracy (RMS error of 8.7%), compared to 21.1% for Wenner and 14.0% for Gradient, underscoring its suitability for detecting preferential migration pathways and lateral contaminant flows.
These findings highlight the geoenvironmental risks associated with closed landfill cells, particularly localized pressure build-up in gas-rich zones and preferential leachate migration toward shallow levels—both of which are critical for landfill stability and groundwater protection in tropical environments. Furthermore, the methodological framework developed here provides a replicable and cost-effective approach for strengthening post-closure environmental management of landfills under similar geological and climatic conditions, supported by direct geological validation through stratigraphic logs.

Supplementary Materials

The following supporting information can be downloaded at: https://www.mdpi.com/article/10.3390/environments12090337/s1, Figures S1–S14: Electrical resistivity models obtained using the Wenner array; Figures S15–S28: Electrical resistivity models obtained using the Dipole–Dipole array; Figures S29–S42: Electrical resistivity models obtained using the Gradient array.

Author Contributions

O.E.T.-R.: Conceptualization; methodology; writing; original draft; research; formal analysis; software resources; data curation; validation. G.M.R.: Conceptualization; methodology; writing, review, and editing; research; supervision; software; validation; visualization. J.E.C.-C.: Conceptualization; methodology; writing; research; formal analysis; software resources; data curation; validation. All authors have read and agreed to the published version of the manuscript.

Funding

This study was conducted under consultancy contract No. 2000057, implemented by CORCEL CONSULTORÍA & INTERVENTORÍA LTDA., with financial and logistical support provided by a regional public utilities company. The funding and support facilitated the geophysical assessment of environmental risks associated with leachate and gas accumulation in solid waste disposal infrastructure located in the Colombian Caribbean region.

Data Availability Statement

The original contributions presented in this study are included in the article/Supplementary Material. Further inquiries can be directed to the corresponding author.

Acknowledgments

The authors would like to thank the University of Manizales and the Center for Research on Environment and Development (CIMAD) for their academic and institutional support.

Conflicts of Interest

The authors declare that this study received funding from Sociedad de Acueducto, Alcantarillado y Aseo de Barranquilla E.S.P. (Colombia). The funder was not involved in the study design, collection, analysis, interpretation of data, the writing of this article or the decision to submit it for publication.

References

  1. Vaverková, M.D. Landfill Impacts on the Environment—Review. Geosciences 2019, 9, 431. [Google Scholar] [CrossRef]
  2. Chambers, J.E.; Wilkinson, P.B.; Meldrum, P.I.; Kuras, O.; Ford, J.R.; Gunn, D.A.; Ogilvy, R.D. Electrical Resistivity Tomography Applied to Geological, Hydrogeological and Engineering Investigations at a Former Waste-Disposal Site. Geophysics 2006, 71, B231–B239. [Google Scholar] [CrossRef]
  3. Lou, X.F.; Nair, J. The impact of landfilling and composting on greenhouse gas emissions—A review. Bioresour. Technol. 2009, 100, 3792–3798. [Google Scholar] [CrossRef] [PubMed]
  4. Christensen, T.H.; Kjeldsen, P.; Bjerg, P.L.; Jensen, D.L.; Christensen, J.B.; Baun, A.; Albrechtsen, H.-J.; Heron, G. Biogeochemistry of Landfill Leachate Plumes. Appl. Geochem. 2001, 16, 659–718. [Google Scholar] [CrossRef]
  5. Kjeldsen, P.; Barlaz, M.A.; Rooker, A.P.; Baun, A.; Ledin, A.; Christensen, T.H. Present and Long-Term Composition of MSW Landfill Leachate: A Review. Crit. Rev. Environ. Sci. Technol. 2002, 32, 297–336. [Google Scholar] [CrossRef]
  6. Grau, J.; Terraza, H.; Rodríguez Velosa, D.M.; Rihm, A.; Sturzenegger, G. Solid Waste Management in Latin America and the Caribbean; Inter-American Development Bank: Washington, DC, USA, 2015. [Google Scholar] [CrossRef]
  7. UNEP. Waste Management Outlook for Latin America and the Caribbean; UN Environment: Nairobi, Kenya, 2018. [Google Scholar]
  8. Bradley, M.W. Ground-Water Hydrology and the Effects of Vertical Leakage and Leachate Migration on Ground-Water Quality Near the Shelby County Landfill, Memphis, Tennessee; U.S. Geological Survey Water-Resources Investigations Report 1991; WRI 90–4075; U.S. Geological Survey (USGS): Reston, VA, USA, 1991. [Google Scholar]
  9. Rodriguez-Cárdenas, L.; Li, N.; Ramírez-Alegría, J.D. Leachate Pollution Index (LPI) in Sanitary Landfills: Indicators of Vertical and Lateral Migration Affecting Soil and Aquifer Systems. Molecules 2025, 30, 3325. [Google Scholar] [CrossRef]
  10. Mor, S.; Ravindra, K.; Dahiya, R.P.; Chandra, A. Leachate Characterization and Assessment of Groundwater Pollution near Municipal Solid Waste Landfill Site. Environ. Monit. Assess. 2006, 118, 435–456. [Google Scholar] [CrossRef]
  11. Alam, M.J.B.; Ahmed, A.; Alam, M.Z. Application of Electrical Resistivity Tomography in Geotechnical and Geoenvironmental Engineering Aspect. Geotechnics 2024, 4, 399–414. [Google Scholar] [CrossRef]
  12. Binley, A.; Hubbard, S.S.; Huisman, J.A.; Revil, A.; Robinson, D.A.; Singha, K.; Slater, L.D. The Emergence of Hydrogeophysics for Improved Understanding of Subsurface Processes over Multiple Scales. Water Resour. Res. 2015, 51, 3837–3866. [Google Scholar] [CrossRef]
  13. Dimech, A.; Cheng, L.Z.; Chouteau, M.; Chambers, J.; Uhlemann, S.; Wilkinson, P.; Meldrum, P.; Mary, B.; Fabien-Ouellet, G.; Isabelle, A. A Review on Applications of Time-Lapse Electrical Resistivity Tomography Over the Last 30 Years: Perspectives for Mining Waste Monitoring. Surv. Geophys. 2022, 43, 1699–1759. [Google Scholar] [CrossRef] [PubMed]
  14. Gourdol, L.; Clément, R.; Juilleret, J.; Pfister, L.; Hissler, C. Exploring the Regolith with Electrical Resistivity Tomography in Large-Scale Surveys: Electrode Spacing-Related Issues and Possibility. Hydrol. Earth Syst. Sci. 2021, 25, 1785–1812. [Google Scholar] [CrossRef]
  15. Imhoff, P.T.; Reinhart, D.R.; Englund, M.; Guérin, R.; Gawande, N.; Han, B.; Jonnalagadda, S.; Townsend, T.; Yazdani, R. Review of State of the Art Methods for Measuring Water in Landfills. Waste Manag. 2007, 27, 729–745. [Google Scholar] [CrossRef]
  16. Gawande, N.A.; Reinhart, D.R.; Thomas, P.A.; McCreanor, P.T.; Townsend, T.G. Municipal Solid Waste In Situ Moisture Content Measurement Using an Electrical Resistance Sensor. Waste Manag. 2003, 23, 667–674. [Google Scholar] [CrossRef]
  17. Maurya, P.K.; Rønde, V.K.; Fiandaca, G.; Balbarini, N.; Auken, E.; Bjerg, P.L.; Christiansen, A.V. Detailed landfill leachate plume mapping using 2D and 3D Electrical Resistivity Tomography—With correlation to ionic strength measured in screens. J. Appl. Geophys. 2017, 138, 1–8. [Google Scholar] [CrossRef]
  18. Helene, L.P.I.; Moreira, C.A.; Bovi, R.C. Identification of leachate infiltration and its flow pathway in landfill by means of Electrical Resistivity Tomography (ERT). Environ. Monit. Assess. 2020, 192, 249. [Google Scholar] [CrossRef] [PubMed]
  19. Orlando, L.; Marchesi, E. Georadar as a Tool to Identify and Characterise Solid Waste Dump Deposits. J. Appl. Geophys. 2001, 48, 163–174. [Google Scholar] [CrossRef]
  20. Porsani, J.L.; Malagutti Filho, W.; Elis, V.R.; Shimeles, F.; Dourado, J.C.; Moura, H.P. The Use of GPR and VES in Delineating a Contamination Plume in a Landfill Site: A Case Study in SE Brazil. J. Appl. Geophys. 2004, 55, 199–209. [Google Scholar] [CrossRef]
  21. Deidda, G.P.; De Carlo, L.; Caputo, M.C.; Cassiani, G. Frequency-domain electromagnetic induction imaging: An effective method to see inside a capped landfill. Waste Manag. 2022, 144, 29–40. [Google Scholar] [CrossRef]
  22. Bavusi, M.; Lapenna, V.; Rizzo, E. Electromagnetic methods to characterize the Savoia di Lucania waste dump (Southern Italy). Environ. Geol. 2006, 51, 301–308. [Google Scholar] [CrossRef]
  23. Darvasi, Y.; Agnon, A. Estimation of Low-Velocity Landfill Thickness with Multi-Method Seismic Surveys. Geotechnics 2023, 3, 731–743. [Google Scholar] [CrossRef]
  24. Martí, A.; Queralt, P.; Marcuello, A.; Ledo, J. Imaging leachate runoff from a landfill using magnetotellurics: The Garraf karst case. Sci. Total Environ. 2024, 920, 170827. [Google Scholar] [CrossRef]
  25. Martorana, R.; Capizzi, P.; Pirrera, C. Unconventional Arrays for 3D Electrical Resistivity and Induced Polarization Tomography to Detect Leachate Concentration in a Waste Landfill. Appl. Sci. 2023, 13, 7203. [Google Scholar] [CrossRef]
  26. Prezzi, C.; Orgeira, M.J.; Ostera, H.; Vásquez, C.A. Ground magnetic survey of a municipal solid waste landfill: Pilot study in Argentina. Environ. Geol. 2005, 47, 889–897. [Google Scholar] [CrossRef]
  27. Ciampi, P.; Giannini, L.M.; Cassiani, G.; Esposito, C.; Petrangeli Papini, M. Geo-constrained clustering of resistivity data revealing the heterogeneous lithological architectures and the distinctive geoelectrical signature of shallow deposits. Eng. Geol. 2024, 337, 107589. [Google Scholar] [CrossRef]
  28. Palacky, G. Resistivity Characteristics of Geologic Targets. In Electromagnetic Methods in Applied Geophysics—Theory; Nabighian, M.N., Ed.; Society of Exploration Geophysicists: Tulsa, OK, USA, 1987; Volume 1, pp. 53–129. [Google Scholar]
  29. Nobes, D.C. Troubled waters: Environmental applications of electrical and electromagnetic methods. Surv. Geophys. 1996, 17, 393–454. [Google Scholar] [CrossRef]
  30. Pomposiello, C.; Dapéna, C.; Boujón, P.; Favetto, A. Tomografías eléctricas en el basurero municipal de la ciudad de Gualeguaychú, provincia de Entre Ríos: Evidencias de contaminación. Rev. Asoc. Geol. Argent. 2009, 64, 603–614. [Google Scholar]
  31. Bichet, V.; Grisey, E.; Aleya, L. Spatial characterization of leachate plume using Electrical Resistivity Tomography in a landfill composed of old and new cells (Étueffont, France). Eng. Geol. 2016, 211, 61–73. [Google Scholar] [CrossRef]
  32. Wilkinson, P.B.; Chambers, J.E.; Meldrum, P.I.; Kuras, O.; Holyoake, S.J.; Ogilvy, R.D. High-resolution Electrical Resistivity Tomography monitoring of a tracer test in a confined aquifer. J. Appl. Geophys. 2010, 70, 268–276. [Google Scholar] [CrossRef]
  33. Zhan, L.-T.; Xu, H.; Jiang, X.-M.; Lan, J.-W.; Chen, Y.-M.; Zhang, Z.-Y. Use of electrical resistivity tomography for detecting the distribution of leachate and gas in a large-scale MSW landfill cell. Environ. Sci. Pollut. Res. Int. 2019, 26, 20325–20343. [Google Scholar] [CrossRef] [PubMed]
  34. Godio, A.; Chiampo, F. Geophysical Monitoring of Leachate Injection in Pretreated Waste Landfill. Appl. Sci. 2023, 13, 5661. [Google Scholar] [CrossRef]
  35. Ministry of Environment (Colombia). Technical Guidelines for Leachate Management in Sanitary Landfills; Ministry of Environment: Bogotá, Colombia, 2010.
  36. Griffiths, D.H.; Barker, R.D. Two-dimensional resistivity imaging and modelling in areas of complex geology. J. Appl. Geophys. 1993, 29, 211–226. [Google Scholar] [CrossRef]
  37. Dahlin, T.; Zhou, B. A numerical comparison of 2D resistivity imaging with ten electrode arrays. Geophys. Prospect. 2004, 52, 379–398. [Google Scholar] [CrossRef]
  38. Golden Software LLC. Grapher, Version 20.2; Golden Software LLC: Golden, CO, USA, 2023. Available online: https://www.goldensoftware.com/products/grapher (accessed on 1 October 2024).
  39. Loke, M.H. Tutorial: 2-D and 3-D Electrical Imaging Surveys; Geotomo Software: Penang, Malaysia, 2001; Available online: https://www.geotomosoft.com/downloads.php (accessed on 12 November 2024).
  40. Telford, W.M.; Geldart, L.P.; Sheriff, R.E. Applied Geophysics, 2nd ed.; Cambridge University Press: Cambridge, UK, 1990. [Google Scholar]
  41. Sharma, P.V. Environmental and Engineering Geophysics; Cambridge University Press: Cambridge, UK, 1997. [Google Scholar]
  42. Zhou, B.; Greenhalgh, S.A. Cross-hole resistivity tomography using different electrode configurations. Geophys. Prospect. 2000, 48, 887–912. [Google Scholar] [CrossRef]
  43. Morita, A.K.M.; Pelinson, N.S.; Bastianon, D.; Saraiva, F.A.; Wendland, E. Using Electrical Resistivity Tomography (ERT) to Assess the Effectiveness of Capping in Old Unlined Landfills. Pure Appl. Geophys. 2023, 180, 3599–3606. [Google Scholar] [CrossRef]
  44. Zaini, M.S.I.; Hasan, M. Application of Electrical Resistivity Tomography in Landfill Leachate Detection Assessment. In A Review of Landfill Leachate; Anouzla, A., Souabi, S., Eds.; Springer Water: Cham, Switzerland, 2024; Volume 1, pp. 1–22. [Google Scholar] [CrossRef]
  45. Servicio Geológico Colombiano (SGC). Geología de Colombia; Servicio Geológico Colombiano: Bogotá, Colombia, 2019; Volume 3. Available online: https://www2.sgc.gov.co/LibroGeologiaColombia/tgc/sgcpubesp37201911.pdf (accessed on 1 September 2025).
  46. Dajnov, V.N. Petróleo y Gas en Rocas. In Métodos Geofísicos; Editorial Reverté: Barcelona, Spain, 1982. [Google Scholar]
  47. Lu, Y.; Xie, Q.; Cao, C.; Huang, J.; Wang, J.; Ren, B.; Liu, Y. Detection of landfill leachate leakage around a valley-type landfill and its pollution and risk on groundwater. Water 2023, 15, 1778. [Google Scholar] [CrossRef]
  48. Alao, J.O.; Otorkpa, O.J.; Abubakar, F.; Eshimiakhe, D.; Aliyu, A.; Abdulsalami, M.; Abdulmalik, D.O. Geoelectrical Resistivity and Geochemistry Monitoring of Landfill Leachate Due to the Seasonal Variations and the Implications on Groundwater Systems and Public Health. Sci. Rep. 2024, 14, 26542. [Google Scholar] [CrossRef] [PubMed]
  49. Ibraheem, I.M.; Yogeshwar, P.; Bergers, R.; Tezkan, B. Joint interpretation of magnetic, transient electromagnetic, and electric resistivity tomography data for landfill characterization and contamination detection. Sci. Rep. 2024, 14, 30616. [Google Scholar] [CrossRef] [PubMed]
  50. Juliao, C.; Díaz, J.; Bermúdez, Y.; Aldana, M. Integration of Geoelectric and Geochemical Data Using Self Organizing Maps (SOM) to Characterize a Landfill. arXiv 2023, arXiv:2309.09164. [Google Scholar] [CrossRef]
  51. Trujillo-Romero, O.E.; Restrepo, G.M. From Prediction to Remediation: Characterization of Tropical Landfill Leachate Using ARIMA and Application of Adsorption and Reverse Osmosis Treat-ments. Sustainability 2025, 17, 5985. [Google Scholar] [CrossRef]
Figure 1. Location map and layout of the ERT survey profiles at a sanitary landfill in the Colombian Caribbean region. The base image (Google Earth, 2024) [shows the position of closed landfill cells, where 15 profiles were deployed using Wenner, Dipole–Dipole, and Gradient arrays to characterize subsurface resistivity anomalies associated with leachate and gas accumulations. The red lines indicate the ERT survey profiles, while the red arrows show their orientation and numbering.
Environments 12 00337 g001
Figure 2. General schematic of the ERT data acquisition system. Current is injected through paired electrodes, and potential differences are measured at separate electrodes. The arrangement enables multi-electrode automated acquisition with configurations adapted for vertical (Wenner), lateral (Dipole–Dipole), and broad coverage (Gradient) sensitivity.
Environments 12 00337 g002
Figure 3. Electrical resistivity ranges (Ω·m) for various geological materials, minerals, and chemical compounds. This chart supports correlation between field-obtained ERT values and the likely material types present in the subsurface. Resistivity varies significantly depending on lithology, water content, porosity, and the presence of conductive or resistive minerals.
Environments 12 00337 g003
Figure 4. Electrical resistivity model obtained with the Wenner array along Tomography Line 1 at a tropical landfill in the Colombian Caribbean. The figure displays three panels: (a) apparent resistivity pseudosection, (b) calculated model, and (c) inverted resistivity section. Resistivity values are expressed in Ω·m according to the scale shown. Inversion error: 21.1%.
Environments 12 00337 g004
Figure 5. Resistivity model derived from the Dipole–Dipole array applied to Tomography Line 1. The figure shows: (a) apparent resistivity pseudosection, (b) calculated pseudosection, and (c) inverted model. Resistivity values are expressed in Ω·m. The inversion converged with an RMS error of 8.7%.
Environments 12 00337 g005
Figure 6. Inverted resistivity model generated with the Gradient array for Tomography Line 1. The figure presents resistivity values in Ω·m using a continuous color scale. The model converged after nine iterations with an RMS error of 14.0%.
Environments 12 00337 g006
Figure 7. Horizontal resistivity section for the shallow layer (0–5 m depth) obtained from integrated 3D inversion of Wenner, Dipole–Dipole, and Gradient datasets. The figure illustrates resistivity distribution in Ω·m on a logarithmic scale. RMS error: 22.1%.
Environments 12 00337 g007
Figure 8. Representative vertical resistivity sections (X–Z planes) obtained from 2.5D inversion at a tropical landfill site. Both panels show resistivity distribution from the surface down to 62 m depth, with electrode spacing of 10 m along the X-axis and 15 m along the Y-axis. Resistivity values are expressed in Ω·m. (a) Section along X–Z plane 7 (Y distance: –15.00 to 0.00 m). (b) Section along X–Z plane 6 (Y distance: –30.00 to –15.00 m).
Environments 12 00337 g008
Figure 9. Transverse resistivity sections (Y–Z planes) obtained from 2.5D inversion at the landfill site. Both panels display the vertical resistivity distribution from the surface down to ~62 m depth, with resistivity values expressed in Ω·m using a continuous color scale. (a) Section along Y–Z plane 1 (X distance: 0.00–10.0 m). (b) Section along Y–Z plane 4 (X distance: 30.0–40.0 m). The inversion achieved an RMS error of 29.6%.
Environments 12 00337 g009
Figure 10. Three-dimensional volumetric electrical resistivity model generated with Voxler 4.0 (Golden Software, EE. UU.) for a sanitary landfill located in the Colombian Caribbean region. The figure shows the spatial distribution of zones with varying resistivity values, where low values (<0.02 Ω·m, in blue) indicate highly conductive leachate, while high values (>0.02 Ω·m, in red) may be associated with landfill gas accumulations or dry, high-resistivity materials. Three-dimensional interpolation was performed based on meshing derived from RES3DINVx64 data. Post-processing was carried out in Voxler 4.0, using the inverted 3D resistivity matrix. Transparency filters were applied to highlight critical volumes with hydrogeologically significant resistivity thresholds.
Environments 12 00337 g010
Figure 11. Interpolated resistivity model corresponding to the superficial layer (0.00–5.00 m depth), generated using Surfer® v25 (Golden Software). Five principal anomalies (P1 to P5) are highlighted with resistivity values above 100 Ω·m, interpreted as potential biogas accumulations. The image includes a resistivity legend with logarithmic color scale ranging from 0.050 to 570 Ω·m. These anomalies were delineated based on isovalue contours extracted from the 3D resistivity mesh derived from inverted ERT profiles.
Environments 12 00337 g011
Table 1. Geographic coordinates and GPS-based elevations of the ERT survey lines.
Geotomography CodeElectrodeNorth
Coordinate (N)
West Coordinate (W)GPS Elevation (m)
No. 1110°55′48.56″74°55′42.34″69
4710°55′59.65″74°55′27.61″55
No. 2110°55′48.19″74°55′42.03″69
4710°55′59.28″74°55′27.29″55
No. 3110°55′47.82″74°55′41.71″69
4710°55′58.90″74°55′26.97″55
No. 4110°55′47.44″74°55′41.38″68
4710°55′58.53″74°55′26.65″55
No. 5110°55′47.06″74°55′41.07″67
4710°55′58.17″74°55′26.33″55
No. 6110°55′46.68″74°55′40.76″66
4710°55′57.79″74°55′26.02″55
No. 7110°55′46.32″74°55′40.43″65
4710°55′57.41″74°55′25.69″55
No. 8110°55′45.95″74°55′40.11″64
4710°55′57.05″74°55′25.37″55
No. 9110°55′45.58″74°55′39.80″64
4710°55′56.67″74°55′25.06″54
No. 10110°55′45.21″74°55′39.47″64
4710°55′56.30″74°55′24.73″54
No. 11110°55′44.82″74°55′39.14″63
4710°55′55.93″74°55′24.41″54
No. 12110°55′44.47″74°55′38.83″63
4710°55′55.56″74°55′24.09″53
No. 13110°55′44.07″74°55′38.50″63
4710°55′55.18″74°55′23.77″53
No. 14110°55′43.71″74°55′38.19″62
4710°55′54.81″74°55′23.46″53
No. 15110°55′43.34″74°55′37.87″62
4710°55′54.44″74°55′23.15″53
Table 2. Summary of average electrical resistivity (Ω·m) per tomography line and geophysical method (Wenner, Dipole–Dipole, and Gradient) at a sanitary landfill located in the Colombian Caribbean region.
LineWenner (Ω·m)Dipole–Dipole (Ω·m)Gradient (Ω·m)
136.375.3126.1
2117.646.7152.8
3107.192.268.2
4101.856.455.8
5128.353.890.7
6110.625.5103.1
73141.8156.6
8104.327.1139.8
957.561.8145.5
10149.53189.8
1136.4125.8115
124669.993.7
1397.817.1140.8
14108.4102.8139.8
1557.210051.3
Table 3. Estimated volumes of anomalies interpreted as gas accumulations.
PointAxis a (m)Axis b (m)Axis c (m)Estimated Volume (m3)
P18.06.05.02512
P28.06.55.12656
P312.08.07.57065
P410.07.06.04835
P59.06.55.53140
Total20,208
Disclaimer/Publisher’s Note: The statements, opinions and data contained in all publications are solely those of the individual author(s) and contributor(s) and not of MDPI and/or the editor(s). MDPI and/or the editor(s) disclaim responsibility for any injury to people or property resulting from any ideas, methods, instructions or products referred to in the content.