Article

Genotoxic Effects of Water in Aquatic Ecosystems with Varying Cyanobacterial Abundance Assessed Using the Allium Test

1
Papanin Institute for Biology of Inland Waters, Russian Academy of Sciences, Borok, 152742 Yaroslavl, Russia
2
Scientific Research Centre for Ecological Safety, St. Petersburg Federal Research Center, Russian Academy of Sciences, 197110 St. Petersburg, Russia
3
Institute of Biology and Biomedicine, Lobachevsky State University, Pr. Gagarina 23, 603022 Nizhny Novgorod, Russia
*
Author to whom correspondence should be addressed.
Environments 2025, 12(9), 321; https://doi.org/10.3390/environments12090321
Submission received: 10 August 2025 / Revised: 8 September 2025 / Accepted: 10 September 2025 / Published: 12 September 2025
(This article belongs to the Special Issue Environmental Risk Assessment of Aquatic Environments)

Abstract

Cyanobacterial blooms in aquatic ecosystems are a major global environmental concern. While the mutagenic and mitosis-disrupting properties of isolated cyanobacterial toxins are well documented, evidence of cytogenotoxic effects resulting from cyanobacterial blooms in natural aquatic ecosystems remains limited. In this study, water genotoxicity was evaluated in microcosms simulating cyanobacterial blooms of varying abundance. In microcosms with initially high cyanobacterial abundances (4.6 × 10⁷ and 2.2 × 10⁷ cells L−1) and biomass (58 mg L−1 and 20 mg L−1), significant toxic, cytotoxic, mitosis-disrupting, and mutagenic effects were observed: root elongation was inhibited by up to 49.6% (Day 1), the mitotic index decreased by ~33% (Treatment I, Day 42) vs. Control, and total chromosomal aberrations and lagging chromosomes increased by ~2.5-fold on Day 1 (Treatment I) and ~4.7-fold on Day 42 (Treatment I) vs. Control; micronuclei increased ~10-fold on Day 42 in Treatment I and II. In microcosms with lower cyanobacterial abundance (1.2 × 10⁷ cells L−1) and biomass (9 mg L−1), significant reductions were observed only in root growth and in the mitotic index compared with Control. Future research should aim to identify a broader spectrum of cyanobacterial toxins and to investigate their environmental fate and persistence in aquatic ecosystems, particularly since genotoxic effects were detected even during the post-bloom period: on Day 42 extracellular microcystins in water were <LOQ in Treatments I and III (and 0.025 µg L−1 in Treatment II), yet chromosome lagging and micronuclei remained elevated. The observed genotoxicity associated with cyanobacterial metabolites underscores the need for thorough risk assessments of cyanobacterial blooms in aquatic environments.

Graphical Abstract

1. Introduction

Harmful algal blooms (HABs) caused by cyanobacteria represent a global environmental issue, exacerbated by ongoing eutrophication of water bodies and global climate change. Many cyanobacteria are considered potentially toxin-producing. As a result of cyanobacterial blooms, toxic substances may be accumulated in water, posing risks for human health. Numerous reports have documented cases where cyanobacterial blooms led to acute or chronic toxicity in both humans and animals [1,2,3,4].
Based on clinical manifestations, cyanotoxins with capability of inducing cytogenetic abnormalities are conventionally classified into neurotoxins, hepatotoxins, and dermatotoxins [5,6]. Cyanobacterial toxins, even at sublethal and relatively low concentrations, can cause cell division disorders [7,8].
Microcystins (MCs) are the most widespread cyanotoxins in freshwater ecosystems [2]. The presence of MCs in water is primarily associated with the cyanobacterium Microcystis aeruginosa, which often dominates in phytoplankton communities during HABs. However, MCs can also be produced by other cyanobacterial genera, including Planktothrix, Dolichospermum (formerly Anabaena), Oscillatoria, Aphanocapsa, Cyanobium, Arthrospira, Limnothrix, Phormidium, Hapalosiphon, Anabaenopsis, Nostoc, Synechocystis, and others [9,10]. Due to their widespread occurrence in aquatic environments, MCs are the most common cause of cyanobacterial toxicosis [10]. Consequently, considerable attention has been devoted to studying the structure of MCs, the mechanisms and conditions of their production, and their effects on biological systems at various levels of organization. MCs are cyclic heptapeptides that act as hepatotoxins. The toxicity of MCs is primarily attributed to their ability to inhibit protein phosphatases 1 and 2A (PP1 and PP2A). This inhibition results in protein hyperphosphorylation, ultimately leading to alterations in cellular signaling pathways. Additionally, MCs induce oxidative stress and cellular damage by promoting the formation of reactive oxygen species (ROS) [11]. Increased ROS production leads to oxidative DNA damage and accumulation of GC-to-TA transversion mutations. The induction of ROS by microcystins with a resulting DNA damage and formation of micronucleus mutations has been demonstrated in vitro using mammalian and human cells, as well as in vivo experiments on rodents [12]. The genotoxicity of MCs has been confirmed multiple times using various methodological approaches in both prokaryotic and eukaryotic cells [13,14,15].
Exposure to microcystins disrupts the DNA repair system [2]. MC-LR alters gene expression, particularly affecting tumor suppressor genes and oncogenes [11]. The International Agency for Research on Cancer (IARC) classifies MC-LR as a possible human carcinogen [16].
In recent years, increasing attention has been given to emerging cyanobacterial secondary metabolites beyond microcystins, including anatoxin-a, saxitoxins, nodularins, guanitoxin, cyanopeptolins, microginins, anabaenopeptins. The determination of anatoxin-a in complex aquatic and biological matrices is the subject of the review [17]. Another review encompassing saxitoxins described advances in occurrence mapping, water treatment efficacy, and detection across diverse freshwater systems [18]. In parallel, a comprehensive assessment of microcystin and nodularin health impacts highlighted synergistic effects, chronic toxicity evidence, and the need for multi-class toxin panels in human health risk models [19]. A recent systematic review summarized the occurrence, toxicity, and ecological risks of guanitoxin, stressing the need for robust detection and regulatory consideration in monitoring programs [20]. Advances in natural product chemistry and metabolomics have revealed extensive diversity of cyanobacterial secondary metabolites, including uncharacterized oligopeptides, motivating the use of untargeted HRMS screening [21], and recent studies on cyanopeptides such as cyanopeptolins and microginins have shown that these can interfere with tubulin and microtubules, contributing to mitotic disturbances and genotoxicity [22].
Cytotoxic and genotoxic effects have been demonstrated not only for MCs but also for other cyanotoxins and their mixtures [17,23,24]. For example, nodularin is known to increase the expression of genes involved in DNA damage response, cell cycle arrest, and apoptosis, similar to MCs [9]. In addition to well-characterized toxins, cyanobacteria produce a substantial number of compounds for which toxicological data remain scarce.
Plant genotoxicity assays have rarely been applied to natural bloom waters under controlled conditions (microcosms), and the post-bloom period remains underexplored. Nevertheless, in situ plant bioassays have already captured bloom-related DNA damage: the Tradescantia Trad-SHM/Trad-MN tests in Lake Sevan bays detected significant mutagenic and clastogenic responses, with principal-component analysis linking micronuclei/mutation endpoints to toxigenic cyanobacterial taxa and nutrient status [25]. Mechanistic plant studies provide biological plausibility for such outcomes: microcystin-LR perturbs PP1/PP2A-regulated division processes in higher plants, modulating cell division [26], and reorganizes the cytoskeleton, consistent with spindle dysregulation that yields chromosome lagging and c-mitosis [27].
The Allium test, a validated plant-based assay recommended by the World Health Organization (WHO) for cytogenetic environmental monitoring, was used to assess genotoxic effects. The Allium test has been widely applied to assess genotoxicity in aquatic environments, particularly those impacted by cyanobacterial toxins [28]. It has proven to be a sensitive bioindicator of chromosomal aberrations induced by bioactive compounds produced by Microcystis aeruginosa [14].
Allium test results correlate well with data obtained from human and animal cells, consistently yielding comparable outcomes and identifying similar types of mutations due to the conserved nature of genetic information storage and transmission systems across all eukaryotes, whether plant or animal cells. Thus, the Allium test provides sufficient evidence to evaluate the mutagenic potential of a factor for eukaryotic organisms and enables rapid and reliable assessment of genotoxicants in the environment [29,30,31,32].
Previously, the usage of the Allium test made it possible to detect genotoxic effects even at lower cyanobacterial biomasses (~4 mg L−1) in experimental ecosystems that included aquatic organisms from different ecological groups (zooplankton, benthic crustaceans, or fish) [33]. It was established that the degree of mitotic disruption and damage to the genetic apparatus, as well as the duration of detectable defects, depended on the biotic composition of the experimental ecosystems. Fish prolonged the period of cyanobacterial bloom by significantly excreting biogenic substances and intensifying the turnover of nitrogen and phosphorus in the ecosystem [33].
Most research on the cytotoxicity and genotoxicity of cyanobacterial toxins has focused on isolated and purified compounds tested on individual organisms or cell cultures. However, several studies suggest that the toxicity of natural waters during cyanobacterial blooms may be enhanced due to the synergistic effects of multiple bioactive metabolites [13,34], or conversely, diminished as a result of biodegradation and abiotic transformation processes [35,36].
Recent work indicates that co-occurring cyanobacterial metabolites can interact additively or synergistically, with oxidative stress emerging as a common downstream pathway in mixture exposures. For example, pre-exposure to microcystin-LR sensitized fish intestine to paralytic shellfish toxins, shifting antioxidant balance during sequential exposure (rainbow trout model) [37]. In parallel, studies comparing cyanobacterial extracts vs. pure toxins show that chemically complex matrices elicit stronger ROS generation and GSH depletion than single analytes (e.g., CYN-producing vs. non-producing extracts in SH-SY5Y cells), underscoring mixture-driven oxidative injury [38]. Similarly, Raphidiopsis raciborskii dissolved extracts produced broader acute–chronic toxicity and transcriptional signatures in Daphnia than purified cylindrospermopsin, with responses explicitly involving oxidative-stress pathways [39]. Field-relevant microcystis exudates also provoke oxidative and inflammatory responses in fish gills, highlighting that non-MC metabolites can drive redox imbalance under bloom conditions [40]. These findings align with recent syntheses in aquatic vertebrates, which identify oxidative stress as a dominant mechanism across major cyanotoxin classes, and support evaluating mixture effects rather than single-toxin endpoints alone [41,42].
Therefore, it is essential to understand how harmful cyanobacterial blooms in natural water bodies may be to specific populations and entire ecosystems. We hypothesized that even low, post-bloom concentrations of cyanobacterial metabolites, including cyanotoxins and their degradation products could induce cytogenotoxic effects in aquatic environments. Based on this hypothesis, we established an outdoor microcosm experiment aimed to achieve the following: (I) assess the mutagenicity of the environment during periods of massive cyanobacterial proliferation; (II) determine the relationship between genotoxic and mitosis-modifying effects and cyanobacterial abundance; (III) evaluate the persistence of cytogenotoxic effects following the cessation of cyanobacterial blooms in aquatic ecosystems. The research was conducted in experimental ecosystems (microcosms), which allowed for controlled manipulation of initial cyanobacterial abundance and minimized the influence of uncontrolled external factors.

2. Materials and Methods

2.1. Microcosm Organization

Water samples used for toxicity testing and cytogenetic assessment were collected from artificial ecosystems (microcosms) established as part of an experiment investigating the impact of varying cyanobacterial abundance on plankton community dynamics. The study was conducted at the experimental pond facility of the Papanin Institute for Biology of Inland Waters, Russian Academy of Sciences (58.0404° N, 38.2412° E).
Microcosms were established in aquaculture tanks (1.0 × 1.0 × 0.5 m), each filled with 300 L of river water filtered through an 82 µm mesh sieve. Water was sourced from the Sunoga River, a tributary of the Volga River. Microorganisms and phytoplankton naturally entered the microcosms during water filling. To ensure uniform zooplankton distribution, zooplankton was separately collected from artificial ponds previously filled with the same river water and concentrated into a single container. Equal volumes of water containing concentrated zooplankton were then added to each microcosm. The tanks were placed outdoors under natural temperature and light conditions. The experiment lasted from 28 July to 8 September 2022. To establish experimental treatments with differing cyanobacterial abundance, water samples were collected from the Volga River shoreline during a period of intense cyanobacterial proliferation (“water blooming”), where cyanobacteria typically accumulated. Cyanobacterial concentrate was added to the microcosms in varying proportions, creating the following experimental treatments: Control (no cyanobacteria added); I (high cyanobacterial abundance, 4.6 × 10⁷ cells L−1); II (medium abundance, with half the concentrate volume used in Treatment I, 2.2 × 10⁷ cells L−1); and III (low abundance, one-quarter the concentrate volume used in Treatment I, 1.2 × 10⁷ cells L−1). Aphanizomenon flos-aquae, Microcystis aeruginosa, and Dolichospermum sp. dominated, accounting for 86–96% of the total cyanobacterial abundance. Each treatment was conducted in triplicate.

2.2. Cyanobacteria Analysis

Throughout the experiment, the species composition, abundance, and biomass of algae and cyanobacteria were monitored. For analysis, 0.5 L of water was sampled from each microcosm. The samples were fixed and left to settle for 10 days to allow phytoplankton sedimentation. Excess water was then removed using a siphon, reducing the sample volume to 10 mL. Species identification and individual cell counting were carried out in a Nageotte chamber with a volume of 0.02 mL using a BiOptic B-200 light microscope (Biomed, Saint Petersburg, Russia) at magnifications of 420× and 600×. The nomenclature and classification were updated and arranged following AlgaeBase. Biovolume was expressed in μm3 for each counted species, and reflects individual cell volumes; for colony-forming taxa, the biovolume is for individual cells, not the size of colonies. The biomass was calculated taking into account the shape and volume of cells, based on the fact that 109 mm3 of volume corresponds to 1 mg of crude phytoplankton biomass [43]. Total phytoplankton biomass was expressed in mg L−1 and phytoplankton abundance in cells L−1.

2.3. MCs Analysis

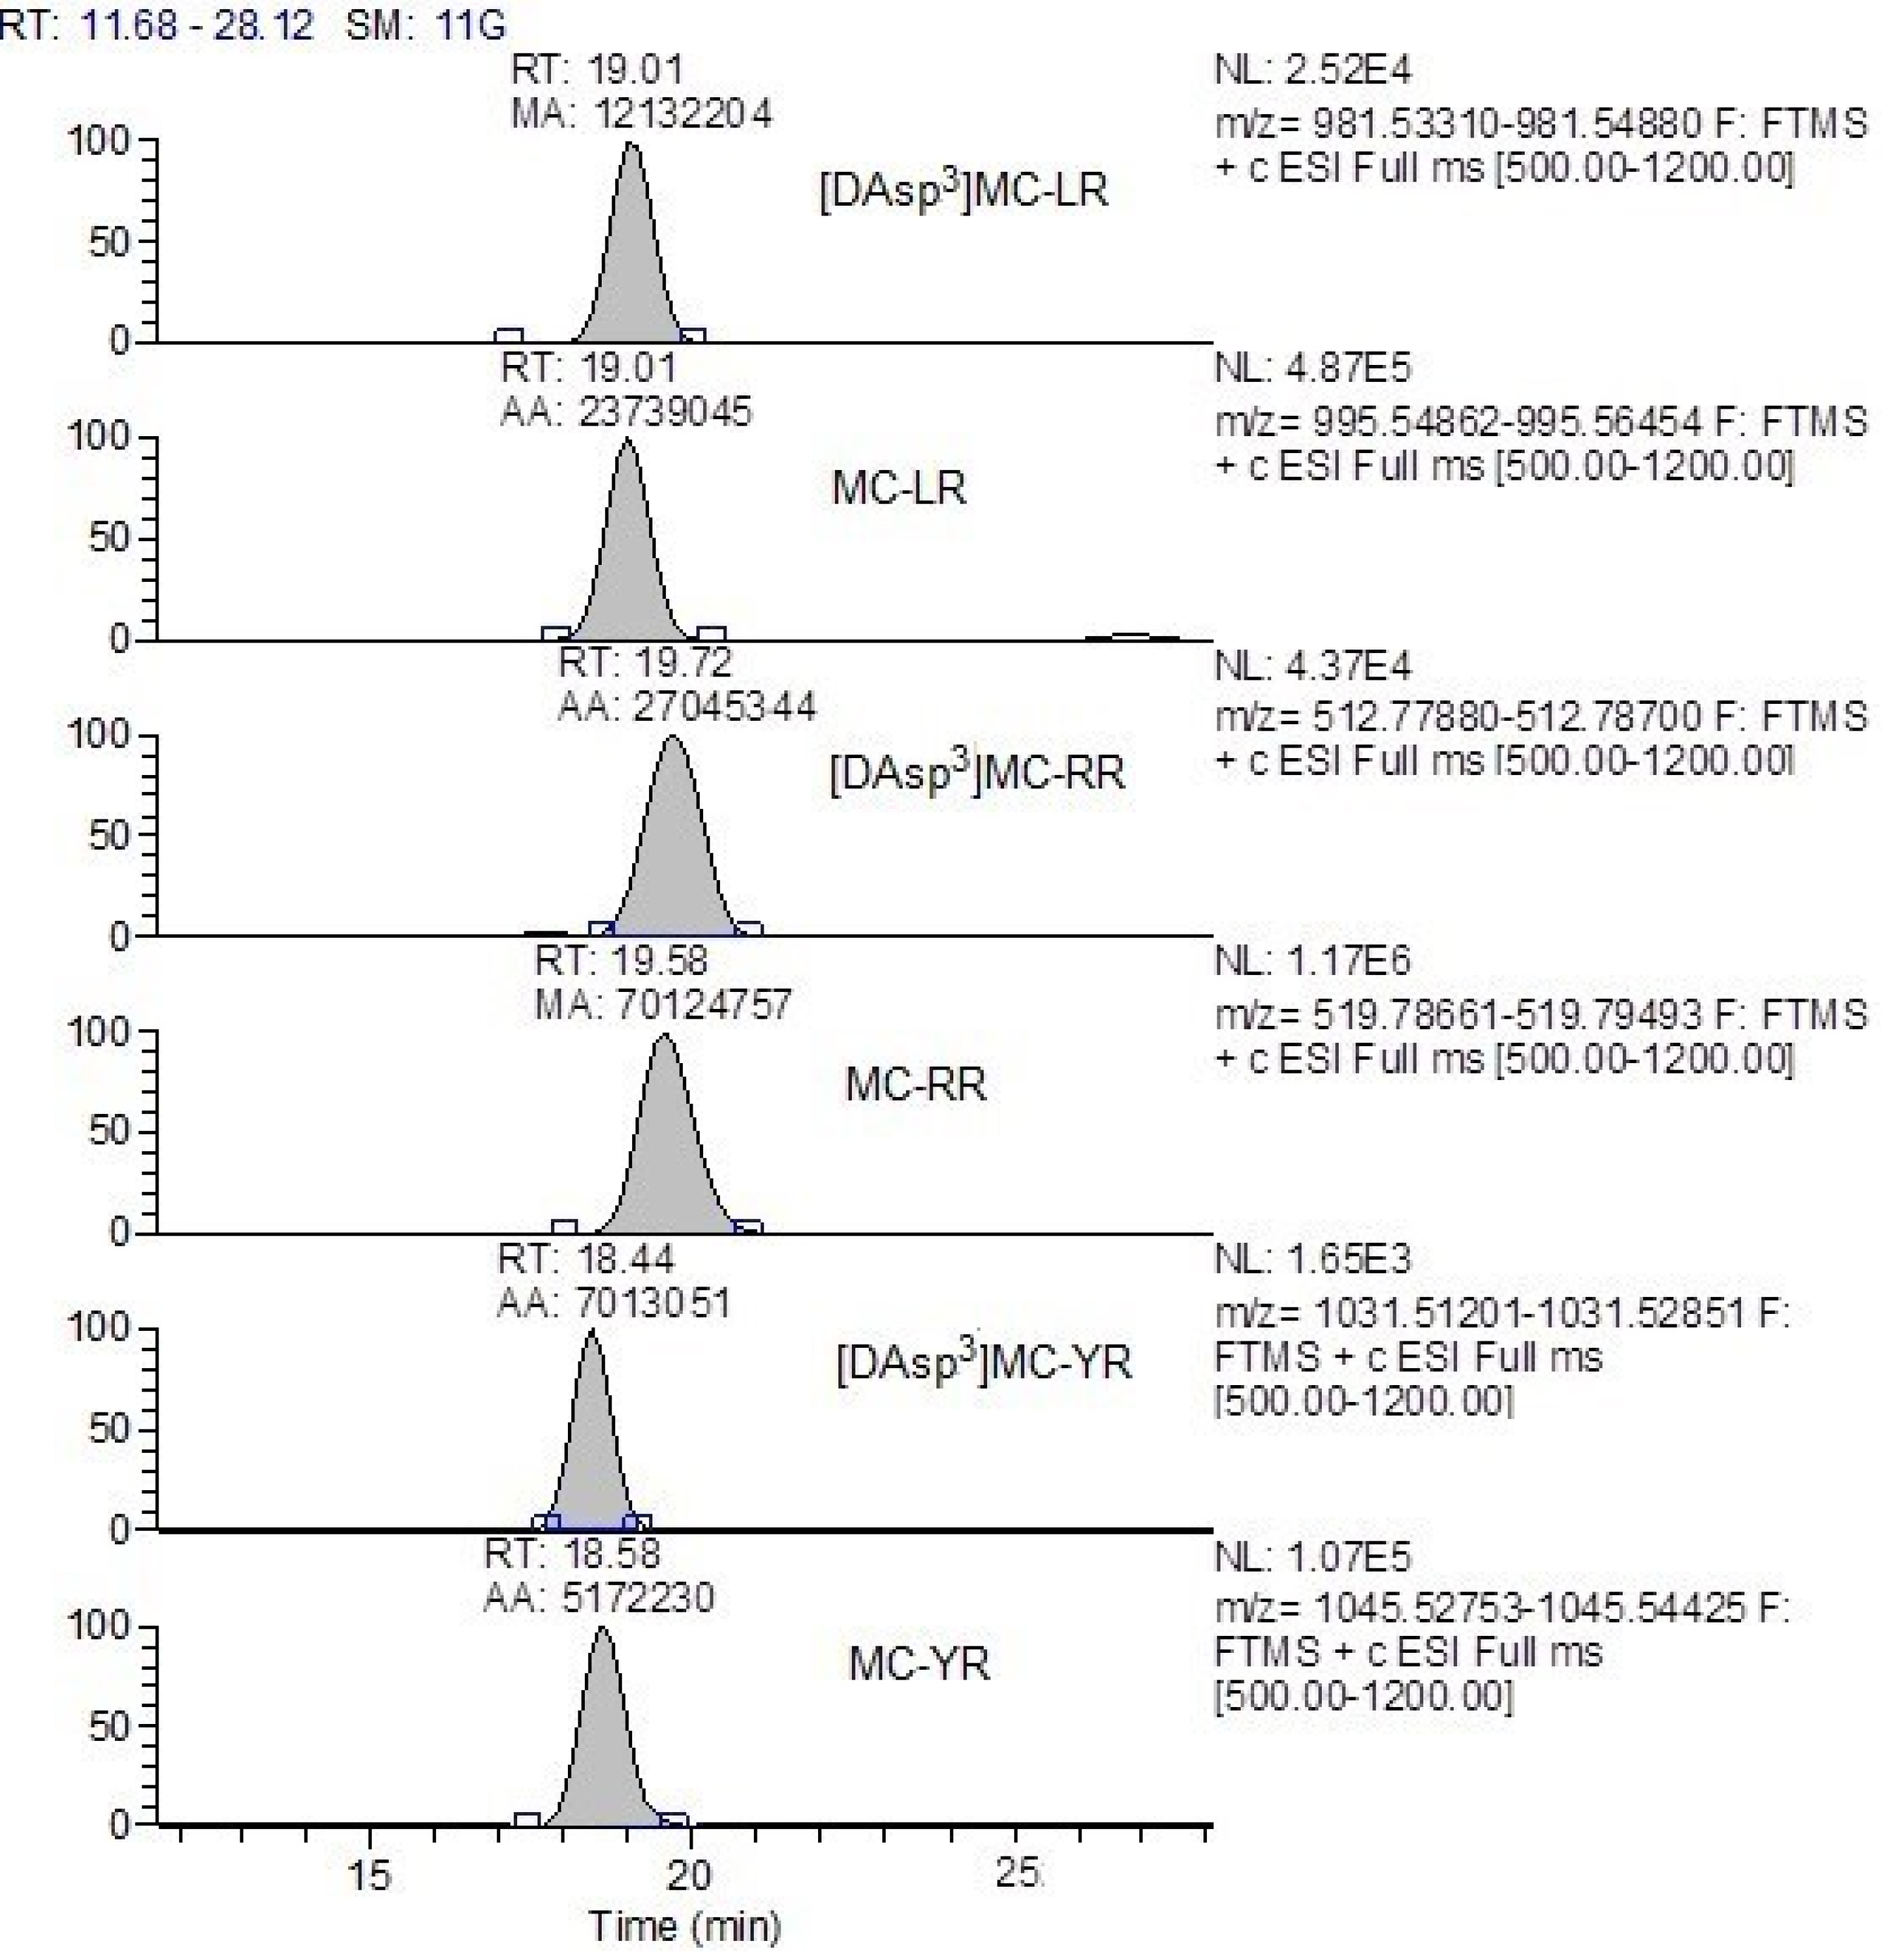
To determine both intracellular and extracellular MCs content, 1 L of water was sampled from each microcosm on Days 1, 21, and 42 of the experiment. The water was filtered through cellulose acetate membrane filters with a pore size of 1.2 µm (Vladisart, Vladimir, Russia). Large zooplankton retained on the filters were removed manually using forceps. Both the filtrate and the filters containing sedimented phytoplankton were frozen and stored until further analysis. The MC profile and quantitative determination of each structural variant were performed using high-performance liquid chromatography coupled with high-resolution mass spectrometry (HPLC–HRMS). Analyses were carried out with a Prominence LC-20 HPLC system (Shimadzu, Kyoto, Japan) coupled to an LTQ Orbitrap XL mass spectrometer (Thermo Fisher Scientific, San Jose, CA, USA). Toxin separation was conducted on a Thermo Hypersil Gold RP C18 column (100 × 3 mm, 3 μm; Thermo Fisher Scientific, San Jose, CA, USA) using a gradient elution mode (0.2 mL min−1) with a mixture of water and acetonitrile containing 0.05% formic acid. Mass spectrometric detection of cyanotoxins was carried out under electrospray ionization (ESI) in positive ion detection mode. Target compounds were identified based on accurate mass measurements of ions [M+H]+ or [M+2H]2+ (resolution 30,000, mass accuracy within 5 ppm), fragmentation spectra, and retention times, which were established using analytical standards under the selected conditions [44]. Quantification was performed using the external standard method with commercially available reference compounds: MC–LR, MC–RR, and MC–YR (Sigma-Aldrich, St. Louis, MO, USA), as well as MC–LY, MC–LA, MC–LW, MC–LF, [D-Asp3]MC-LR, and [D-Asp3]MC-RR (Enzo Life Sciences, Inc., New York, NY, USA). For extracellular MCs quantification, solid-phase extraction (SPE) was employed using Oasis HLB cartridges (60 mg, Waters; toxins were eluted with 4 mL of methanol). Intracellular MCs were extracted from biomass using ultrasonic-assisted extraction with 2 mL of 75% methanol. The limit of quantification (LOQ) for this method was 0.001 µg L−1. Non-detect values do not indicate absolute absence of microcystins. Chromatographic separation of the mixture of standard compounds of MCs is shown in Figure A1. Fragmentation spectra of standard compounds of MCs are presented in Figure A2.

2.4. Allium Cepa Test

For the Allium test, water samples from the microcosms were collected on the same days as for MC analysis (Days 1, 21, and 42). The test was conducted following a standardized protocol [29]. Onion bulbs were immediately germinated in the experimental water samples for three days. Five bulbs were used per treatment; from each bulb, one meristematic root tip was excised to prepare one squash slide. A total of 60 squashed meristem preparations were examined. During the experiment, several genotoxicity biomarkers were assessed: chromosomal aberrations, chromosome lagging, micronuclei (micrographs are shown in Figure A3, Appendix A), aneuploidy, as well as the proportion of dividing cells (mitotic index) and the distribution of cells across different mitotic phases (phase indices). Chromosomal aberrations and chromosome lagging were recorded by counting all anaphases and telophases on the slides, while micronuclei were evaluated in 1000 interphase cells. Cells with altered karyotypes were identified in all metaphase, anaphase, and telophase stages. The mitotic and phase indices were determined by counting 600 cells at various mitotic stages. On average, 5000 cells were analyzed per experimental treatment. The scoring was blinded. To identify potential genotoxic effects in water from the control microcosms caused by uncontrolled environmental factors, an additional assay was conducted using distilled water.
Root length was used to assess overall toxicity. Root growth serves as a macroscopic parameter for the indirect evaluation of cytogenetic alterations. Inhibition of root growth compared to Control is often associated with genotoxic effects [29]. Root length was measured on day 3 during the fixation of roots for cytogenetic analysis (the same onion bulbs were used). Length was measured using a ruler, and the mean value was calculated for each experimental treatment.
The statistical significance of differences between treatments was evaluated using the non-parametric Kruskal–Wallis test, with p < 0.05 considered significant. Correlation analysis was performed; however, no significant associations were found.

3. Results

At the beginning of the experiment, the abundance of cyanobacteria was 4.6 × 10⁷ cells L−1 in Treatment I, 2.2 × 10⁷ cells L−1 in Treatment II, and 1.2 × 10⁷ cells L−1 in Treatment III. The biomass of cyanobacteria varied substantially among the different treatments (Table 1).
In Treatments I and II, cyanobacteria made up 99% of the total phytoplankton biomass, while in Treatment III they accounted for 95%. In Treatment I, the proportion of cyanobacteria in the phytoplankton community decreased markedly within one week from the start of the experiment, dropping to approximately 40% of total phytoplankton biomass, and to just 3% after two weeks. In Treatments II and III, cyanobacterial biomass remained around 70% for two weeks. Subsequently, a shift in the dominant algal groups occurred. Cyanobacterial biomass declined, and in Treatment I, Cryptophyta and Chlorophyta became dominant, while in Treatments II and III, the Chlorophyta and the Charophyceae prevailed. Cyanobacterial abundance remained low for the remainder of the experiment.
The composition of the most abundant cyanobacterial species was similar across experimental treatments. On Day 1, the dominant taxa in descending order of abundance were Aphanizomenon flos-aquae, Microcystis aeruginosa, Dolichospermum sp., Gloeotrichia echinulata, Aphanocapsa minutissima, and Snowella sp. On Day 21, the dominant species were Microcystis aeruginosa, Aphanocapsa delicatissima, A. planctonica, Planktolyngbya limnetica, Woronichinia elorantae, and Snowella sp. By the end of the experiment (Day 42), the dominant taxa were as follows: in Treatment I—Aphanocapsa delicatissima, A. planctonica, Microcystis aeruginosa; in Treatment II—Aphanocapsa delicatissima, A. planctonica, Microcystis aeruginosa, Chroococcus sp., and Merismopedia sp.; in Treatment III—Aphanocapsa delicatissima, A. planctonica, and Merismopedia sp.
At the start of the experiment, the level of MCs in the water was directly related to the amount of cyanobacterial biomass in each treatment (Table 2).
The highest extracellular concentration of MCs was detected in the water of microcosms from Treatment I. However, the intracellular concentration of toxins in this treatment was significantly lower than in Treatments II and III (Table 3). The highest intracellular concentration of MCs was observed in Treatment II on Day 1 of the experiment (Table 3). Subsequently, after three weeks, water from microcosms of this treatment exhibited higher MC concentrations than the other treatments. MCs persisted the longest in Treatment II. On Day 42, MCs were detected only in Treatment II, both in the water and in the biomass (Table 2 and Table 3).
No genotoxic effects were detected in water from the control microcosms compared to the assay conducted with distilled water.
The toxicity of water changed over the course of the experiment. On Day 1, significant inhibition of root elongation was observed in all treatments containing cyanobacteria (Table 4).
The most significant root growth inhibition, approximately twofold compared to Control, was observed in Treatment I, which had the highest cyanobacterial biomass. By Day 21, there was no evidence of any toxic effects in Treatments I and II. However, in Treatment III, which had the lowest abundance of cyanobacteria, root elongation was 18% lower than in Control. By Day 42, inhibition of root growth was again observed in Treatments I and II. However, the degree of inhibition in Treatment I was less significant than on Day 1 of the experiment.
Significant genotoxic effects were detected during the experiment in Treatments I and II, which initially contained high cyanobacterial biomass, while no such effects were observed in Treatment III, characterized by the lowest cyanobacterial biomass. On Day 1, the total frequency of chromosomal aberrations plus lagging chromosomes (CA+lag) was 1.04% (Treatment I) vs. 0.41% (Control); aneuploidy 0.34% (I) vs. 0.06%; micronuclei were 0.18‰ (I) vs. 0.04‰. On Day 21, CA+lag reached 0.84% (Treatment II) vs. 0.40% (Control). On Day 42, CA+lag further increased to 2.23% (I) vs. 0.47% and micronuclei 0.20‰ (I and II) vs. 0.02‰. By contrast, Treatment III showed no statistically significant increases over Control across time points.
On Day 1 of the experiment, in Treatment I, a mutagenic effect was detected at the highest total concentration of MCs in water, expressed in an increase in the frequency of chromosomal aberrations, chromosome lagging, and the appearance of micronuclei (Figure 1, Figure 2 and Figure 3).
A marked increase in aneuploidy frequency by 0.34% (Day 1, Treatment I) vs. 0.06% (Control) was also observed (Figure 4), likely resulting from damage to the mitotic spindle or pericentromeric chromosome regions. On Day 21, when cyanobacterial biomass as well as intracellular and extracellular MC concentrations had decreased, the only genotoxic effect still detected was chromosome lagging. This effect persisted until Day 42. In addition, the frequency of micronuclei (Figure 3) increased again (Day 42), despite the absence of detectable microcystins in both water and cyanobacterial biomass in the microcosms of this treatment.
In Treatment II, which had an initially lower biomass of cyanobacteria than in Treatment I, no mutagenic effects were observed on Day 1 of the experiment. Genetic abnormalities appeared later, coinciding with the onset of cyanobacterial cell degradation and an increase in MC concentrations in the water (Table 2). Increased frequency of lagging chromosomes was observed on Day 21 (Figure 2). The frequency of micronuclei was higher than in Control on both Day 21 and Day 42 (Figure 3).
In all experimental treatments, cells exhibiting disturbances such as aneuploidy, polyploidy, and mitotic anomalies were detected, including colchicine-type mitosis, particularly in Treatments I and II. These abnormalities are likely associated with damage to the mitotic spindle.
On Day 1 of the experiment, the average values of the mitotic index in all treatments with cyanobacteria were lower than those in Control (Figure 5), which is consistent with the data on root growth inhibition.
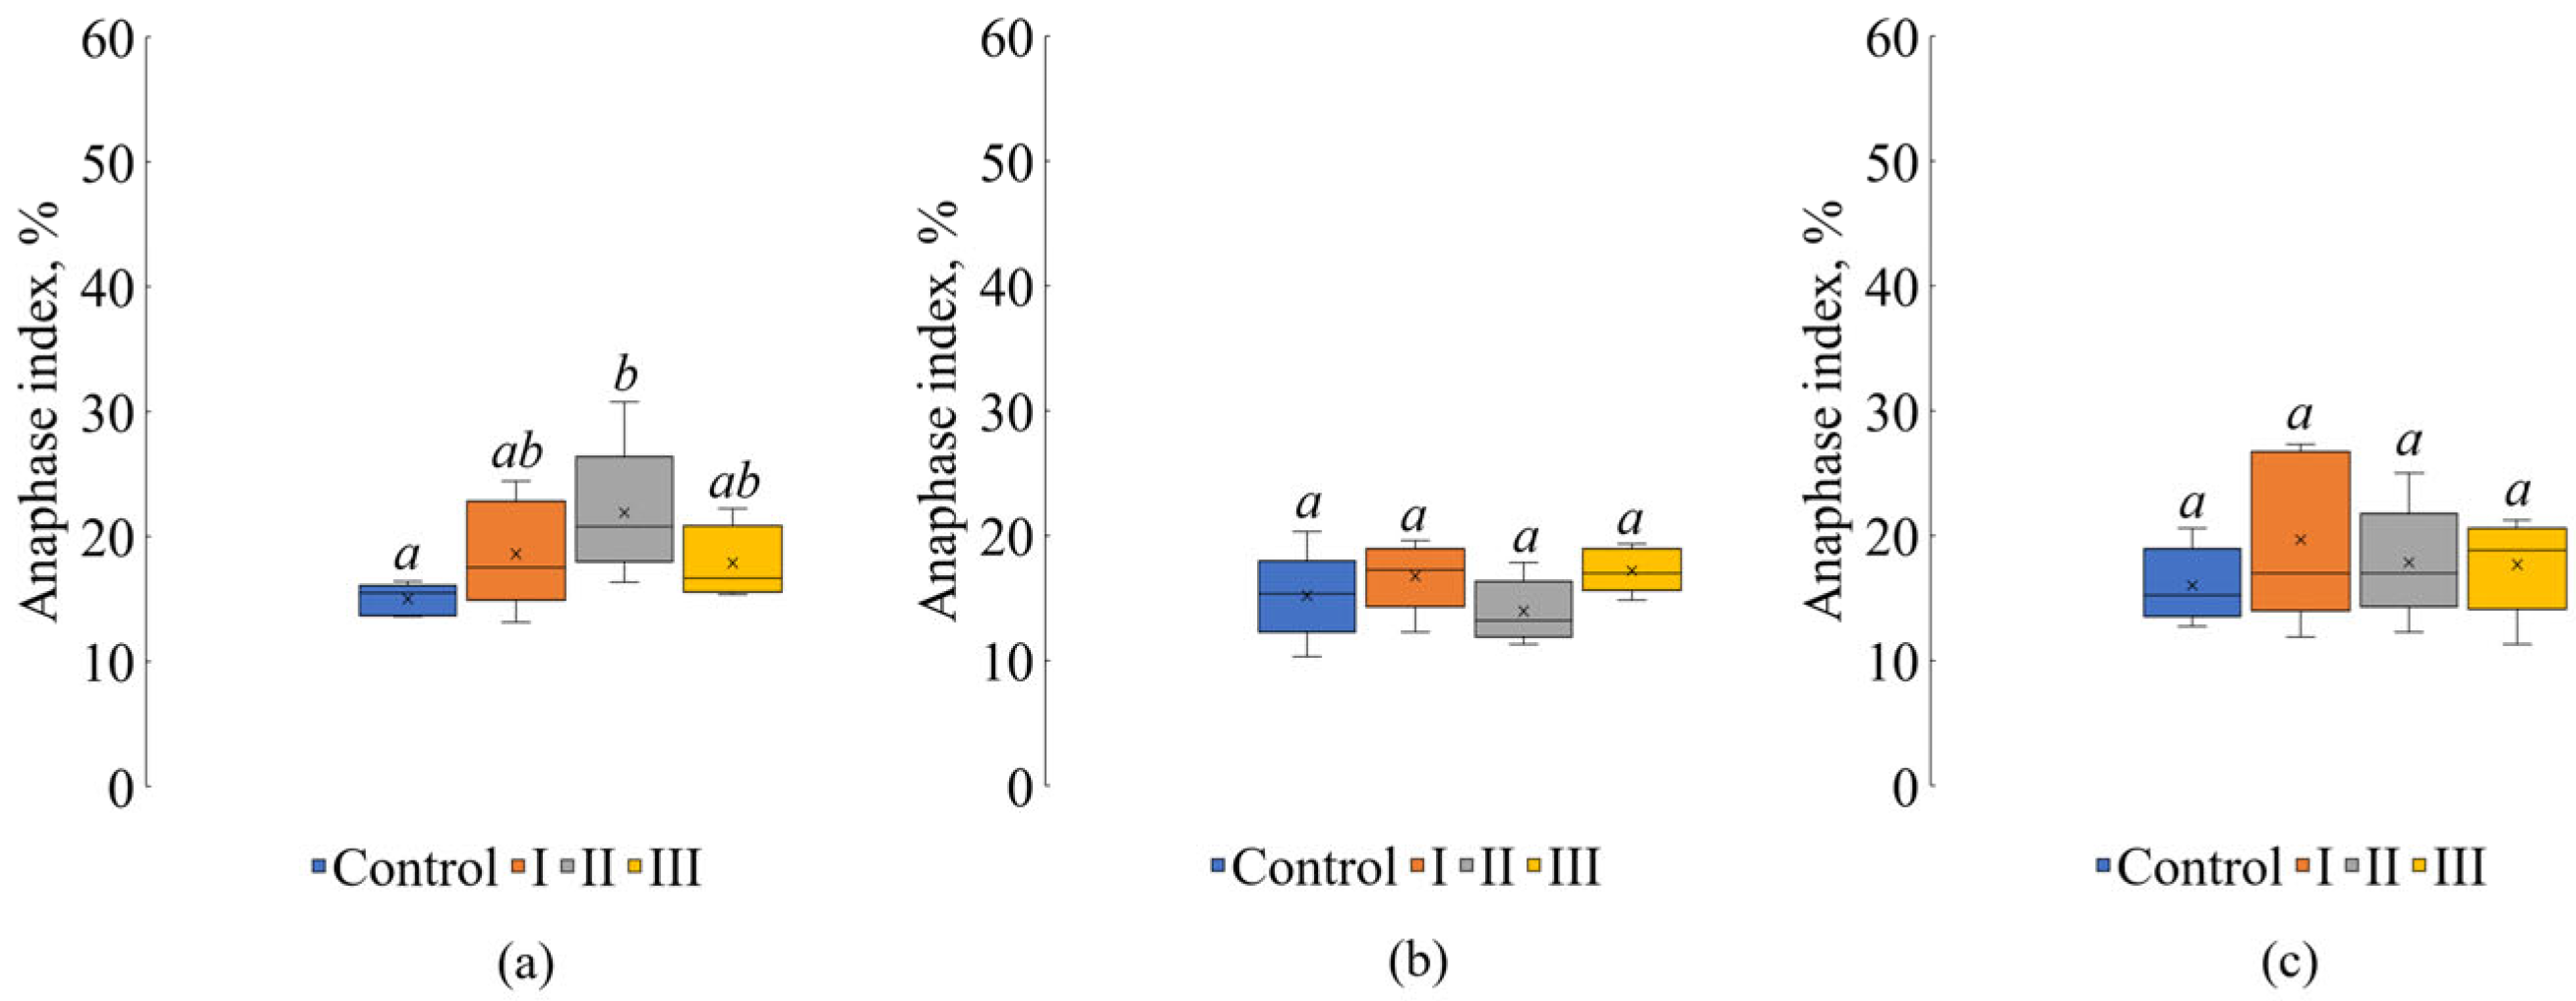
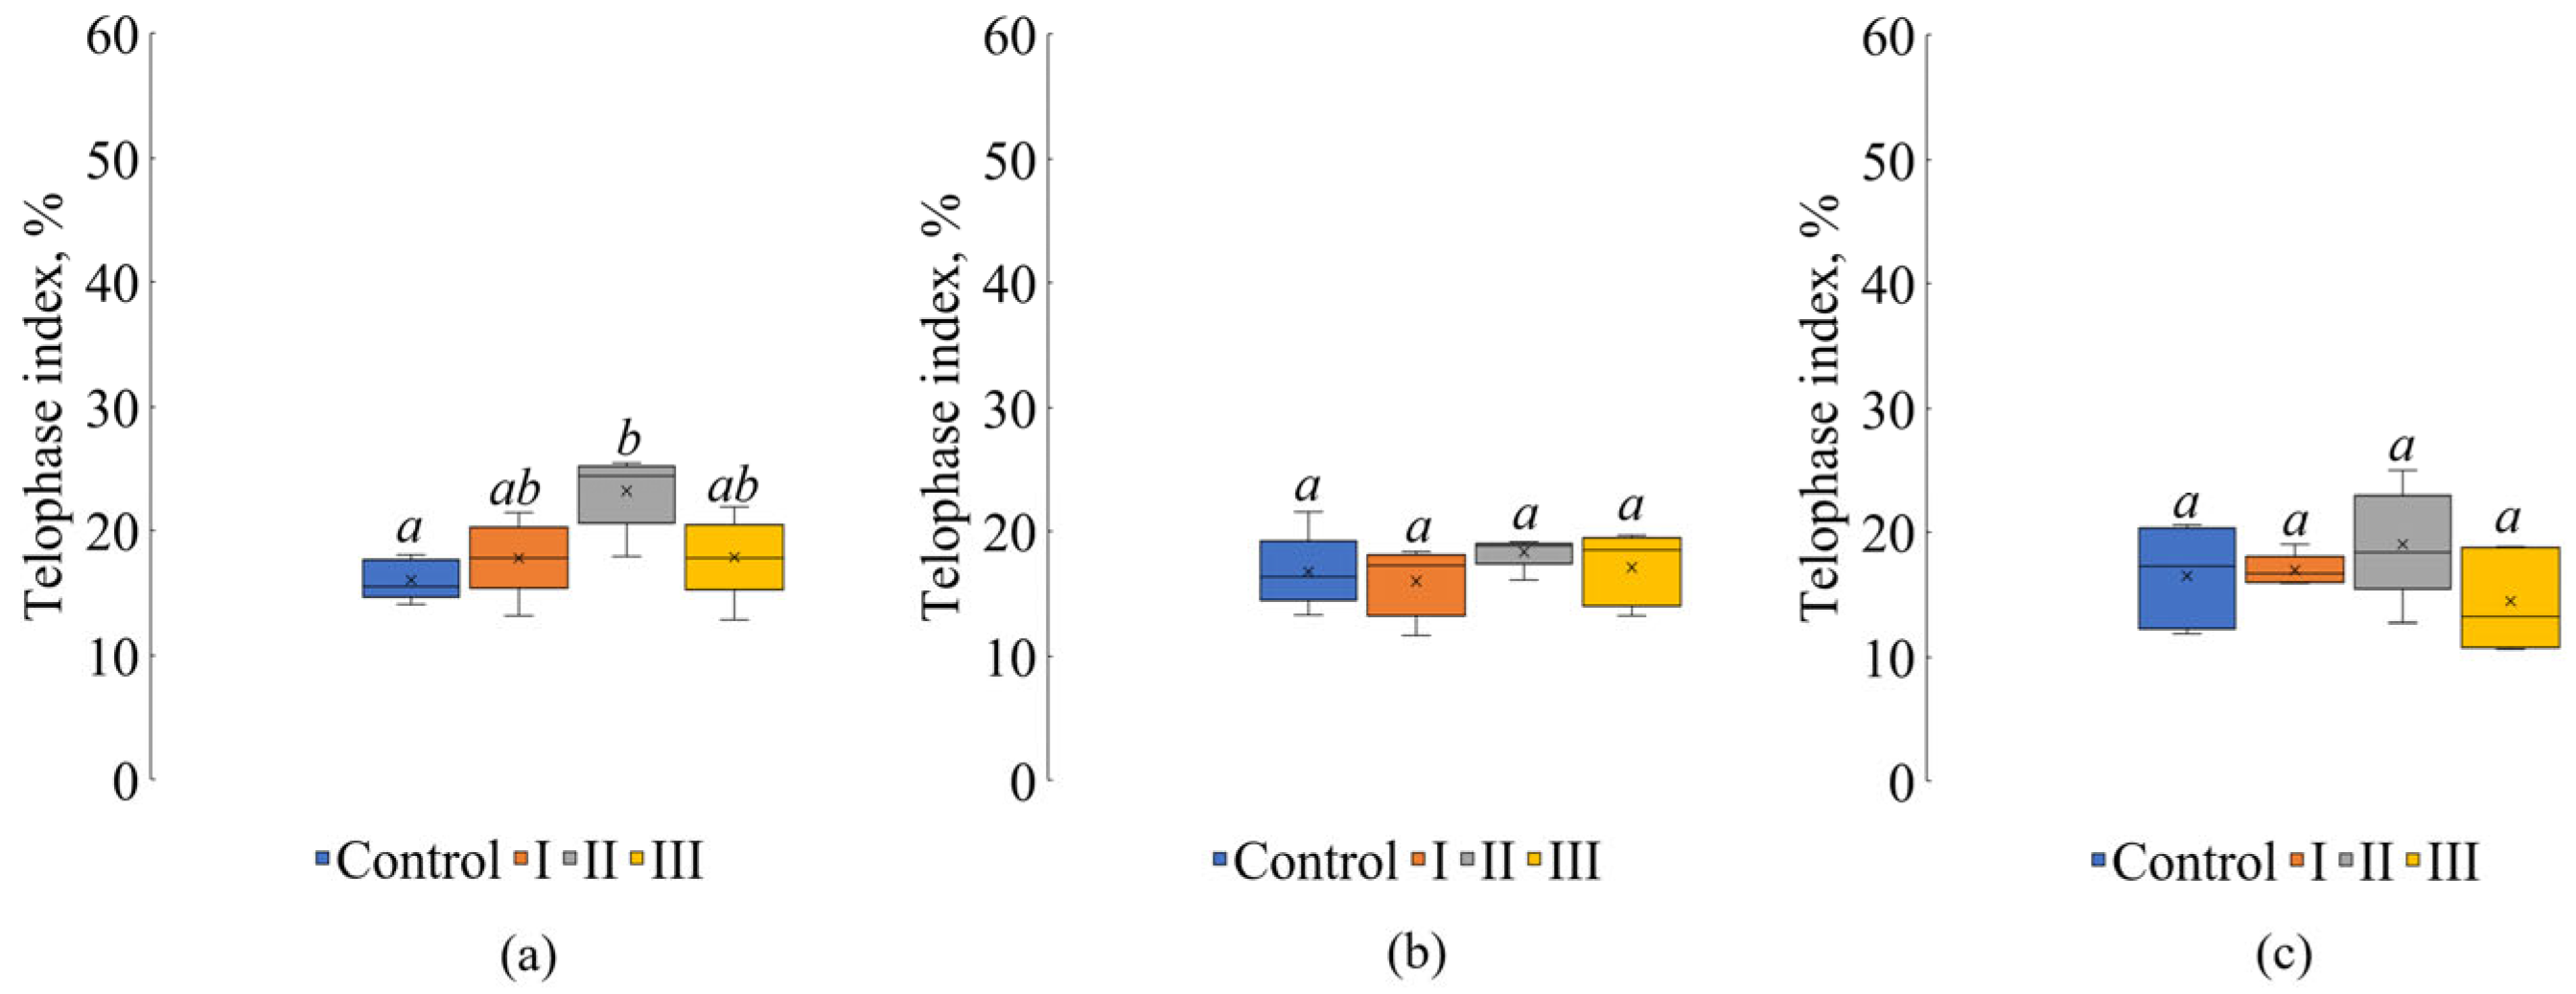
At the beginning of the experiment, the most significant mitosis-modifying effect was observed in Treatment II, where the biomass of cyanobacteria was lower than in Treatment I, but the intracellular concentration of MCs was the highest (Table 3). The proportion of cells in prophase was significantly lower (Figure 6) than in Control, while the proportions of cells in anaphase and telophase were higher (Figure 7 and Figure 8). A shortened prophase duration leads to impaired chromosome formation and spindle assembly, and an increased proportion of cells in anaphase may result from spindle malfunction, which can subsequently cause unequal distribution of genetic material to daughter cells.
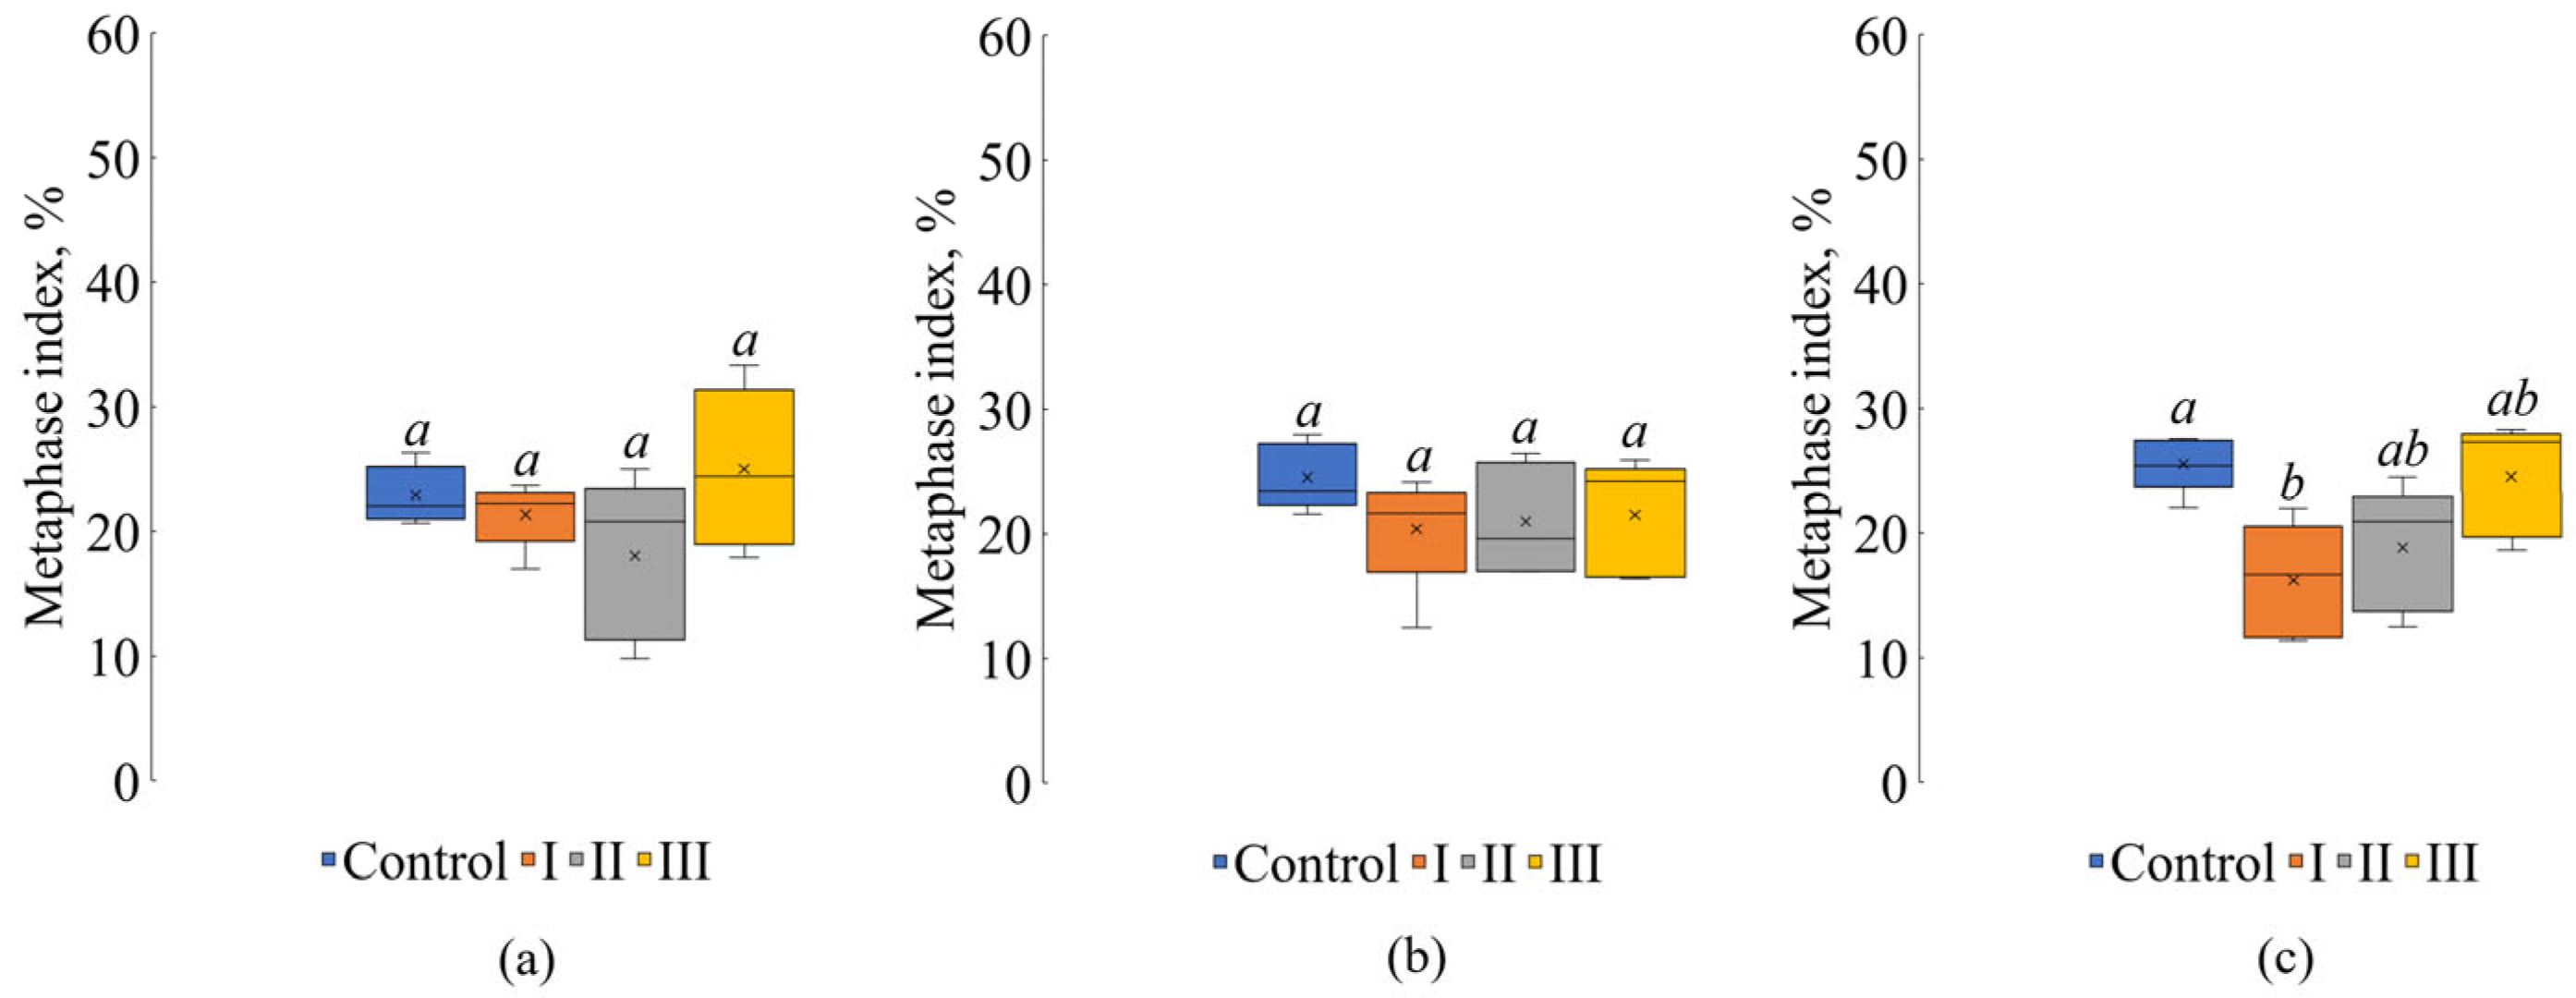
After 21 days, the mitotic and phase indices in the treatments with added cyanobacteria did not differ from Control. However, on Day 42, in Treatment I, the number of cells undergoing mitosis again decreased compared to Control, and the metaphase index declined (Figure 9). In Treatments II and III, a downward trend in mitotic and metaphase indices was observed, but the data did not show a statistically significant difference from Control.

4. Discussion

A large biomass of cyanobacteria and high concentrations of MCs in the water at the beginning of the experiment (Day 1) were accompanied by pronounced toxic and genotoxic effects. This may be related to the effect of cyanobacterial toxins on the mitotic spindle and the disruption of mitosis at various stages. Similar mitotic disturbances were detected using the Allium test in experiments studying the mutagenic effects of extracts from two strains of Microcystis aeruginosa, one of which produced microcystin and the other aeruginosin [14]. Both strains inhibited root growth and caused mitotic abnormalities. A statistically significant increase in the frequency of chromosomal aberrations using the Allium test was observed under the influence of both purified MC and water from a reservoir during a cyanobacterial bloom period [34].
Cytogenotoxic effects did not correlate directly with cyanobacterial biomass. Instead, toxicity was more strongly associated with MC concentrations in the water, which reflected the physiological state of the cyanobacterial cells. The relationship between MC production and the developmental stage of cyanobacterial populations is well known. Intracellular concentrations of MCs are typically higher at the beginning of a bloom. A rapid increase in cell density is accompanied by enhanced expression of the mcyE gene and increased MC synthesis [2]. At the beginning of the experiment, in Treatment I, the concentration of MCs in the water exceeded the intracellular concentration of toxins. This indicates that an active process of cyanobacterial cell lysis was taking place, accompanied by the release of MCs into the environment. The rapid decline in the abundance and biomass of cyanobacteria confirms this. In Treatment II, despite the initial cyanobacterial biomass being lower than in Treatment I, the intracellular concentration of MCs was eight times higher. The release of toxins into the water occurred later, during the subsequent cell death. On Day 21, the concentration of MCs in the water was highest in Treatment II compared to the other treatments, and significant genotoxic effects were detected in the microcosms of this treatment.
By Day 42, MCs were either undetectable or present only in trace amounts in the water and biomass. However, a toxic effect on root growth was recorded, and some genotoxic indicators, such as an increased frequency of micronuclei formation and chromosome lagging, were also observed. These toxic and mutagenic effects were likely caused by other cyanobacterial metabolites that were not monitored during the experiment.
In addition to MCs, Microcystis aeruginosa synthesizes other secondary metabolites that have been found to exhibit cytotoxic and genotoxic properties. For example, aeruginosin has been shown to affect the cell cycle, promote the formation of micronuclei, chromosomal aberrations, apoptotic bodies, and induce both apoptosis and necrosis. An extract of an M. aeruginosa strain producing aeruginosin demonstrated even greater genotoxicity than an extract from a strain containing MC [14]. Oligopeptides such as microginins and cyanostatin B, produced by M. aeruginosa and some other cyanobacteria, caused single-strand DNA breaks and genomic instability manifested by the formation of micronucleated cells, micronuclei, nuclear buds, and bridges [45]. These findings highlight the need for greater attention to be given to the study of lesser-known secondary metabolites of cyanobacteria, whose presence may pose risks to aquatic organisms and human health.
Complementary metabolomics workflows now enable the detection and annotation of cyanobacterial oligopeptides beyond microcystins directly in environmental samples. Recent studies combining untargeted LC–HRMS with curated resources (e.g., CyanoMetDB) and molecular-networking style data processing routinely reveal suites of aeruginosins, microginins, anabaenopeptins and cyanopeptolins in bloom waters. Such non-targeted and multi-toxin approaches expand chemical coverage and help explain persistent genotoxic endpoints when extracellular MCs are low or undetectable, aligning with our observation that MC-only monitoring may underestimate risk. Accordingly, we recommend complementing conventional MC quantification with untargeted HRMS screening of cyanobacterial oligopeptides in future monitoring and environmental risk assessment [46,47,48,49,50].
Environmental cyanotoxins may exhibit greater toxicity than their isolated counterparts due to interactions with other pollutants [13,24]. They can interact with other cyanotoxins as well as with pollutants of different nature originating from various biological or anthropogenic sources. Synergistic or additive effects have been observed when cyanotoxins act in combination with fungal or algal toxins, pathogenic bacteria, and protozoa [23,51]. The presence of cyanotoxins exacerbates the harmful impact of heavy metals, pesticides, microplastics, and other pollutants on living organisms [23].
Aneugenic and clastogenic mutations detected on Day 42 in the cyanobacterial treatments indicate that the genotoxic effects of cyanobacterial blooms may be long-lasting. The absence of detectable concentrations of MCs, as measured by current analytical methods, does not guarantee the safety of water that has previously experienced cyanobacterial blooms for human health. In addition to microcystins—produced not only by Microcystis aeruginosa but also by many other cyanobacterial species—other cyanotoxins may have been present in the microcosm water. The cyanobacteria abundant in the microcosms are known to synthesize a variety of toxins. For example, Aphanizomenon and Dolichospermum are capable of producing the alkaloids anatoxin-a, saxitoxin, and cylindrospermopsin, as well as a variety of bioactive peptides [52,53]. Certain Aphanocapsa species are known to synthesize cyanopeptolins [54]. These metabolites also exhibit toxic effects. For instance, cyanopeptolin CP1020 was found to disrupt the transcription of genes associated with essential biological and physiological processes in Danio rerio embryos. As a result, DNA damage recognition and repair mechanisms were impaired, and neurotoxic effects were observed [55]. The persistent or re-emerging genotoxic effects observed on Day 42 were likely due to the combined cumulative action of MCs and other metabolites released during cell lysis or produced later by dominant cyanobacterial species (Aphanocapsa, Merismopedia, Snowella, Chroococcus). The increase in micronuclei on Day 42 is also consistent with concurrent action of non-MC cyanopeptides and other metabolites. This interpretation is in line with recent metabolomics reports showing that bloom waters often contain diverse cyanopeptides (oligopeptides) beyond microcystins, which may contribute to cytogenotoxic outcomes even when extracellular MCs are low or undetectable. Data on the production of secondary metabolites, particularly toxins, by picocyanobacteria are very limited [56]. Various cyanobacterial species coexist within phytoplankton communities, with species succession occurring throughout the growing season. Monitoring only MC concentrations may lead to an underestimation of the actual level of genotoxic risk. Accordingly, it is recommended to use multi-toxin screening panels and/or untargeted metabolomics to capture the diverse cyanopeptides/oligopeptides that co-occur in blooms. Field and laboratory studies demonstrate that these approaches consistently reveal tens to hundreds of non-MC cyanopeptides and strain-specific mixtures, which help explain biological effects when extracellular MCs are low or undetectable [57,58,59,60,61].
By the end of the experiment, the proportion of cyanobacteria in the phytoplankton biomass was low. It can be assumed that the mitosis-modifying and mutagenic effects observed on Day 42 were caused by the degradation products of cyanotoxins. The possibility of toxin production by periphytic or benthic cyanobacteria, whose abundance was not accounted for in the experiment, cannot be excluded either. Data on the stability and fate of cyanotoxins in the environment, their potential transfer through trophic chains, as well as the toxicity of their degradation products, remain scarce [25]. This issue requires further investigation.
The observed mutations, such as the formation of micronuclei and aneuploidy, are known to be involved in carcinogenesis. Thus, the genotoxic effects of cyanotoxins may initiate or promote cancer development. Existing studies do not provide conclusive evidence of a direct link between acute or chronic exposure to cyanotoxins and cancer development in humans [11]. At the same time, some animal studies have demonstrated the carcinogenic potential of cyanotoxins. Rodent experiments show that microcystin and nodularin can act as tumor promoters, with nodularin also likely capable of initiating tumors [9]. The carcinogenic potential of cylindrospermopsin may be related to the formation of genotoxic metabolites and impairment of cellular antioxidant defense mechanisms [11]. MCs can exacerbate the effects of carcinogenic factors by stimulating cell proliferation [2,23,62]. The total concentration of MCs, including the highly toxic MC-LR, did not exceed the WHO guideline value for drinking water (1 µg L−1). Nevertheless, disturbances in mitosis and alterations in genetic material were detected both during cyanobacterial blooms and, importantly, in the subsequent period. Cyanotoxins are capable of inducing genotoxic effects at low concentrations, even in the absence of other detectable toxic effects. A recent review examining various toxic effects of cyanotoxins reported that genotoxicity proved to be the most sensitive endpoint, demonstrating the lowest observed effect concentrations (LOECs) compared to neurotoxicity and oxidative stress. Notably, genotoxic effects occurred at the lowest concentrations tested both in vivo and in vitro, suggesting that genotoxic endpoints represent the most sensitive indicators among these three toxicity categories [63]. While low concentrations of cyanotoxins may not cause acute damage after short-term or one-time exposure, due to the organism’s ability to repair genetic material and restore mitotic processes, they pose a significant risk when exposed over a long period of time. Prolonged exposure to cyanotoxins may result in the accumulation of mutagenic effects, thereby increasing the risk of developing various diseases [11]. Thus, current thresholds may not protect against genotoxic risks.
Given the complex composition of bioactive compounds in natural waters affected by cyanobacterial blooms, it is advisable to develop accessible analytical methods capable of expanding the range of detectable toxins. Additionally, molecular screening for the presence of genes involved in the biosynthesis of specific cyanotoxins should be conducted. A more comprehensive understanding of the potential for secondary metabolite production by diverse cyanobacterial species would enable a clearer evaluation of the individual contributions of these toxins to the observed genotoxicity. This, in turn, would enhance our understanding of how shifts in cyanobacterial community structure affect the persistence and severity of toxic and genetic impacts on exposed organisms.

5. Conclusions

The Allium test revealed cytotoxic, mitosis-modifying, and mutagenic effects in water samples from experimental ecosystems with a high abundance of cyanobacteria at the beginning of the experiment. The severity of genotoxic effects depended on the abundance of cyanobacteria. Peak genotoxic risk was associated with the late stages of cyanobacterial blooms, characterized by extensive cell lysis and consequent microcystin release into the water, causing marked cytogenotoxic disturbances.
The confirmed genotoxicity of cyanobacterial metabolites underscores the necessity of comprehensive risk assessment for cyanobacterial blooms in aquatic environments. This study demonstrates that cytogenotoxic effects can persist in aquatic ecosystems even after cyanobacterial proliferation has visibly subsided. Further laboratory and field research is essential to elucidate the mechanisms underlying these prolonged or recurrent genotoxic effects. To achieve more robust and definitive conclusions, the Allium test should be complemented by additional genetic assays, such as the comet assay and higher-tier assays (mammalian cell genotoxicity tests and omics).

Author Contributions

Conceptualization, S.K., D.P., and I.Y.; Methodology, S.K., I.Y., D.P., and E.C.; Validation, S.K., D.P., E.C., I.S., and G.S.; Investigation, D.P., S.K., A.S., E.C., and R.F.; Data curation, S.K.; Writing—original draft preparation, S.K. and D.P.; Writing—review and editing, S.K. and D.P.; Project administration, G.S. All authors have read and agreed to the published version of the manuscript.

Funding

This research was funded by Ministry of Science and Education of the Russian Federation [grant numbers 124032500016-4 and 124032100076-2]; the state budget issue FFZF-2025-0017 and by the Federal Academic Leadership Program “Priority 2030” of the Ministry of Science and Higher Education of the Russian Federation, subject-matter H-477-99_2021-2023.

Data Availability Statement

The data presented in the current study are available from the corresponding author upon reasonable request.

Acknowledgments

We are grateful to the anonymous reviewers for their constructive comments and suggestions and to Roman Krasovsky for his valuable help with English language editing.

Conflicts of Interest

The authors declare no conflict of interest. The funders had no role in designing the study; in the collection, analysis, or interpretation of the data; in the writing of the manuscript; or in the decision to publish the results.

Appendix A

Figure A1. Extracted ion chromatogram of high resolution (mass accuracy within 5 ppm) for standard compounds of MCs (from top to bottom): m/z 981.54095 ([M+H] + [D–Asp3]MC–LR); m/z 995.55658 ([M+H] + MC–LR); m/z 512.7829 ([M+2H]2 + [D–Asp3]MC–RR); m/z 519.79077 ([M+2H]2 + MC–RR); m/z 1031.5203 ([M+H] + [D–Asp3]MC–YR); m/z 1045.53589 ([M+H] + MC–YR).
Environments 12 00321 g0a1
Figure A2. Fragmentation mass-spectra for MCs reference compounds (from top to bottom): m/z 981.54095 ([M+H] + [D–Asp3]MC–LR); m/z 995.55658 ([M+H] + MC–LR); m/z 512.7829 ([M+2H]2 + [D–Asp3]MC–RR); m/z 519.79077 ([M+2H]2 + MC–RR); m/z 1045.53589 ([M+H] + MC–YR).
Environments 12 00321 g0a2
Figure A3. Micrographs of cells with micronuclei ((a)—one large micronucleus at the center; (b)—four smaller micronuclei at the center) in the root tips of Allium cepa L.
Environments 12 00321 g0a3

References

  1. Wood, R. Acute animal and human poisonings from cyanotoxin exposure—A review of the literature. Environ. Int. 2016, 91, 276–282. [Google Scholar] [CrossRef]
  2. Buratti, F.M.; Manganelli, M.; Vichi, S.; Stefanelli, M.; Scardala, S.; Testai, E.; Funari, E. Cyanotoxins: Producing organisms, occurrence, toxicity, mechanism of action and human health toxicological risk evaluation. Arch. Toxicol. 2017, 91, 1049–1130. [Google Scholar] [CrossRef] [PubMed]
  3. Svircev, Z.; Drobac, D.; Tokodi, N.; Mijovic, B.; Codd, G.; Meriluoto, J. Toxicology of microcystins with reference to cases of human intoxications and epidemiological investigations of exposures to cyanobacteria and cyanotoxins. Arch. Toxicol. 2017, 91, 621–650. [Google Scholar] [CrossRef] [PubMed]
  4. Egorova, N.A.; Kuz, N.V.; Sinitsyna, O.O. Materials for the substantiation of the hygienic standard of microcystin-LR in water of water objects. Hyg. Sanit. 2018, 97, 1046–1052. (In Russian) [Google Scholar] [CrossRef]
  5. Shen, X.; Lam, P.K.S.; Shaw, G.R.; Wickramasinghe, W. Genotoxicity investigation of a cyanobacterial toxin, cylindrospermopsin. Toxicon 2002, 40, 1499–1501. [Google Scholar] [CrossRef]
  6. Díez-Quijada, L.; Hercog, K.; Štampar, M.; Filipič, M.; Cameán, A.M.; Jos, Á.; Žegura, B. Genotoxic effects of cylindrospermopsin, microcystin-LR and their binary mixture in human hepatocellular carcinoma (HepG2) cell line. Toxins 2020, 12, 778. [Google Scholar] [CrossRef]
  7. Wu, Q.; Li, M.; Gao, X.; Giesy, J.P.; Cui, Y.; Yang, L.; Kong, Z. Genotoxicity of crude extracts of cyanobacteria from Taihu Lake on carp (Cyprinus carpio). Ecotoxicology 2011, 20, 1010–1017. [Google Scholar] [CrossRef]
  8. Sierosławska, A.; Rymuszka, A. Cylindrospermopsin induces oxidative stress and genotoxic effects in the fish CLC cell line. J. Appl. Toxicol. 2015, 35, 426–433. [Google Scholar] [CrossRef]
  9. Žegura, B.; Straser, A.; Filipič, M. Genotoxicity and potential carcinogenicity of cyanobacterial toxins—A review. Mutat. Res. 2011, 727, 16–41. [Google Scholar] [CrossRef]
  10. Bouaïcha, N.; Miles, C.O.; Beach, D.G.; Labidi, Z.; Djabri, A.; Benayache, N.Y.; Nguyen-Quang, T. Structural diversity, characterization and toxicology of microcystins. Toxins 2019, 11, 714. [Google Scholar] [CrossRef]
  11. Vankova, D.; Pasheva, M.; Kiselova-Kaneva, Y.; Ivanov, D.; Ivanova, D. Mechanisms of cyanotoxin toxicity—carcinogenicity, anticancer potential, and clinical toxicology. In Medical Toxicology; Pınar, E., Tomohisa, O., Eds.; IntechOpen: Rijeka, Croatia, 2021. [Google Scholar] [CrossRef]
  12. Žegura, B. An overview of the mechanisms of microcystin-LR genotoxicity and potential carcinogenicity. Mini Rev. Med. Chem. 2016, 16, 1042–1062. [Google Scholar] [CrossRef]
  13. Mankiewicz, J.; Walter, Z.; Tarczynska, M.; Palyvoda, O.; Wojtysiak-Staniaszczyk, M.; Zalewski, M. Genotoxicity of cyanobacterial extracts containing microcystins from Polish water reservoirs as determined by SOS chromotest and comet assay. Environ. Toxicol. 2002, 17, 341–350. [Google Scholar] [CrossRef]
  14. Laughinghouse, H.D., IV; Prá, D.; Silva-Stenico, M.E.; Rieger, A.; Frescura, V.D.-S.; Fiore, M.F.; Tedesco, S.B. Biomonitoring genotoxicity and cytotoxicity of Microcystis aeruginosa (Chroococcales, Cyanobacteria) using the Allium cepa test. Sci. Total Environ. 2012, 432, 180–188. [Google Scholar] [CrossRef] [PubMed]
  15. Sierosławska, A.; Rymuszka, A. Assessment of the potential genotoxic and proapoptotic impact of selected cyanotoxins on fish leukocytes. Centr. Eur. J. Immunol. 2013, 38, 190–195. [Google Scholar] [CrossRef]
  16. IARC. Ingested nitrate and nitrite, and cyanobacterial peptide toxins. In IARC Monographs on the Evaluation of Carcinogenic Risks to Humans; International Agency for Research on Cancer: Lyon, France, 2010; Volume 94, pp. 1–412. [Google Scholar]
  17. Plata-Calzado, C.; Prieto, A.I.; Cameán, A.M.; Jos, Á. Analytical Methods for Anatoxin-a Determination: A Review. Toxins 2024, 16, 198. [Google Scholar] [CrossRef]
  18. Gawankar, S.; Masten, S.J.; Lahr, R.H. Review of the Occurrence, Treatment Technologies, and Detection Methods for Saxitoxins in Freshwaters. J. Water Health 2024, 22, 1472–1490. [Google Scholar] [CrossRef]
  19. Melaram, R.; Newton, A.R.; Lee, A.; Herber, S.; El-Khouri, A.; Chafin, J. A Review of Microcystin and Nodularin Toxins Derived from Freshwater Cyanobacterial Harmful Algal Blooms and Their Impact on Human Health. Toxicol. Environ. Health Sci. 2024, 16, 233–241. [Google Scholar] [CrossRef]
  20. Fernandes, K.A.; Fadul, J.C.; Fiore, M.F.; Pinto, E. A systematic review on guanitoxin: General characteristics and ecological risks. Chemosphere 2024, 352, 141277. [Google Scholar] [CrossRef]
  21. Baunach, M.; Guljamow, A.; Miguel-Gordo, M.; Dittmann, E. Harnessing the potential: Advances in cyanobacterial natural product research and biotechnology. Nat. Prod. Rep. 2024, 41, 347–369. [Google Scholar] [CrossRef]
  22. Nugumanova, G.; Ponomarev, E.D.; Askarova, S.; Fasler-Kan, E.; Barteneva, N.S. Freshwater cyanobacterial toxins, cyanopeptides and neurodegenerative diseases. Toxins 2023, 15, 233. [Google Scholar] [CrossRef]
  23. Humpage, A.R.; Fontaine, F.; Froscio, S.; Burcham, P.; Falconer, I.R. Cylindrospermopsin genotoxicity and cytotoxicity: Role of cytochrome P-450 and oxidative stress. J. Toxicol. Environ. Health A 2005, 68, 739–753. [Google Scholar] [CrossRef]
  24. Hercog, K.; Maisanaba, S.; Filipič, M.; Jos, Á.; Cameán, A.M.; Žegura, B. Genotoxic potential of the binary mixture of cyanotoxins microcystin–LR and cylindrospermopsin. Chemosphere 2017, 189, 319–329. [Google Scholar] [CrossRef]
  25. Khosrovyan, A.; Avalyan, R.; Atoyants, A.; Aghajanyan, E.; Hambaryan, L.; Aroutiounian, R.; Gabrielyan, B. Tradescantia-based test systems can be used for the evaluation of the toxic potential of harmful algal blooms. Water 2023, 15, 2500. [Google Scholar] [CrossRef]
  26. Máthé, C.; Bóka, K.; Kónya, Z.; Erdődi, F.; Vasas, G.; Freytag, C.; Garda, T. Microcystin-LR, a cyanotoxin, modulates division of higher plant chloroplasts through protein phosphatase inhibition and affects cyanobacterial division. Chemosphere 2024, 358, 142125. [Google Scholar] [CrossRef] [PubMed]
  27. Juhász, G.P.; Kéki, S.; Dékány-Adamoczky, A.; Freytag, C.; Vasas, G.; Máthé, C.; Garda, T. Microcystin-LR, a cyanobacterial toxin, induces changes in the organization of membrane compartments in Arabidopsis. Microorganisms 2023, 11, 586. [Google Scholar] [CrossRef]
  28. Wunsche, L.; Vicari, T.; Calado, S.L.M.; Wojciechowski, J.; Magalhães, V.F.; Assis, H.C.S.; Leme, D.M.; Cestari, M.M. Genotoxicity detected during cyanobacteria bloom in a water supply reservoir. Ecotoxicol. Environ. Contam. 2020, 15, 51–60. [Google Scholar] [CrossRef]
  29. Fiskesjö, G. The Allium test as a standard in environmental monitoring. Hereditas 1985, 102, 99–112. [Google Scholar] [CrossRef]
  30. Leme, M.D.; Marin-Morales, M.A. Allium cepa test in environmental monitoring: A review on its application. Mutat. Res. Rev. Mutat. Res. 2009, 10, 1016. [Google Scholar] [CrossRef]
  31. Bonciu, E.; Firbas, P.; Fontanetti, C.S.; Wusheng, J.; Karaismailoğlu, M.C.; Liu, D.; Menicucci, F.; Popescu, A.; Pesnya, D.S.; Romanovsky, A.V.; et al. An evaluation for the standardization of the Allium cepa test as cytotoxicity and genotoxicity assay. Caryologia 2018, 71, 191–209. [Google Scholar] [CrossRef]
  32. Metcalf, J.S.; Codd, G.A. Co-occurrence of cyanobacteria and cyanotoxins with other environmental health hazards: Impacts and implications. Toxins 2020, 12, 629. [Google Scholar] [CrossRef]
  33. Pesnya, D.S.; Kurbatova, S.A.; Sharov, A.N.; Chernova, E.N.; Yershov, I.Y.; Shurganova, G.V.; Vodeneeva, E.L. Genotoxicity of natural water during the mass development of cyanobacteria evaluated by the Allium test method. Toxins 2022, 14, 359. [Google Scholar] [CrossRef]
  34. Pamplona-Silva, M.T.; Gonçalves, L.C.; Marin-Morales, M.A. Genetic toxicity of water contaminated by microcystins collected during a cyanobacteria bloom. Ecotoxicol. Environ. Saf. 2018, 166, 223–230. [Google Scholar] [CrossRef]
  35. Schmidt, J.R.; Wilhelm, S.W.; Boyer, G.L. The fate of microcystins in the environment and challenges for monitoring. Toxins 2014, 6, 3354–3387. [Google Scholar] [CrossRef] [PubMed]
  36. Medvedeva, N.G.; Zaytseva, T.B.; Kuzikova, I.L.; Chernova, E.N. Microcystin-LR biodestruction by autochthonous microbiota of different water bodies in the Northwest of Russia. Biol. Bull. 2023, 50, 1376–1387. [Google Scholar] [CrossRef]
  37. Painefilú, J.C.; González, C.; Krock, B.; Bieczynski, F.; Luquet, C.M. Microcystin-LR Sensitizes the Oncorhynchus mykiss Intestinal Epithelium and Interacts with Paralytic Shellfish Toxins to Alter Oxidative Balance. Toxicol. Appl. Pharmacol. 2024, 485, 116891. [Google Scholar] [CrossRef]
  38. Hinojosa, M.G.; Cascajosa-Lira, A.; Prieto, A.I.; Gutiérrez-Praena, D.; Vasconcelos, V.; Jos, A.; Cameán, A.M. Cytotoxic Effects and Oxidative Stress Produced by a Cyanobacterial Cylindrospermopsin Producer Extract versus a Cylindrospermopsin Non-Producing Extract on the Neuroblastoma SH-SY5Y Cell Line. Toxins 2023, 15, 320. [Google Scholar] [CrossRef]
  39. He, Z.; Chen, Y.; Gao, J.; Xu, Y.; Zhou, X.; Yang, R.; Geng, R.; Li, R.; Yu, G. Comparative Toxicology of Algal Cell Extracts and Pure Cyanotoxins: Insights into Toxic Effects and Mechanisms of Harmful Cyanobacteria Raphidiopsis raciborskii. Harmful Algae 2024, 135, 102635. [Google Scholar] [CrossRef]
  40. Li, J.; Chang, X.; Zhao, S.; Zhang, Y.; Pu, Q.; Wang, Y.; Li, J. Exudates of Microcystis aeruginosa on Oxidative Stress and Inflammatory Responses in Gills of Sinocyclocheilus grahami. Ecotoxicol. Environ. Saf. 2024, 280, 116587. [Google Scholar] [CrossRef]
  41. Falfushynska, H.; Kasianchuk, N.; Siemens, E.; Henao, E.; Rzymski, P. A Review of Common Cyanotoxins and Their Effects on Fish. Toxics 2023, 11, 118. [Google Scholar] [CrossRef]
  42. Hong, Z.; Chen, X.; Hu, J.; Chang, X.; Qian, Y. Adverse Effects of Microcystis aeruginosa Exudates on the Filtration, Digestion, and Reproduction Organs of the Benthic Bivalve Corbicula fluminea. Sci. Rep. 2024, 14, 10934. [Google Scholar] [CrossRef]
  43. Hillebrand, H.; Dürselen, C.-D.; Kirschtel, D.; Pollingher, U.; Zohary, T. Biovolume calculation for pelagic and benthic microalgae. J. Phycol. 1999, 35, 403–424. [Google Scholar] [CrossRef]
  44. Chernova, E.; Russkikh, I.; Voyakina, E.; Zhakovskaya, Z. Occurrence of microcystins and anatoxin-a in eutrophic lakes of Saint Petersburg, Northwestern Russia. Oceanol. Hydrobiol. Stud. 2016, 45, 466–484. [Google Scholar] [CrossRef]
  45. Ujvárosi, A.Z.; Hercog, K.; Riba, M.; Gonda, S.; Filipič, M.; Vasas, G.; Žegura, B. The cyanobacterial oligopeptides microginins induce DNA damage in the human hepatocellular carcinoma (HepG2) cell line. Chemosphere 2020, 240, 124880. [Google Scholar] [CrossRef] [PubMed]
  46. Varriale, F.; Tartaglione, L.; Zervou, S.-K.; Miles, C.O.; Mazur-Marzec, H.; Triantis, T.M.; Kaloudis, T.; Hiskia, A.; Dell’Aversano, C. Untargeted and targeted LC–MS and data processing workflow for the comprehensive analysis of oligopeptides from cyanobacteria. Chemosphere 2023, 311, 137012. [Google Scholar] [CrossRef]
  47. McDonald, K.; DesRochers, N.; Renaud, J.B.; Sumarah, M.W.; McMullin, D.R. Metabolomics Reveals Strain-Specific Cyanopeptide Profiles and Their Production Dynamics in Microcystis aeruginosa and M. flos-aquae. Toxins 2023, 15, 254. [Google Scholar] [CrossRef]
  48. Zervou, S.-K.; Hammoud, N.A.; Godin, S.; Hiskia, A.; Szpunar, J.; Lobinski, R. Detection of Secondary Cyanobacterial Metabolites Using LC-HRMS in Lake Karaoun. Sci. Total Environ. 2023, 892, 164725. [Google Scholar] [CrossRef]
  49. Thukral, M.; Allen, A.E.; Petras, D. Progress and Challenges in Exploring Aquatic Microbial Communities Using Non-Targeted Metabolomics. ISME J. 2023, 17, 2147–2159. [Google Scholar] [CrossRef]
  50. Weiss, M.B.; Médice, R.V.; Jacinavicius, F.R.; Pinto, E.; Crnkovic, C.M. Metabolomics Applied to Cyanobacterial Toxins and Natural Products. Adv. Exp. Med. Biol. 2023, 1439, 21–49. [Google Scholar] [CrossRef]
  51. Liu, J.; Chen, L.; Zhang, X. Current research scenario for biological effect of exogenous factors on microcystin synthesis. Environ. Sci. Pollut. Res. 2022, 29, 26190–26201. [Google Scholar] [CrossRef]
  52. Westrick, J.A.; Szlag, D.C.; Southwell, B.J.; Sinclair, J. A review of cyanobacteria and cyanotoxins removal/inactivation in drinking water treatment. Anal. Bioanal. Chem. 2010, 397, 1705–1714. [Google Scholar] [CrossRef]
  53. Thawabteh, A.M.; Naseef, H.A.; Karaman, D.; Bufo, S.A.; Scrano, L.; Karaman, R. Understanding the risks of diffusion of cyanobacteria toxins in rivers, lakes, and potable water. Toxins 2023, 15, 582. [Google Scholar] [CrossRef]
  54. Huang, I.-S.; Zimba, P.V. Cyanobacterial bioactive metabolites—A review of their chemistry and biology. Harmful Algae 2019, 83, 42–94. [Google Scholar] [CrossRef]
  55. Faltermann, S.; Zucchi, S.; Kohler, E.; Blom, J.F.; Pernthaler, J.; Fent, K. Molecular effects of the cyanobacterial toxin cyanopeptolin (CP1020) occurring in algal blooms: Global transcriptome analysis in zebrafish embryos. Aquat. Toxicol. 2014, 149, 33–39. [Google Scholar] [CrossRef]
  56. Jakubowska, N.; Szeląg-Wasielewska, E. Toxic picoplanktonic cyanobacteria—Review. Mar. Drugs 2015, 13, 1497–1518. [Google Scholar] [CrossRef]
  57. Earnshaw, C.D.; McMullin, D.R. Cyanopeptolins and anabaenopeptins are the dominant cyanopeptides from Planktothrix strains collected in Canadian lakes. Toxins 2024, 16, 110. [Google Scholar] [CrossRef] [PubMed]
  58. Thomas, K.M.; Wright, E.J.; Beach, D.G.; McCarron, P. Multi-class cyanobacterial toxin analysis using hydrophilic interaction liquid chromatography–mass spectrometry. J. Chromatogr. A 2024, 1738, 465483. [Google Scholar] [CrossRef] [PubMed]
  59. Jacinavicius, F.R.; Campos, T.G.V.; Passos, L.S.; Pinto, E.; Geraldes, V. A Rapid LC–MS/MS Method for Multi-Class Identification and Quantification of Cyanotoxins. Toxicon 2023, 234, 107282. [Google Scholar] [CrossRef]
  60. Dirks, C.; Cappelli, P.; Blomqvist, M.; Ekroth, S.; Johansson, M.; Persson, M.; Drakare, S.; Pekar, H.; Zuberovic Muratovic, A. Cyanotoxin occurrence and diversity in 98 cyanobacterial blooms from Swedish lakes and the Baltic Sea. Mar. Drugs 2024, 22, 199. [Google Scholar] [CrossRef]
  61. Al Haffar, M.; Fajloun, Z.; Azar, S.; Sabatier, J.-M.; Abi Khattar, Z. Lesser-known cyanotoxins: A comprehensive review of their health and environmental impacts. Toxins 2024, 16, 551. [Google Scholar] [CrossRef]
  62. Polyak, Y.M.; Polyak, M.S. The role of cyanotoxins in human and animal pathology (a review). J. Microbiol. Epidemiol. Immunobiol. 2022, 99, 231–243. (In Russian) [Google Scholar] [CrossRef]
  63. Zandberg, A. Literature Review of the Toxicity of Naturally Occurring Cyanotoxins of Drinking Water Relevance; Swedish Agricultural University (SLU): Uppsala, Sweden, 2024; Available online: https://stud.epsilon.slu.se/20120/1/zandberg-a-20240624.pdf (accessed on 1 July 2025).
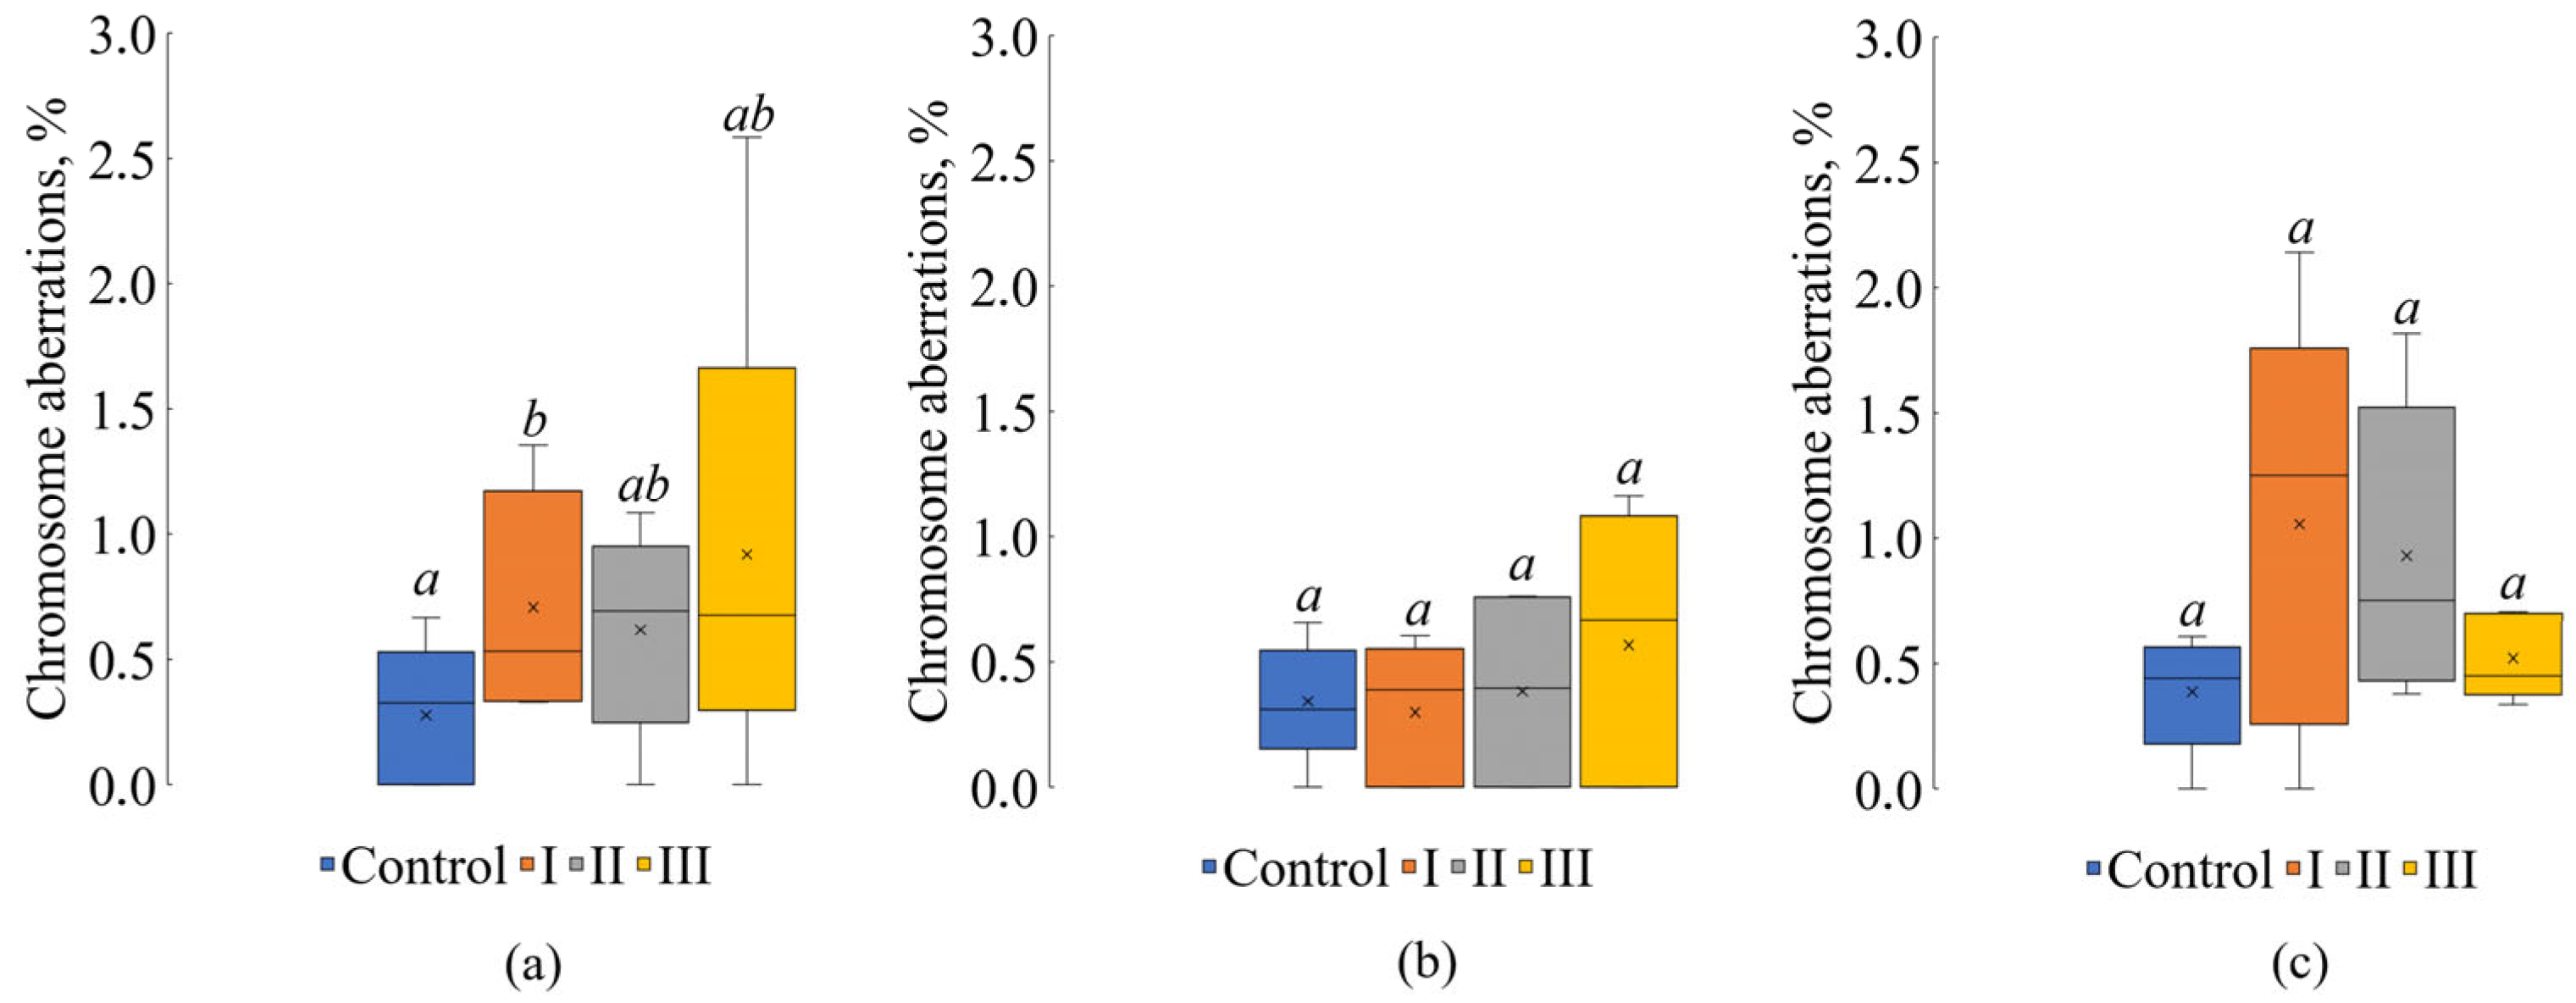
Figure 1. Frequency of chromosomal aberrations in different experimental treatments: (a) on Day 1, (b) on Day 21, and (c) on Day 42 (significant differences between the treatments are marked with different letters; whiskers: min-max; box: (25–75%); x = mean; line = median; n = 5; Kruskal–Wallis test, p < 0.05).
Environments 12 00321 g001
Figure 2. Frequency of chromosome lagging: (a) on Day 1, (b) on Day 21, and (c) on Day 42 (significant differences between the treatments are marked with different letters; whiskers: min-max; box: (25–75%); x = mean; line = median; n = 5; Kruskal–Wallis test, p < 0.05).
Environments 12 00321 g002
Figure 3. Frequency of micronucleus formation: (a) on Day 1, (b) on Day 21, and (c) on Day 42 (significant differences between the treatments are marked with different letters; whiskers: min-max; box: (25–75%); x = mean; line = median; n = 5; Kruskal–Wallis test, p < 0.05).
Environments 12 00321 g003
Figure 4. Aneuploidy: (a) on Day 1, (b) on Day 21, and (c) on Day 42 (significant differences between the treatments are marked with different letters; whiskers: min-max; box: (25–75%); x = mean; line = median; n = 5; Kruskal–Wallis test, p < 0.05).
Environments 12 00321 g004
Figure 5. Mitotic index: (a) on Day 1, (b) on Day 21, and (c) on Day 42 (significant differences between the treatments are marked with different letters; whiskers: min-max; box: (25–75%); x = mean; line = median; n = 5; Kruskal–Wallis test, p < 0.05).
Environments 12 00321 g005
Figure 6. Prophase index: (a) on Day 1, (b) on Day 21, and (c) on Day 42 (significant differences between the treatments are marked with different letters; whiskers: min-max; box: (25–75%); x = mean; line = median; n = 5; Kruskal–Wallis test, p < 0.05).
Environments 12 00321 g006
Figure 7. Anaphase index: (a) on Day 1, (b) on Day 21, and (c) on Day 42 (significant differences between the treatments are marked with different letters; whiskers: min-max; box: (25–75%); x = mean; line = median; n = 5; Kruskal–Wallis test, p < 0.05).
Environments 12 00321 g007
Figure 8. Telophase index: (a) on Day 1, (b) on Day 21, and (c) on Day 42 (significant differences between the treatments are marked with different letters; whiskers: min-max; box: (25–75%); x = mean; line = median; n = 5; Kruskal–Wallis test, p < 0.05).
Environments 12 00321 g008
Figure 9. Metaphase index: (a) on Day 1, (b) on Day 21, and (c) on Day 42 (significant differences between the treatments are marked with different letters; whiskers: min-max; box: (25–75%); x = mean; line = median; n = 5; Kruskal–Wallis test, p < 0.05).
Environments 12 00321 g009
Table 1. Cyanobacterial biomass (mg L−1) in the experiment (M ± SE).
TreatmentSampling Date
Day 1Day 21Day 42
Control0.10 ± 0.0010.003 ± 0.0010
I57.74 ± 6.100.33 ± 0.100.029 ± 0.005
II20.28 ± 1.790.15 ± 0.020.01 ± 0.002
III9.01 ± 0.620.09 ± 0.030.003 ± 0.001
Table 2. Extracellular concentration (M ± SE) of microcystin congeners in water samples (μg L−1).
CongenerSampling Day
12142
Treatment
IIIIIIIIIIIIIIIIII
[D-Asp3]MC-LR0.029 ± 0.0040.009 ± 0.002- *-0.015 ± 0.0030.009 ± 0.002---
MC-LR0.127 ± 0.0150.033 ± 0.0070.005 ± 0.0010.006 ± 0.0010.141 ± 0.0380.060 ± 0.014---
[D-Asp3]MC-RR0.298 ± 0.0690.062 ± 0.0120.006 ± 0.0010.015 ± 0.0030.157 ± 0.0320.080 ± 0.017-0.013 ± 0.003-
[D-Asp3]MC-YR0.005 ± 0.001------0.005 ± 0.001-
MC-RR0.135 ± 0.0240.029 ± 0.0060.005 ± 0.0010.012 ± 0.0020.134 ± 0.0330.054 ± 0.011---
MC-YR0.014 ± 0.0030.005 ± 0.001--0.005 ± 0.001--0.007 ± 0.002-
Total MCs0.608 ± 0.1160.138 ± 0.0280.016 ± 0.0030.033 ± 0.0060.452 ± 0.1070.203 ± 0.044-0.025 ± 0.006-
* A dash indicates that the concentration was below the detection limit < LOD (0.001 µg L−1).
Table 3. Intracellular concentration (M ± SE) of various microcystin congeners in phytoplankton biomass (μg L−1).
CongenerSampling Day
12142
Treatment
IIIIIIIIIIIIIIIIII
[D-Asp3]MC-LR0.010 ± 0.0030.080 ± 0.0150.036 ± 0.007- *0.006 ± 0.0010.004 ± 0.001---
MC-LR0.043 ± 0.0090.322 ± 0.1110.157 ± 0.0240.028 ± 0.0060.092 ± 0.0140.029 ± 0.005-0.028 ± 0.008-
[D-Asp3]MC-RR0.218 ± 0.0571.700 ± 0.3620.782 ± 0.1610.082 ± 0.0140.067 ± 0.0110.052 ± 0.011---
[D-Asp3]MC-YR0.004 ± 0.0010.026 ± 0.0060.016 ± 0.002------
MC-RR0.062 ± 0.0110.568 ± 0.1210.281 ± 0.0620.016 ± 0.0020.036 ± 0.0070.008 ± 0.002---
MC-YR0.008 ± 0.0020.049 ± 0.0130.023 ± 0.0040.002 ± 0.0010.011 ± 0.002----
Total MCs0.345 ± 0.0832.745 ± 0.6281.295 ± 0.2600.128 ± 0.0230.212 ± 0.0350.093 ± 0.019-0.028 ± 0.008-
* A dash indicates that the concentration was below the detection limit < LOD (0.001 µg L−1).
Table 4. Mean root length (mm) in the different experimental treatments.
TreatmentSampling Date
Day 1Day 21Day 42
Control23.6 ± 0.419.6 ± 0.525.8 ± 1.2
I11.9 * ± 0.417.9 ± 0.417.6 * ± 1.0
II17.2 * ± 0.519.1 ± 0.417.2 * ± 1.2
III16.9 * ± 0.716.1 * ± 0.424.5 ± 1.4
* significant differences from Control (p < 0.05).
Disclaimer/Publisher’s Note: The statements, opinions and data contained in all publications are solely those of the individual author(s) and contributor(s) and not of MDPI and/or the editor(s). MDPI and/or the editor(s) disclaim responsibility for any injury to people or property resulting from any ideas, methods, instructions or products referred to in the content.