
Saline Water Stress in Caatinga Species with Potential for Reforestation in the Face of Advancing Desertification in the Brazilian Semiarid Region

 ,
,  ,
,  ,
,  , ,
, ,  ,
,  , , and
Abstract
1. Introduction
2. Materials and Methods
2.1. Study Area
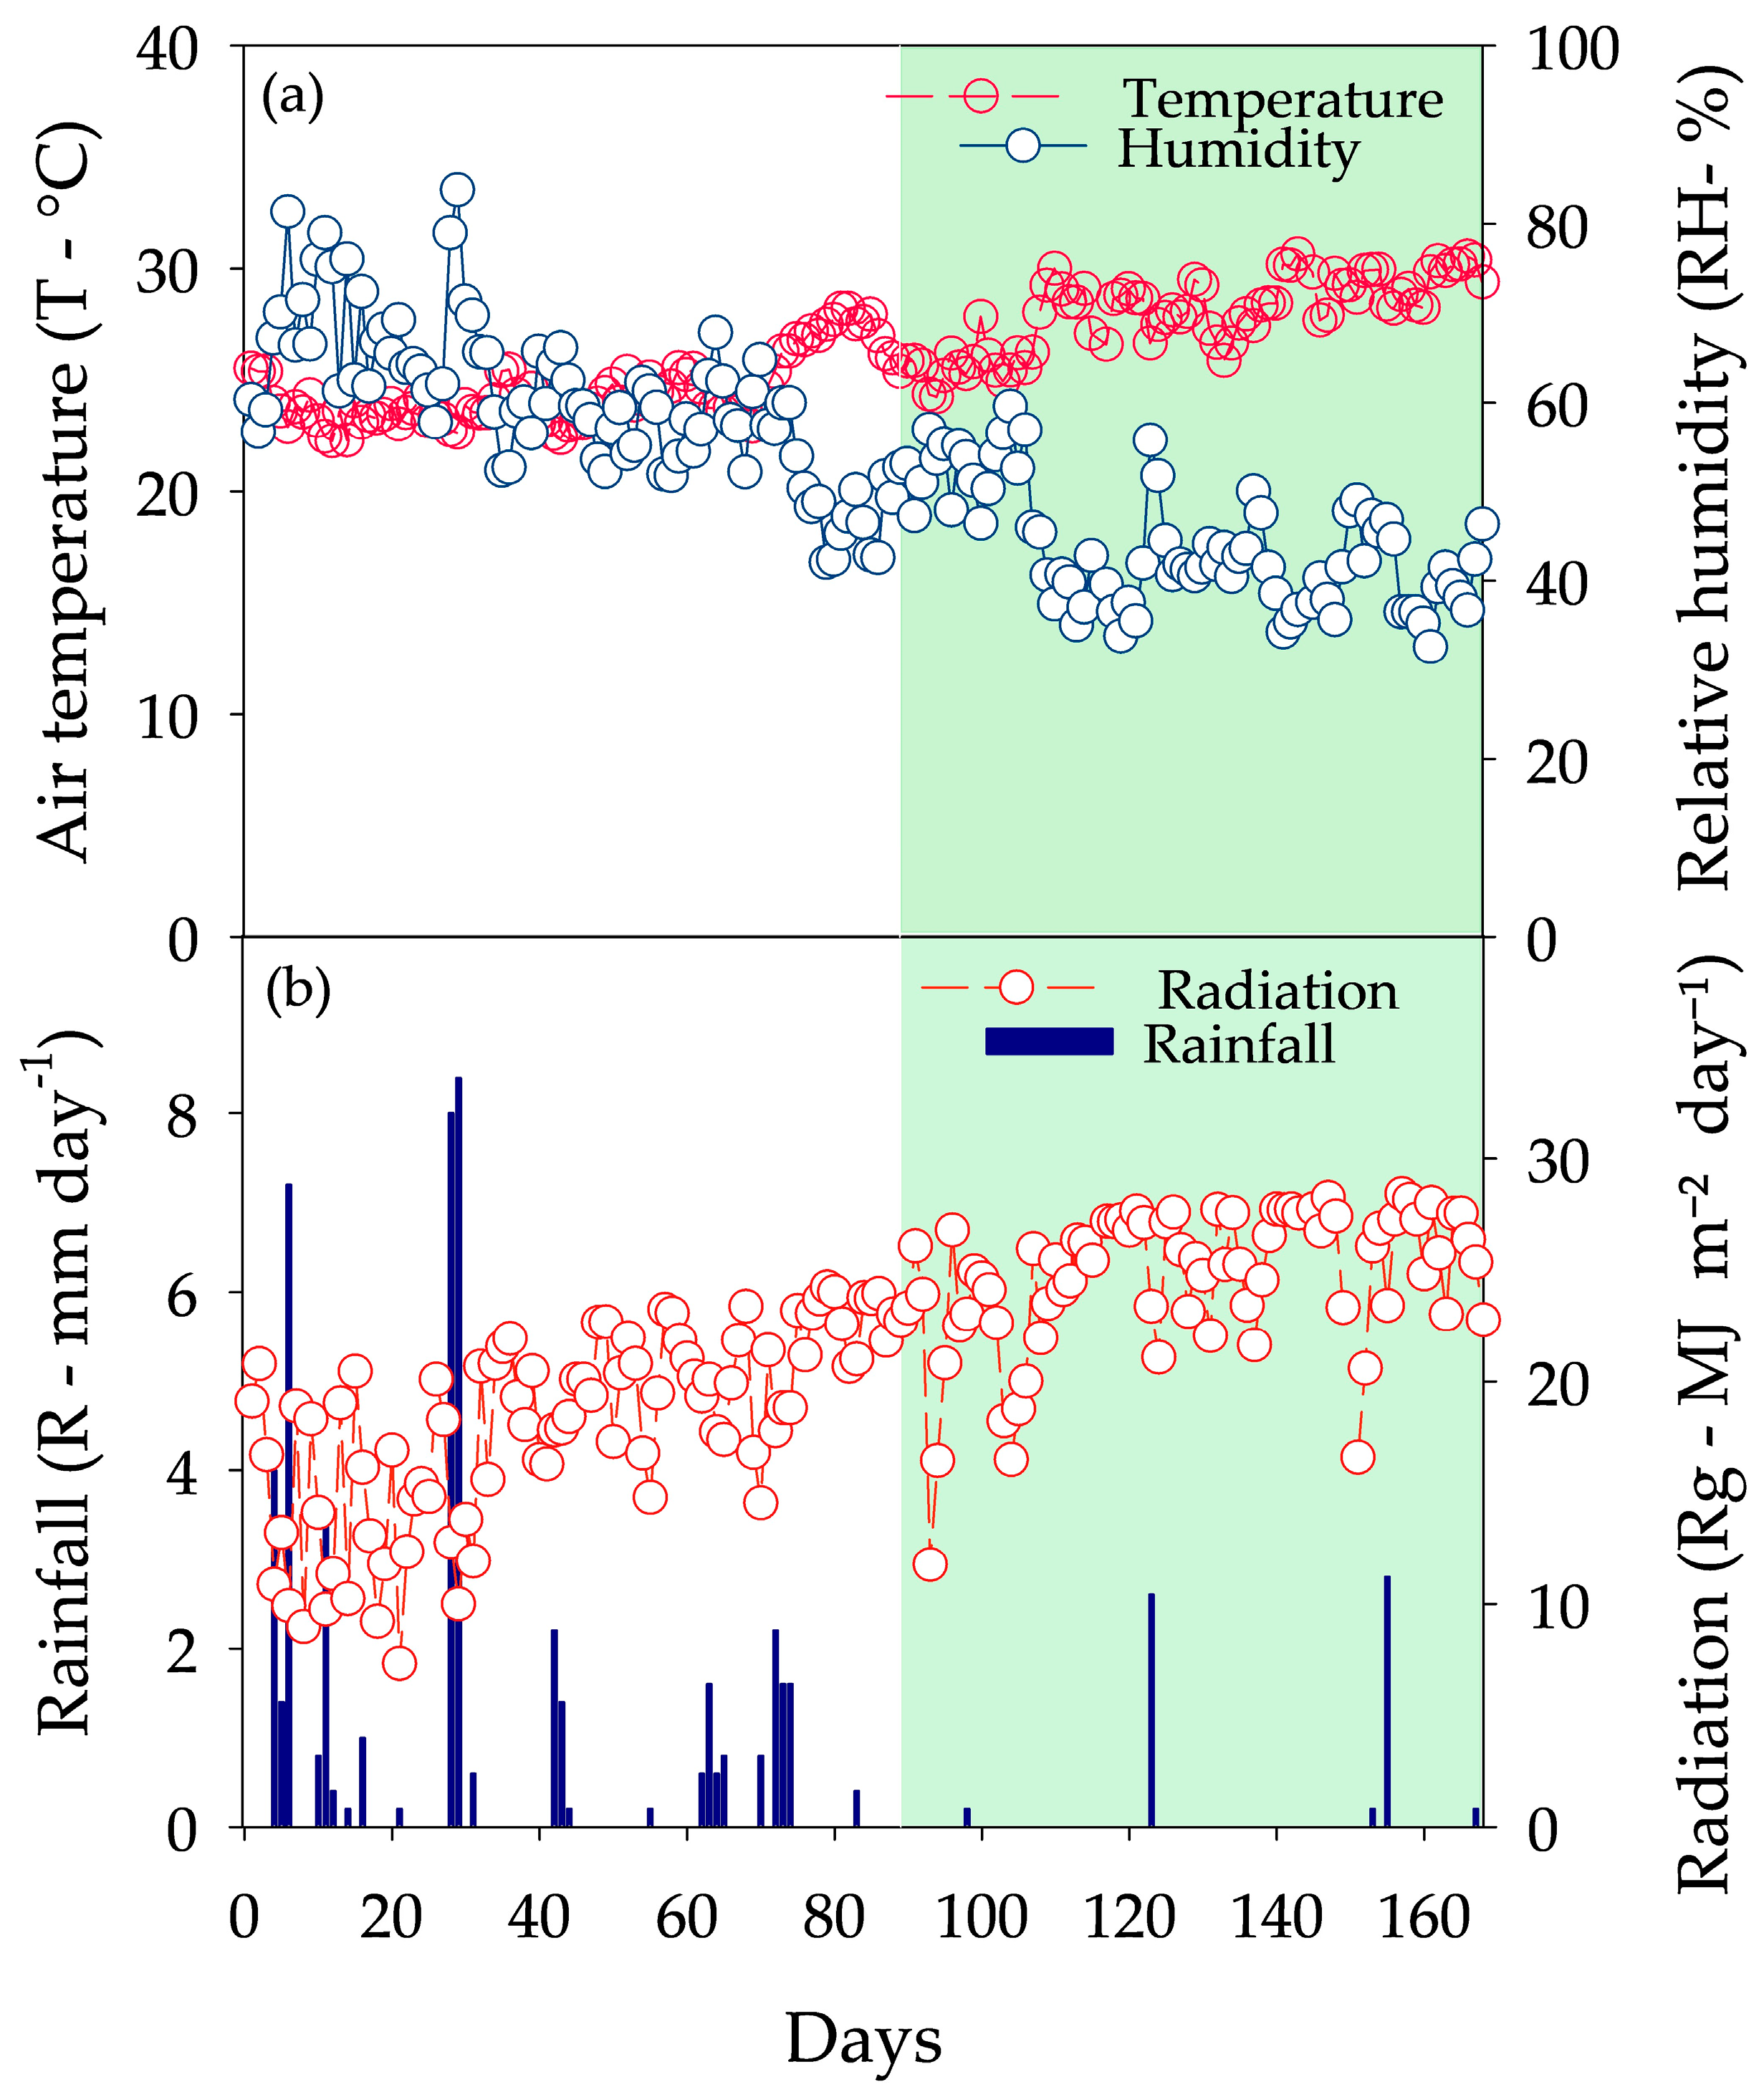
2.2. Meteorological Variables
2.3. Bioclimatic Variables
2.3.1. Accumulated Degree Days
2.3.2. Leaf Emergence Rate
2.3.3. Phyllochron
2.4. Statistical Analysis
3. Results
4. Discussion
5. Conclusions
Author Contributions
Funding
Data Availability Statement
Acknowledgments
Conflicts of Interest
References
- da Rosa Ferraz Jardim, A.M.; de Morais, J.E.F.; de Souza, L.S.B.; de Carvalho Lopes, D.; da Silva, M.V.; Pandorfi, H.; de Oliveira-Júnior, J.F.; da Silva, J.L.B.; Steidle Neto, A.J.; Morellato, L.P.C.; et al. A Systematic Review of Energy and Mass Fluxes, and Biogeochemical Processes in Seasonally Dry Tropical Forests and Cactus Ecosystems. J. South Am. Earth Sci. 2023, 126, 104330. [Google Scholar] [CrossRef]
- Dantas, B.F.; Ribeiro, R.C.; Matias, J.R.; Araújo, G.G.L. Germinative Metabolism of Caatinga Forest Species in Biosaline Agriculture. J. Seed Sci. 2014, 36, 194–203. [Google Scholar] [CrossRef]
- de Mello, K.; Taniwaki, R.H.; de Paula, F.R.; Valente, R.A.; Randhir, T.O.; Macedo, D.R.; Leal, C.G.; Rodrigues, C.B.; Hughes, R.M. Multiscale Land Use Impacts on Water Quality: Assessment, Planning, and Future Perspectives in Brazil. J. Environ. Manag. 2020, 270, 110879. [Google Scholar] [CrossRef]
- dos Santos, A.R.M.; da Silva, M.A.D.; de Sousa, L.D.C.; de Araújo, A.V.; Gonçalves, E.P. Emprego de Água Biossalina Na Germinação de Sementes de Espécies Florestais Da Caatinga—Uma Revisão. Res. Soc. Dev. 2021, 10, e99101119419. [Google Scholar] [CrossRef]
- da Penha Moreira Gonçalves, M.; Feliciano, A.L.P.; de Paula Silva, A.; da Silva, L.B.; da Silva, K.M.; da Silva Júnior Júnior, F.S.; Grugiki, M.A.; da Silva, M.I.O. Influência de Diferentes Tipos de Solos Da Caatinga Na Germinação de Espécies Nativas/Influence of Different Types of Caatinga Soils on Native Species Germination. Braz. J. Dev. 2020, 6, 1216–1226. [Google Scholar] [CrossRef]
- de Fátima de Queiroz Lopes, M.; da Silva, T.L.; Nóbrega, J.S.; da Silva, R.T.; Figueiredo, R.A.; de Lucena Alcântara Bruno, R. Crescimento de Erythrina Velutina Willd. Submetida a Estresse Salino e Aplicação de Ácido Salicílico. Colloq. Agrar. 2019, 15, 31–38. [Google Scholar] [CrossRef]
- da Silva, E.F.; Santos, H.R.B.; Ometto, J.P.H.B.; da Rosa Ferraz Jardim, A.M.; da Silva, T.G.F.; Hermínio, P.J.; Simões, A.N.; Souza, E.; Ferreira-Silva, S.L. Salt-Excluder Rootstock Improves Physio-Biochemical Responses of Grafted Grapevine Plants Subjected to Salinity Stress. Curr. Plant Biol. 2024, 37, 100316. [Google Scholar] [CrossRef]
- Avrella, E.D.; Emer, A.A.; Paim, L.P.; Fior, C.S.; Schafer, G. Salinity Effect on the Initial Development of Mimosa scabrella Benth Seedlings. Iheringia Ser. Bot. 2019, 74, 1–10. [Google Scholar] [CrossRef]
- da Silva, E.C.A.; da Silva Costa, J.R.; Costa, P.C.F.; Alcantar, A.M.A.C.; dos Santos, C.A.; Nogueira, R.J.M.C. Influência da Salinidade Na Emergência e No Crescimento Inicial de Mulungu. Rev. Ciência Agrícola 2019, 17, 63–69. [Google Scholar] [CrossRef]
- de Sousa Alvarenga, C.F.; Silva, E.M.; Nobre, R.G.; Gheyi, H.R.; de Lima, G.S.; de Silva, L.A. Morfofisiologia de Aceroleira Irrigada Com Águas Salinas Sob Combinações de Doses de Nitrogênio e Potássio. Rev. Ciências Agrárias 2019, 42, 194–205. [Google Scholar] [CrossRef]
- Dias, N.; Blanco, F.; Souza, E.R.; Ferreira, J.F.; Neto, O.N.; Queiroz, Í.S.R. Efeitos dos Sais na Planta e Tolerância das Culturas à Salinidade. In Manejo da Salinidade na Agricultura: Estudos Básicos e Aplicados; INCTsal: Fortaleza, Brazil, 2016; pp. 151–162. [Google Scholar]
- Cruz, N.T.; Porto, E.M.V.; Ramos, B.L.P.; Santos, H.P.; Seixas, A.A.; da Silva Santos, A.P. Estresse Hídrico em Plantas Forrageiras: Uma Breve Revisão. Rev. Científica Rural 2023, 25, 221–238. [Google Scholar] [CrossRef]
- Mendes, K.R.; Campos, S.; da Silva, L.L.; Mutti, P.R.; Ferreira, R.R.; Medeiros, S.S.; Perez-Marin, A.M.; Marques, T.V.; Ramos, T.M.; de Lima Vieira, M.M.; et al. Seasonal Variation in Net Ecosystem CO2 Exchange of a Brazilian Seasonally Dry Tropical Forest. Sci. Rep. 2020, 10, 9454. [Google Scholar] [CrossRef] [PubMed]
- Ramos, F.R.; Freire, A.L.O.; França, G.M. Crescimento e Acúmulo de Biomassa Em Mudas de Craibeira (Tabebuia aurea (Manso) Benth. & Hook. F. Ex S. Moore) Sob Estresse Hídrico e Adubação Potássica. Agropecuária Científica No Semiárido 2021, 16, 213. [Google Scholar] [CrossRef]
- de Barros, J.P.A.; Souza, L.S.B.; da Silva, T.G.F.; de Moura, M.S.B.; da dSilva, L.F. Partitioning and Modeling of Biomass in Caatinga Legume Seedlings in Different Water Conditions. Floresta Ambient. 2019, 26, e20180348. [Google Scholar] [CrossRef]
- Bessa, M.C.; Lacerda, C.F.; Amorim, A.V.; Bezerra, A.M.E.; Lima, A.D. Mechanisms of Salt Tolerance in Seedlings of Six Woody Native Species of the Brazilian Semi-Arid. Rev. Cienc. Agron. 2017, 48, 157–165. [Google Scholar] [CrossRef]
- Agnihotri, A.; Gupta, P.; Dwivedi, A.; Seth, C.S. Counteractive Mechanism (s) of Salicylic Acid in Response to Lead Toxicity in Brassica juncea (L.) Czern. Cv. Varuna. Planta 2018, 248, 49–68. [Google Scholar] [CrossRef]
- dos Santos, W.R.; de Souza, L.S.B.; da Rosa Ferraz Jardim, A.M.; de Morais, J.E.F.; dos Santos, M.M.P.; de Souza, C.A.A.; da Silva, T.G.F. How Is the Water Footprint of the Species Vachellia farnesiana, Amburana cearensis, and Handroanthus impetiginosus Influenced by Abiotic Stresses as Water Deficit and Salinity? Int. J. Phytoremediation 2023, 26, 784–792. [Google Scholar] [CrossRef]
- de Jesus Silva, J.; de Souza Alencar, S.; Gomes, R.A.; Matias, J.R.; Pelacani, C.R.; Dantas, B.F. Conservation and Physiological Quality of Handroanthus spongiosus (Rizzini) S. Grose (Bignoniaceae) Seeds. J. Seed Sci. 2022, 44, e202244007. [Google Scholar] [CrossRef]
- de Jesus Silva, J.; Gomes, R.A.; Ferreira, M.A.R.; Pelacani, C.R.; Dantas, B.F. Physiological Potential of Seeds of Handroanthus spongiosus (Rizzini) S. Grose (Bignoniaceae) Determined by the Tetrazolium Test. Seeds 2023, 2, 208–219. [Google Scholar] [CrossRef]
- de Sousa Lima, D.; dos Santos Ribeiro, G.M.; Barbosa, B.S.; da Silva, R.T.L.; dos Santos, C.R.C.; Shibata, M. Crescimento de Mudas de Handroanthus impetiginosus Submetidas a Diferentes Condições de Capacidade de Campo do Solo. In Estudos em Ciências Ambientais e Agrárias; Editora Licuri: Campina Grande, Brazil, 2023; pp. 73–88. [Google Scholar] [CrossRef]
- Pimenta, J.M.A.; de Souza, W.M.A.T.; Ferrari, C.D.S.; Almeida Vieira, F.; Fajardo, C.G.; Pacheco, M.V. SELECTION OF Handroanthus impetiginosus MOTHER TREES TO SUPPORT SEED COLLECTION AREAS. Rev. Arvore 2023, 47, e4706. [Google Scholar] [CrossRef]
- de Jesus Silva, J.; Duarte, E.F.; Kiill, L.H.P.; Gomes, R.A.; Dantas, B.F.; Pelacani, C.R.; Funch, L.S. Phenological Dynamics of Four Populations of Handroanthus spongiosus in Seasonally Dry Tropical Forest in Brazil. Flora Morphol. Distrib. Funct. Ecol. Plants 2023, 306, 152371. [Google Scholar] [CrossRef]
- Alvares, C.A.; Stape, J.L.; Sentelhas, P.C.; De Moraes Gonçalves, J.L.; Sparovek, G. Köppen’s Climate Classification Map for Brazil. Meteorol. Z. 2013, 22, 711–728. [Google Scholar] [CrossRef]
- de Caldas Pereira, P.; da Silva, T.G.F.; Zolnier, S.; de Morais, J.E.F.; dos Santos, D.C. Morfogênese da Palama Forrageira Irrigada Por Gotejamento. Rev. Caatinga 2015, 28, 184–195. [Google Scholar] [CrossRef]
- De Siqueira, J.V.G.; de Barros, J.P.A.; Araújo, Y.P.; da Silva, T.G.F.; de Souza, L.S.B. Tratamentos Pré-Germinativos Em Sementes de Espécies da Caatinga. J. Environ. Anal. Prog. 2017, 499, 499–508. [Google Scholar] [CrossRef]
- dos Santos, H.G.; Jacomine, P.K.T.; dos Anjos, L.H.C.; de Oliveira, V.A.; Lumbreras, J.F.; Coelho, M.R.; de Almeida, J.A.; Cunha, T.J.F.; de Oliveira, J.B. Sistema Brasileiro de Classificação de Solos, 3rd ed.; Embrapa: Brasília, Brazil, 2013. [Google Scholar]
- Allen, R.G.; Pereira, L.S.; Raes, D.; Smith, M. Crop Evapotranspiration-Guidelines for Computing Crop Water Requirements–FAO Irrigation and Drainage Paper 56; Fao: Rome, Italy, 1998; 300p. [Google Scholar]
- Gheyi, H.R.; Dias, N.S.; Lacerda, C.F.; Gomes Filho, E. Manejo da Salinidade na Agricultura: Estudos Básicos e Aplicados, 2nd ed.; INCTSal: Fortaleza, Brazil, 2016. [Google Scholar]
- Villa Nova, N.A.; Pedro Junior, M.J.; Pereira, A.R.; Ometto, J.C. Estimativa de Graus Dia Acumulados Acima de Qualquer Temperatura-Base Em Função Das Temperaturas Máxima e Mínima. Ciência Terra 1972, 30, 1–8. [Google Scholar]
- Geerts, S.; Raes, D. Deficit Irrigation as an On-Farm Strategy to Maximize Crop Water Productivity in Dry Areas. Agric. Water Manag. 2009, 96, 1275–1284. [Google Scholar] [CrossRef]
- Arnold, C.Y. The Determination and Significance of the Base Temperature in a Linear Heat Unit System. Proc. Am. Soc. Hortic. Sci. 1959, 74, 430–445. [Google Scholar]
- Xue, Q.; Weiss, A.; Baenziger, P.S. Predicting Leaf Appearance in Field-Grown Winter Wheat: Evaluating Linear and Non-Linear Models. Ecol. Modell. 2004, 175, 261–270. [Google Scholar] [CrossRef]
- McMaster, G.S.; Smika, D.E. Estimation and Evaluation of Winter Wheat Phenology in the Central Great Plains. Agric. For. Meteorol. 1988, 43, 1–18. [Google Scholar] [CrossRef]
- Streck, N.A.; Bellé, R.A.; da Rocha, E.K.; Schuh, M. Estimating Leaf Appearance Rate and Phyllochron in Safflower (Carthamus tinctorius L.). Ciência Rural 2005, 35, 1448–1450. [Google Scholar] [CrossRef]
- de Sousa Neto, O.N.; da Silva Dias, N.; Neto, M.F.; de Lira, R.B.; Rebouças, J.R.L. Utilização do Rejeito da Dessalinização da Água na Produção de Mudas de Espécies da Caatinga. Rev. Caatinga 2011, 24, 123–129. [Google Scholar]
- Balasubramaniam, T.; Shen, G.; Esmaeili, N.; Zhang, H. Plants’ Response Mechanisms to Salinity Stress. Plants 2023, 12, 2253. [Google Scholar] [CrossRef]
- da Silva, M.A.V.; Nogueira, R.J.M.C.; de Oliveira, A.F.M.; dos Santos, V.F. Resposta Estomática e Produção de Matéria Seca Em Plantas Jovens de Aroeira Submetidas a Diferentes Regimes Hídricos. Rev. Árvore 2008, 32, 335–344. [Google Scholar] [CrossRef]
- Araujo, J.L.; De Oliveira, S.R.; De Sousa, F.Q.; Da Silva, A.P. Initial Growth of Tree Species Grown on Salinized Soil with Conditioners. Comun. Sci. 2017, 8, 375–382. [Google Scholar] [CrossRef]
- dos Santos, W.R.; de Souza, L.S.B.; Pacheco, A.N.; da Rosa Ferraz Jardim, A.M.; da Silva, T.G.F. Water Use Efficiency for Caatinga Species: A Review for the 2009-2019 Period. Rev. Bras. Geogr. Fis. 2021, 14, 2573–2591. [Google Scholar] [CrossRef]
- Azeem, M.; Pirjan, K.; Qasim, M.; Mahmood, A.; Javed, T.; Muhammad, H.; Yang, S.; Dong, R.; Ali, B.; Rahimi, M. Salinity Stress Improves Antioxidant Potential by Modulating Physio-Biochemical Responses in Moringa oleifera Lam. Sci. Rep. 2023, 13, 2895. [Google Scholar] [CrossRef]
- de Sousa Medeiros, H.L.; Pereira, K.T.O.; Torres, S.B.; Benedito, C.P.; do Couto Júnior, J.R.S. Physiological Performance of Tabebuia aurea Seeds Subjected to Abiotic Stresses. Rev. Caatinga 2023, 36, 962–970. [Google Scholar] [CrossRef]
- Chen, T.; Shabala, S.; Niu, Y.; Chen, Z.H.; Shabala, L.; Meinke, H.; Venkataraman, G.; Pareek, A.; Xu, J.; Zhou, M. Molecular Mechanisms of Salinity Tolerance in Rice. Crop J. 2021, 9, 506–520. [Google Scholar] [CrossRef]
- Munns, R.; Passioura, J.B.; Colmer, T.D.; Byrt, C.S. Osmotic Adjustment and Energy Limitations to Plant Growth in Saline Soil. New Phytol. 2020, 225, 1091–1096. [Google Scholar] [CrossRef]
- Ma, L.; Liu, X.; Lv, W.; Yang, Y. Molecular Mechanisms of Plant Responses to Salt Stress. Front. Plant Sci. 2022, 13, 934877. [Google Scholar] [CrossRef]
- de Oliveira, N.P.; do Nascimento, J.W.S.; da Silva Madalena Júnior, N.; de Omena Serafim, E.; Leandro, B.S.; Pereira, L.S.; dos Santos, M.C.C.; do Nascimento, H.H.C. Ecofisiologia de Mudas de Handroanthus impetiginosus Submetidas a Diferentes Ciclos de Rega. Braz. J. Dev. 2020, 6, 36563–36574. [Google Scholar] [CrossRef]
- Ferreira, J.V.A.; Meiado, M.V.; de Siqueira Filho, J.A. Efeito Dos Estresses Hídrico, Salino e Térmico Na Germinação de Sementes de Handroanthus spongiosus (Rizzini) S. Grose (Bignoniaceae). Ciências Ambient. 2018, 11, 57–64. [Google Scholar] [CrossRef]
- Wright, C.L.; de Lima, A.L.A.; de Souza, E.S.; West, J.B.; Wilcox, B.P. Plant Functional Types Broadly Describe Water Use Strategies in the Caatinga, a Seasonally Dry Tropical Forest in Northeast Brazil. Ecol. Evol. 2021, 11, 11808–11825. [Google Scholar] [CrossRef] [PubMed]
- Lima, A.T.; Meiado, M.V. Effects of Seed Hydration Memory on Initial Growth under Water Deficit of Cactus from Two Populations That Occur in Different Ecosystems in Northeast Brazil. Plant Species Biol. 2018, 33, 268–275. [Google Scholar] [CrossRef]
- Ragagnin, R.C.G.; Albuquerque, C.C.; Oliveira, F.F.M.; Santos, R.G.; Gurgel, E.P.; Diniz, J.C.; Rocha, S.A.S.; Viana, F.A. Effect of Salt Stress on the Growth of Lippia gracilis Schauer and on the Quality of Its Essential Oil. Acta Bot. Bras. 2014, 28, 346–351. [Google Scholar] [CrossRef]
- Araújo, L.M.; Martins, F.B.; Lyra, G.B.; Arthur Junior, J.C.; Araújo, E.J.G.; de Abreu, R.C.R.; Abreu, M.C. Understanding the Temperature Range for Foliar Development of Neotropical Forest Species during the Seedling Stage: Implications for Biology and Ecology. Res. Sq. 2023, 1–17. [Google Scholar] [CrossRef]


| Factor | PH | CD | NL | DLB | DSB | DRB | TDB | CD/PH |
|---|---|---|---|---|---|---|---|---|
| SL | 0.000 * | 0.000 * | 0.000 * | 0.000 * | 0.000 * | 0.000 * | 0.000 * | 0.000 * |
| WD | 0.003 * | 0.006 * | 0.000 * | 0.109 | 0.094 | 0.000 * | 0.000 * | 0.399 |
| SPE | 0.000 * | 0.000 * | 0.004 * | 0.000 * | 0.000 * | 0.000 * | 0.000 * | 0.000 * |
| SL×WD | 0.002 * | 0.000 * | 0.000 * | 0.014 * | 0.092 | 0.000 * | 0.000 * | 0.158 |
| SL×SPE | 0.000 * | 0.000 * | 0.000 * | 0.001 * | 0.000 * | 0.000 * | 0.000 * | 0.000 * |
| WD×SPE | 0.032 * | 0.044 * | 0.23 | 0.004 * | 0.484 | 0.000 * | 0.000 * | 0.116 |
| SL×WD×SPE | 0.179 | 0.372 | 0.325 | 0.008 * | 0.09 | 0.032 * | 0.007 * | 0.617 |
| Salinity Levels (dS m−1) | Water Depth (%) | Species | DLB (g) | DRB (g) | TDB (g) | WUE (g L−1) |
|---|---|---|---|---|---|---|
| 0.28 | 50 | H. impetiginosus | 0.73 bcd | 1.68 cde | 2.87 bc | 0.77 b |
| H. spongiosus | 0.40 cde | 0.74 defg | 1.39 cde | 0.37 de | ||
| 75 | H. impetiginosus | 0.87 bc | 2.13 bc | 3.51 b | 0.75 b | |
| H. spongiosus | 1.16 ab | 2.05 bcd | 3.44 b | 0.73 b | ||
| 100 | H. impetiginosus | 1.63 a | 4.27 a | 6.44 a | 1.13 a | |
| H. spongiosus | 0.56 bcde | 1.90 cde | 2.79 bc | 0.49 bcd | ||
| 2.25 | 50 | H. impetiginosus | 0.63 bcde | 1.52 cdef | 2.63 bcd | 0.70 bc |
| H. spongiosus | 0.00 e | 0.00 g | 0.00 e | 0.00 f | ||
| 75 | H. impetiginosus | 0.41 cde | 1.62 cde | 2.35 bcd | 0.50 bcd | |
| H. spongiosus | 0.00 e | 0.00 g | 0.00 e | 0.00 f | ||
| 100 | H. impetiginosus | 0.63 bcde | 3.04 ab | 4.04 b | 0.71 bc | |
| H. spongiosus | 0.00 e | 0.00 g | 0.00 e | 0.00 f | ||
| 6.35 | 50 | H. impetiginosus | 0.00 e | 0.00 g | 0.00 e | 0.00 f |
| H. spongiosus | 0.00 e | 0.00 g | 0.00 e | 0.00 f | ||
| 75 | H. impetiginosus | 0.00 e | 0.00 g | 0.00 e | 0.00 f | |
| H. spongiosus | 0.00 e | 0.00 g | 0.00 e | 0.00 f | ||
| 100 | H. impetiginosus | 0.15 de | 0.71 efg | 1.01 de | 0.18 def | |
| H. spongiosus | 0.00 e | 0.00 g | 0.00 e | 0.00 f | ||
| 7.38 | 50 | H. impetiginosus | 0.12 de | 0.23 fg | 0.46 e | 0.12 ef |
| H. spongiosus | 0.00 e | 0.00 g | 0.00 e | 0.00 f | ||
| 75 | H. impetiginosus | 0.00 e | 0.00 g | 0.00 e | 0.00 f | |
| H. spongiosus | 0.00 e | 0.00 g | 0.00 e | 0.00 f | ||
| 100 | H. impetiginosus | 0.00 e | 0.00 g | 0.00 e | 0.00 f | |
| H. spongiosus | 0.00 e | 0.00 g | 0.00 e | 0.00 f |
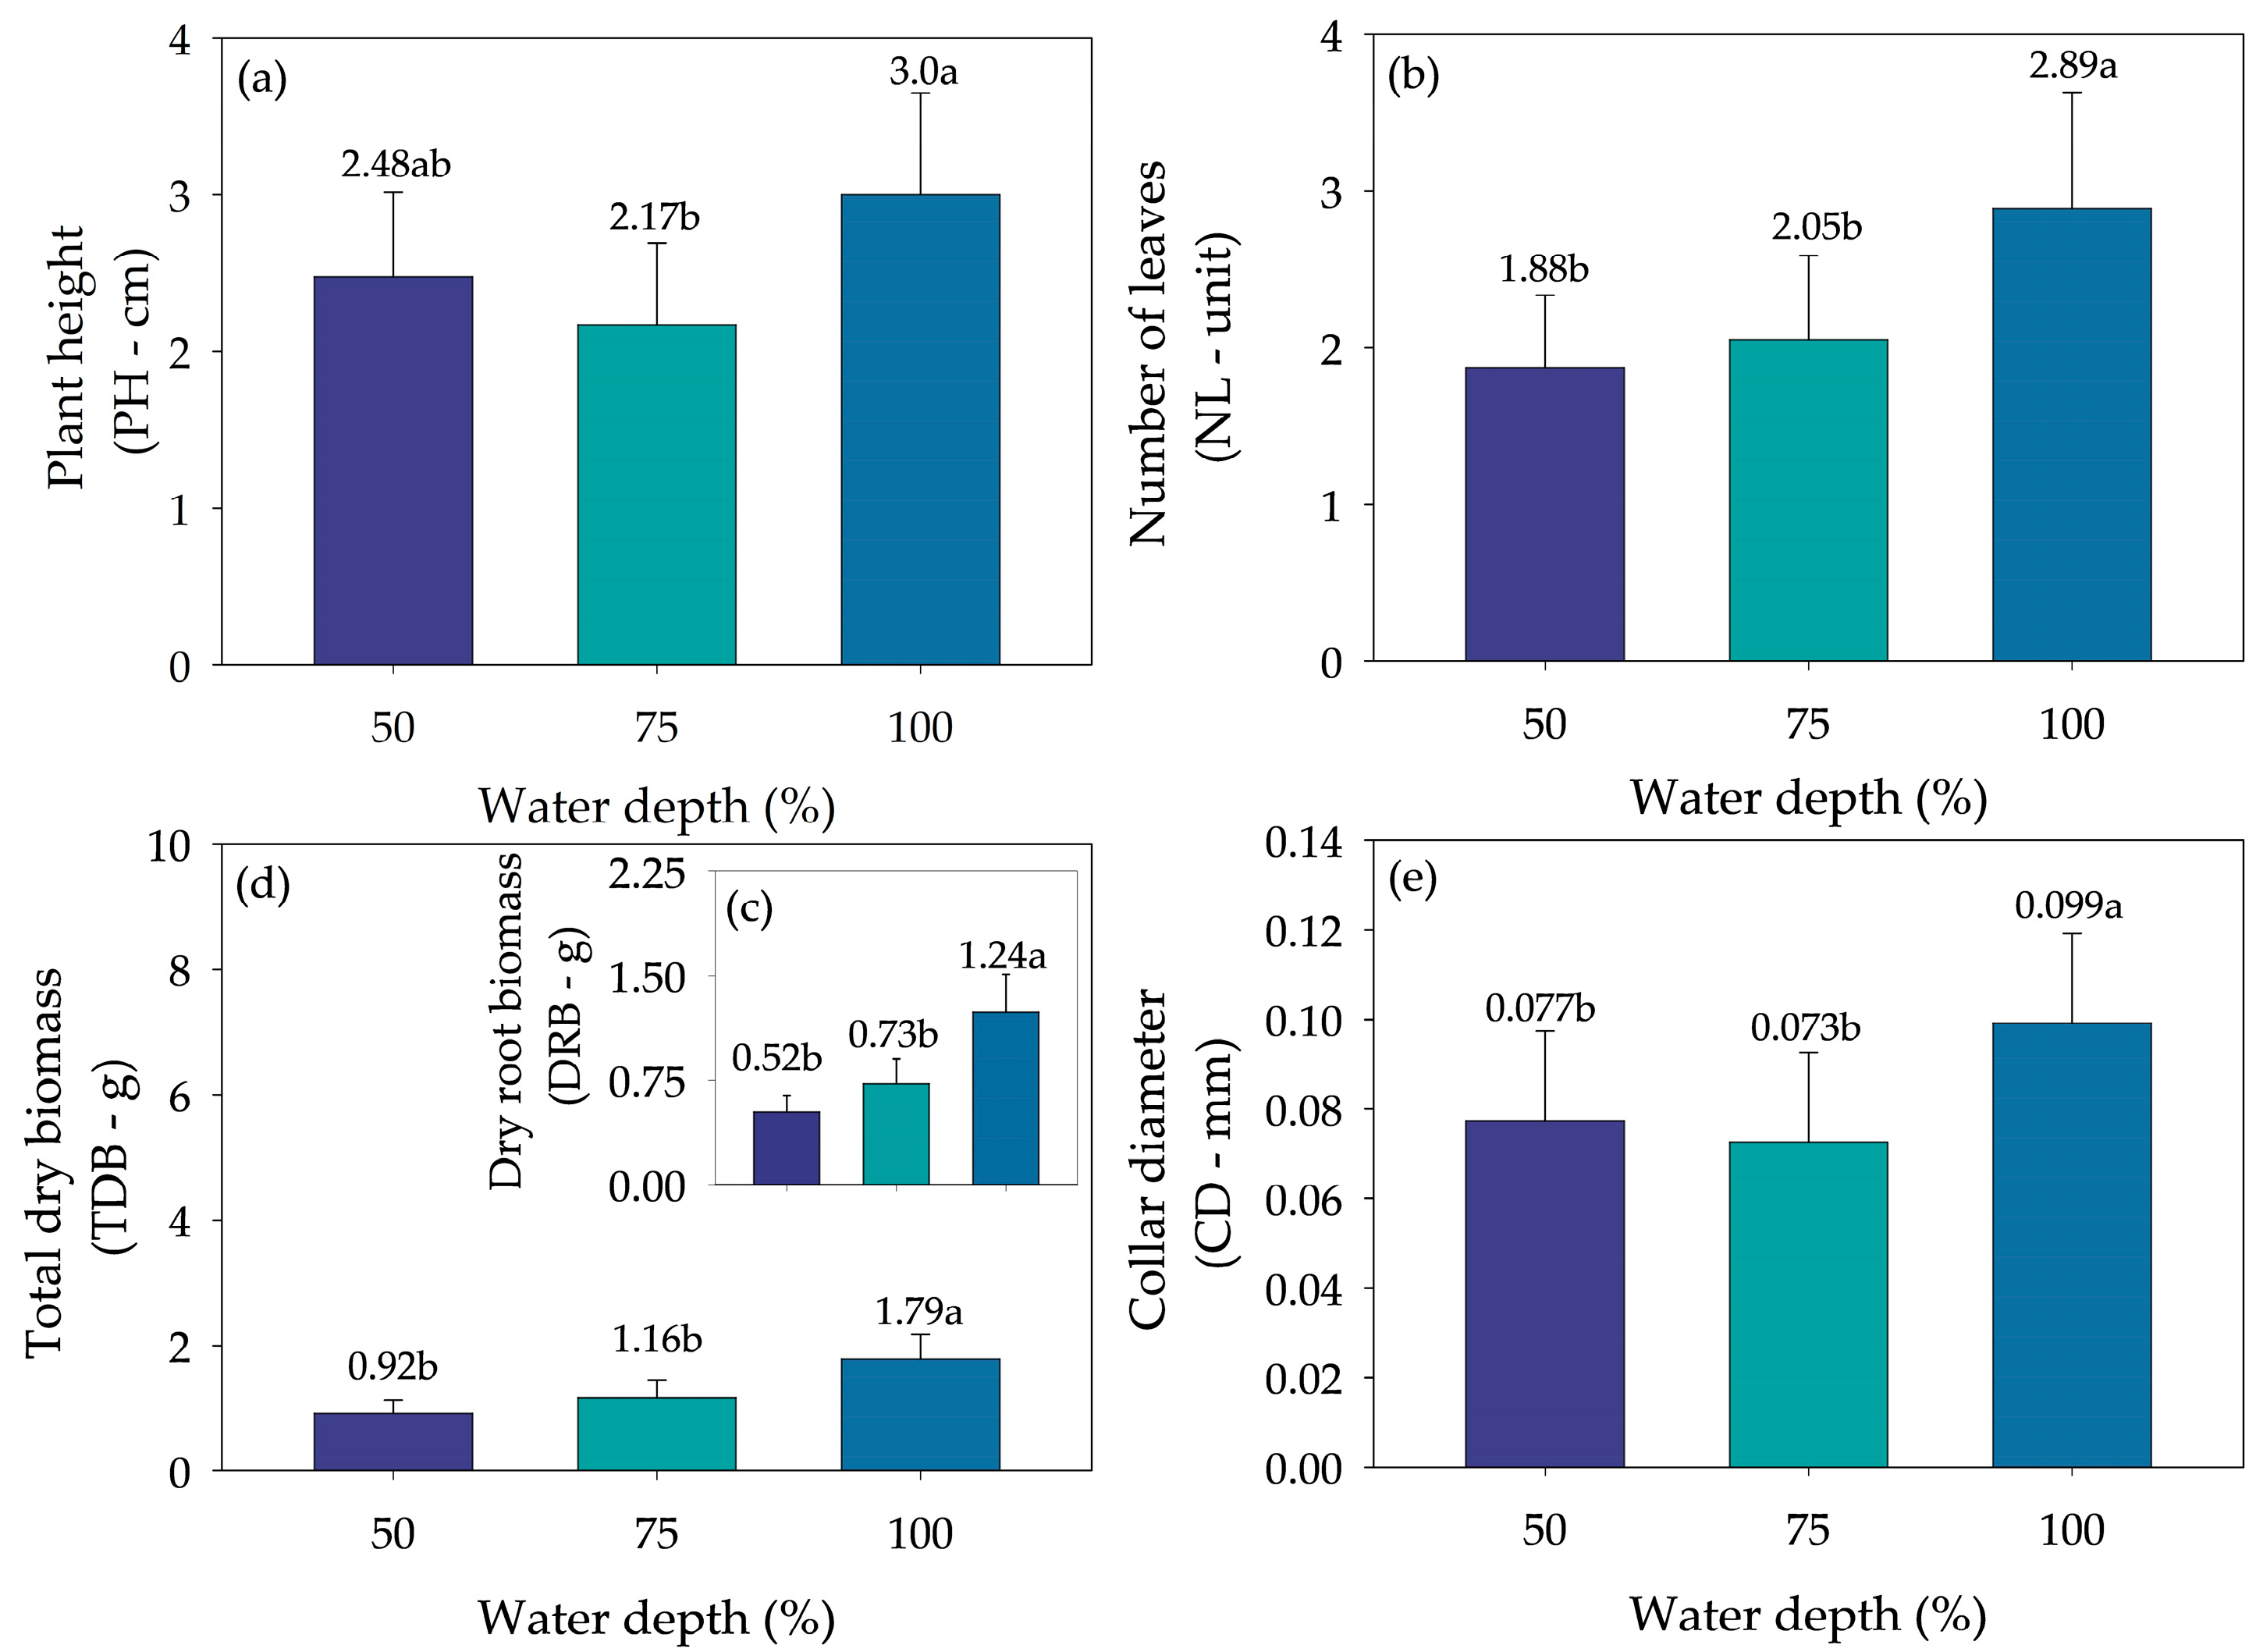
| Water depth | Plant height (cm) | |||
| (%) | 0.27 dS m−1 | 2.25 dS m−1 | 6.35 dS m−1 | 7.38 dS m−1 |
| 50 | 5.72 b | 3.41 c | 0.00 e | 0.78 de |
| 75 | 6.37 ab | 2.31 cd | 0.00 e | 0.00 e |
| 100 | 7.75 a | 3.25 c | 1.00 de | 0.00 e |
| Water depth | Collar diameter (mm) | |||
| (%) | 0.27 dS m−1 | 2.25 dS m−1 | 6.35 dS m−1 | 7.38 dS m−1 |
| 50 | 0.18 b | 0.10 c | 0.00 e | 0.03 de |
| 75 | 0.22 b | 0.07 cd | 0.00 e | 0.00 e |
| 100 | 0.27 a | 0.10 c | 0.02 de | 0.00 e |
| Water depth | Number of leaves (unit) | |||
| (%) | 0.27 dS m−1 | 2.25 dS m−1 | 6.35 dS m−1 | 7.38 dS m−1 |
| 50 | 5.62 b | 1.62 c | 0.00 c | 0.25 c |
| 75 | 7.06 b | 1.12 c | 0.00 c | 0.00 c |
| 100 | 9.75 a | 1.4 c | 0.37 c | 0.00 c |
| Water depth | Dry leaf biomass (g) | |||
| (%) | 0.27 dS m−1 | 2.25 dS m−1 | 6.35 dS m−1 | 7.38 dS m−1 |
| 50 | 0.56 b | 0.32 bc | 0.00 c | 0.06 c |
| 75 | 1.01 a | 0.20 bc | 0.00 c | 0.00 c |
| 100 | 1.10 a | 0.32 bc | 0.07 c | 0.00 c |
| Water depth | Dry root biomass (g) | |||
| (%) | 0.27 dS m−1 | 2.25 dS m−1 | 6.35 dS m−1 | 7.38 dS m−1 |
| 50 | 1.21 cd | 0.76 cd | 0.00 d | 0.12 d |
| 75 | 2.09 b | 0.81 cd | 0.00 d | 0.00 d |
| 100 | 3.08 a | 1.52 bc | 0.36 d | 0.00 d |
| Water depth | Total dry biomass (g) | |||
| (%) | 0.27 dS m−1 | 2.25 dS m−1 | 6.35 dS m−1 | 7.38 dS m−1 |
| 50 | 2.13 c | 1.31 cd | 0.00 f | 0.23 ef |
| 75 | 3.48 b | 1.18 cde | 0.00 f | 0.00 f |
| 100 | 4.62 a | 2.02 c | 0.51 def | 0.00 f |
| Water depth | Water use efficiency (g L−1) | |||
| (%) | 0.27 dS m−1 | 2.25 dS m−1 | 6.35 dS m−1 | 7.38 dS m−1 |
| 50 | 0.57 cd | 0.35 d | 0.00 f | 0.06 ef |
| 75 | 0.74 ab | 0.25 de | 0.00 f | 0.00 f |
| 100 | 0.81 a | 0.35 cd | 0.09 ef | 0.00 f |
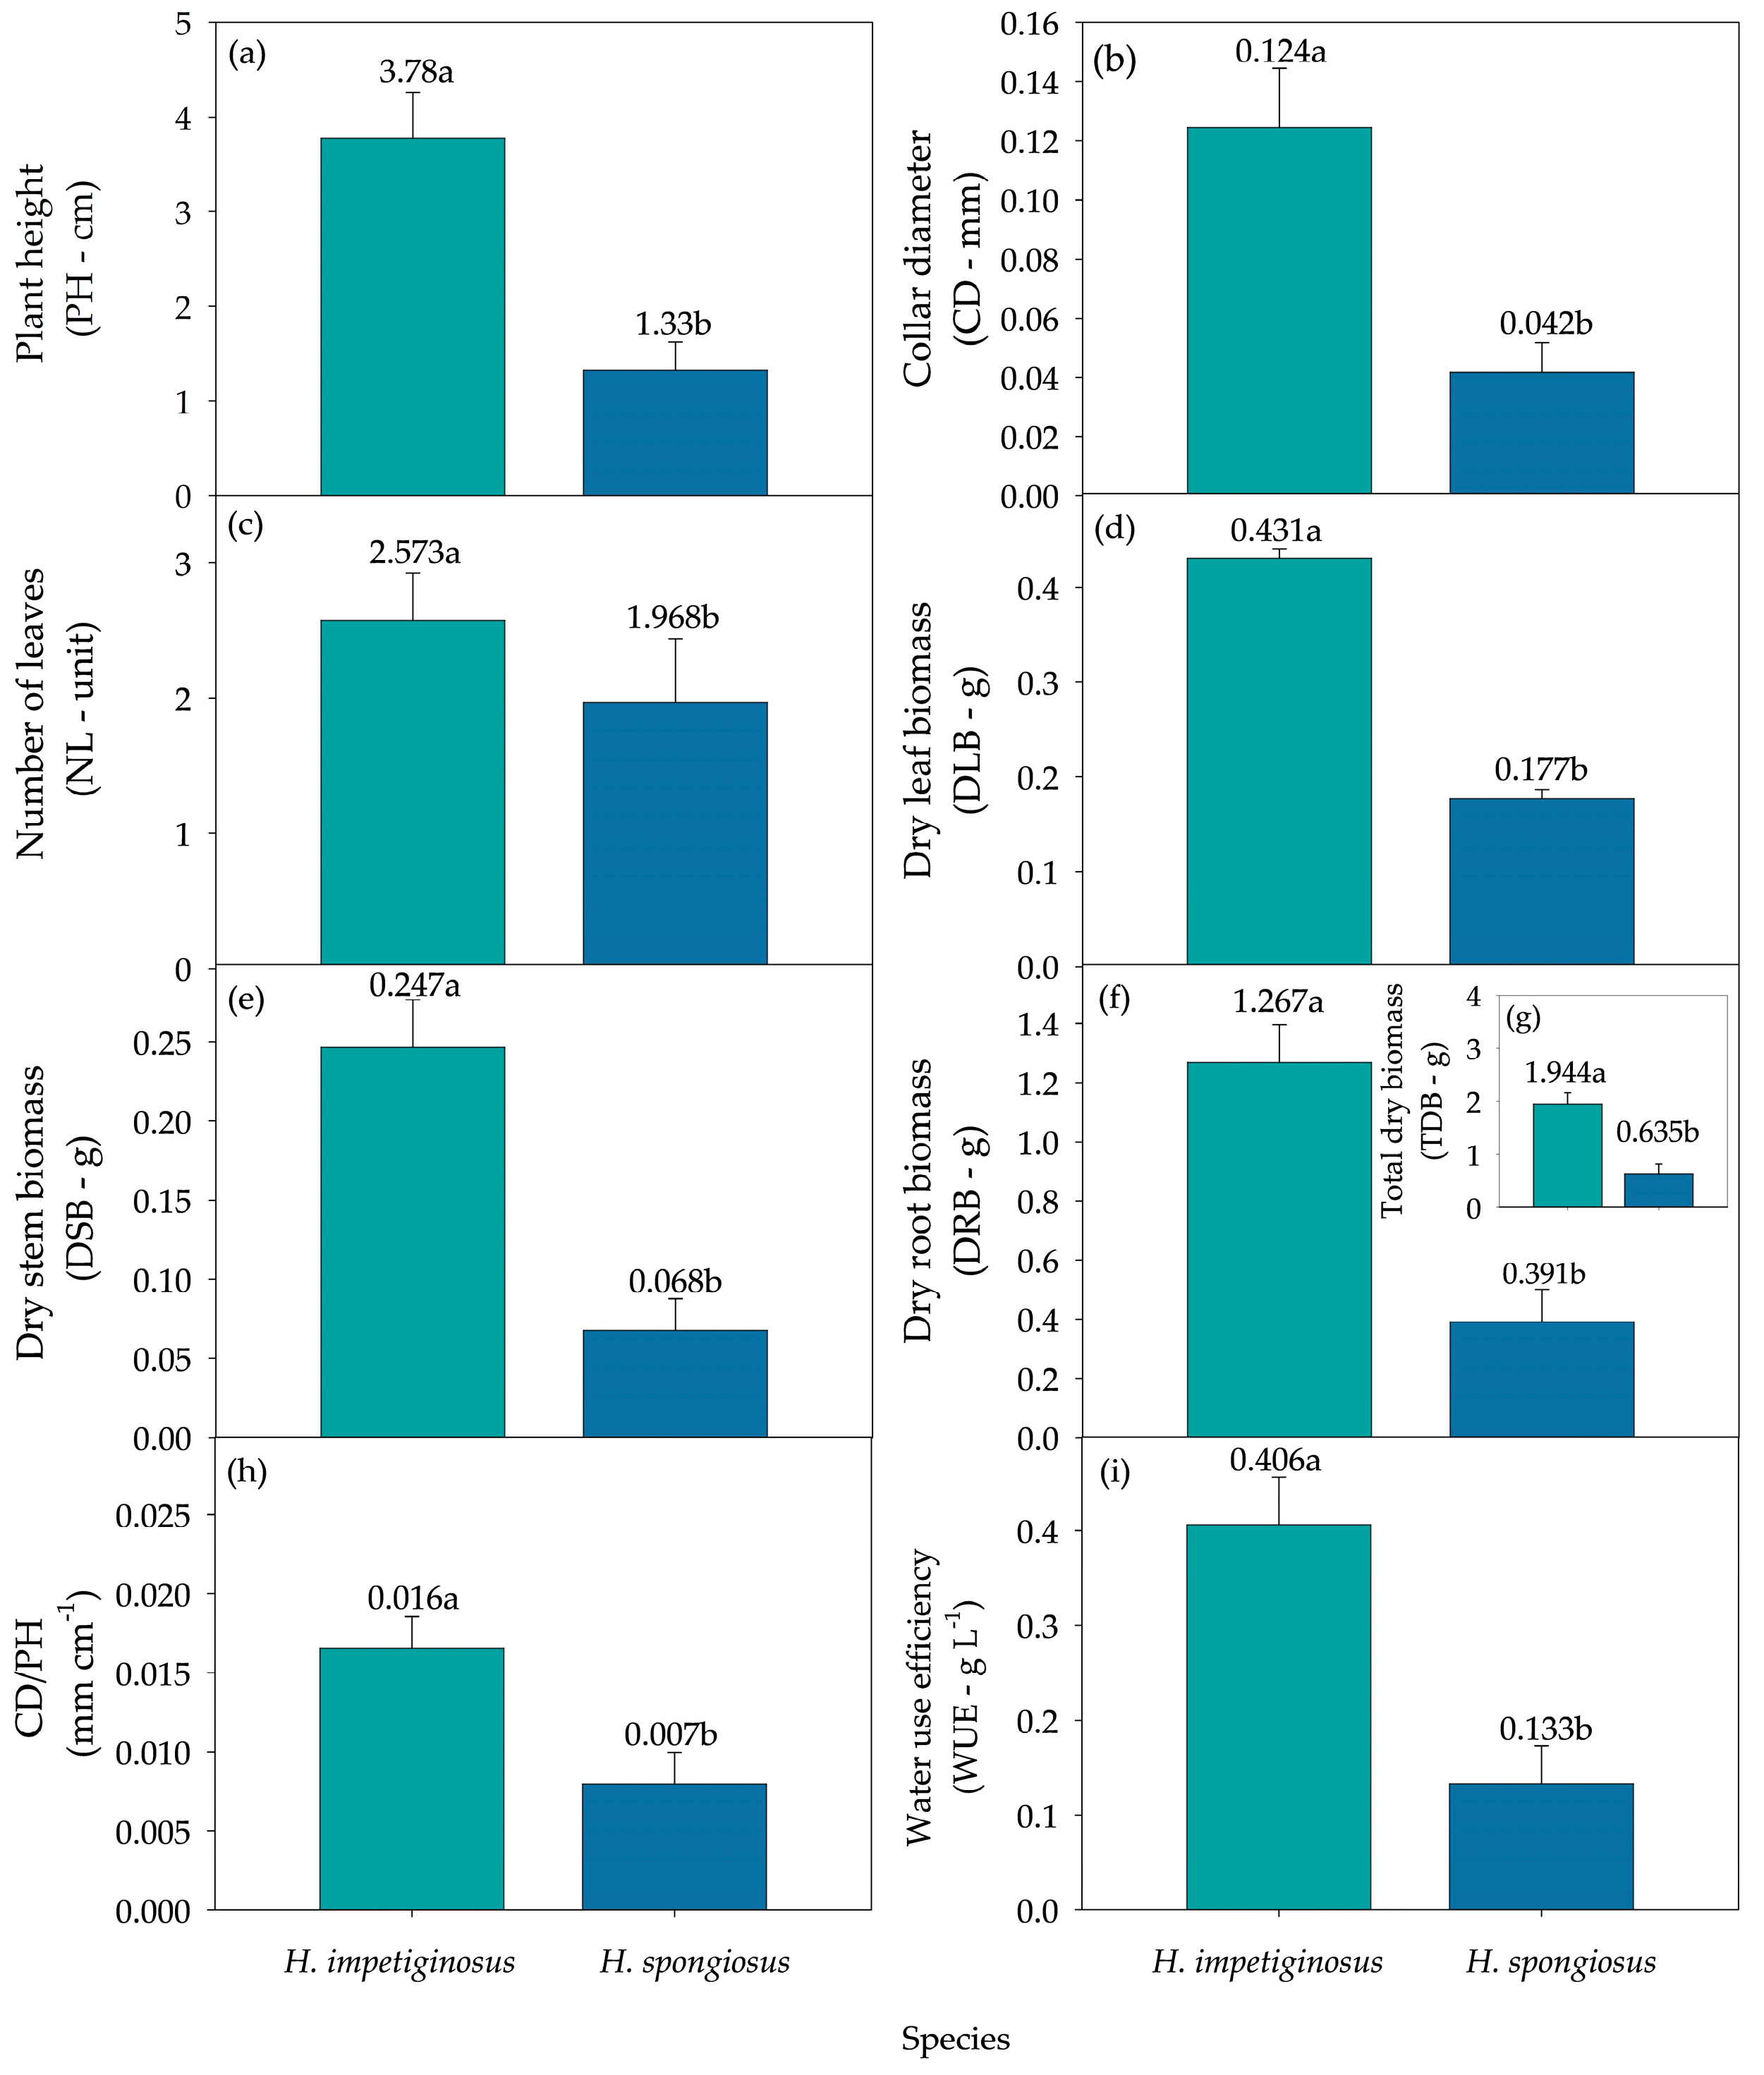
| Salinity levels | Plant height (cm) | |
| (dS m−1) | H. impetiginosus | H. spongiosus |
| 0.27 | 7.94 a | 5.98 b |
| 2.25 | 5.29 b | 0.00 c |
| 6.35 | 0.67 c | 0.00 c |
| 7.38 | 0.52 c | 0.00 c |
| Salinity levels | Collar diameter (mm) | |
| (dS m−1) | H. impetiginosus | H. spongiosus |
| 0.27 | 0.28 a | 0.17 b |
| 2.25 | 0.18 b | 0.00 c |
| 6.35 | 0.01 c | 0.00 c |
| 7.38 | 0.02 c | 0.00 c |
| Salinity levels | Number of leaves (unit) | |
| (dS m−1) | H. impetiginosus | H. spongiosus |
| 0.27 | 7.08 a | 7.87 a |
| 2.25 | 2.79 b | 0.00 c |
| 6.35 | 0.25 c | 0.00 c |
| 7.38 | 0.17 c | 0.00 c |
| Salinity levels | Dry leaf biomass (g) | |
| (dS m−1) | H. impetiginosus | H. spongiosus |
| 0.27 | 1.08 a | 0.71 b |
| 2.25 | 0.56 b | 0.00 c |
| 6.35 | 0.05 c | 0.00 c |
| 7.38 | 0.04 c | 0.00 c |
| Salinity levels | Dry stem biomass (g) | |
| (dS m−1) | H. impetiginosus | H. spongiosus |
| 0.27 | 0.50 a | 0.27 c |
| 2.25 | 0.39 b | 0.00 c |
| 6.35 | 0.05 c | 0.00 c |
| 7.38 | 0.04 c | 0.00 c |
| Salinity levels | Dry root biomass (g) | |
| (dS m−1) | H. impetiginosus | H. spongiosus |
| 0.27 | 2.69 a | 1.56 b |
| 2.25 | 2.06 b | 0.00 c |
| 6.35 | 0.24 c | 0.00 c |
| 7.38 | 0.08 c | 0.00 c |
| Salinity levels | Total dry biomass (g) | |
| (dS m−1) | H. impetiginosus | H. spongiosus |
| 0.27 | 4.27 a | 2.54 b |
| 2.25 | 3.01 b | 0.00 c |
| 6.35 | 0.34 c | 0.00 c |
| 7.38 | 0.15 c | 0.00 c |
| Salinity levels | CD/PH (mm cm−1) | |
| (dS m−1) | H. impetiginosus | H. spongiosus |
| 0.27 | 0.03 a | 0.03 ab |
| 2.25 | 0.03 ab | 0.00 c |
| 6.35 | 0.00 c | 0.00 c |
| 7.38 | 0.00 c | 0.00 c |
| Salinity levels | Water use efficiency (g L−1) | |
| (dS m−1) | H. impetiginosus | H. spongiosus |
| 0.27 | 0.88 a | 0.53 b |
| 2.25 | 0.64 b | 0.00 c |
| 6.35 | 0.06 c | 0.00 c |
| 7.38 | 0.04 c | 0.00 c |
| Water depth | Plant height (cm) | |
| (%) | H. impetiginosus | H. spongiosus |
| 50 | 3.91 ab | 1.05 c |
| 75 | 3.03 b | 1.31 c |
| 100 | 4.39 a | 1.61 c |
| Water depth | Collar diameter (mm) | |
| (%) | H. impetiginosus | H. spongiosus |
| 50 | 0.12 ab | 0.03 c |
| 75 | 0.10 b | 0.04 c |
| 100 | 0.15 a | 0.05 c |
| Water depth | Dry leaf biomass (g) | |
| (%) | H. impetiginosus | H. spongiosus |
| 50 | 0.37 ab | 0.32 b |
| 75 | 0.10 c | 0.29 bc |
| 100 | 0.60 a | 0.14 bc |
| Water depth | Dry root biomass (g) | |
| (%) | H. impetiginosus | H. spongiosus |
| 50 | 0.86 b | 0.18 c |
| 75 | 0.94 b | 0.51 bc |
| 100 | 2.00 a | 0.47 bc |
| Water depth | Water use efficiency (g L−1) | |
| (%) | H. impetiginosus | H. spongiosus |
| 50 | 0.40 ab | 0.09 d |
| 75 | 0.31 bc | 0.18 cd |
| 100 | 0.51 a | 0.12 d |
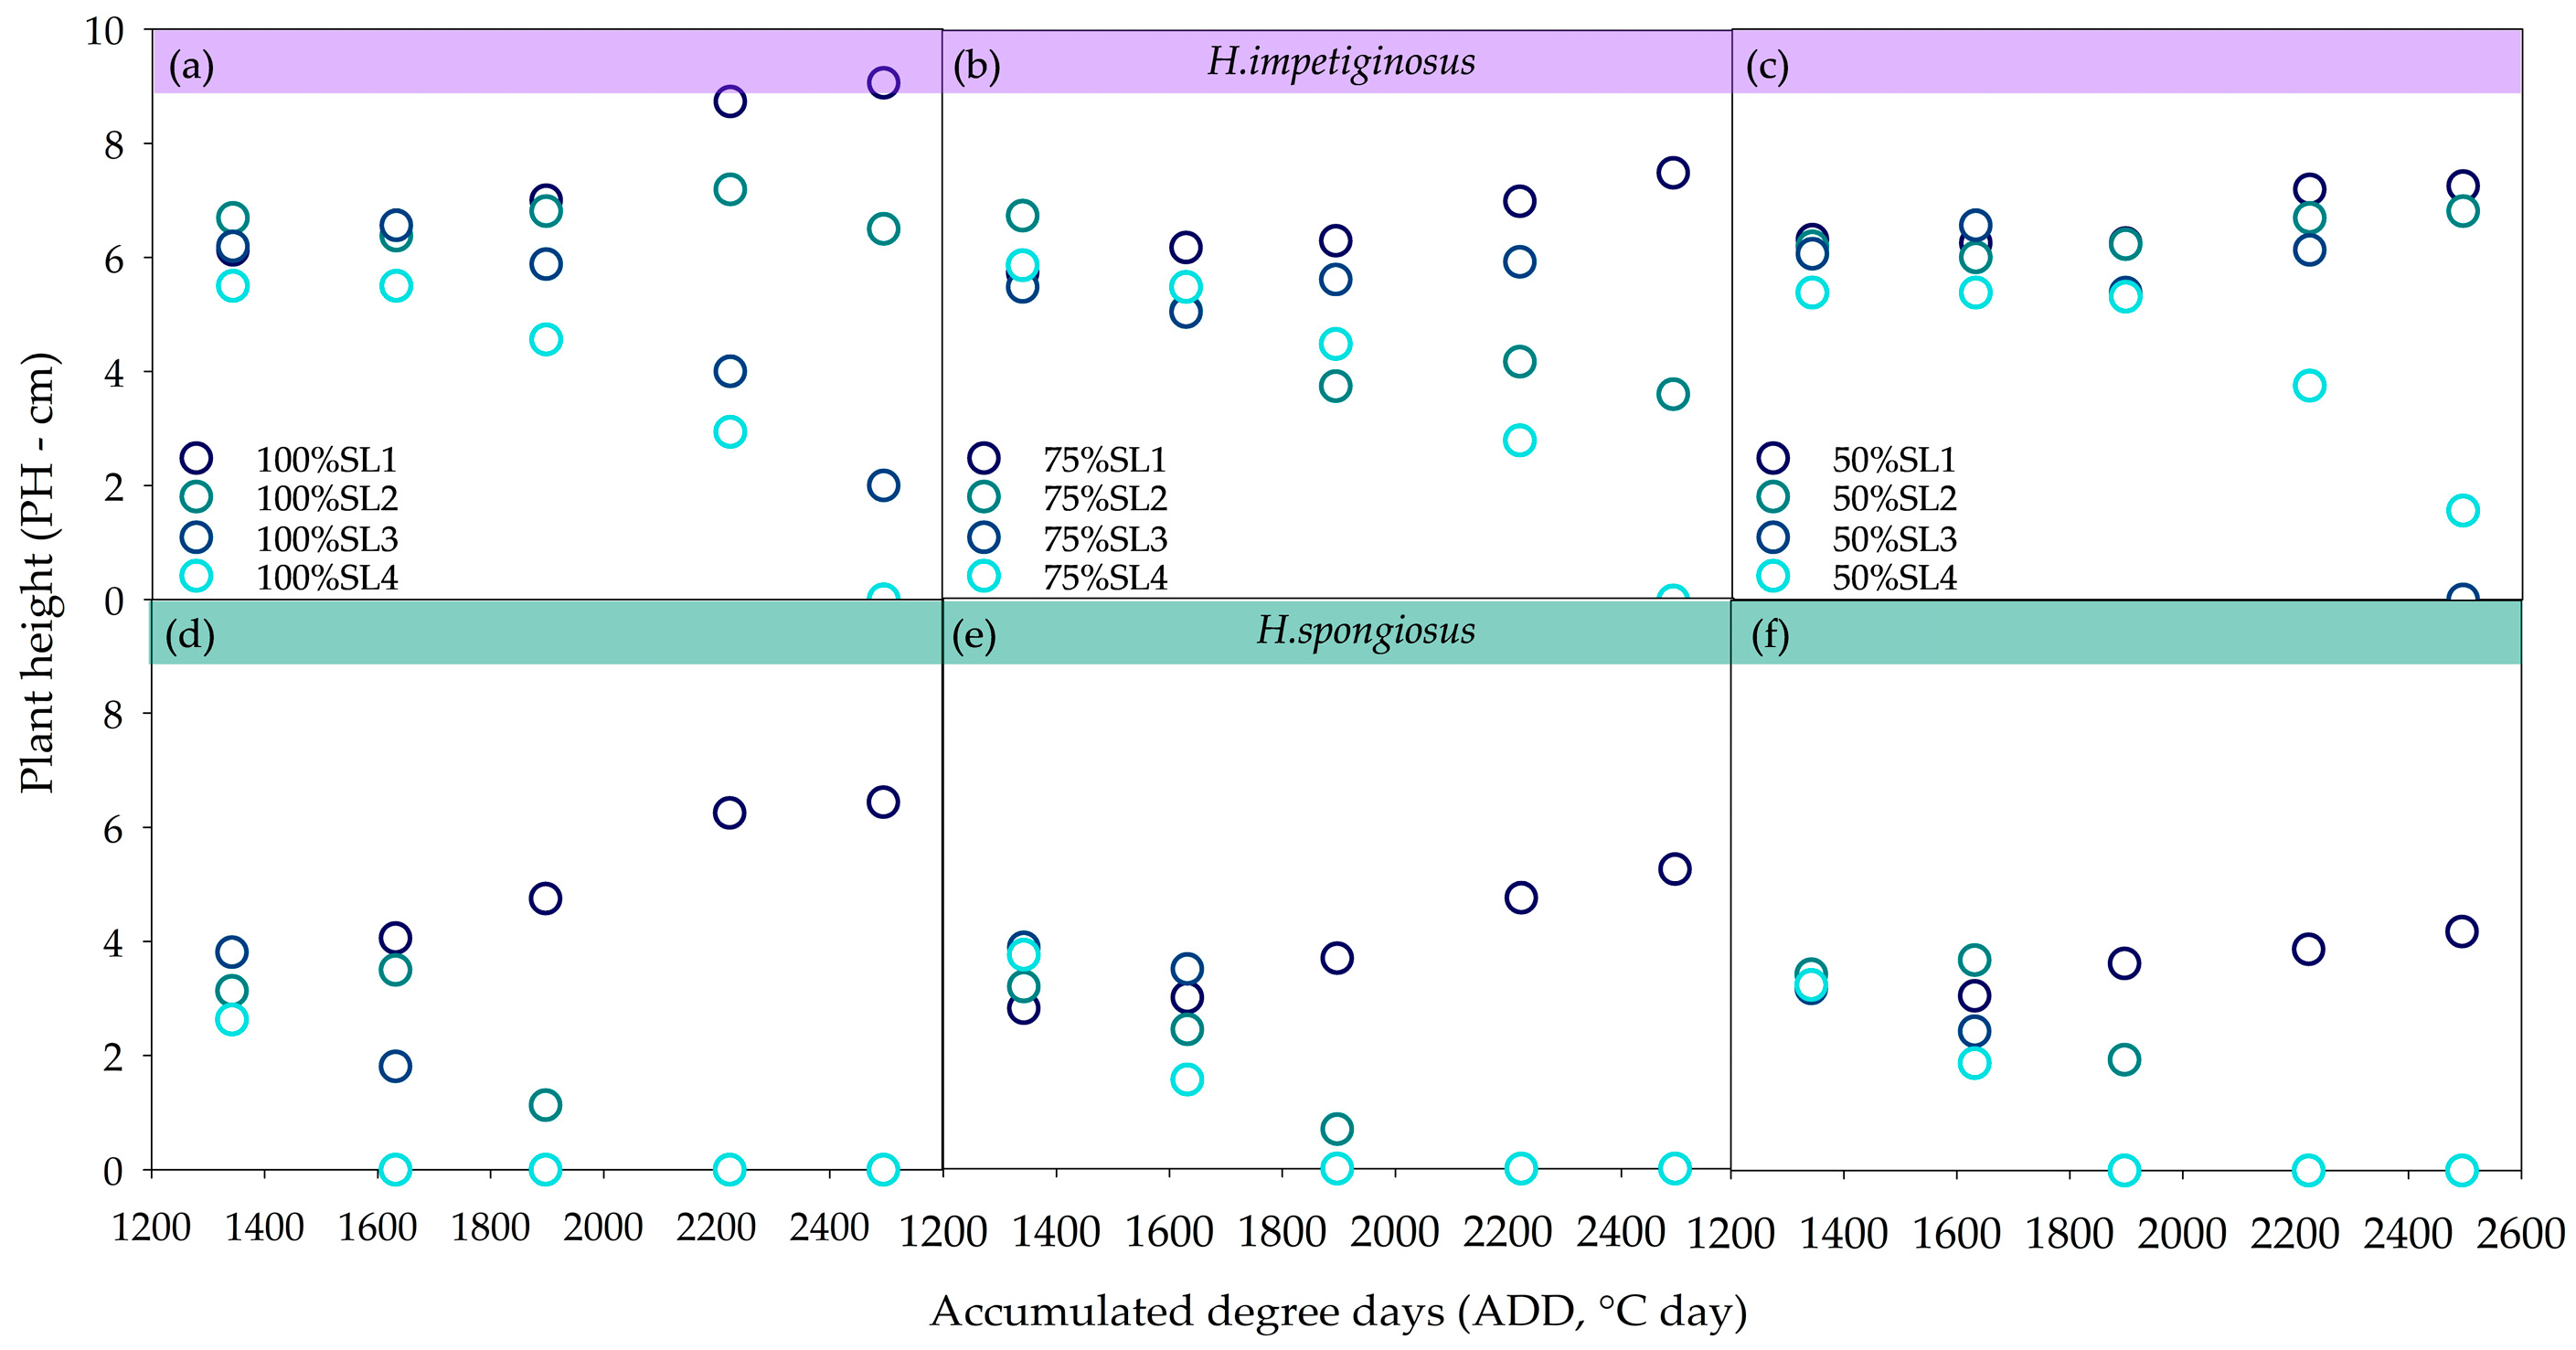
| Date | Specie | Mean Number of Leaves (Unit) | LER (Leaf ADD−1) | Phyllochron (ADD Leaf −1) |
|---|---|---|---|---|
| 09/20/2023 | H. impetiginosus | 5.88 | 0.0052 | 192.55 |
| H. spongiosus | 5.00 | 0.0044 | 226.24 | |
| 10/05/2023 | H. impetiginosus | 6.00 | 0.0095 | 234.07 |
| H. spongiosus | 5.00 | 0.0035 | 280.88 | |
| 10/20/2023 | H. impetiginosus | 6.50 | 0.0040 | 256.90 |
| H. spongiosus | 5.00 | 0.0032 | 303.61 | |
| 11/05/2023 | H. impetiginosus | 7.00 | 0.0035 | 285.11 |
| H. spongiosus | 6.00 | 0.0030 | 332.63 | |
| 11/20/2023 | H. impetiginosus | 8.20 | 0.0036 | 276.55 |
| H. spongiosus | 6.00 | 0.0026 | 377.95 |
Disclaimer/Publisher’s Note: The statements, opinions and data contained in all publications are solely those of the individual author(s) and contributor(s) and not of MDPI and/or the editor(s). MDPI and/or the editor(s) disclaim responsibility for any injury to people or property resulting from any ideas, methods, instructions or products referred to in the content. |
© 2025 by the authors. Licensee MDPI, Basel, Switzerland. This article is an open access article distributed under the terms and conditions of the Creative Commons Attribution (CC BY) license (https://creativecommons.org/licenses/by/4.0/).
Share and Cite
Moura, M.B.M.d.; Barros, T.F.; Silva, T.G.F.d.; Santos, W.M.d.; Martins, L.D.C.d.S.; Silva, E.F.d.; de Lima, J.L.M.P.; Tang, X.; Jardim, A.M.d.R.F.; Souza, C.A.A.d.; et al. Saline Water Stress in Caatinga Species with Potential for Reforestation in the Face of Advancing Desertification in the Brazilian Semiarid Region. Environments 2025, 12, 239. https://doi.org/10.3390/environments12070239
Moura MBMd, Barros TF, Silva TGFd, Santos WMd, Martins LDCdS, Silva EFd, de Lima JLMP, Tang X, Jardim AMdRF, Souza CAAd, et al. Saline Water Stress in Caatinga Species with Potential for Reforestation in the Face of Advancing Desertification in the Brazilian Semiarid Region. Environments. 2025; 12(7):239. https://doi.org/10.3390/environments12070239
Chicago/Turabian StyleMoura, Márcia Bruna Marim de, Tays Ferreira Barros, Thieres George Freire da Silva, Wagner Martins dos Santos, Lady Daiane Costa de Sousa Martins, Elania Freire da Silva, João L. M. P. de Lima, Xuguang Tang, Alexandre Maniçoba da Rosa Ferraz Jardim, Carlos André Alves de Souza, and et al. 2025. "Saline Water Stress in Caatinga Species with Potential for Reforestation in the Face of Advancing Desertification in the Brazilian Semiarid Region" Environments 12, no. 7: 239. https://doi.org/10.3390/environments12070239
APA StyleMoura, M. B. M. d., Barros, T. F., Silva, T. G. F. d., Santos, W. M. d., Martins, L. D. C. d. S., Silva, E. F. d., de Lima, J. L. M. P., Tang, X., Jardim, A. M. d. R. F., Souza, C. A. A. d., Souza, K. R. S. d., & Souza, L. S. B. d. (2025). Saline Water Stress in Caatinga Species with Potential for Reforestation in the Face of Advancing Desertification in the Brazilian Semiarid Region. Environments, 12(7), 239. https://doi.org/10.3390/environments12070239