Article

Energy Footprints, Energy Sufficiency, and Human Well-Being in Iceland

by
Kevin Joseph Dillman
1,
Anna Kristín Einarsdóttir
1,
Marta Rós Karlsdóttir
2 and
Jukka Heinonen
1,*
1
Faculty of Civil and Environmental Engineering, School of Engineering and Natural Sciences, University of Iceland, 107 Reykjavík, Iceland
2
Baseload Power Iceland Ehf., Katrínartún 2, 105 Reykjavík, Iceland
*
Author to whom correspondence should be addressed.
Environments 2025, 12(7), 238; https://doi.org/10.3390/environments12070238
Submission received: 10 June 2025 / Revised: 8 July 2025 / Accepted: 9 July 2025 / Published: 11 July 2025

Abstract

In the intersecting field of energy consumption and human well-being, many macro-level studies link national energy use with well-being. These studies often rely on aggregate data, however, limiting insights into intra-national inequities and diverse well-being outcomes. To bridge this gap, this study used a single Nordic survey that allowed for the calculation of consumption-based energy footprints alongside well-being measures, focusing on Icelandic participants. A factor analysis of well-being responses identifies four factors: Eudaimonic, Financial, Housing/Local, and Health-related well-being. We found that well-being in Iceland largely remains decoupled from energy footprints across income and consumption groups, except for financial well-being. However, these groups differ significantly in consumption lifestyles and associated footprints, with only a small fraction of consumers maintaining energy use within global sufficiency thresholds. Most exceed these levels, suggesting that Iceland could reduce energy consumption without significantly harming well-being. Future research should explore strategies to lower consumption without triggering negative social reactions or declines in well-being.

1. Introduction

Energy, consumed either directly or embedded in goods and services, is an essential input to provisioning systems that satisfy human wants and needs [1]. Since the 1950s, however, the global exponential growth in human activity has led to similar exponential growth in global energy production and consumption systems [2], which has played a central role in the transgression of planetary boundaries [3]. As of 2020, energy production directly or indirectly accounted for 72% of total anthropogenic emissions [4]. The responsibility for these impacts, however, is highly unequal, both inter- and intra-nationally [5].
With the goal of achieving a sustainability vision where globally we operate within planetary limits and human well-being is maintained for all, such as set out in Raworth’s Doughnut [6,7], this inequality becomes highly relevant [8].
In works such as O’Neill et al. [8] (amongst other studies such as [9,10,11]) which map cross-national well-being and environmental impact (primarily using planetary boundary indicators), the common structure is that developed countries have high levels of well-being and high levels of impact, while lower-income countries frequently see lower levels of well-being and lower levels of impact. For developed countries, a key question then arises of how to maintain high levels of well-being while decreasing global environmental impacts, where it is likely that this will require demand-side solutions or addressing overconsumption to some degree to remain within planetary limits [12,13,14].
To study the relationship between the environmental impacts of household consumption and well-being, commonly, environmental impacts (such as GHG emissions) are connected to driving human activity related to these impacts (such as transportation, housing energy use, etc.). It has been pointed out by some scholars though that energy consumption sits closer to well-being than environmental impacts because of the closer connection to the services which facilitate well-being [15]. Therefore, when attempting to understand pathways to maintain well-being within environmental limits, studying energy footprints becomes a relevant and important consumption indicator. Related to this, experts have further recognized the importance of taking a consumption-based perspective when connecting to well-being, which additionally has been recognized to sit closer to the consumption of goods and services that facilitate human flourishing [10]. Previous consumption-based energy footprint approaches have typically taken macro-level top-down perspectives, however [16,17], lacking a distributional view on how differing lifestyles may lead to heterogeneous household footprints. This is important when considering sufficiency from both minimum and maximum consumption perspectives [18], where too little consumption can lead to energy or transport poverty [19,20], while overconsumption is a key driver of environmental impact [21].
This macro-level focus in environmental impact/energy use and well-being relationship studies extends to the well-being indicators used, where studies in this field have often conceptualized well-being using macro-level factors such life expectancy, income, or population-averaged subjective well-being responses [22,23,24,25]. In such macro-level studies, what is typically seen is a dampening curve, where, when moving from very low to intermediate energy consumption, the well-being indicator(s) studied rapidly rise. However, after this intermediate level of consumption, continued energy consumption appears to disassociate from well-being, where the marginal benefits of increased energy consumption on well-being become increasingly small. In the distributional analyses that do exist, often it is self-reported general happiness or life satisfaction that is used to model well-being [26,27,28,29], though some do extend to mental/physical health or social capital [30,31]. In such distributional studies, similar dampening curves were consistently found, where, as energy footprints increased (often associated with income deciles), marginal benefits to both objective and subjective well-being indicators decreased. While there have been a limited number of studies which have sought to address these bottom-up consumption-based energy footprint/well-being research gap (e.g., [16]), this remains an under-researched domain of study, where consumption, lifestyles, well-being, and energy footprints have rarely been studied together, particularly working from the same survey data. Therefore, this study seeks to add the literature surrounding how energy consumption relates to well-being through the use of Nordic survey data, where we focus specifically on Iceland and pose the following research questions:
-
How does energy consumption relate to perceived well-being in Iceland?
-
Which variables explain perceived well-being in different well-being domains in Iceland?
-
What is the distribution of the Icelandic population living within sufficiency limits (or with excessive consumption), and how do their consumption behaviors (lifestyles) differ?
Iceland offers an interesting context for exploring the relationship between energy consumption and well-being due to its high share of domestic renewable energy, low-income inequality, and cold climate combined with high affluence and high reliance of imports. The country’s nearly universal access to renewable energy sources, such as hydropower and geothermal, helps enable low household energy costs and a high living standard. This simultaneously leads to a potentially less engaged population regarding energy savings and energy efficiency, due to energy domestically often being perceived as cheap and clean in the country [32]. Further, despite its high renewable energy proliferation and “green” international reputation, Iceland’s high per capita income and geographic isolation has translated to high levels of consumption primarily supplied by imported goods. Iceland’s culture of high (energy) consumption as well as national carbon neutrality goals, potentially further allocating an already high percentage of national energy production to industry (where currently only 4.5% of electricity production is used for households [33]), has led to growing energy scarcity concerns by national energy companies [34,35]. These factors increase the importance of understanding how energy consumption relates to well-being across the population to understand the potential value in promoting energy-sufficient lifestyles to reduce the need for further increased energy production and reducing energy injustices.
This work contributes to the literature surrounding well-being and energy consumption in various ways. First, this work adds to the sparse literature relating bottom-up energy footprints to subjective well-being. Second, through this connection, it can relate energy consumption to well-being in an Icelandic context, where, with the results showing limited influence of increased energy consumption on various types of well-being, it highlights the potential of demand-side policies to decrease household energy consumption without damaging well-being if employed effectively. Lastly, it shows what type of lifestyles are energy sufficiency-compatible in terms of consumption patterns and which consumption choices lead to excessive energy footprints. By investigating well-being within the framework of energy sufficiency, this work addresses critical questions about the trade-offs and lifestyle adjustments necessary to live within sustainable energy limits.
The work is organized as follows: First, we describe the materials and methods used to (a) calculate the energy footprints, (b) define and measure well-being, and (c) interpret the relationship between them. Then we provide the results of this analysis, mapping by income groups and providing the regression results for the relationships. Lastly, we discuss the results in the context of previous studies and discuss the implications for international researchers and policymakers as well as Icelandic policymakers.

2. Materials and Methods

This section details the materials and methods used to perform the study, beginning with the survey data and Icelandic context, followed by a brief description of the energy footprint calculations as well as how well-being was defined and estimated. Lastly, the analytical methods used to study the relationship between Icelandic energy footprints and well-being were described.

2.1. Survey Data

The survey data used to assess Icelandic energy footprints related to well-being came from a cross-Nordic survey in the form of a carbon footprint calculator (carbonfootprint.hi.is), which asked questions about the respondent’s consumption behaviors, various types of well-being, income, political view, as well as other socio-demographic variables. Participation was restricted to adults participating in household finances, with the goal of ensuring a sample capable of providing accurate consumption data. Across the Nordics, 7433 full responses were provided after removing incomplete, duplicate, and/or unrealistic responses. Zooming in to Iceland, 1515 responses were collected. Each participant gave their informed consent for utilization of the responses in scientific research.
A more detailed description survey and data are most thoroughly provided in Heinonen et al. [31]. The conversion from the carbon footprints into energy footprints is explained in detail in Einarsdóttir et al. [33], though a brief description of the energy footprint calculations is given in the next section. This will be the first work in this study to connect the consumption of the survey respondents to their self-reported well-being; thus, in the following subsections, more weight will be placed on the approach to studying self-reported well-being. The full dataset is also openly available at https://zenodo.org/records/10656970 (accessed on 10 July 2025).
This connection in an Icelandic study context provides an interesting backdrop where the combination of a cold climate with high heating needs, relatively low-income inequality, and high energy imports embedded in imported goods creates an interesting setting for the exploration of consumption-based energy footprints and self-reported well-being. Iceland’s cold temperatures (average annual temperatures around 5–6 degrees Celsius in the capital region) and sprawled urban form [36] necessitate significant energy use for heating and transportation, yet the country benefits from nearly universal access to renewable energy sources, primarily hydropower and geothermal. This abundance of renewable energy has enabled Iceland to maintain one of the highest living standards globally, but has led to (a) a disproportionate amount of energy use in Iceland for industries (primarily heavy metal industries such as aluminum smelting) and (b) a popular perception of “clean” and “cheap” energy, potentially contributing to wasteful energy practices, as can sometimes occur [32,33]. This use of electricity for industrial purposes and relatively unchecked thermal energy use by households has led to environmental debates regarding the need to further expand energy systems in Iceland, where Icelandic energy companies have been starting to sound the alarm on an approaching energy shortage due to continued increased demand. With these debates stirring domestically, understanding how energy relates to well-being in Iceland, with considerations for heterogeneous energy footprints of different socio-demographic groups, becomes paramount to addressing these questions.

2.2. Icelandic Consumption-Based Energy Footprints

The consumption-based energy footprints were developed through survey questions related to the respondent’s consumption behavior across eight domains (housing, diet, goods and services, public transportation, vehicle possession, leisure travel, summer cottages, and pets), aiming at capturing all consumption activities enabling the assessment of consumption-based footprints, as described briefly in the following subsections. These behaviors were linked to domain-specific consumption quantities that were then connected to relevant direct and/or embedded energy intensities per consumption (sub-)category. These calculations are described in detail in Einarsdóttir et al. [33]. Since then, a modification has been made to the housing energy footprint: to account for shared spaces in apartment buildings such as storage areas, shared laundry facilities, and stairwells, 5% was added to heating energy use [37] and 25% to electricity use [38] for individuals living in apartments. In line with the original approach, respondents who selected “other” as their housing type were treated as apartment dwellers and received the same adjustment.
The remaining calculations are described briefly here. The functional unit used in this work is the so-called consumption unit, which was developed to capture the financial impact of additional household member and therefore allows for fair allocation of footprints in the domains shared within a household. According to the consumption unit definition, the first adult has a weight of 1, all subsequent adults have a weight of 0.7, and each child has a weight of 0.5 for. The purpose of using this unit is to reduce overestimation of an individual’s energy footprint in shared domains such as housing, vehicles, and second homes for households with other adult/children household occupants. This provides a more realistic distribution of the energy footprints for multi-person households. Table 1 gives an overview of the data used in the calculations. The consumption units in each household were used to allocate the footprints in the Housing, Vehicles, and Summer Cottages domains, whereas in the others, the respondent reported their own consumption/purchases/activity.

2.3. Well-Being

2.3.1. Background on Human Well-Being

Humans have debated the purpose and meaning of well-being since the earliest days of civilization [48]. Philosophical approaches typically divide into hedonic and eudaimonic perspectives [49]. Hedonic well-being focuses on happiness derived from external sources, aiming to maximize pleasure and minimize pain. Eudaimonic well-being emphasizes living fully and meaningfully, centering on virtue and self-actualization as pathways to internal happiness. Researchers measure well-being through both subjective and objective methods [50]. Subjective measures rely on individuals’ own assessments of their lives, typically collected through social surveys, while objective measures use external indicators such as income, health, and education. Although researchers measure these indicators objectively, they select them based on subjective judgments about what constitutes a good life. Together, these approaches and methods shape how we understand and track human well-being across different contexts.

2.3.2. Self-Reported Well-Being in the Survey

In this work, we used the same Nordic survey used to calculate the energy footprints; however, this time, we used the answers to the specific well-being-related questions. To examine dimensions of well-being, the survey included questions that asked respondents to self-report (subjective) their satisfaction with various aspects of their lives on a scale from 1 (very dissatisfied) to 10 (very satisfied) (evaluative approach). These questions spanned topics such as finances, personal achievement, housing, and engagement in society. Without an existing standard to study domain satisfaction, the survey questions were compiled using question formats from well-established international and European publications on the topic [51,52,53]. The questions asked were as follows:
  • All things considered, how satisfied are you with your life these days?
  • How satisfied are you with the following aspects of your life…
    • Your standard of living
    • Your financial situation
    • Your local area as a place to live
    • Your housing conditions
    • Your personal relationships
    • How you participate in society
    • Things you are achieving in life
    • Meaning or purpose in life
    • How engaged and interested you are in your daily activities
    • Your job or studies
    • The amount of time you have to do the things you like doing
    • Your health

2.3.3. Well-Being Factor Analysis

Factor analysis was conducted using the principal axis (PA) extraction method, which is effective in identifying latent constructs even when data do not meet the strict assumption of multivariate normality. This technique reduces a larger set of observed variables into fewer underlying factors by identifying patterns of correlations, allowing conceptually related variables to cluster into interpretable dimensions [54]. The analysis uncovered underlying dimensions that grouped related aspects of well-being, consistent with approaches used in other self-reported well-being studies across various contexts (e.g., [55,56]). This analytical process distilled the survey responses into consolidated dimensions of well-being, providing a foundation for understanding how different aspects of life contribute to well-being in the Icelandic context.
The number of factors to retain was determined through theoretical considerations and the scree plot method, resulting in three primary factors. A promax rotation was applied to account for expected correlations among factors, reflecting the interrelated nature of well-being dimensions. Factor loadings were interpreted based on their strength, with values greater than 0.5 indicating strong associations between survey items and specific factors.
The analysis demonstrated a robust statistical fit. The chi-square test comparing the null and hypothesized models showed a significant reduction in chi-square values (from 9718.08 to 472.32, p < 4.1 × 10−84), confirming the adequacy of the factor structure. Additional fit indices, including a low root mean square residual (RMSR) of 0.03 and high communalities for most variables, supported the model’s validity. Together, the three factors accounted for 81% of the cumulative variance, highlighting their explanatory power in capturing well-being dimensions.
Table 2 shows the results of this factor analysis, which was the source of the four well-being categories used for the rest of the study. Four factors were revealed—Eudaimonic, Financial, Health, and Housing and Local Environment well-being. These groupings emerged naturally from the data, with loading values indicating the strength of each question’s association with a factor, where we explain our naming conventions here. We do not suggest these category names to encompass all forms or a perfect representation of human well-being. Rather these category names are loose categorical titles related to the grouped loaded value questions.
The first factor we named Eudemonic well-being through its strongest loading factors related to achievement, purpose, and well-being. These values as well as the secondary factors of job satisfaction and satisfaction connection to society are well aligned with definitions of eudaimonic well-being by leading authors such on the topic such as Waterman [57] and Ryan and Deci [49].
The financial well-being factor was defined by the loading values related to questions surrounding happiness with one’s living and financial situations. Previous studies, e.g., [58,59], have sought to define financial well-being as a form of subjective well-being related to one’s financial satisfaction and feeling of financial to comfort related to the ability to afford goods associated with meeting basic needs (e.g., housing, food, etc.).
The housing well-being factor was related to loading factors associated with respondents’ self-reported happiness related to their local environment surrounding their living environment as well as the house itself. Previous studies have shown a relationship between the built environment and human well-being [60,61], and we have named this factor to represent this relationship in our study.
The last factor was related to one’s perception of their health as related to their well-being, where this was related to a single question asking about one’s satisfaction with this topic. Physical and mental health has consistently been identified as a core domain of overall subjective well-being, and self-reported health measures are widely used and validated in well-being research [62].

2.3.4. Regressions on Household Energy Footprints and Well-Being

The relationship between Eudaimonic well-being and Icelandic energy footprints was analyzed using a multiple linear regression model. Multiple linear regression estimates the independent contribution of each predictor while holding other variables constant, providing interpretable coefficients that indicate the expected change in the dependent variable per unit change in each predictor [63]. In this work, we used this method to study the effect of predictor variables such as income, household type, political affiliation, gender, and urbanization level on energy footprints, with each well-being factor as the dependent variable. The model coefficients provided insight into the direction and magnitude of these effects, while p-values assessed their statistical significance. Statistical diagnostics, including variance inflation factor (VIF), confirmed no significant multicollinearity among variables, ensuring reliable interpretations of the model’s results.

2.4. Sufficiency

Lastly, to address the research question surrounding how energy consumption levels affect well-being and understanding which lifestyle choices allow one to live within what would be considered sufficient levels in terms of maximum consumption, determining what levels of energy consumption should be considered “sufficient” was necessary. Here we use “sufficient” in the terms of maximum consumption as described in [18,64], where the concept of sufficiency can be used to describe both minimum and maximum consumption. In this work, we relied on a review of energy consumption sufficiency levels by Burke [65], where based on this review, we created four “consumption groups”, as shown in Table 3. Survey participants were grouped into one of these four categories based on their energy footprint, where the level of each consumption of each group was derived from the ranges found in Burke’s review. We then used these groupings as a means to interpret the lifestyle differences between consumption groups, with the goal of relating these consumption groups to well-being, similar to the approach taken by [15]. Following this approach, we found that 10.7%, 35.8%, 27.8%, and 25.7% of our population was categorized as living with low, medium, high, and above high sufficiency consumption levels.
It is worth noting that even the low category is still a relatively high footprint if compared to global energy consumption, where, for example, the global average energy footprint was estimated by Jackson et al. [66] to be 79 GJ (~21,944 kWh) per year. However, as the only ones living close to below this value, we considered this group as the one living energy-sufficient lifestyles.
While, as discussed in the Introduction of this work, energy consumption sits closer to well-being, this also makes establishing minimum and maximum sufficiency levels for this indicator more related to well-being than ecological sufficiency levels (such as GHG emissions per year), which can be more easily translated to ecological limits (such as the planetary boundaries framework [3]). And particularly in Iceland, which requires year-round heating due to its Arctic geographic location, leading to higher baseline household energy use, and the population’s high per capita income and relatively low-income inequality, it is not surprising that our low group, which only incudes 10.7% of the population, still has a globally relatively high energy footprint. If we were to use other sufficiency thresholds, such as those considered by the 2000 W society (~17,500 kWh per year), there would be such a small number of participants from the survey that it would be difficult to have a representative enough sample size to compare lifestyle differences compared to the other groups, justifying our sufficiency energy footprint groupings for the context of the study.

3. Results

The results of this work at a high level showed that in our Icelandic study context, our four well-being factors showed a relatively weak positive correlation with increased energy consumption, with Financial well-being showing the strongest of these weak correlations. Across sufficiency groups (low to above high), Eudaimonic, Housing, and Health well-being were relatively stable, even though energy footprints across groups differed significantly (~3×). These results point to the conclusion that in Iceland’s relatively high-income egalitarian society, increased consumption does not directly correlate to increased well-being, which was also further confirmed by the regression results in which the energy effect was isolated from other factors.

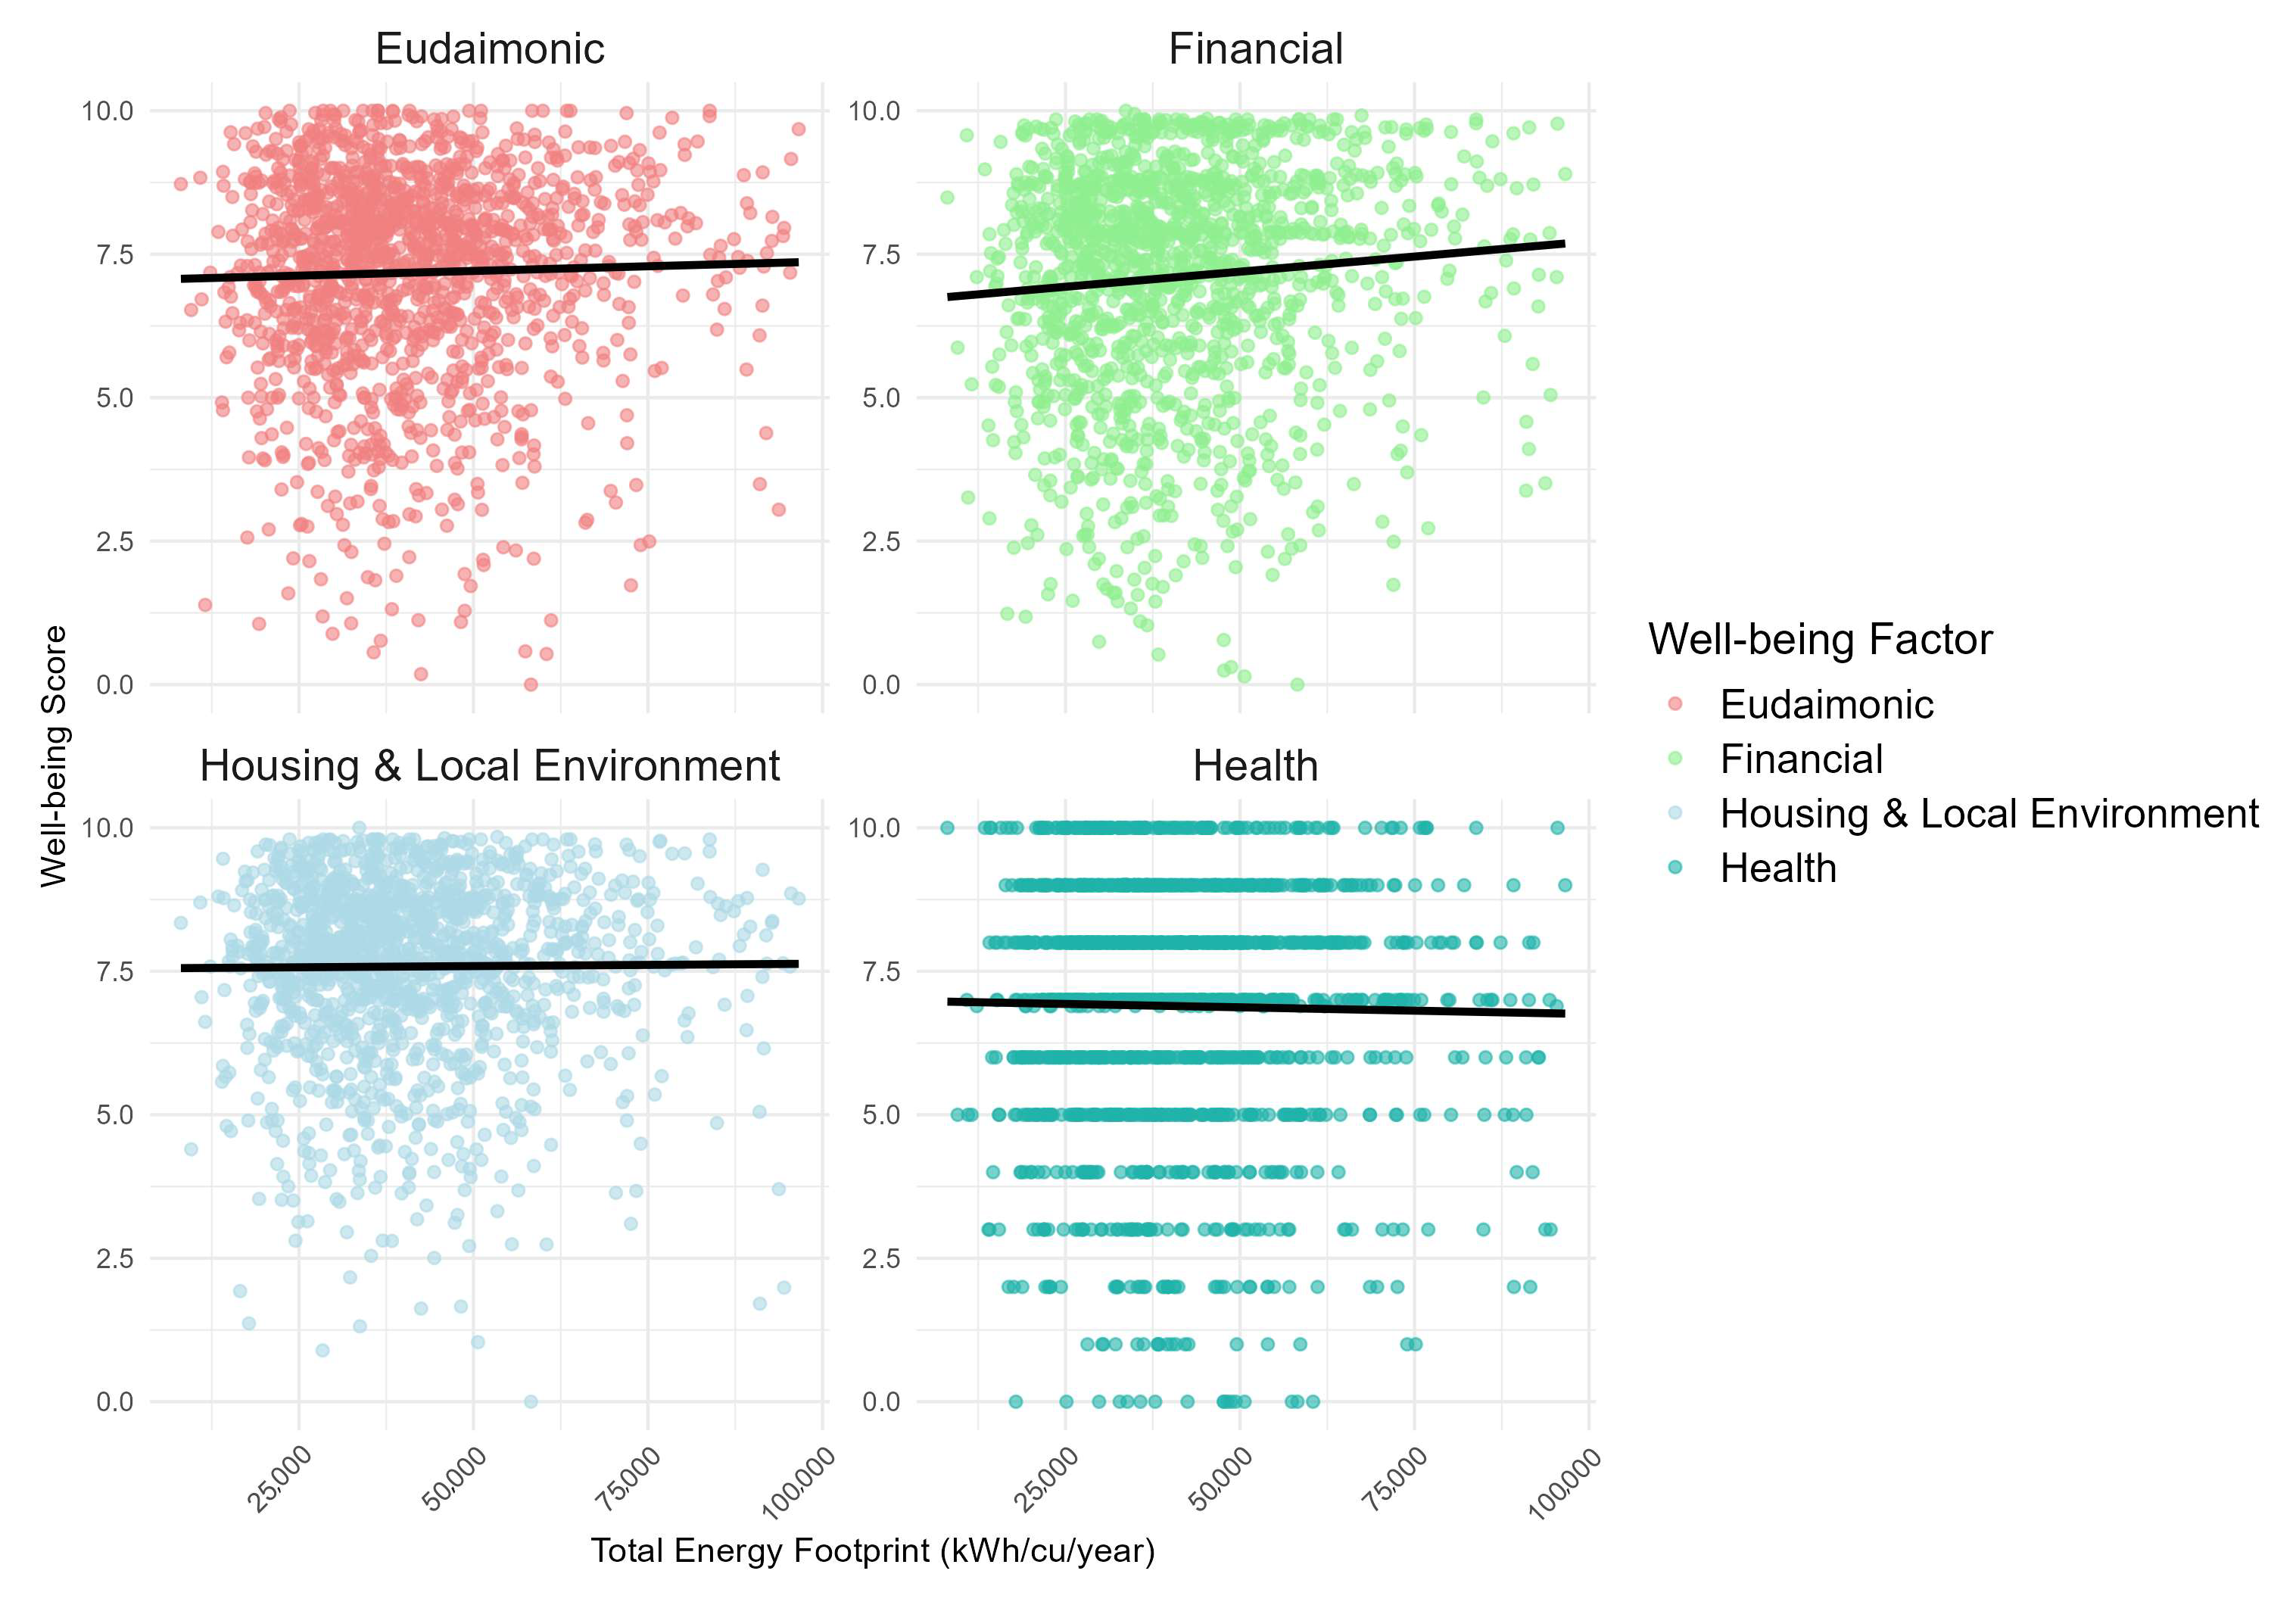
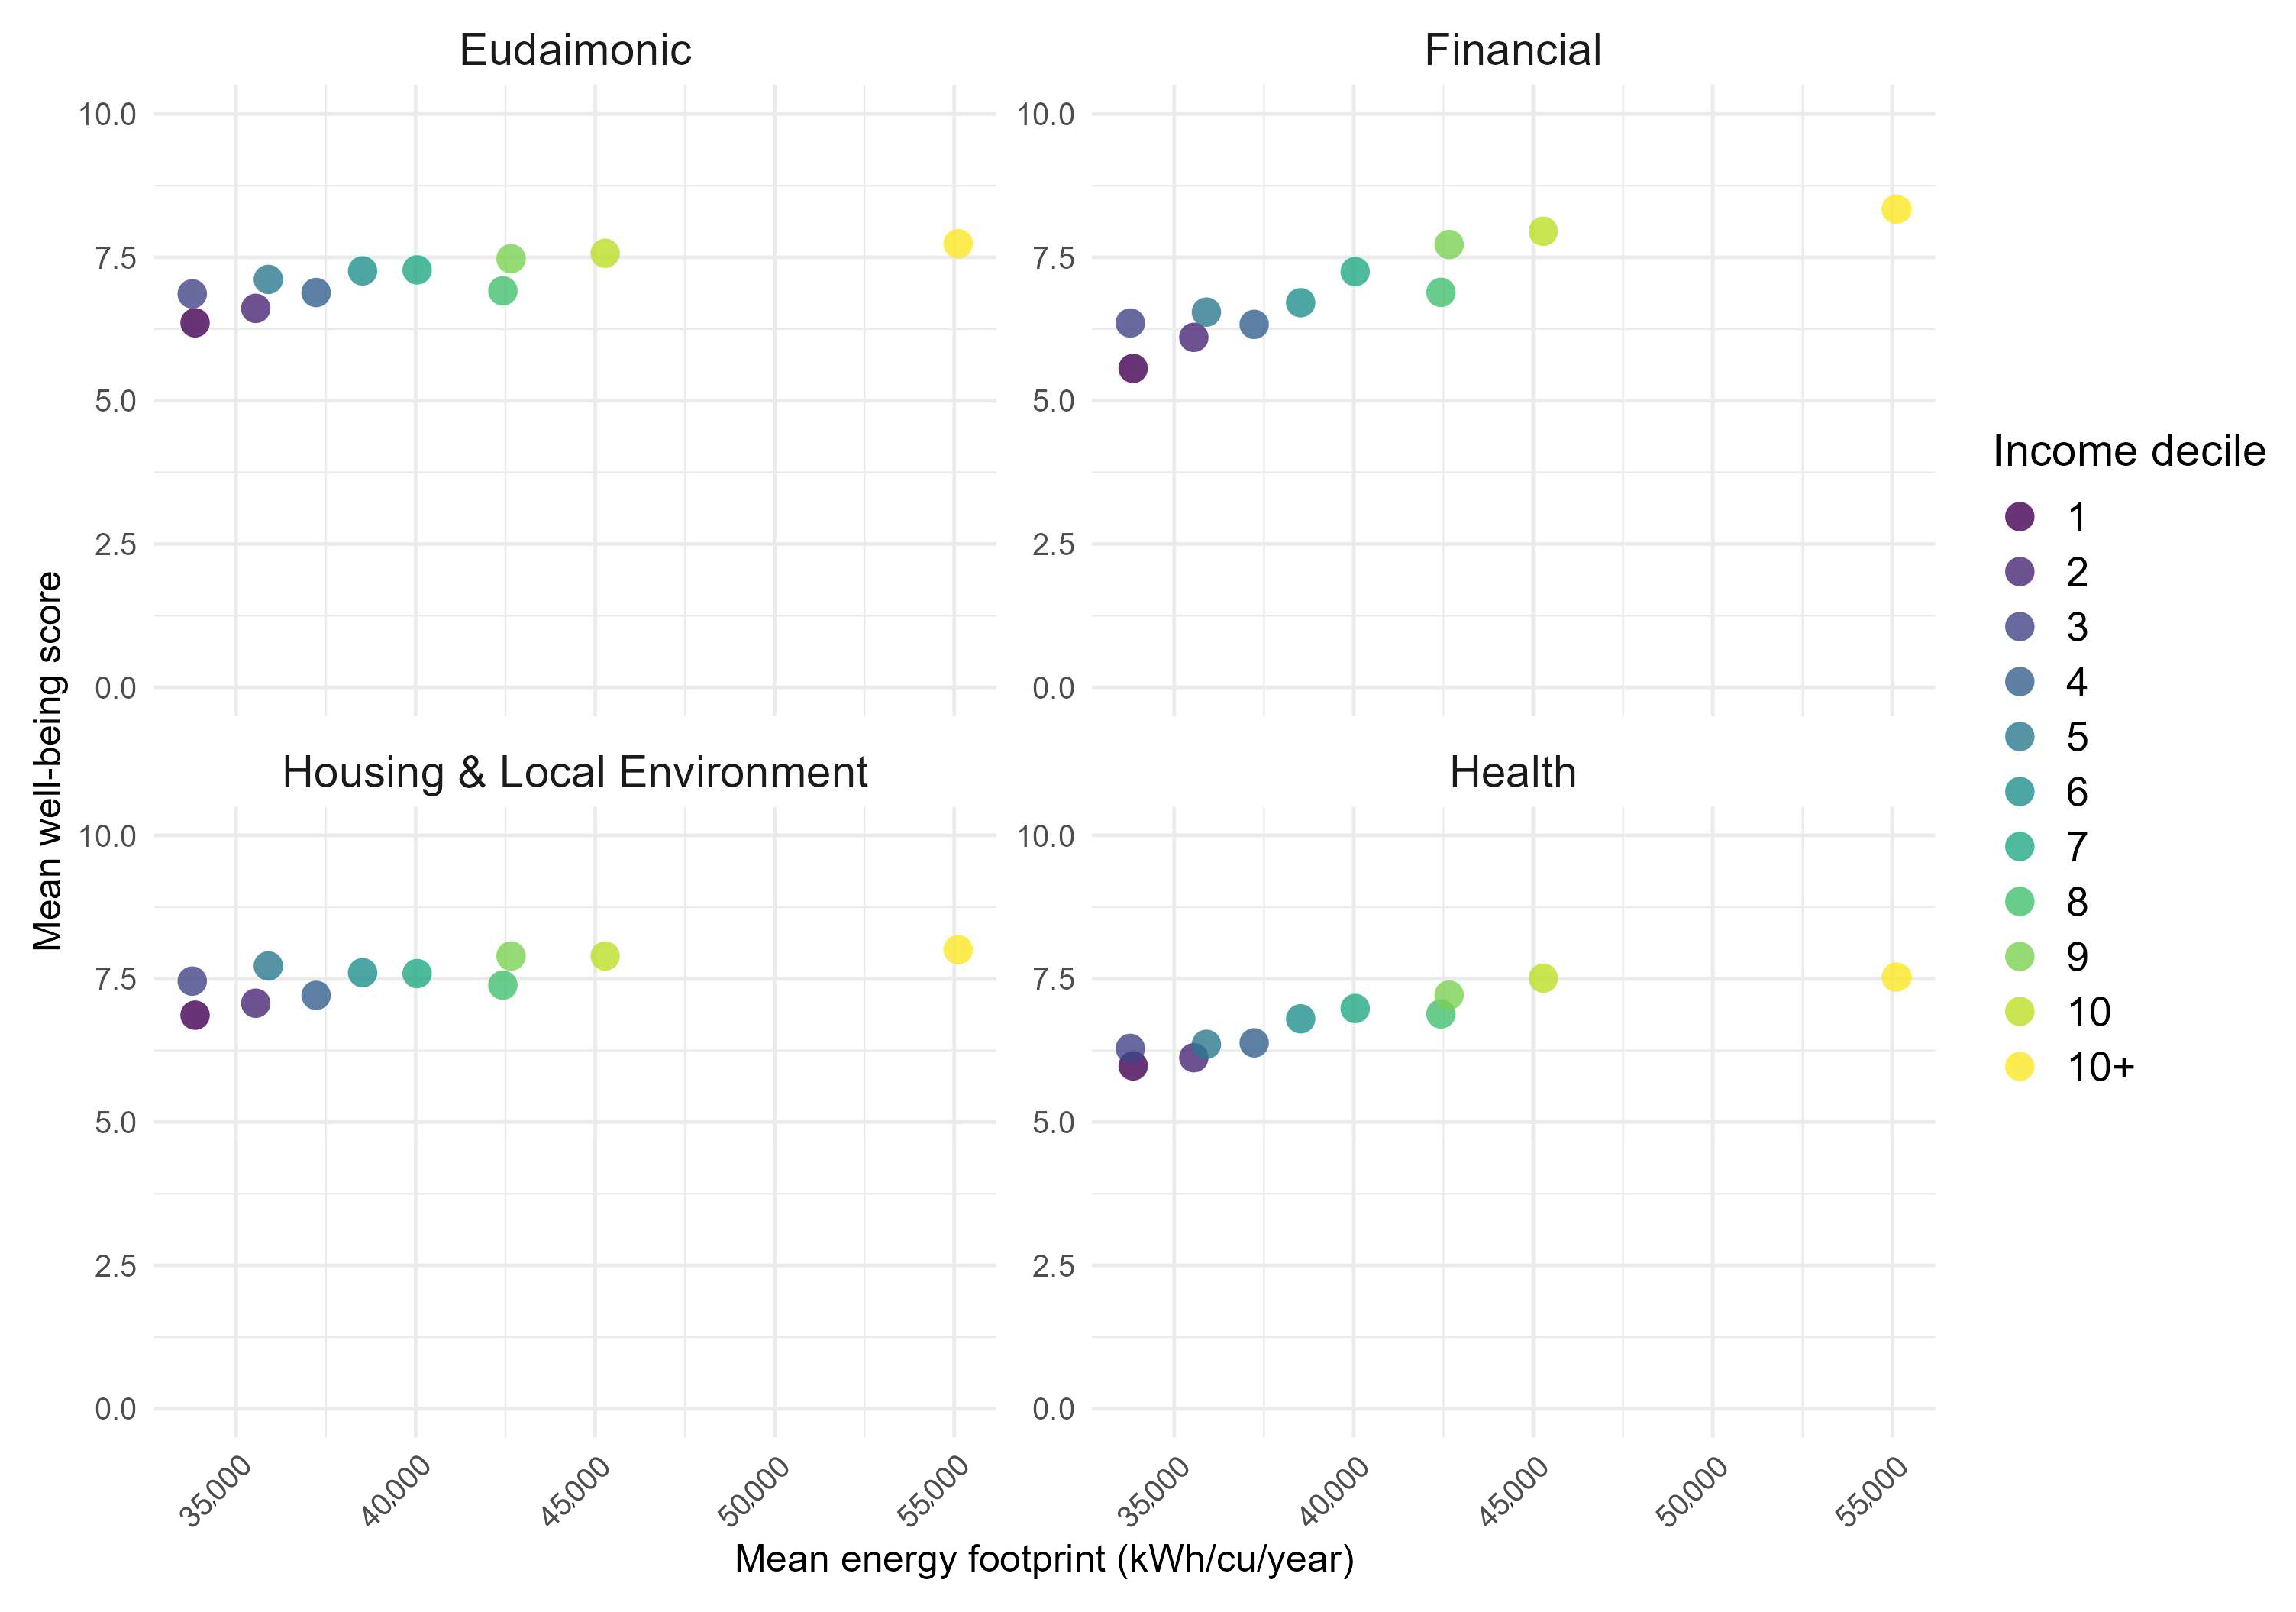
3.1. Energy Footprints and Well-Being Results

The first stage of our analysis was mapping individual energy footprints with the well-being scores for each factor, as shown in Figure 1. It can be seen for all categories that significant variance existed individually, but across the population, Financial well-being saw the strongest positive correlation between individual energy footprints and well-being, followed by Eudaimonic well-being. Housing and Local Environment had a positive trend as well, though it was nearly flat, indicating a weak relationship between the two variables. Interestingly, we saw a slightly negative Health well-being score with increased energy consumption across the study sample.
When taking the average of these footprints and well-being scores by income deciles, as shown in Figure 2, we can also see similar trends, where the importance of income in energy footprints is also seen. In the figure, the 10th income decile is divided into two to better capture the most affluent who have significantly higher footprints than those in the lower end of the 10th decile. Perhaps expectedly, financial well-being had the strongest positive relationship with energy footprints. Interestingly, well-being with one’s Housing and Local Environment, Health well-being, and Eudemonic well-being related to fulfillment and purpose were less connected to income or energy consumption, though the first and the second income deciles consistently connect with the lowest perceived well-being.

3.2. Energy Footprints and Well-Being Multiple Linear Regression Results

The multiple linear regression analysis assessed the relationship between household energy footprints and well-being across four well-being dimensions: Eudaimonic, Financial, Housing and Local Environment, and Health well-being. In this analysis, well-being was the dependent variable and energy use was the independent variable, with the goal being to see which factors, and whether energy use, isolated from other factors, leads to a significant increase or decrease in well-being.
Table 4 presents the estimated coefficients for the predictor variables included in the models. Across all models, income level consistently emerged as a significant positive predictor of well-being, particularly and unsurprisingly for Financial well-being. Interestingly, energy consumption itself was negatively associated with Housing and Local Environment and Health well-being, although the effects were small and only statistically significant in these two domains. This suggests that higher energy consumption does not necessarily translate to improved well-being and may even relate to marginally lower satisfaction in the Housing and Local Environment and Health well-being domains. Household composition additionally played a notable role, with multi-adult and family households (especially couples with children) reporting higher well-being across several of the well-being factors, potentially due to shared resources or social support structures. Gender and education also showed consistent patterns: women reported higher Eudaimonic and Housing and Local Environment well-being, while individuals with higher education levels tended to score better across most well-being dimensions, especially Eudaimonic and Health well-being. An interesting nuance is that living in housing other than an apartment showed improved Financial well-being even when controlling for income, which implies some kind of a status value given for row and detached houses.
The relatively low adjusted R2 values (ranging from 0.0865 to 0.2077) indicate that while the included socio-demographic variables explain some variation in well-being scores, a substantial proportion remains unexplained—highlighting the complexity of well-being and its nuanced relationship with energy use.

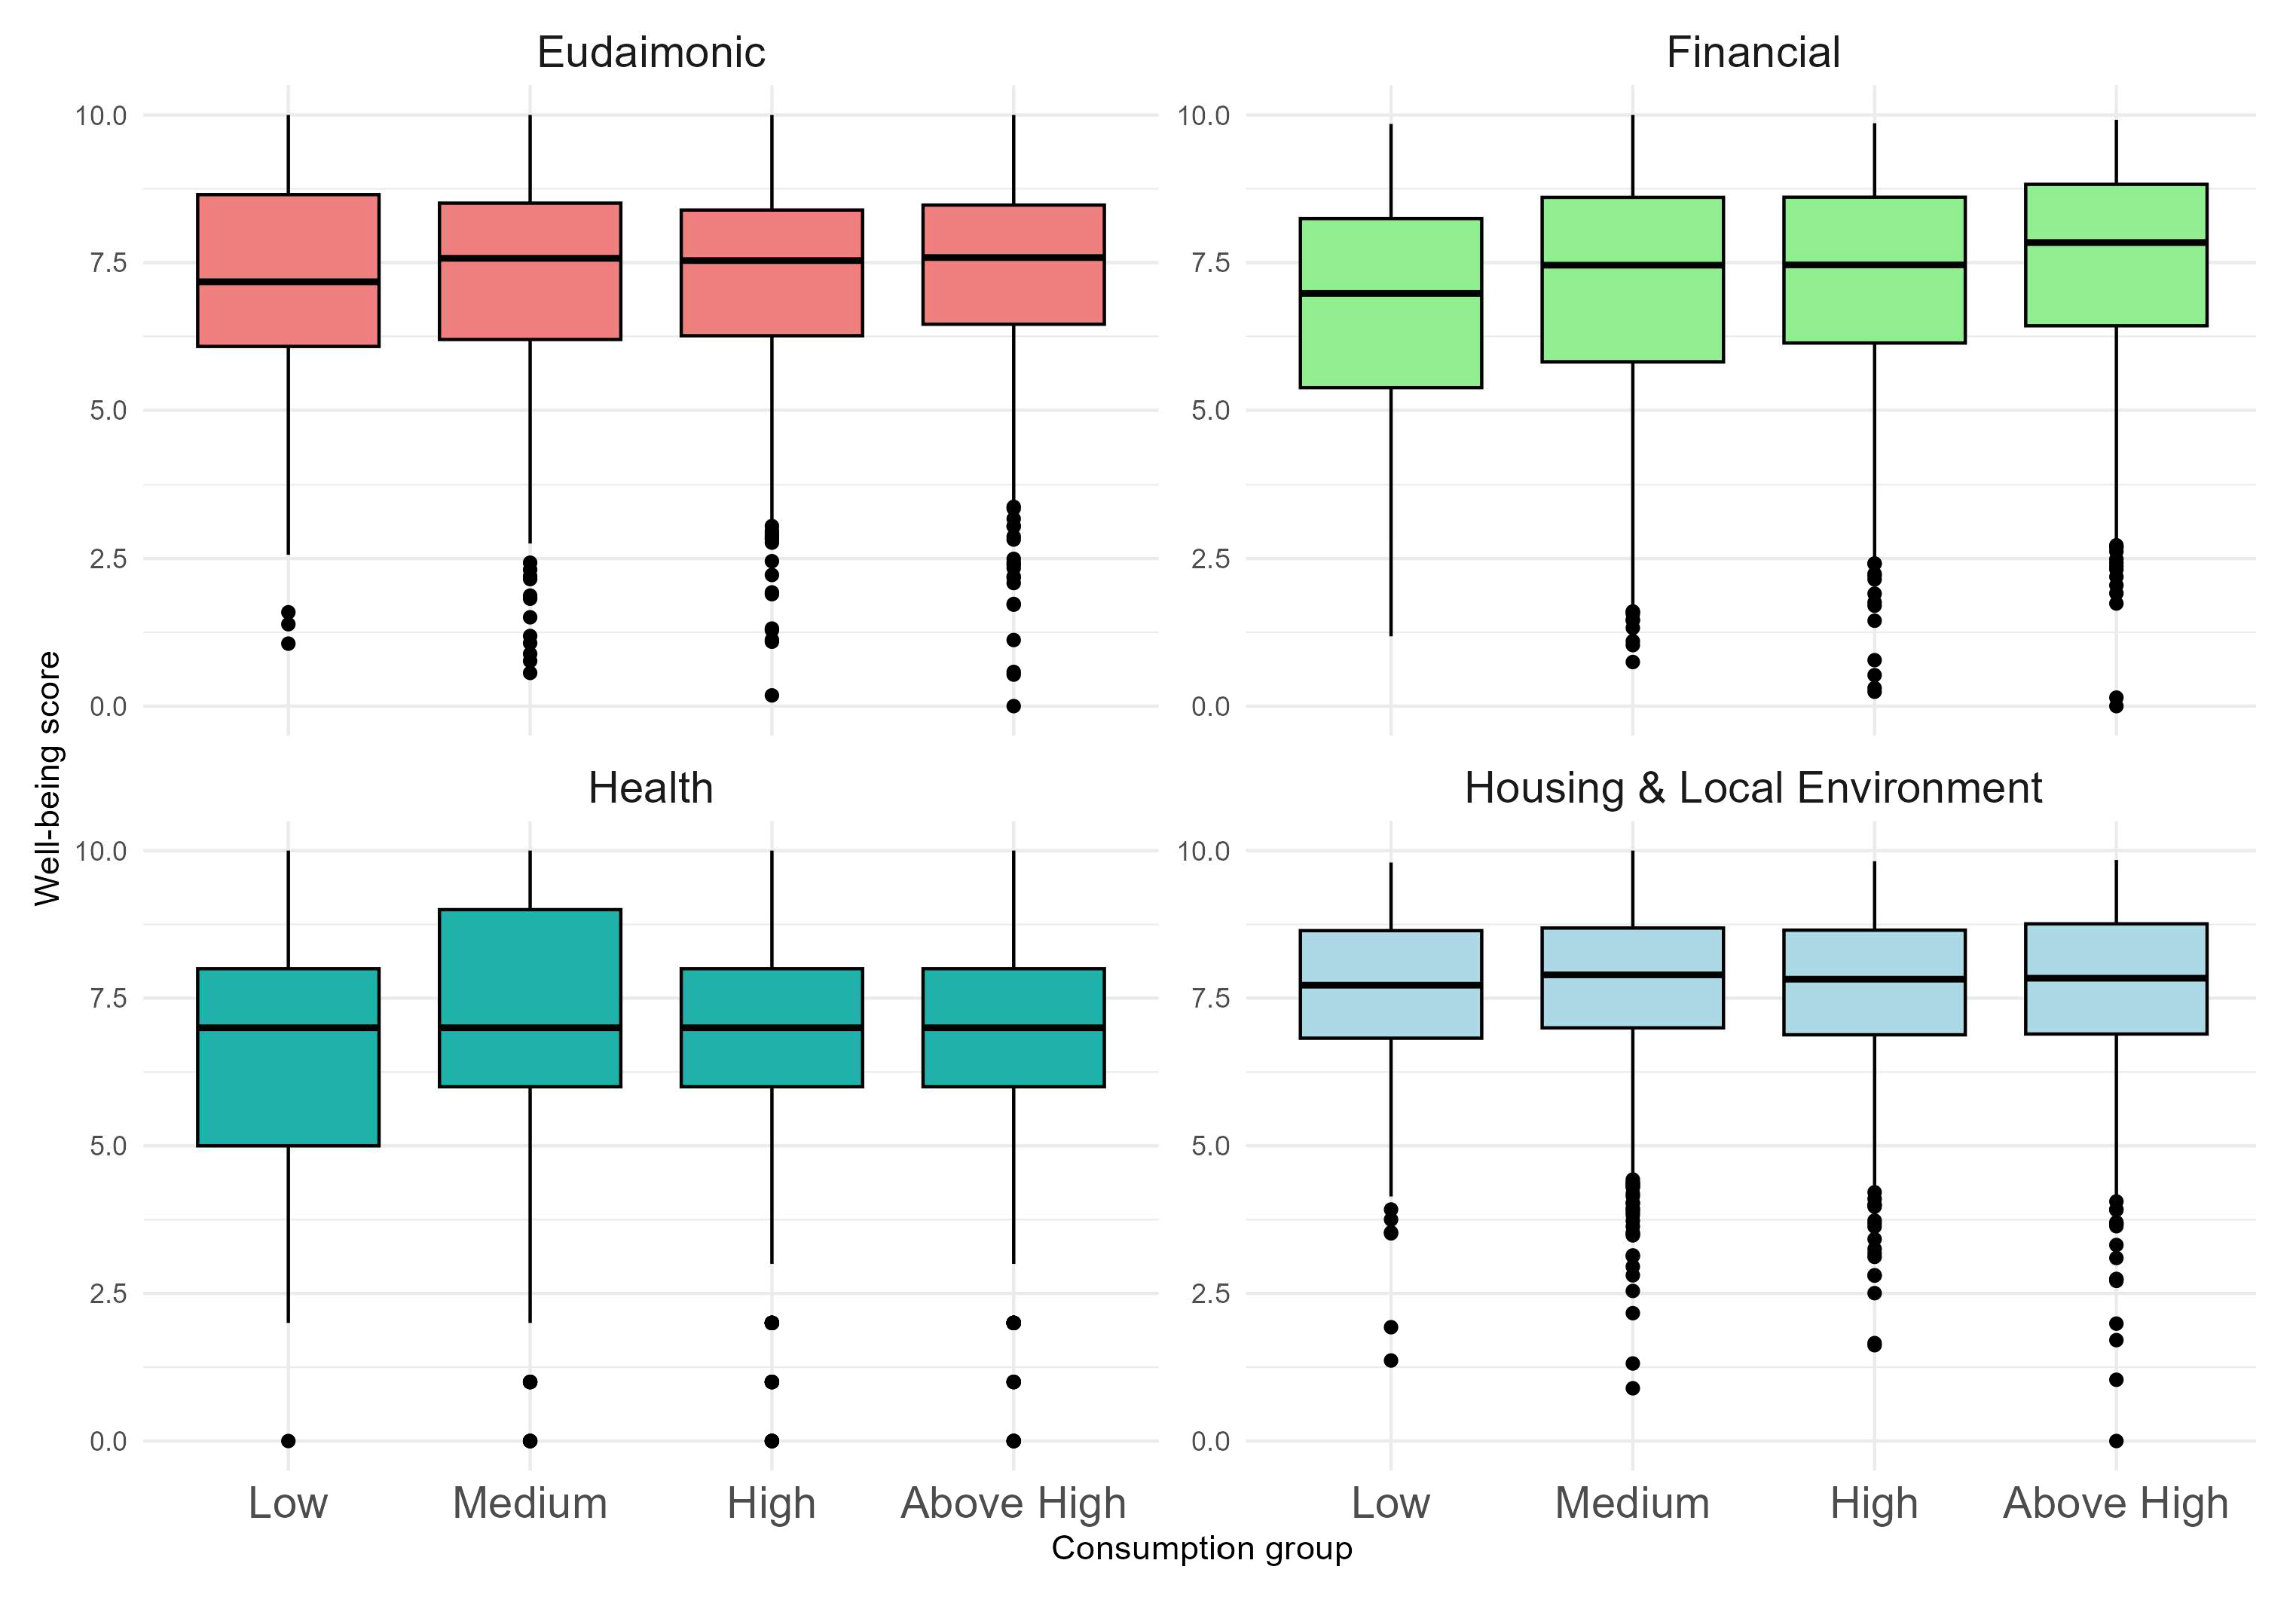
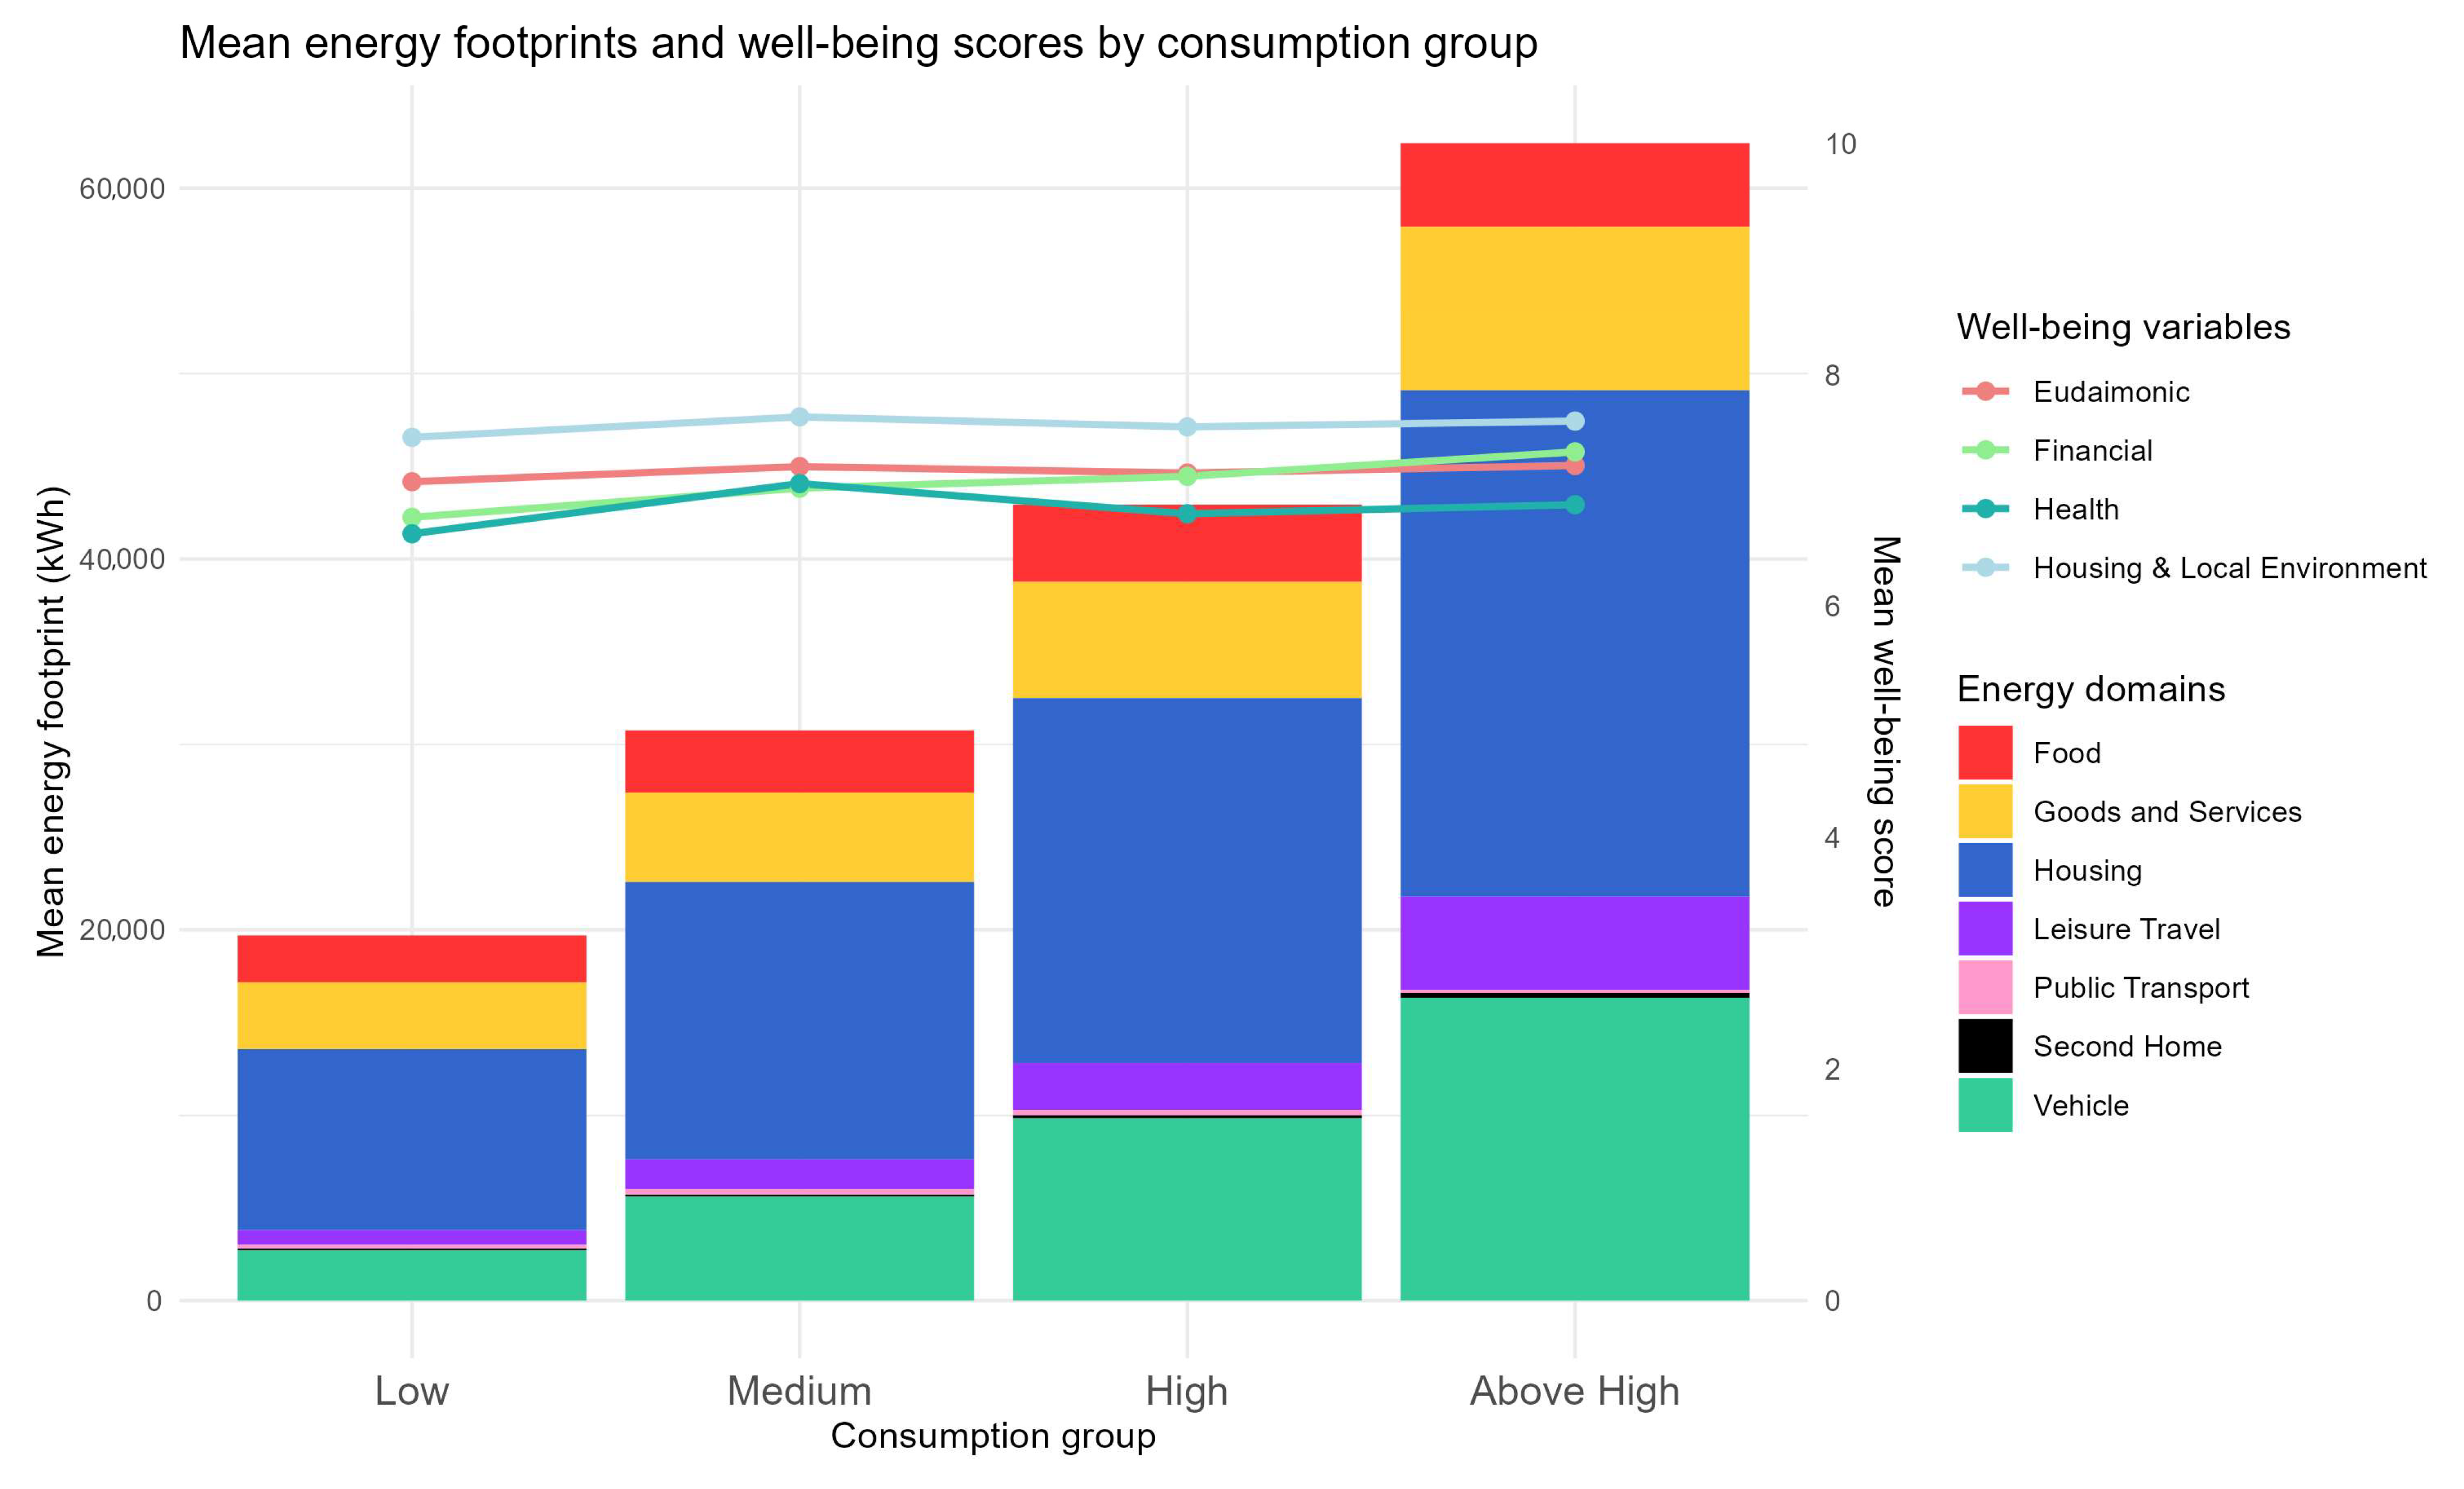
3.3. Energy Footprints, Well-Being, and Sufficiency

In the final stage of this work’s analysis, our population sample was divided into four groups (low, medium, high, and above high consumption) related to their energy consumption levels. These groups were used to assess well-being outcomes related to these various consumption levels and differences in their respective lifestyles. In this assessment, our low consumption group was the only group living within or close to the energy sufficiency limits we defined in Section 2.4 based on Jackson et al.’s [66] suggestion of 79 GJ/a.
Figure 3 first displays the box-and-whisker plot results between well-being and consumption group results. The results have relatively similar outcomes to those seen in Figure 1 and Figure 2, where financial well-being seemed to be most correlated with increased consumption (or perhaps rather that consumption is most correlated with increased income). The means of all other well-being factors appear to be less affected by which consumption groups they belong to, with some minor variations. For example, in the Eudaimonic well-being category, the low consumption group’s mean score is lower than that of the other groups, and the high group’s quartiles see less variation. In the Health well-being category, it can additionally be seen that the bottom quartile experienced a much larger extension into the lower well-being scores than the other groups.
Decomposing the energy footprints by domain for each consumption group allowed for further investigation into what could potentially act as a driver for these fluctuations (though small outside the financial well-being category). Figure 4 displays the results of this analysis, where across groups, each consumption domain rises relatively proportionately, though a couple interesting findings do stand out.
First, between the low and medium consumption groups, which saw a rise in Eudaimonic well-being when moving from low to medium, we see that while energy footprints related to Food and Good and Services only saw a small increase, Vehicle and Housing energy consumption rose significantly. This could point to the Eudaimonic benefits people may see in terms of having sufficient income and capabilities to have comfortable housing and sufficient transportation to feel more integrated with society, which has been previously identified for the lowest income groups in Iceland [36]. Another interesting result is the significant rise in leisure travel energy use between the High and Above High groups. This reflects the findings seen in other bottom-up energy footprinting studies [67].
Finally, Table 5 displays the binomial regression results in which the sufficiency group (Low) was compared to the rest of the sample. The model estimates the odds of a respondent being in the sufficiency group relative to all consumption groups. Several variables emerged as significant predictors. Individuals in the medium- and high-income groups were 55% and 73% less likely, respectively, to be in the sufficiency group, highlighting the role of income in energy consumption. Likewise, living in semi-detached or detached housing was associated with 51% and 75% lower odds of being in the low group, reflecting the influence of housing in lifestyle energy consumption. Older respondents, particularly those in late middle age and late adulthood, were both 65% less likely to fall into the low sufficiency group, suggesting a link between age, accumulated resources, and consumption. Interestingly, individuals in multi-adult households and couples with children had more than triple and nearly triple the odds, respectively, of being in the low sufficiency group, potentially pointing to the sharing benefits, more aptly captured using our consumption unit approach.

4. Discussion

This work sought to understand how consumption-based energy footprints relate to respondents’ perceived well-being in an Icelandic context. The goal was further to find out if lifestyles that could be considered “energy sufficient” can be identified, and what influence lower energy consumption may have on well-being. First the work connected consumption-based energy footprints of ~1500 residents of Iceland to their self-reported well-being responses derived from the same survey with the data for the energy footprint calculations. These well-being responses were factored using factor analysis, where four well-being factors formed from this process, which we categorized according to the question-related loading values as Eudaimonic, Financial, Housing and Local Environment, and Personal well-being.
We found that Financial well-being had the strongest positive correlation with energy footprints (and income), and thus would be the well-being factor most impacted by reduced consumption if the footprints of those on higher footprint levels were to be brought down to meet energy sufficiency, while Eudaimonic, Housing and Local Environment, and Health well-being had weaker correlation strengths, implying a comparatively smaller impact to well-being associated with lower energy consumption. The regression results somewhat reflected these results, where Financial well-being had by far the strongest relationship to income, but where all well-being factors were most influenced by income. Lastly, when connecting our results to literature-based sufficiency thresholds and defining consumption groups to investigate lifestyles, we found that similarly, except for Financial well-being, the other three well-being categories saw similar mean well-being scores across consumption groups with no or very little benefit resulting from additional energy use.
Below, we discuss the implications of these results. First, we place our findings in the context of the energy footprint and sufficiency literature. Second, we discuss the limitations of the study and future research. We conclude by discussing some final implications and takeaways of the study.

4.1. Energy Footprints and Well-Being

Einarsdóttir et al. [33] have previously calculated the consumption-based energy footprints for Icelandic consumers, recognizing that they are higher but more equally distributed than in other countries where energy footprints have been calculated, which aligns with Iceland’s economic position as a high-income, low Gini-index country.
In terms of well-being, as a carbon footprint calculator based in the Nordics, with multiple questions surrounding subjective well-being grouped into our four well-being factors, it is difficult to compare the subjective well-being scores from these factors to other studies, which are unlikely to have followed a similar approach. Therefore, just a short remark that, globally, in happiness scores such as the World Happiness Report, Iceland (along with the Nordic countries) typically ranks in the top five of those happiness indices [68], which also might relate to the low inequality and very equally high perceived well-being as shown in this paper.
In the well-being factors approach taken, it was interesting to see that the factors generated by the factor analysis aligned well with various conceptions of well-being found in the literature, such as Eudaimonic and Financial well-being. We additionally saw that financial well-being was most related to energy footprints, and this was most aligned with income. This is logical, where in our study, as in many others, higher incomes are related to increased consumption and footprints, and it would make sense that financial well-being would rise with increased income.
However, perhaps one of the most important findings of this study was that with the exception of financial well-being, all the other well-being categories (Health, Eudaimonic, Housing and Local Environment) were relatively unaffected by the degree of energy consumption. These results align well with international studies of the relationship between energy consumption and both subjective (e.g., [69,70]) and objective (e.g., [10,66]) well-being indicators at the high average level of Icelandic energy consumption across all sufficiency groups. The typical depiction of energy consumption and well-being chart in international studies typically see a logarithmic dampening curve in which well-being begins to level off after a certain level of consumption (dependent on the well-being indicator being studied), where, for example, Jackson et al. [66] found that after an approximately 10–75 GJ/year (2777–20,833 kWh/year) of primary annual energy consumption, the marginal benefits of increased energy consumption on well-being begins to level off. It was even seen that the unaggregated Health well-being score had a slightly negative correlation with energy use, which is not implausible for a highly modernized society where health and energy consumption are more likely to disassociate or even decrease (e.g., less walking/more driving leading to reduced health benefits).
The above values are all below the low threshold, which we also showed to align with the sufficiency threshold of 79 GJ/year. While we only had 12% of our sample falling into the low group within or close to the sufficiency threshold, which is in line with the previous findings of our well-being categories outside of financial well-being appearing to be relatively stable across all the groups from Low to Above High. This is an important result because it implies that there is a potential to live with reduced consumption while maintaining well-being [71]. Table 5 displays the results from our study predicting the probability of which factors would make belonging to the sufficiency group more probable, where we found that individuals with lower income, younger age, green party political affiliation, and couples with children or multi-adult household apartment living were more likely to be in the low (sufficient living) consumption group. However, while lower-income individuals were more likely to be in the low group compared to the rest of the sample, about half of the group had medium or high incomes. This suggests that energy sufficiency is not just an outcome of financial constraints. It also reflects differences in lifestyle choices and, potentially, values. For example, green party supporters were more likely to be in the Low consumption group but did not report lower well-being (political orientation is not significant in well-being regression)—possibly reflecting a value-driven, less consumerist lifestyle. When discussing the potential for encouraging consumption reduction, an important aspect related to this is that we cannot know if downscaling to reduce one’s footprint below the sufficiency threshold would have a different well-being effect than reporting one’s perceived well-being at any current level of consumption and the related footprint. We return to this in the next section.

4.2. Limitations and Future Research

While this work provides interesting insights into the relationship between consumption-based energy footprints and well-being in Iceland, several limitations must be acknowledged. First, while our regression models account for key socio-demographic variables, regressions in a study such as this are requisitely constrained by potential unobserved factors that may influence both energy consumption and well-being [69]. Second, while the analysis accounted for housing-related energy consumption based on housing size and type, both strong determinants of energy demand, it did not include data on the energy efficiency of individual dwellings due to the lack of available data. This limits the ability to fully distinguish between higher energy use from housing driven by structural inefficiency (e.g., poorly insulated homes) or lifestyle choices. Additionally, because housing energy accounts for a substantial share of the total household energy use, not including data on dwelling energy efficiency could have influenced how households were classified into consumption groups. A third limitation relates to the potential generalizability of our findings beyond the Icelandic context. Iceland is an interesting context and thus results should be interpreted with caution. Iceland has nearly universal access to low-cost renewable energy, low-income inequality, and cold climate, all of which shape the relationship between energy use and well-being. In this context, it could be considered (and is culturally) relatable to other Nordic countries. While these characteristics offer a useful test case for energy sufficiency in a high-income, low inequality setting, they may not fully translate to countries with different infrastructure, economic structures, or cultural perceptions of energy sufficiency. For example, the amount of housing heating energy required in Iceland, which is required essentially year-round, is likely to differ significantly from warmer locations. Additionally, the sprawled infrastructure with weak public transit also likely encourages increased private vehicle usage as compared to other potential study areas but could be considered at similar levels of US or other North American transport contexts [36,44]. As a final limitation associated with the Icelandic context, because of our focus on well-being and personal discussion, in our work we have not emphasized the large influence of the commercial sectors on the Icelandic energy system, where a disproportionate amount of energy used in Iceland is for heavy industries such as the aluminum sector. Thus, our discussion should be interpreted with a recognition of our focus on personal lifestyles. This leads well into areas of future research, where applying a similar study to countries with varying economic and energy conditions would enhance generalizability. For example, an interesting case study would be one with a population that straddles both sides of the energy consumption/well-being dampening curve, where the influence of significantly reduced consumption would show more prominently than in Iceland. Lastly, with the identification in our study of relatively stable well-being across consumption groups, an important area of future research could include policy and stakeholder engagement studies that investigate how to promote more energy-sufficient lifestyles without reducing well-being (such as through the generation of feelings of loss aversion [72,73]). Moreover, studies focusing on those having willingly or unwillingly downscaled their consumption would be valuable to understand if such downscaling leads to well-being effects of its own, such that might, for example, change the almost zero marginal effect observed in this study. Another potential issue for further research could be if the correlation between well-being and income at the low end of the income range is more a result of comparison to those around one, or of life actually becoming better when moving away from the lowest income groups.

4.3. Discussion of Implications

If we consider Iceland’s high income per capita and low-income inequality, it implies a high likelihood that most of the population has the means to meet their basic needs. Thus, if one were to imagine the Icelandic population’s position in works such as Vogel et al. [10], it can be understood that the population occupies a rather short range on the flat part of the energy consumption/well-being dampening curve. This stands in contrast to developing countries or highly unequal countries where a population’s position along the curve may extend to the area where a larger well-being drop off could be observed. This also implies, however, that a reduction in energy consumption across the Medium, High, and Above High consumption groups would be unlikely to significantly impact well-being. This result reflects concepts such as livability theory and the happiness–energy paradox [69], where beyond the satisfaction of basic needs, subjective well-being (and in our study except for financial well-being) decouples from energy use.
These findings suggest that energy consumption in Iceland could be reduced without significantly impacting the well-being factors considered in our study. The trick is encouraging these lifestyle or systemic changes without surfacing feelings of loss aversion [72,73], where it is not so straightforward to assume that moving backwards on the energy consumption/well-being curve (reducing consumption) would follow the same path as moving forward (increasing consumption).
This then moves the conversation from our quantitative analysis to the realm of policy and social efforts to tackle overconsumption to understand how and where sufficiency could be promoted successfully, without inducing loss aversion and potential social pushback.
This is where diving into the consumption domains per consumption group, such as in Figure 4, becomes interesting because these can perhaps hint towards where policy or sufficiency educational efforts could be made to aid in reducing energy footprints across groups. For example, while across sufficiency groups the changes in energy footprints associated with diets were relatively small (~1–3× across groups), very different results can be seen for leisure travel (~1–9×) or vehicle use (1–6×) across groups. This perhaps indicates how efforts to reduce excessive flying, for example, with frequent flyer levies [74] or taxes on excessive vehicle ownership/use could reduce inequality in consumption without necessarily reducing well-being [75].
Lastly, when it comes to housing energy use, efforts to reduce consumption can take the form of either behavioral changes or investments in more energy-efficient buildings and appliances. However, the motivation to pursue either approach is generally low due to the lack of financial incentives in the market. With low energy prices, the potential for noticeable cost savings is limited, reducing the appeal of such efforts.
In terms of behavioral changes, more conscious energy use such as maintaining indoor temperatures at reasonable levels, avoiding unnecessary energy loss by not leaving windows and doors open for extended periods, turning off lights, using public swimming pools instead of private hot tubs, and taking shorter showers, could lead to meaningful reductions in energy use across households. These habits are particularly relevant in Iceland, where energy behavior is often inefficient due to the widespread perception that energy is cheap, abundant, and clean.
On the investment side, improving the energy efficiency of buildings, for example, by reducing heat consumption and using electricity-saving appliances, holds significant potential to lower overall energy use. However, these measures are often deterred by high upfront costs and the limited financial return under current Icelandic energy prices. Examples of effective energy efficiency upgrades include enhanced wall and roof insulation, triple-glazed windows, and energy-efficient ventilation or air conditioning systems. These solutions typically require greater investment than standard construction practices in the Icelandic housing market and are unlikely to yield sufficient savings in energy costs to justify the added expense. Therefore, to encourage such improvements, either stronger incentives or stricter building code requirements would be needed.
Additionally, for the high consuming groups, Iceland could consider both minimum and maximum sufficiency thresholds related to housing, and work through policy and building regulations to reduce the number of houses of excessive size which require more space heating while ensuring all households have a comfortable minimum space [18,76].
The Icelandic government has set out a long-term Energy Policy to 2050 [77], which identifies increased energy efficiency across the entire energy value chain, from production to end-use, as one of its key focus areas. However, to date, no concrete targets or policy instruments have been introduced to incentivize improvements on the demand side, particularly in residential energy use.
Although Iceland is an EEA member and closely aligned with the EU internal market, it is currently exempt from the two primary legislative instruments designed to improve energy efficiency across Europe: the Energy Performance of Buildings Directive (EPBD) [78] and the Energy Efficiency Directive (EED) [79]. These directives provide binding requirements for building energy performance standards, renovation strategies, consumer-targeted energy education platforms and access to energy consumption data, and national energy savings obligations. While Iceland’s unique situation, being nearly 100% renewable in both electricity and heating supply primarily due to extensive geothermal resources, may reduce the urgency from an emissions perspective, the potential for improved efficiency remains substantial. Tailoring the implementation of these directives to fit Iceland’s context could support meaningful reductions in total energy consumption and energy footprints of households.
In conclusion, this work found that energy and well-being were relatively decoupled in Iceland across the footprint distribution. As a wealthy and relatively equal country with high footprints well above the global average even by the lowest consumption group, this implies two things. First, Iceland would benefit by improving the energy efficiency of essential services such as heating (potentially by educating the population to be more sufficiency conscious) or transport (by reducing the car dependency that exists in Iceland). Second, efforts could be made to move the High and Above High consumption groups (53% of the population studied) to lower consumption lifestyles. Neither of these are potentially easy pathways as the first could potentially require significant infrastructural investments and changed behavior while the second would require a significant political effort to change the lifestyles of those most well-off in society, which requires a willingness to change as well as the ability to overcome power relations associated with this wealth.
Lastly, we want to mention that we do not intend these results or discussion to be prescriptive nor suggest that Icelanders should not have the right to use their natural resources to ensure a comfortable life in a challenging geographic climate. Rather its goal was to add to the growing global literature suggesting the need to improve the environmental efficiency of human well-being, told through an Icelandic case study, which will increasingly be needed if humanity is to achieve a “good life” for all within the planetary boundaries.

Author Contributions

Conceptualization, K.J.D., A.K.E. and J.H.; methodology, K.J.D., A.K.E., and J.H.; validation, K.J.D., A.K.E., M.R.K. and J.H.; formal analysis, A.K.E.; data curation, A.K.E.; writing—original draft preparation, K.J.D.; writing—review and editing, K.J.D., A.K.E., M.R.K. and J.H.; visualization, A.K.E.; supervision, J.H. and M.R.K.; project administration, J.H.; funding acquisition, K.J.D., A.K.E. and J.H. All authors have read and agreed to the published version of the manuscript.

Funding

This research was funded by the Reykjavík Energy Research Fund (VOR) and the Landsvirkjun Energy Research Fund.

Data Availability Statement

The data presented in this study are available on request from the corresponding author. The data are not publicly available due to privacy issues.

Conflicts of Interest

The authors declare no conflict of interest. The funders had no role in the study beyond providing funding.

References

  1. Rao, N.D.; Min, J.; Mastrucci, A. Energy Requirements for Decent Living in India, Brazil and South Africa. Nat. Energy 2019, 4, 1025–1032. [Google Scholar] [CrossRef]
  2. Steffen, W.; Broadgate, W.; Deutsch, L.; Gaffney, O.; Ludwig, C. The Trajectory of the Anthropocene: The Great Acceleration. Anthr. Rev. 2015, 2, 81–98. [Google Scholar] [CrossRef]
  3. Richardson, K.; Steffen, W.; Lucht, W.; Bendtsen, J.; Cornell, S.E.; Donges, J.F.; Drüke, M.; Fetzer, I.; Bala, G.; von Bloh, W.; et al. Earth beyond Six of Nine Planetary Boundaries. Sci. Adv. 2023, 9, eadh2458. [Google Scholar] [CrossRef]
  4. Ritchie, H. Sector by Sector: Where Do Global Greenhouse Gas Emissions Come From? Our World in Data: Oxford, UK, 2020. [Google Scholar]
  5. Oswald, Y.; Owen, A.; Steinberger, J.K. Large Inequality in International and Intranational Energy Footprints between Income Groups and across Consumption Categories. Nat. Energy 2020, 5, 231–239. [Google Scholar] [CrossRef]
  6. Raworth, K. A Safe and Just Space for Humanity: Can We Live Within the Doughnut? Oxfam International: Oxford, UK, 2012; p. 26. [Google Scholar]
  7. Raworth, K. A Doughnut for the Anthropocene: Humanity’s Compass in the 21st Century. Lancet Planet. Health 2017, 1, e48–e49. [Google Scholar] [CrossRef] [PubMed]
  8. O’Neill, D.W.; Fanning, A.L.; Lamb, W.F.; Steinberger, J.K. A Good Life for All within Planetary Boundaries. Nat. Sustain. 2018, 1, 88–95. [Google Scholar] [CrossRef]
  9. Fanning, A.L.; O’Neill, D.W.; Hickel, J.; Roux, N. The Social Shortfall and Ecological Overshoot of Nations. Nat. Sustain. 2022, 5, 26–36. [Google Scholar] [CrossRef]
  10. Vogel, J.; Steinberger, J.K.; O’Neill, D.W.; Lamb, W.F.; Krishnakumar, J. Socio-Economic Conditions for Satisfying Human Needs at Low Energy Use: An International Analysis of Social Provisioning. Glob. Environ. Change 2021, 69, 102287. [Google Scholar] [CrossRef]
  11. Dillman, K.J.; Czepkiewicz, M.; Heinonen, J.; Davíðsdóttir, B. Ecological Intensity of Social Provisioning in Mobility Systems: A Global Analysis. Energy Res. Soc. Sci. 2023, 104, 103242. [Google Scholar] [CrossRef]
  12. Creutzig, F.; Roy, J.; Lamb, W.F.; Azevedo, I.M.L.; de Bruin, W.B.; Dalkmann, H.; Edelenbosch, O.Y.; Geels, F.W.; Grubler, A.; Hepburn, C.; et al. Towards Demand-Side Solutions for Mitigating Climate Change. Nat. Clim. Change 2018, 8, 260–263. [Google Scholar] [CrossRef]
  13. Creutzig, F.; Niamir, L.; Bai, X.; Callaghan, M.; Cullen, J.; Díaz-José, J.; Figueroa, M.; Grubler, A.; Lamb, W.F.; Leip, A. Demand-Side Solutions to Climate Change Mitigation Consistent with High Levels of Well-Being. Nat. Clim. Change 2022, 12, 36–46. [Google Scholar] [CrossRef]
  14. Creutzig, F.; Simoes, S.G.; Leipold, S.; Berrill, P.; Azevedo, I.; Edelenbosch, O.; Fishman, T.; Haberl, H.; Hertwich, E.; Krey, V. Demand-Side Strategies Key for Mitigating Material Impacts of Energy Transitions. Nat. Clim. Change 2024, 14, 561–572. [Google Scholar] [CrossRef]
  15. Li, Q.; Chen, H. The Relationship between Human Well-Being and Carbon Emissions. Sustainability 2021, 13, 547. [Google Scholar] [CrossRef]
  16. Baltruszewicz, M.; Steinberger, J.K.; Paavola, J.; Ivanova, D.; Brand-Correa, L.I.; Owen, A. Social Outcomes of Energy Use in the United Kingdom: Household Energy Footprints and Their Links to Well-Being. Ecol. Econ. 2023, 205, 107686. [Google Scholar] [CrossRef]
  17. tho Pesch, G.; Einarsdóttir, A.K.; Dillman, K.J.; Heinonen, J. Energy Consumption and Human Well-Being: A Systematic Review. Energies 2023, 16, 6494. [Google Scholar] [CrossRef]
  18. Dillman, K.J.; Heinonen, J.; Davíðsdóttir, B. Safe and Just Housing for All–Towards Establishing a Sustainable Consumption Corridor for Housing. Sustain. Prod. Consum. 2024, 51, 79–91. [Google Scholar] [CrossRef]
  19. Lucas, K.; Mattioli, G.; Verlinghieri, E.; Guzman, A. Transport Poverty and Its Adverse Social Consequences; Thomas Telford Ltd.: London, UK, 2016; Volume 169, pp. 353–365. [Google Scholar]
  20. Mattioli, G.; Lucas, K.; Marsden, G. Transport Poverty and Fuel Poverty in the UK: From Analogy to Comparison. Transp. Policy 2017, 59, 93–105. [Google Scholar] [CrossRef]
  21. Merz, J.J.; Barnard, P.; Rees, W.E.; Smith, D.; Maroni, M.; Rhodes, C.J.; Dederer, J.H.; Bajaj, N.; Joy, M.K.; Wiedmann, T. World Scientists’ Warning: The Behavioural Crisis Driving Ecological Overshoot. Sci. Prog. 2023, 106, 00368504231201372. [Google Scholar] [CrossRef]
  22. Jorgenson, A.; Schor, J.; Huang, X. Income Inequality and Carbon Emissions in the United States: A State-Level Analysis, 1997–2012. Ecol. Econ. 2017, 134, 40–48. [Google Scholar] [CrossRef]
  23. Knight, K.W.; Rosa, E.A. The Environmental Efficiency of Well-Being: A Cross-National Analysis. Soc. Sci. Res. 2011, 40, 931–949. [Google Scholar] [CrossRef]
  24. Lamb, W.F.; Steinberger, J.K.; Bows-Larkin, A.; Peters, G.P.; Roberts, J.T.; Wood, F.R. Transitions in Pathways of Human Development and Carbon Emissions. Environ. Res. Lett. 2014, 9, 014011. [Google Scholar] [CrossRef]
  25. Steinberger, J.; Guerin, G.; Hofferberth, E.; Pirgmaier, E. Democratizing Provisioning Systems: A Prerequisite for Living Well within Limits. Sustain. Sci. Pract. Policy 2024, 20, 2401186. [Google Scholar] [CrossRef]
  26. Apergis, N. The Impact of Greenhouse Gas Emissions on Personal Well-Being: Evidence from a Panel of 58 Countries and Aggregate and Regional Country Samples. J. Happiness Stud. 2018, 19, 69–80. [Google Scholar] [CrossRef]
  27. Buhl, J.; Liedtke, C.; Bienge, K. How Much Environment Do Humans Need? Evidence from an Integrated Online User Application Linking Natural Resource Use and Subjective Well-Being in Germany. Resources 2017, 6, 67. [Google Scholar] [CrossRef]
  28. Lenzen, M.; Cummins, R.A. Happiness versus the Environment—A Case Study of Australian Lifestyles. Challenges 2013, 4, 56–74. [Google Scholar] [CrossRef]
  29. Verhofstadt, E.; Van Ootegem, L.; Defloor, B.; Bleys, B. Linking Individuals’ Ecological Footprint to Their Subjective Well-Being. Ecol. Econ. 2016, 127, 80–89. [Google Scholar] [CrossRef]
  30. Ambrey, C.L.; Daniels, P. Happiness and Footprints: Assessing the Relationship between Individual Well-Being and Carbon Footprints. Environ. Dev. Sustain. 2017, 19, 895–920. [Google Scholar] [CrossRef]
  31. Claborn, K.A.; Brooks, J.S. Can We Consume Less and Gain More? Environmental Efficiency of Well-Being at the Individual Level. Ecol. Econ. 2019, 156, 110–120. [Google Scholar] [CrossRef]
  32. Olafsson, S.; Cook, D.; Davidsdottir, B.; Johannsdottir, L. Measuring Countries׳ Environmental Sustainability Performance—A Review and Case Study of Iceland. Renew. Sustain. Energy Rev. 2014, 39, 934–948. [Google Scholar] [CrossRef]
  33. Einarsdóttir, A.K.; tho Pesch, G.; Dillman, K.J.; Karlsdóttir, M.R.; Heinonen, J. Consumption-Based Energy Footprints in Iceland: High and Equally Distributed. Energies 2024, 17, 2375. [Google Scholar] [CrossRef]
  34. Visir Hitaveitur Landsins Komnar Að Þolmörkum. Available online: https://www.visir.is/g/20222340407d/hitaveitur-landsins-komnar-ad-tholmorkum (accessed on 7 July 2025).
  35. Landsvirkjun Pressing Energy Matters. Available online: https://www.landsvirkjun.com/news/pressing-energy-matters (accessed on 7 July 2025).
  36. Dillman, K.J.; Heinonen, J.; Davíðsdóttir, B.; Levänen, J. A Longitudinal Analysis of the Strong Social and Ecological Sustainability of Icelandic Mobility Provisioning. Eur. Transp. Stud. 2025, 2, 100009. [Google Scholar] [CrossRef]
  37. Lylykangas, K.; Lahti, P.; Vainio, T. Ilmastotavoitteita Toteuttava Asemakaavoitus; Aalto University: Aalto, Finland, 2013. [Google Scholar]
  38. Heinonen, J.; Junnila, S. Residential Energy Consumption Patterns and the Overall Housing Energy Requirements of Urban and Rural Households in Finland. Energy Build. 2014, 76, 295–303. [Google Scholar] [CrossRef]
  39. Ecoinvent Association Ecoinvent Database 3.6. Available online: https://www.ecoinvent.org (accessed on 7 July 2025).
  40. Karlsdottir, M.R.; Heinonen, J.; Palsson, H.; Palsson, O.P. Life Cycle Assessment of a Geothermal Combined Heat and Power Plant Based on High Temperature Utilization. Geothermics 2020, 84, 101727. [Google Scholar] [CrossRef]
  41. Cherubini, F.; Bird, N.D.; Cowie, A.; Jungmeier, G.; Schlamadinger, B.; Woess-Gallasch, S. Energy-and Greenhouse Gas-Based LCA of Biofuel and Bioenergy Systems: Key Issues, Ranges and Recommendations. Resour. Conserv. Recycl. 2009, 53, 434–447. [Google Scholar] [CrossRef]
  42. Stadler, K.; Wood, R.; Bulavskaya, T.; Södersten, C.-J.; Simas, M.; Schmidt, S.; Usubiaga, A.; Acosta-Fernández, J.; Kuenen, J.; Bruckner, M.; et al. EXIOBASE 3: Developing a time series of detailed environmentally extended multi-regional input-output tables. J. Ind. Ecol. 2018, 22, 502–515. [Google Scholar] [CrossRef]
  43. Chester, M.V.; Horvath, A. Environmental Assessment of Passenger Transportation Should Include Infrastructure and Supply Chains. Environ. Res. Lett. 2009, 4, 024008. [Google Scholar] [CrossRef]
  44. Dillman, K.; Czepkiewicz, M.; Heinonen, J.; Fazeli, R.; Árnadóttir, Á.; Davíðsdóttir, B.; Shafiei, E. Decarbonization Scenarios for Reykjavik’s Passenger Transport: The Combined Effects of Behavioural Changes and Technological Developments. Sustain. Cities Soc. 2021, 65, 102614. [Google Scholar] [CrossRef]
  45. Åkerman, J. Climate Impact of International Travel by Swedish Residents. J. Transp. Geogr. 2012, 25, 87–93. [Google Scholar] [CrossRef]
  46. Government of UK. Greenhouse Gas Reporting: Conversion Factors 2020; Government of UK: London, UK, 2020.
  47. Ottelin, J.; Heinonen, J.; Junnila, S. New Energy Efficient Housing Has Reduced Carbon Footprints in Outer but Not in Inner Urban Areas. Environ. Sci. Technol. 2015, 49, 9574–9583. [Google Scholar] [CrossRef]
  48. Annas, J. The Morality of Happiness; Oxford University Press: Oxford, UK, 1993; ISBN 0-19-987964-8. [Google Scholar]
  49. Ryan, R.M.; Deci, E.L. On Happiness and Human Potentials: A Review of Research on Hedonic and Eudaimonic Well-Being. Annu. Rev. Psychol. 2001, 52, 141–166. [Google Scholar] [CrossRef]
  50. Diener, E.; Suh, E.M.; Lucas, R.E.; Smith, H.L. Subjective Well-Being: Three Decades of Progress. Psychol. Bull. 1999, 125, 276. [Google Scholar] [CrossRef]
  51. Eurofound. Quality of Life in the EU in 2024: Results from the Living and Working in the EU E-Survey; Publications Office of the European Union: Luxembourg, 2024. [Google Scholar]
  52. OECD. OECD Guidelines on Measuring Subjective Well-Being; OECD Publishing: Paris, France, 2013. [Google Scholar]
  53. Diener, E. Assessing Well-Being: The Collected Works of Ed Diener; Springer Science & Business Media: New York, NY, USA, 2009; Volume 39, ISBN 90-481-2354-2. [Google Scholar]
  54. Henson, R.K.; Roberts, J.K. Use of Exploratory Factor Analysis in Published Research: Common Errors and Some Comment on Improved Practice. Educ. Psychol. Meas. 2006, 66, 393–416. [Google Scholar] [CrossRef]
  55. Dallimer, M.; Irvine, K.N.; Skinner, A.M.; Davies, Z.G.; Rouquette, J.R.; Maltby, L.L.; Warren, P.H.; Armsworth, P.R.; Gaston, K.J. Biodiversity and the Feel-Good Factor: Understanding Associations between Self-Reported Human Well-Being and Species Richness. BioScience 2012, 62, 47–55. [Google Scholar] [CrossRef]
  56. McMahan, E.A.; Estes, D. Hedonic versus Eudaimonic Conceptions of Well-Being: Evidence of Differential Associations with Self-Reported Well-Being. Soc. Indic. Res. 2011, 103, 93–108. [Google Scholar] [CrossRef]
  57. Waterman, A.S. Two Conceptions of Happiness: Contrasts of Personal Expressiveness (Eudaimonia) and Hedonic Enjoyment. J. Pers. Soc. Psychol. 1993, 64, 678. [Google Scholar] [CrossRef]
  58. García-Mata, O.; Zerón-Félix, M. A Review of the Theoretical Foundations of Financial Well-Being. Int. Rev. Econ. 2022, 69, 145–176. [Google Scholar] [CrossRef]
  59. Zemtsov, A.A.; Osipova, T.Y. Financial Wellbeing as a Type of Human Wellbeing: Theoretical Review. Eur. Proc. Soc. Behav. Sci. 2016. Available online: https://www.europeanproceedings.com/files/data/article/37/788/article_37_788_pdf_100.pdf (accessed on 7 July 2025).
  60. Cicognani, E.; Albanesi, C.; Zani, B. The Impact of Residential Context on Adolescents’ Subjective Well Being. J. Community Appl. Soc. Psychol. 2008, 18, 558–575. [Google Scholar] [CrossRef]
  61. Huebner, G.M.; Oreszczyn, T.; Direk, K.; Hamilton, I. The Relationship between the Built Environment and Subjective Wellbeing–Analysis of Cross-Sectional Data from the English Housing Survey. J. Environ. Psychol. 2022, 80, 101763. [Google Scholar] [CrossRef]
  62. Deaton, A. Income, Health, and Well-Being around the World: Evidence from the Gallup World Poll. J. Econ. Perspect. 2008, 22, 53–72. [Google Scholar] [CrossRef]
  63. Kutner, M.H.; Nachtsheim, C.J.; Neter, J.; Li, W. Applied Linear Statistical Models; McGraw-Hill: New York, NY, USA, 2005; ISBN 0-07-238688-6. [Google Scholar]
  64. Spengler, L. Two Types of ‘Enough’: Sufficiency as Minimum and Maximum. Environ. Polit. 2016, 25, 921–940. [Google Scholar] [CrossRef]
  65. Burke, M.J. Energy-Sufficiency for a Just Transition: A Systematic Review. Energies 2020, 13, 2444. [Google Scholar] [CrossRef]
  66. Jackson, R.B.; Ahlström, A.; Hugelius, G.; Wang, C.; Porporato, A.; Ramaswami, A.; Roy, J.; Yin, J. Human Well-being and per Capita Energy Use. Ecosphere 2022, 13, e3978. [Google Scholar] [CrossRef]
  67. Baltruszewicz, M.; Steinberger, J.K.; Ivanova, D.; Brand-Correa, L.I.; Paavola, J.; Owen, A. Household Final Energy Footprints in Nepal, Vietnam and Zambia: Composition, Inequality and Links to Well-Being. Environ. Res. Lett. 2021, 16, 025011. [Google Scholar] [CrossRef]
  68. Helliwell, J.F.; Layard, R.; Sachs, J.D.; De Neve, J.-E.; Aknin, L.B.; Wang, S. (Eds.) World Happiness Report 2024; University of Oxford, Wellbeing Research Centre: Oxford, UK, 2024. [Google Scholar]
  69. Okulicz-Kozaryn, A.; Altman, M. The Happiness-Energy Paradox: Energy Use Is Unrelated to Subjective Well-Being. Appl. Res. Qual. Life 2020, 15, 1055–1067. [Google Scholar] [CrossRef]
  70. Andersson, D.; Nässén, J.; Larsson, J.; Holmberg, J. Greenhouse Gas Emissions and Subjective Well-Being: An Analysis of Swedish Households. Ecol. Econ. 2014, 102, 75–82. [Google Scholar] [CrossRef]
  71. Jackson, T. Live Better by Consuming Less?: Is There a “Double Dividend” in Sustainable Consumption? J. Ind. Ecol. 2005, 9, 19–36. [Google Scholar] [CrossRef]
  72. Boyce, C.J.; Wood, A.M.; Banks, J.; Clark, A.E.; Brown, G.D. Money, Well-Being, and Loss Aversion: Does an Income Loss Have a Greater Effect on Well-Being than an Equivalent Income Gain? Psychol. Sci. 2013, 24, 2557–2562. [Google Scholar] [CrossRef]
  73. Boyce, C.J. Understanding Fixed Effects in Human Well-Being. J. Econ. Psychol. 2010, 31, 1–16. [Google Scholar] [CrossRef]
  74. Büchs, M.; Mattioli, G. How Socially Just Are Taxes on Air Travel and ‘Frequent Flyer Levies’? J. Sustain. Tour. 2024, 32, 62–84. [Google Scholar] [CrossRef]
  75. Albrecht, J. The Use of Consumption Taxes to Re-Launch Green Tax Reforms. Int. Rev. Law Econ. 2006, 26, 88–103. [Google Scholar] [CrossRef]
  76. Fuchs, D.; Sahakian, M.; Gumbert, T.; Di Giulio, A.; Maniates, M.; Lorek, S.; Graf, A. Consumption Corridors: Living a Good Life Within Sustainable Limits; Routledge: London, UK, 2021. [Google Scholar]
  77. Ministry of Industries and Innovation. A Sustainable Energy Future: An Energy Policy to the Year 2050; Government of Iceland: Reykjavík, Iceland, 2020. [Google Scholar]
  78. European Parliament; Council of the European Union. Directive (EU) 2018/844 of the European Parliament and of the Council of 30 May 2018 Amending Directive 2010/31/EU on the Energy Performance of Buildings and Directive 2012/27/EU on Energy Efficiency; Official Journal of the European Union, L 156/75; European Parliament & Council of the European Union: Strasbourg, France, 2018.
  79. European Parliament; Council of the European Union. Directive (EU) 2023/1791 of the European Parliament and of the Council of 13 September 2023 on Energy Efficiency and Amending Regulation (EU) 2023/955, and Repealing Directive (EU) 2018/2002; European Parliament & Council of the European Union: Strasbourg, France, 2023.
Figure 1. Well-being score and energy footprint per well-being factor. The black line represents the linear regression of each data set.
Environments 12 00238 g001
Figure 2. Average well-being score and average energy footprint by income group per well-being factor.
Environments 12 00238 g002
Figure 3. Box-and-whisker plot of well-being scores by well-being factor and sufficiency group.
Environments 12 00238 g003
Figure 4. Mean energy footprint by sufficiency group decomposed by consumption domain.
Environments 12 00238 g004
Table 1. A table providing the question, unit of consumption connected to the related question, and data source used to estimate the consumption-based energy footprint calculation.
DomainQuestionUnit of ConsumptionEnergy Intensity Data Source
HousingData on housing type, size, heating mode, and construction decadem2Ecoinvent v3.6 [39];
Karlsdottir et al. [40]; Cherubini et al. [41]
DietData on diet type and food expenditureISKEXIOBASE3 [42]
Goods and ServicesData on expenditure across categoriesISKEXIOBASE3 [42]
Public TransportationWeekly public transport usage in kmPerson-kmChester and Horvath [43]; Straeto; Dillman et al. [44]
VehiclesNumber, type, and usage of vehiclesVehicle-kmChester and Horvath [43], Ecoinvent v3.6 [39]
Leisure TravelLong-distance trips (mode and distance)Person-kmChester and Horvath [43], Åkerman [45], DEFRA [46]
Summer CottagesOwnership of second homesYes/noOttelin et al. [47]
Table 2. Factor analysis results connected to well-being.
Question TopicEudaimonicFinancialHousingHealth
Living-0.77--
Finance-0.99--
Personal0.52---
Society0.57---
Local--0.92-
House--0.51-
Job0.57---
Achievement0.90---
Purpose0.97---
Time0.54---
Engagement0.92---
Health---0.97
Table 3. Energy footprint ranges used for consumption grouping within study.
Consumption GroupEstimated Energy Footprint (kWh/Consumption Unit/Annum)N
Low (sufficiency group)≤23,700162
Medium>23,700 and ≤36,872542
High36,872 and ≤49,241420
Above High>49,241388
Table 4. Multiple linear regression results by socio-demographic variables and well-being factor.
TermEudaimonicFinancialHousing and Local EnvironmentHealth
Total Energy Footprint−0.039−0.045−0.055 *−0.065 *
Political orientation (Reference: Green)
Left−0.075−0.064−0.019−0.079
Center0.018−0.0390.026−0.047
Right0.039−0.0110.026−0.017
Other/No preference
Housing type (Reference: Apartment)
−0.092 *−0.111−0.093−0.109 *
Semi-detached/Row-house−0.0090.0550.0140.031
Detached house
Gender (Reference: Male)
0.0220.1250.0620.030
Female0.124 ***0.046 ***0.089 ***−0.001
Other
Income level (Reference: Low income)
−0.035−0.010−0.032−0.073 **
cu_inc_levelMedium income0.093 **0.168 **0.107 ***0.119 ***
cu_inc_levelHigh income
Education level (Reference: Low education)
0.224 ***0.434 ***0.245 ***0.257 ***
Vocational0.005−0.003−0.0360.011
Medium education0.074 *0.090 *0.068 *0.075 *
High education
Urban degree (Reference: Urban)
0.112 ***0.097 ***0.0230.147 ***
Semi-urban−0.011−0.041−0.0160.004
Rural
Age group (Reference: Early adulthood)
0.037−0.001−0.0080.010
Early middle age−0.029−0.056−0.039−0.122 ***
Late middle age0.0320.0280.001−0.085 **
Late adulthood
Household type (Reference: Single adult)
0.109 ***0.094 ***0.069 *−0.037
2+ adults0.124 ***0.110 ***0.113 **0.081 *
Single parent0.024−0.0210.0070.002
Couple w/children0.201 ***0.149 ***0.166 ***0.102 **
Adjusted R20.10430.20780.091140.08648
p < 0.001 ***; p < 0.01 **; p < 0.05 *.
Table 5. Odds ratio, lower and upper confidence intervals, and p-value binomial regression results for the sufficient group versus the rest of the sample.
Predictor (Sufficient Versus Rest)Odds RatioCI LowerCI Upper
(Intercept)0.27 ***0.110.63
Political orientation (Reference: Green)
Left
0.640.351.15
Center0.42 *0.210.84
Right0.34 *0.140.79
Other/No preference0.47 *0.250.87
Housing type (Reference: Apartment)
Semi-detached/Row-house
0.61 *0.380.99
Detached house0.30 ***0.160.56
Gender
Female
0.860.591.26
Other2.340.846.52
Income level (Reference: Low income)
Medium income
0.42 ***0.280.63
High income0.25 ***0.150.39
Education level (Reference: Low education)
Vocational
1.500.832.70
Medium education1.170.721.90
High education1.030.631.69
Urban degree (Reference: Urban)
-Semi-urban
0.880.481.61
Rural
Age group (Reference: Early adulthood)
1.750.993.08
Early middle age1.250.831.86
Late middle age0.37 ***0.190.73
Late adulthood0.35 *0.160.78
Household type (Reference: Single adult)
2+ adults
2.97 ***1.585.58
Single parent1.190.482.99
Couple w/children2.61 ***1.374.95
p < 0.001 ***; p < 0.01 **; p < 0.05 *.
Disclaimer/Publisher’s Note: The statements, opinions and data contained in all publications are solely those of the individual author(s) and contributor(s) and not of MDPI and/or the editor(s). MDPI and/or the editor(s) disclaim responsibility for any injury to people or property resulting from any ideas, methods, instructions or products referred to in the content.

