Article

Hydrological Transformation and Societal Perception of Urban Pluvial Flooding in a Karstic Watershed: A Case Study from the Southern Mexican Caribbean

by
Cristina C. Valle-Queb
1,
David G. Rejón-Parra
1,
José M. Camacho-Sanabria
2,
Rosalía Chávez-Alvarado
2 and
Juan C. Alcérreca-Huerta
3,*
1
Department of Earth Sciences, Instituto Tecnológico de Chetumal, Av. Insurgentes 330, Chetumal 77013, Mexico
2
Division of Sciences, Engineering and Technology, Secretaría de Ciencia, Humanidades, Tecnología e Innovación-Universidad Autónoma de Quintana Roo (SECIHTI-UAQROO), Blvd. Bahía s/n, Chetumal 77019, Mexico
3
Department of Observation and Study of the Land, the Atmosphere and the Ocean, Secretaría de Ciencia, Humanidades, Tecnología e Innovación-El Colegio de la Frontera Sur (SECIHTI-ECOSUR), Av. del Centenario km 5.5, Chetumal 77014, Mexico
*
Author to whom correspondence should be addressed.
Environments 2025, 12(7), 237; https://doi.org/10.3390/environments12070237
Submission received: 29 May 2025 / Revised: 30 June 2025 / Accepted: 8 July 2025 / Published: 10 July 2025

Abstract

Urban pluvial flooding (UPF) is an increasingly critical issue due to rapid urbanization and intensified precipitation driven by climate change that yet remains understudied in the Caribbean. This study analyzes the effects of UPF resulting from the transformation of a natural karstic landscape into an urbanized area considering a sub-watershed in Chetumal, Southern Mexican Caribbean, as a case study. Hydrographic numerical modeling was conducted using the IBER 2.5.1 software and the SCS-CN method to estimate surface runoff for a critical UPF event across three stages: (i) 1928—natural condition; (ii) 1998—semi-urbanized (78% coverage); and (iii) 2015—urbanized (88% coverage). Urbanization led to the orthogonalization of the drainage network, an increase in the sub-watershed area (20%) and mainstream length (33%), flow velocities rising 10–100 times, a 52% reduction in surface roughness, and a 32% decrease in the potential maximum soil retention before runoff occurs. In urbanized scenarios, 53.5% of flooded areas exceeded 0.5 m in depth, compared to 16.8% in non-urbanized conditions. Community-based knowledge supported flood extent estimates with 44.5% of respondents reporting floodwater levels exceeding 0.50 m, primarily in streets. Only 43.1% recalled past flood levels, indicating a loss of societal memory, although risk perception remained high among directly affected residents. The reported UPF effects perceived in the area mainly related to housing damage (30.2%), mobility disruption (25.5%), or health issues (12.9%). Although UPF events are frequent, insufficient drainage infrastructure, altered runoff patterns, and limited access to public shelters and communication increased vulnerability.

1. Introduction

Floods are among the most frequent natural hazards, with severe impacts particularly in low-income countries [1,2]. Urban pluvial flooding (UPF), exacerbated by rapid urbanization and extreme precipitation, represents a raising threat to cities worldwide [3,4,5]. The expansion of impervious surfaces, land use changes, and reduced land cover roughness increase UPF hazards [6]. The risks are further compounded by inadequate drainage infrastructure and a lack of data availability of urban drainage systems [7]. The intermittent nature of severe UPF events also reduces risk awareness and resilience for emergency response [8]. Although the consequences of UPF are widely recognized, attention is predominantly directed towards major urban centers, leaving several vulnerable or less resilient areas understudied [9].
Research on UPF remains relatively marginalized compared to river and coastal flooding [4,10]. However, the combined effects of climate change and urbanization processes are expected to intensify precipitation events [11], particularly short-duration, high-intensity storms that trigger flash floods [12]. These factors are determinant in modifying runoff dynamics, peak discharge rates, flood severity, and soil infiltration capacity. Such changes increase urban flood vulnerability, impact livelihoods, and may even contribute to population displacement [13]. Flood response research has traditionally focused on the hydrological analyses of flood frequency, magnitude, and spatial distribution, often overlooking the socio-environmental dimensions of UPF. Given the complex relationship between the urban environment and human factors, addressing UPF should effectively point out to integrated studies and transdisciplinary approaches [10].
Recent studies emphasize the need to shift beyond a strictly water-centric research approach towards a holistic, quantitative methodology to capture the human–water interactions [14,15]. This includes incorporating an understanding through the lens of social power relations and recognizing the role of society in the study of water [16]. Notably, socio-hydrology and hydrosocial frameworks have expanded the traditional interest in coupled human–water systems [17], offering diverse perspectives, methods, and conceptualizations [18,19,20]. Consequently, hybrid models have been developed to incorporate factors from both hydrological and social systems [14,19,21]. Among these, societal memory could explain temporal and spatial changes in human–water systems [22] and serves as a mechanism for communities to adapt and coexist with floods [23]. While societal memory strengthens the resilience to UPF events and fosters community engagement, integrating social and hydrological research still faces considerable challenges.
In the Yucatán Peninsula, karst extends over approximately 165,000 km2 [24] and nearly 130,000 km2 in the Caribbean islands, primarily concentrated in the Greater Antilles [25]. In the Caribbean, flood risk research is scarce [7], even though the region is highly vulnerable to extreme hydrometeorological events [26]. Anthropogenic activities, such as urban growth, water supply, mining, quarrying, agriculture, and tourism, generate considerable impacts on karst ecosystems and particularly on karst hydrology [25,27]. The fragility of karst landscapes is highly sensitive to the type and intensity of human intervention [25,28]. In the Mexican Caribbean, human settlements have increasingly transformed natural landscapes into urbanized areas [29]. These changes have altered infiltration patterns and disrupted the natural functioning of the karstic environments.
Therefore, this research aims to analyze and integrate parameters derived from environmental changes associated with UPF and urban growth. This research represents one of the first research attempts to address both the hydrological and social dimensions of UPF in the region. For this purpose, this study examines the impacts of UPF derived from karst environment changes due to urban growth, using the case of a modern, contemporary city in the Southern Mexican Caribbean. Different stages are examined related to its transition from a natural karstic environment to the current urbanized landscape. The numerical modeling of UPF under critical conditions was conducted considering historical records of urban growth. Additionally, societal memory and community risk perception were analyzed for the most recent UPF scenario. This perspective seeks to enhance the understanding of community exposure and the increasing vulnerability associated with urban development.

2. Materials and Methods

2.1. Study Area

The study area is located in the urban area of Chetumal, the largest settlement in terms of population on the Southern Mexican Caribbean coast. It occupies an area of 165.2 km2, which extends from Chetumal Bay to the left margin of the Hondo River, the natural border between Mexico and Belize (Figure 1).
Chetumal was founded in 1898 as a strategic location right after the delimitation of the international borderline. The urban growth of Chetumal increased exponentially, from 2212 inhabitants in 1910, being the largest city in the Mexican Caribbean at that time [31], to nearly 169,000 inhabitants in 2020 [32]. The original gridded urban trace now extends over topographic depressions, small lagoons, tropical forests, and savannahs. The Proterritorio sub-watershed, within the current urban area, transitioned from a natural landscape to an almost fully occupied human settlements that were initially informal. The sub-watershed currently exhibits high population density and several services that frequently collapse under pluvial flooding events. Also, the Proterritorio sub-watershed is located at a higher elevation (~9.4 m above sea level) than adjacent coastal watersheds; thus, it is not influenced by coastal or fluvial flooding. This sub-watershed is part of the Chetumal urban watershed, the drainage of which further connects with Chetumal Bay. Despite this hydraulic connectivity, severe floods occur within the Proterritorio sub-watershed as several topographic depressions are found along its drainage network.
Water infiltration usually motivated by the kart environment has been reduced by the coverage of concrete and asphalt, hence increasing flooding risks. Despite the close location of Chetumal watersheds to the Hondo River and Chetumal Bay, floods are mostly developed by rainfall and runoff episodes that run parallel to the Hondo River Fault. The rainfall and runoff episodes usually occur due to trade winds, storms, and hurricanes during the rainy season between May and October [33]. Moderate rainfall associated with northerly winds takes place between October and February, locally known as the Nortes season. High pressure systems constraining cloud formation and reducing precipitation rates are particularly developed in July–August, amid the maxima of rainfall in June and September [34,35].
The historical records of damage and devastation due to hydrometeorological events evince the pluvial flood risk in the Chetumal urban area. These records reflect a sociohistorical context related to insufficient infrastructure, fragile public services, and continuous environmental modifications [36]. From the existing cumulative rainfall records, the most critical UPF events have occurred in October 1995 (125 mm, 1-day duration), October 1998 (85 mm, 1-day duration), August 2012 (326 mm, 2 days duration), and October 2015 (571 mm, 9 days duration) [37]. Also, Hurricane Janet (Cat. 5) in 1955 devastated the city with 80% of the infrastructure damaged and left few buildings standing [37,38]. Further hydrometeorological events have caused damage in the city. This has led to the analyses of hurricane resilience indicators [39], their coping with hurricane and floods [37], risk indices [40], or damage to urban drainage systems [41].

2.2. Data Collection and Hydrographic Modeling

The research design considered a hybrid approach for hydrological analysis. Numerical modeling was employed to objectively quantify key physical characteristics of urban pluvial flooding (UPF) (i.e., floodwater levels, affected areas, volumes, and flow velocities). To strengthen the reliability of the modeling outputs, results were compared with insights derived from a hydrosocial perspective. These served to further describe community exposure, societal memory, and risk perception related to UPF events. This integration of methods allows a contextual depth to the analysis and could support the identification of critical issues for UPF management based on the existing human–water interactions in the area.
Records from [31] were analyzed to define the urban growth in the period 1900–2015. The focus was on three scenarios describing the different stages of urban development: (i) 1928—natural condition without urbanization (0%); (ii) 1998—semi-urbanized condition (78% coverage); and iii) 2015—urbanized area (88% coverage). The first scenario was selected as no urbanization was developed within the watershed or near its boundaries. In contrast, the 1998 and 2015 scenarios represent periods during which critical UPF events occurred, collapsing the existing urban development. Prior to 1998, no drainage infrastructure had been developed. Although drainage systems were later developed, they remained insufficient to mitigate flooding impacts during the 2015 UPF event. This occurred due to the rapid urbanization extending towards the limits of the sub-watershed and the refilling of topographic depression for urban development.
Land cover changes as well as the modifications in the hydrographic conditions related to the urban sub-watershed area, drainage network, and permeability loss were calculated through the QGIS 3.34.11 software. The delimitation of the hydrographic watersheds over the urban area of Chetumal was conducted based on the available digital surface models (DSMs) and digital terrain models (DTMs) from [30]. These models were derived from satellite and airborne remote sensing data with georeferenced landforms above mean sea level calculated with a 5 m resolution. Digital surface models were used to outline the existing human-made structures under the existing urbanization, whereas digital terrain models were used to consider large vegetated or natural areas. The processing of the resulting DEMs through the QGIS software allowed the delimitation of the urban watersheds, especially that of the Proterritorio sub-watershed, where the analysis was conducted. Similarly, the Strahler method [42] was applied to measure the relative sizes of streams and branching complexity (S) of the drainage network and to better describe the flow direction. Additionally, information regarding the watershed surface, length of the mainstream, and total length of the streams was obtained for each scenario (i.e., 1928, 1998, and 2015).
The assessment of both societal memory and the physically based numerical modeling considered the UPF event from the precipitation registered on 14–23 October 2015 in Chetumal. This event presented an accumulated rainfall of 570.8 mm and is among the most recent hydrometeorological events to produce critical floods in the area [37]. Also, the duration of the UPF event described several intertwined periods of runoff and infiltration primarily given by the karstic conditions in the area. The 2015 UPF event remains in the collective memory of the population, making it a suitable reference for evaluating the current community perceptions of flood risk. In this regard, the societal memory refers to the accumulated experiences and community-based strategies developed in response to past UPF events. Also, risk perception would be considered as the socially constructed interpretation of hazard influencing preparedness, response, and even denial of risk.
The modeling of different urban pluvial flood scenarios for urban development was conducted through IBER. This software is a two-dimensional hydraulic model that solves the full depth-averaged shallow water equations to simulate free surface flows, also incorporating rain and infiltration processes [43]. IBER+ code allowed Nvidia CUDA implementation for the execution of IBER in GPUs [44]. For the rainfall–runoff simulations, the available records collected every 10 min from a meteorological station belonging to the national public research center, El Colegio de la Frontera Sur (ECOSUR), were used to describe the hietogram. The Soil Conservation Service Curve Number (SCS-CN) rainfall–runoff method, the native method implemented in IBER, was applied as it accounts for soil types, land covers, surface conditions, and antecedent soil moisture conditions in relation to the watershed infiltration capacity [45]. For this purpose, a composite curve number (CN) was considered based on the assessed historical Proterritorio sub-watershed features and land cover subareas:
C N I I = C N 1 A 1 + C N 2 A 2 + + C N i A i + + C N n A n i = 1 n A i
where CNII stands for the curve number under the moderate antecedent moisture condition, CNi denotes the curve number for a land cover subarea Ai, and n denotes the total number of subareas. Each CNi was determined based on [46] and the selection of the hydrological soil group A (HSG Group A) as limestones and sandy loams provide low runoff potential and high infiltration rates in the area. CN-values close to 0 represent high permeability conditions, whereas CN-values close to 100 relate to impermeable conditions. The subareas Ai were obtained considering the detailed and georeferenced maps of building basal areas, paved areas and streets, dirt roads, and tropical forest and urban green areas (e.g., lawns, parks, cemeteries, vacant lots). The OSMDownloader plugin in QGIS was used to delineate building basal areas based on the OpenStreetMap data model. Paved areas and streets, dirt roads, and tropical forest and urban green areas were obtained from [47]. The resulting maps were modified to reflect the stages of urban development according to the urban growth described in [31]. Manning’s roughness coefficients were defined for the subareas based on [48].
The evolution of the UPF event for each urbanized scenario was analyzed considering raster outputs from the IBER model every 3 h since the beginning of the observed runoff. Flooded areas and stream velocities (including those from the mainstream) were obtained. The categorized representation of the floodwater levels from the UPF modeling raster outputs was performed in QGIS according to the hazard thresholds for passenger vehicles, adults, and children described in Table 1. These allowed an affordable qualitative comparison with those obtained from the societal memory appraisal. Furthermore, the raster layer statistics tool in QGIS was used to extract the mean stream velocities from the drainage network given as output from IBER. The stream velocities from the mainstream were obtained through the profiles from lines tool within the SAGA algorithms in QGIS.
The comparison of the results from the spatial representation of the water elevation of the flooding area was made against three numerical modeling scenarios. For this purpose, data collection was conducted through the semi-structured interviews of 185 residents within the Proterritorio sub-watershed. An intentional non-probabilistic sampling [50] was considered to describe flood areas in terms of their location, extent, and water depth. Interviews focused on selecting people living in households that have repeatedly experienced flooding caused by intense rainfall associated with hydrometeorological phenomena. The five categories of flood danger were defined considering the loss of stability on passenger vehicles, adults, and children only due to the water depth according to [49]. These categories allowed a distinction between zones where waterlogging is produced (i.e., water depth < 0.3) and those in which different affection scales could be achieved (Table 1).
Further data were collected through structured aleatory surveys collected from 255 inhabitants within Chetumal, who are not necessarily directly affected by flooding events. These surveys were conducted to explore risk perception among residents within the urban area of Chetumal. Factors assessed included damage suffered from UPF and historical memory of UPF events. Additionally, water depths reached during floods and the availability of flood records (e.g., images, videos) were evaluated. The time elapsed after the flood waters receded and the frequency of perceived UPF occurrence were also examined. The dimensions of societal memory and risk perception are interrelated, as social memory shapes risk perception, which in turn reshapes collective memory in response to evolving environmental and social conditions. Finally, the knowledge of shelter locations and their accessibility during flooding events was assessed.

3. Results

3.1. Transitioning from Nature to Urban: Historical Urban Records

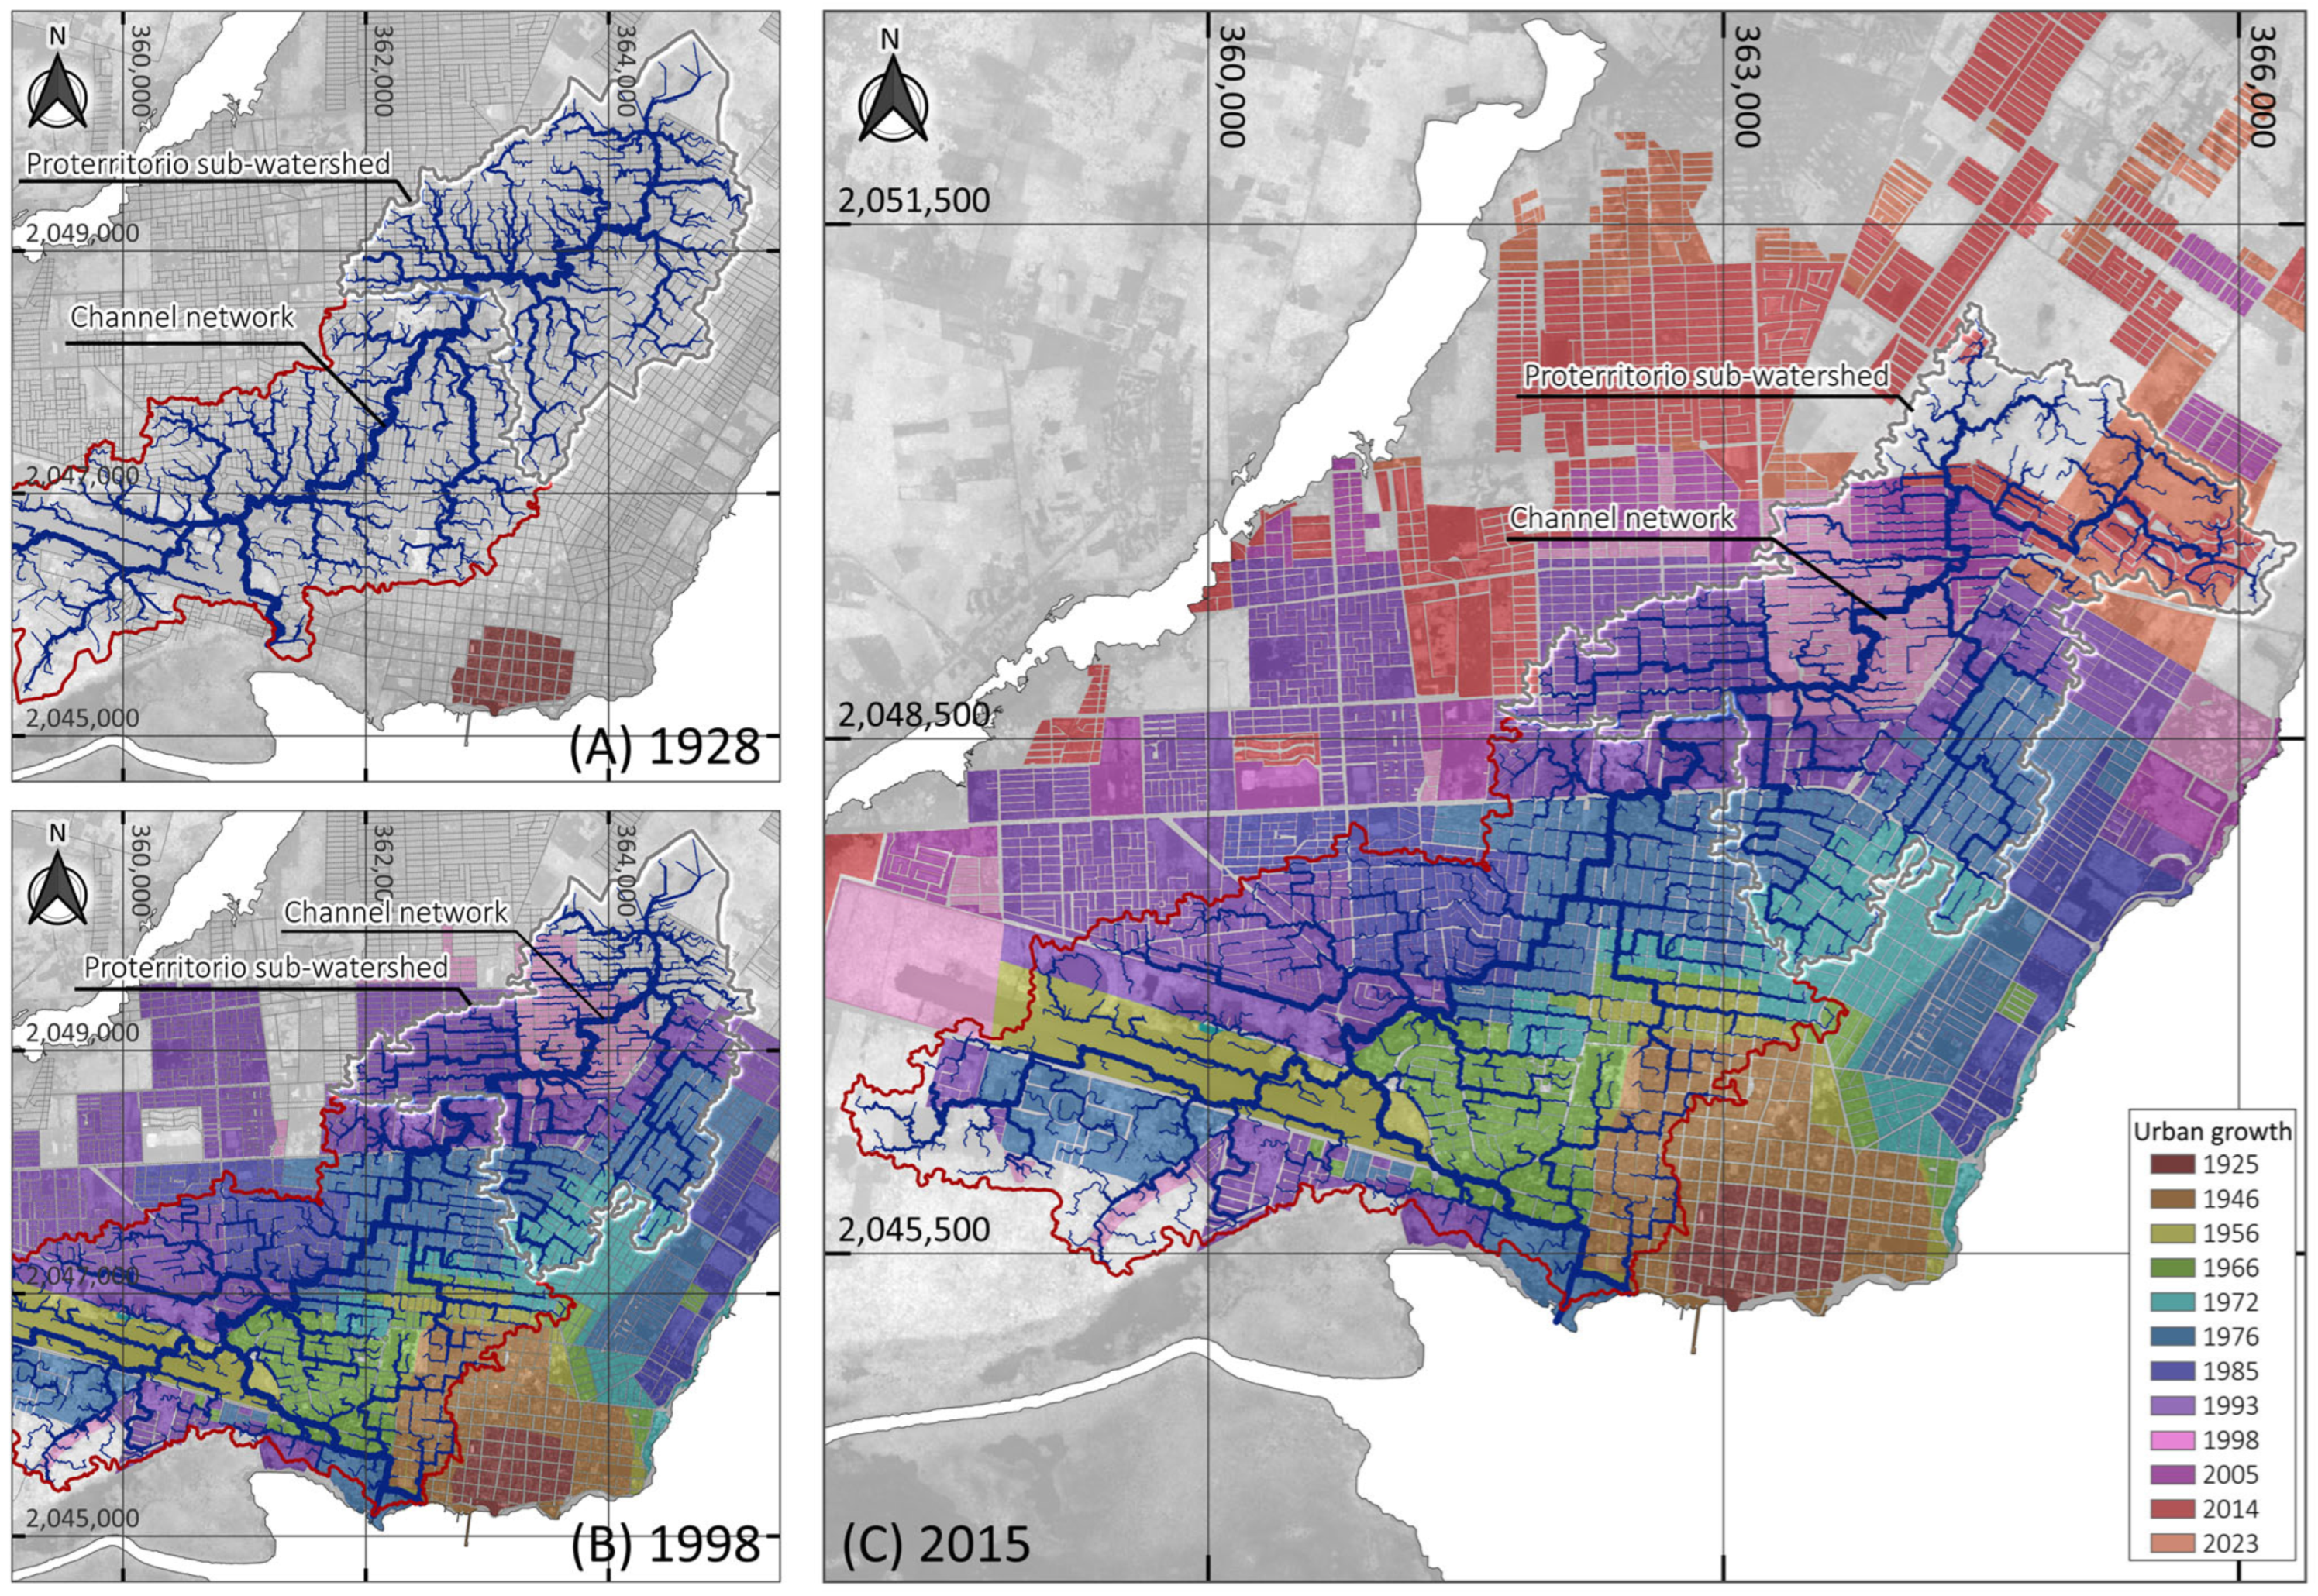
The urban expansion of Chetumal across different decades since 1925 is shown in Figure 2. By 1928, urban development was minimal and not extended into the Proterritorio sub-watershed and scarcely impacted downstream until 1956. The urbanization of the Proterritorio sub-watershed initiated around 1972, primary concentrated in its southeastern portion. The most significant expansion of the sub-watershed occurred between 1993 and 2005, with an average rate of 13.3 ha/yr. Between 1928 and 1998, urban development was concentrated along the southern and eastern boundaries of the sub-watershed. This expansion continued by 2005 and 2015 over the temporary mainstream course (Figure 2), progressively encroaching upon natural terrain depressions towards the northeast (Figure 1).
Changes in the drainage network are notable, as in 1928, when surface water flow followed the natural topographic relief, forming a branching network unaltered by infrastructure (Figure 2A). However, tributaries within the sub-watershed have been redirected to align with streets and avenues due to urbanization, consequently configuring an orthogonalized drainage network (Figure 2B,C). These changes are clearly observed near the boundaries of the Proterritorio sub-watershed. They also extend along the mainstream towards the northern area, reaching the limits of a large natural landscape that is still preserved.
The branching complexity of the drainage network has remained consistent over the years (S = 5). Nevertheless, the length of the mainstream, defined by the highest Strahler order, has increased from 2.63 km in 1928 to 2.81 km in 1998 and 3.5 km in 2015. By 2015, the mainstream also exhibited a connection with tributaries of a higher order. This was possibly caused by changes in drainage network paths, the sub-watershed shape (Figure 2C), and the expansion of the sub-watershed surface area (Table 2). In this regard, the sub-watershed area increased from 585.4 ha (5.854 km2) in 1928 to 601.9 ha (6.019 km2) in 1998 and 702.3 ha (7.023 km2) in 2015.
Land cover in the Proterritorio sub-watershed transitioned from non-urbanized tropical forest in 1928 to a diverse mix of land uses by 1998 and 2015. By 1998, the incorporation of extensive impervious surfaces (221.7–275.6 ha) accounted for 36.8–39.2% of the area (Table 2). The increase in building basal area between 1928 and 1998 was higher than the joint expansion of dirt roads, paved streets, curbs, sidewalks, and parking lots. This trend indicates that urban growth during this period focused on housing development, with only incipient road infrastructure and incomplete property occupation. However, approximately 87.8% of the Proterritorio sub-watershed showed a high degree of urbanization by 2015 (Table 2). Dirt roads had been converted into paved streets, while the total road surface area increased by 28.5 ha compared to 1998. The building basal area also expanded by 25.3 ha between 1998 and 2015, with its proportion nearly similar to road infrastructure changing from 20.3% to 21.0% of the sub-watershed area. Additionally, the sub-watershed area derived from the urbanization process increased by 100.4 ha, corresponding to an expansion rate of approximately 5.9 ha/year.
Morphological changes in the sub-watershed were most evident to occur in the northeastern portion, where rapid new urban development emerged (Figure 2). The increase in impervious surfaces was nearly proportional to the expansion of the sub-watershed area. This suggests that the construction of streets, avenues, and roads nearby zones may have incorporated portions of adjacent urban watersheds.
The CN-values, which reflect changes in surface permeability, increased significantly between 1928 and 1998 as impervious surfaces expanded within the Proterritorio sub-watershed, rising from 51.94 to 63.83. After 1998, CN-values remained relatively stable in 2015, suggesting a proportional and simultaneous expansion of the sub-watershed area, open spaces, and impervious surfaces between 1998 and 2015. Additionally, dirt roads exhibited similar CN-values to paved surfaces, leading to a slight CN-value variation due to road infrastructure. Furthermore, the potential maximum retention S (S = 25,400/CN-254), which represents infiltration occurring after runoff begins, decreased from 207.9 mm in 1928 to 141.6 mm in 2015. This indicates a reduced capacity of the soil to retain stormwater.
Regarding roughness, a high impact occurred, with values decreasing from 0.060 in 1928 to 0.25–0.30 after 1998. This decline indicates reduced flow resistance within the sub-watershed, leading to an increase in flow velocities and faster water accumulation in flood-prone areas. Therefore, a decrease in roughness resulted from the transformation of the original tropical forest into impervious surfaces. These changes accelerated runoff, reduced infiltration capacity, and shortened the watershed’s response time to rainfall events.

3.2. Modeling of Flood Scenarios

Based on the modeling results, the effects of urban growth are clearly noticed in the extent, level, and time progression of the flooded areas, as well as in the velocity of the mainstream compared to the drainage network (Figure 3). The increase in flooded area during the UPF event becomes notably more pronounced as urbanization intensified (Figure 3A). In the non-urbanized scenario, the flooded area covered 250 ha, whereas by 1998 and 2015, it expanded by nearly 1.56 and 1.85 times, respectively.
In all scenarios, areas experiencing flooding levels > 0.5 m were observed, but their extent was larger for the urbanized cases. By the end of the UPF event, ~53.5% of the flooded area in urbanized scenarios exceeded 0.5 m in depth, compared to only ~16.8% in 1928. Flow velocities were also altered by the urbanization process (Figure 3B, Table 3), particularly in the mainstream, which flows in a northeast–southwest direction (Figure 2).
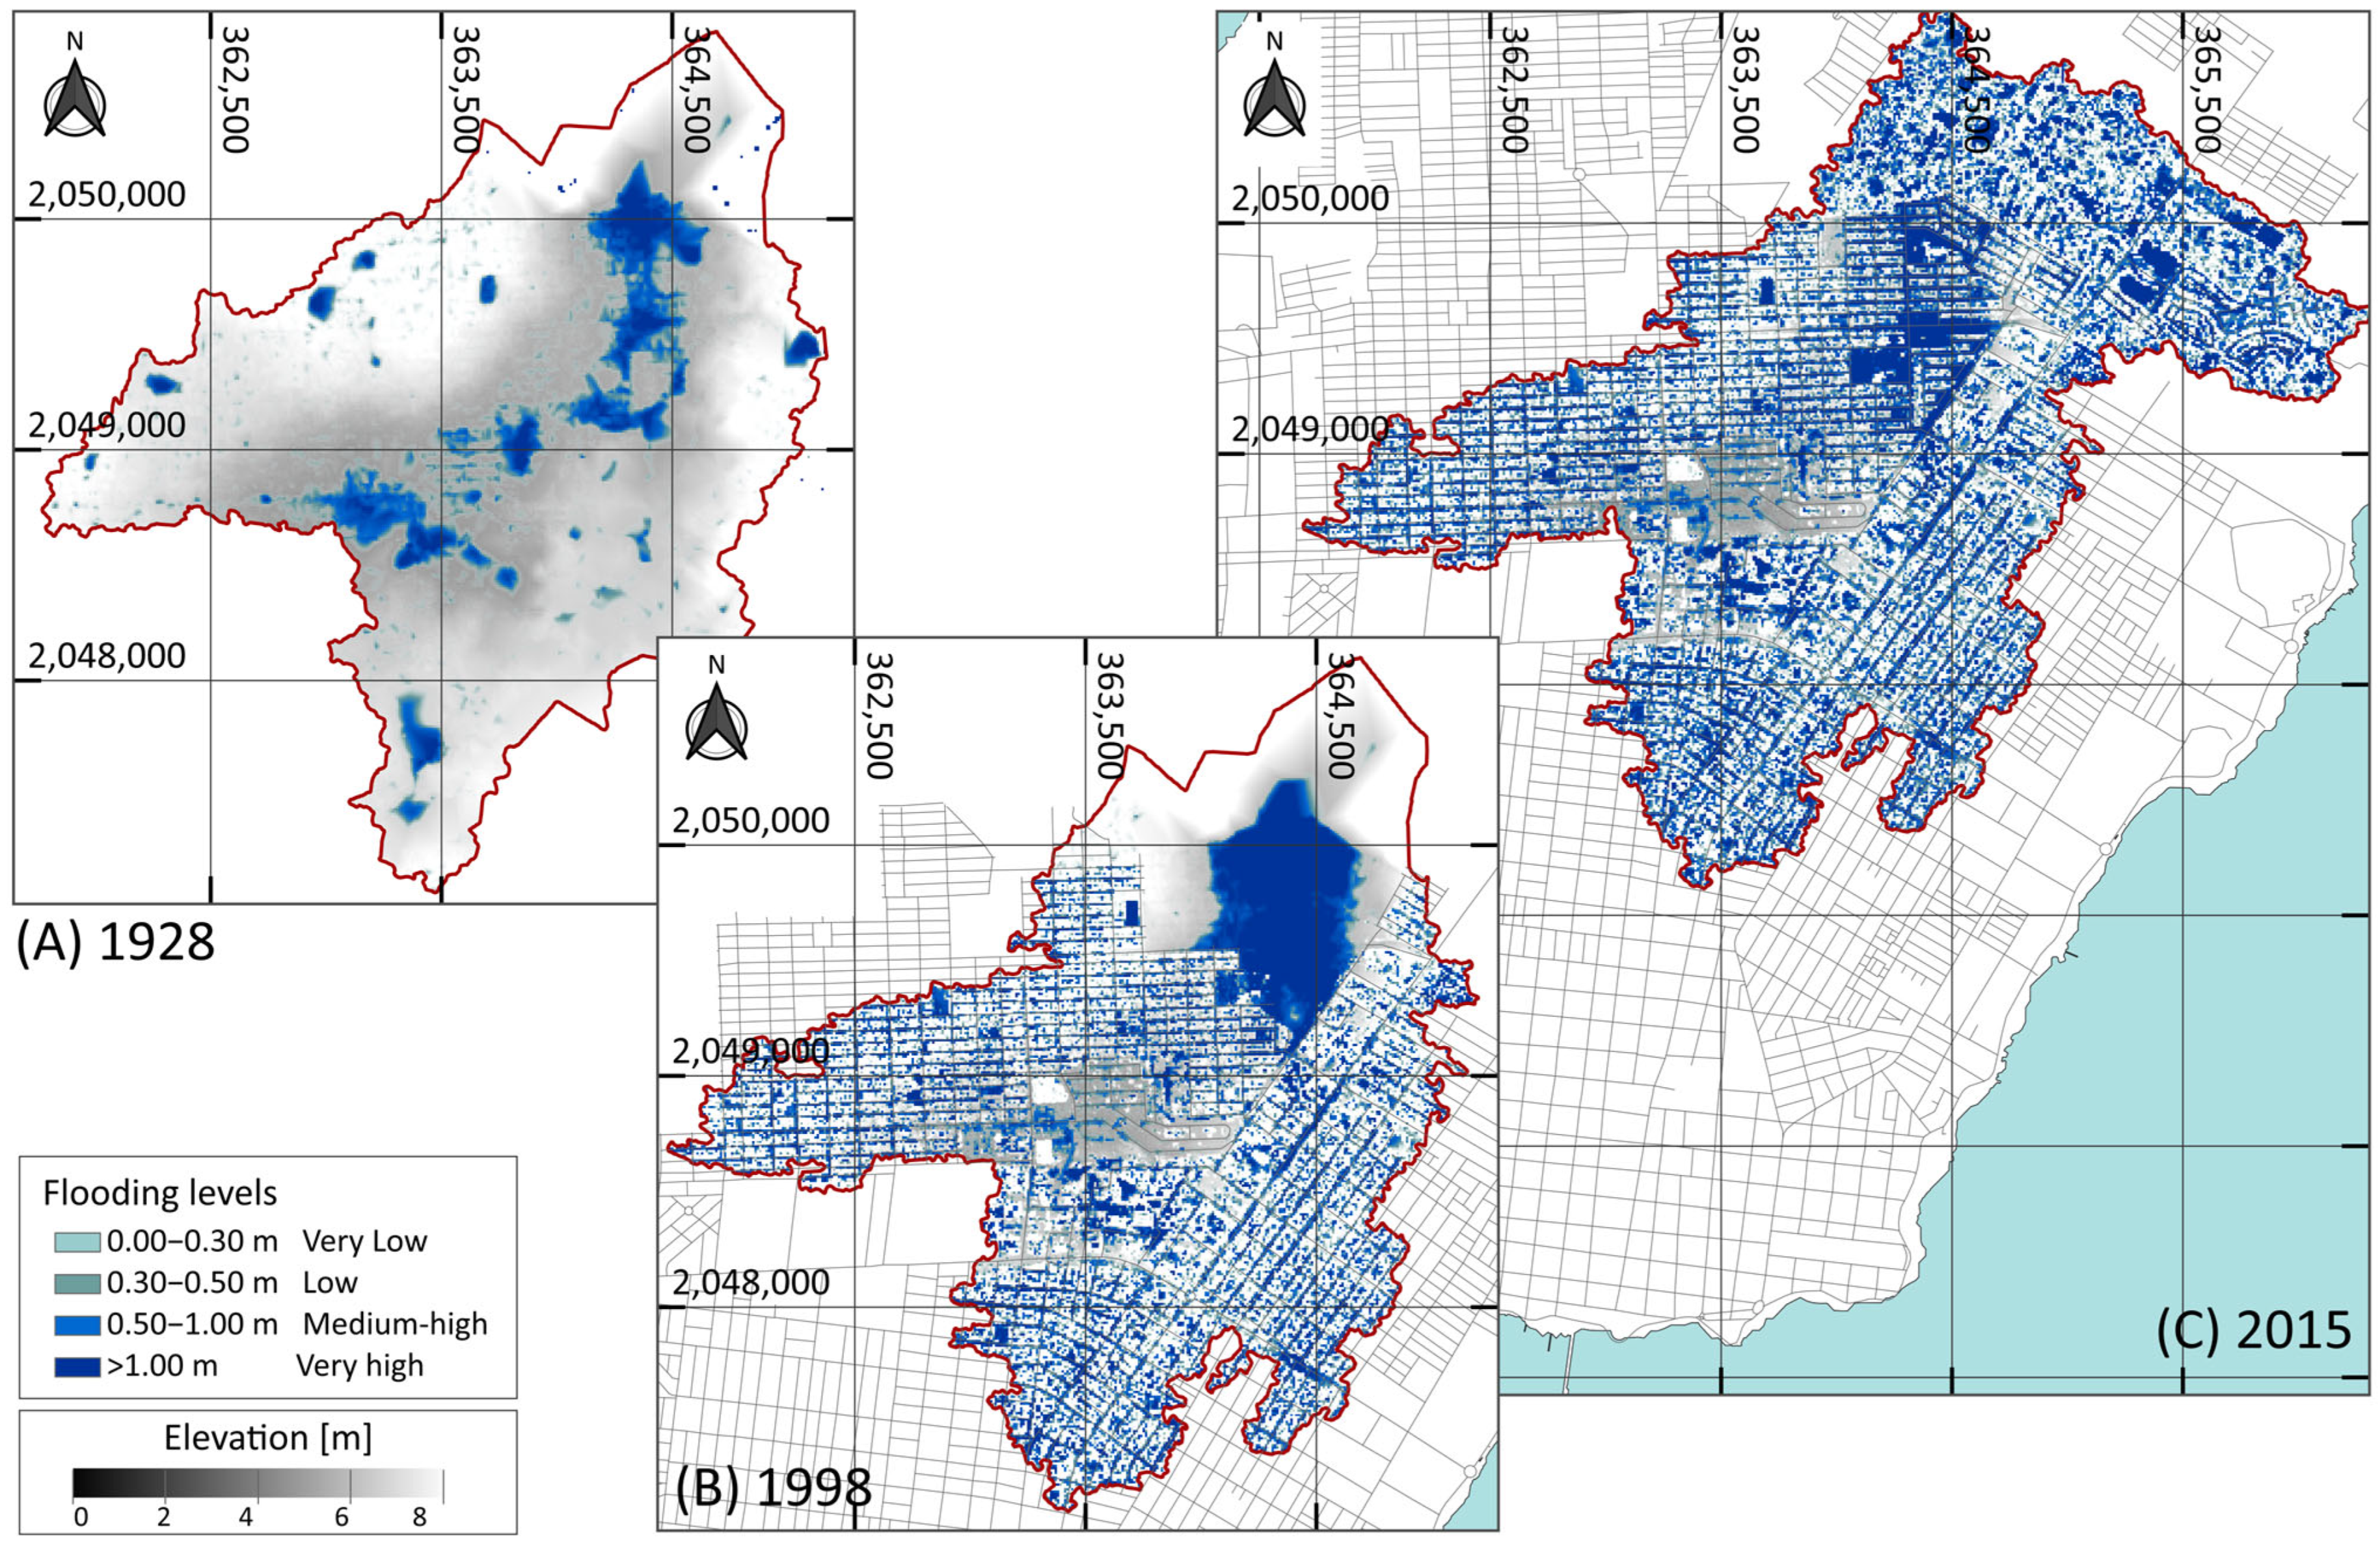
Based on the modeling results, water accumulated in widespread puddles throughout the Proterritorio sub-watershed, with flow developing along the street layout following the drainage network. By 1928, the natural permeability of the karst soil and the roughness resulted in isolated flooding areas and delayed runoff (Figure 4A).
Critical flooding zones became evident approximately 4.5 days after the initiation of the UPF event. As the event progressed, the flooded area expanded before gradually decreasing by the end of the UPF event. Also, under 1928 conditions, disconnected flooded areas concentrated in the northern and south–central portions of the sub-watershed, converged into natural terrain depressions and along the course of the mainstream (Figure 4A). Outside the most critical zones, flooding was not observed in the modeled scenario. Under these conditions, approximately 39.7% of the sub-watershed experienced flooding.
The initial urbanization observed in 1998 presented an important effect on the infiltration capacity of the Proterritorio sub-watershed and consequently on the resulting flooding process (Figure 4B). Water levels and runoff began rising 3.25 days after the start of the simulated UPF event, occurring 27% earlier than in the pre-urbanization scenario. Unlike the 1928 scenario, the flooded areas continued to expand until the end of the simulation, when the total flooded area stabilized. Moreover, by the end of the simulated UPF event, the water volume accumulated in the flooded areas increased from 0.62 million m3 in 1928 to 2.02 million m3 in 1998 and 2.97 million m3 in 2015. This evinces the impacts of expanding impervious surfaces and the reduction in infiltration capacity.
Compared to 1928, when flooding was mostly concentrated along the mainstream, the 1998 scenario showed floodwaters extending beyond the deeper topographic depressions affecting 64.1% of the sub-watershed and spreading into the orthogonal street layout of the urbanized area (Figure 4B). A critical and extensive flooded zone developed in a non-urbanized area in the northern portion of the sub-watershed. After 5.5 days, runoff flows experienced an important damming effect due to the urban infrastructure, leading to water accumulation in the northeastern section and causing more extensive flooding than in the natural condition. Since urbanization progressed from south to north, the remaining natural portion of the sub-watershed in 1998 still exhibited the typical behavior of a natural drainage network.
Under the 2015 scenario, approximately 66.1% of the sub-watershed experienced flooding (Figure 4C). Runoff concentration led to flood levels exceeding 0.5 m after 5.5 days into the simulated UPF event in 2015 (Figure 3A). Afterwards, the flooded areas remained stable, covering extensive urbanized regions, a situation that would naturally result in the collapse of urban mobility and risks across the watershed. Although flooding was widespread throughout the city, the areas with the greatest water accumulation still coincided with the main water streams and topographic depressions. Additionally, the construction of suburban developments in the northeastern portion of the Proterritorio sub-watershed contributed to the incorporation of zones that were originally part of adjacent sub-watersheds. This reconfiguration could be facilitated by the development of new streets and avenues, which did not account for the pre-existing natural drainage patterns and watershed boundaries. In the modeled scenario of 2015, the expansion of the sub-watershed further contributed to increase flooding areas, water levels, and water volumes.

3.3. Social Memory and Perception of UPF Events

Aleatory surveys conducted among inhabitants across Chetumal, including those who were not directly affected by flooding events, mainly exposed damage that directly impacted livelihoods and assets. The most severe impacts attributed to UPF events were housing damage (30.2%), mobility disruption (25.5%), diseases (12.9%), traffic accidents and pedestrian injuries (14.1%), vehicle damage or loss (12.5%), and damage to business infrastructure (4.7%).
Social memory regarding the past UPF events was found to be inconsistent, particularly concerning the water levels. Nearly 43.1% of the surveyed people recall floodwater levels in certain locations of the city, with ~9.0% able to provide photographic or video evidence of UPF events. Although respondents could not accurately recall dates or floodwater levels, their memory prioritizes the way in which the risk of disasters were faced, also emphasizing the importance of disaster response and institutional actions—perceived as insufficient by 80% of the population and highlighting the lack of investment in infrastructure to mitigate future floods.
Surveyed people reported floodwater levels of <0.15 m (6.4%), 0.15–0.30 m (20.0%), 0.30–0.50 m (29.1%), 0.50–1.00 (26.4%), and >1.00 m (18.1%), from which nearly 91.8% indicated that flooding primarily occurred in streets, while 8.2% recalled floods inside homes or private properties. Notably, flooding was described as a recurrent issue, occurring multiple times per year by 98.2% of respondents. However, despite this frequency, only 59.6% could identify their nearest designated shelter, and just 48.2% believed they could access it during a UPF event.
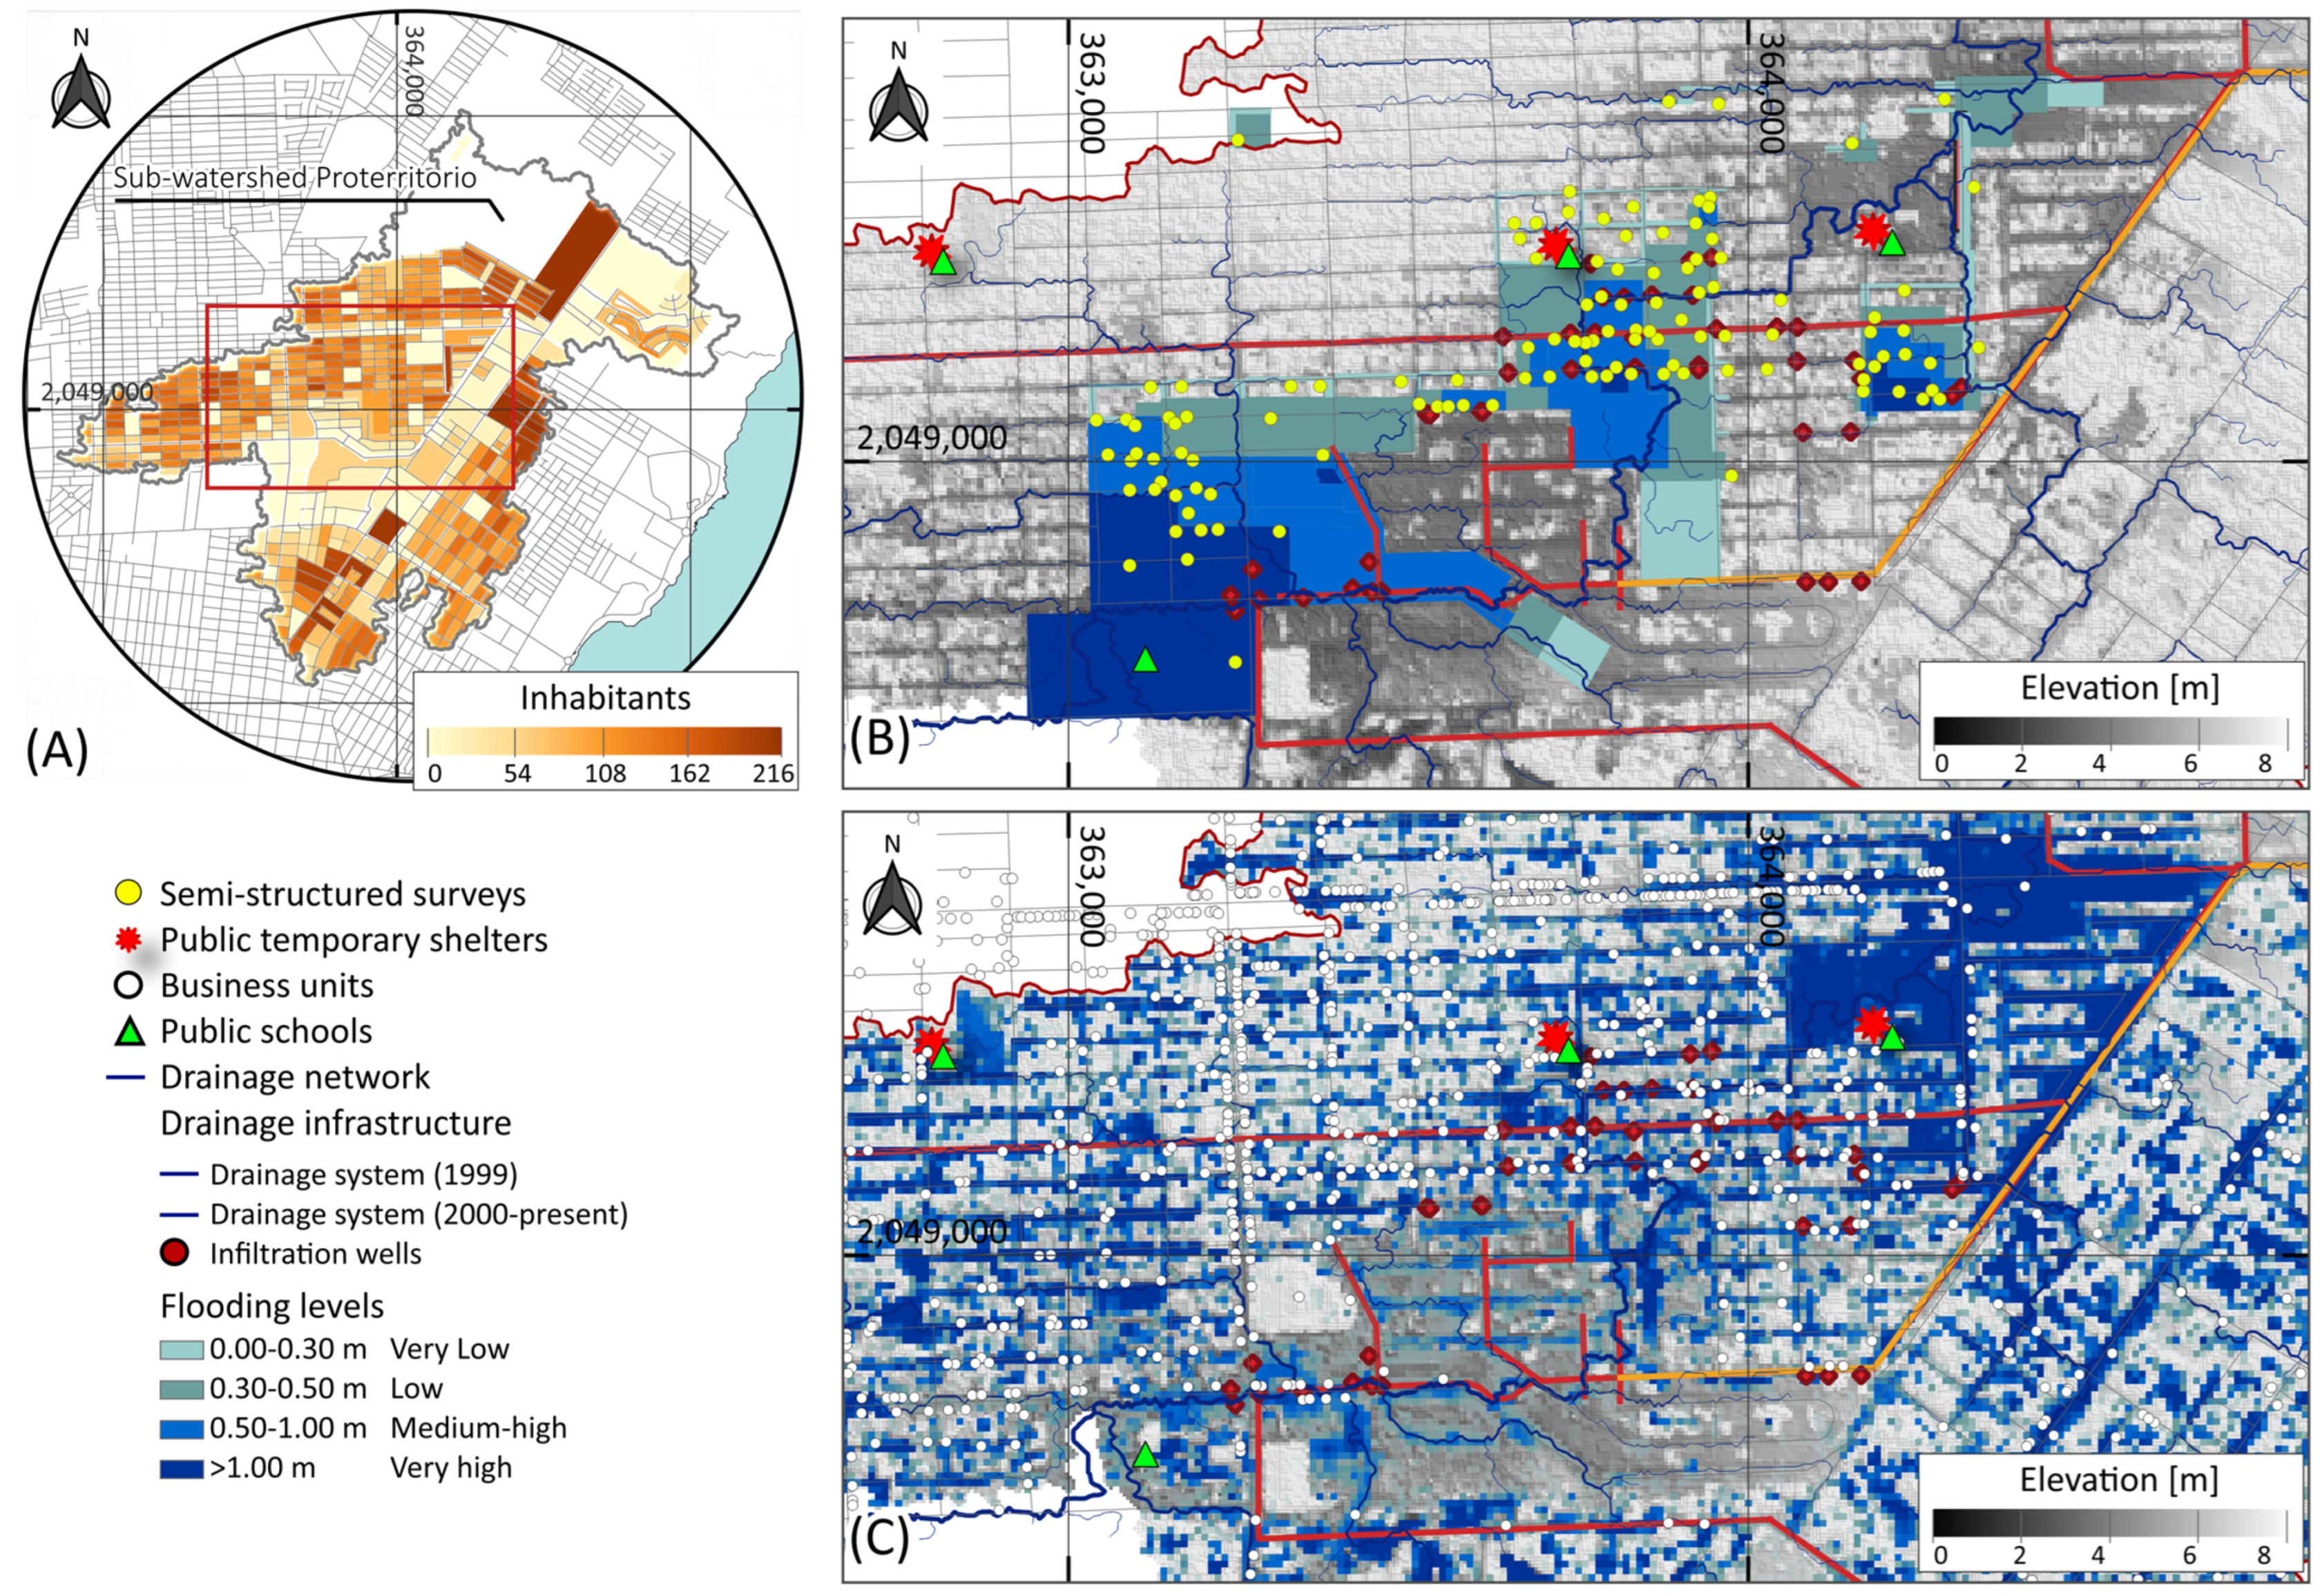
A comparison between the floodwater levels for the 2015 UPF event (based on the semi-structured interviews of residents within the Proterritorio sub-watershed and numerical modeling), as well as the distribution of inhabitants and infrastructure, is presented in Figure 5. The pluvial drainage network passes through areas with lower population compared to zones near the watershed boundary (Figure 5A), where urban growth has been historically more extensive (Figure 2). However, the low populated areas are occupied by shopping centers, remaining vacant lots, parks, or public schools.
Along the mainstream, there are 54.2 inhabitants per block (i.e., 12% lower than the sub-watershed average). While only 6.5% of urban blocks are directly affected by the mainstream, flooding impacts extend well beyond its course (Figure 5C). According to the interviewed residents within the Proterritorio sub-watershed, pluvial floods have been a persistent issue since the 1990s. Also, eight critical flooded areas in the southern Proterritorio sub-watershed, covering a total of 39.9 ha, were consistently recognized from which 85.5% experienced floodwater levels exceeding 0.30 m (Figure 5B). The most severe flooded areas were identified near the sub-watershed drainage point, impacting a set of shopping centers, residential areas, a public school, and mobility in the area. These areas are predominantly located in low-lying zones (Figure 2 and Figure 5B,C) at 1–5 m above the sea level, which makes them prone to water accumulation due to their microtopography and limited natural drainage capacity.
According to model results, 322 ha of the sub-watershed experienced flooding levels > 0.30 m—eight times the area reported by residents within the Proterritorio sub-watershed. While the modeled flood zones aligned with community accounts in terms of magnitude and affected sites, certain flooded areas went unmentioned. This discrepancy is particularly evident in the northeastern section (c), where large flooded blocks were identified but not acknowledged in interviews, possibly because these areas are away from residents’ immediate surroundings. Flooded open spaces and public areas were generally not perceived as a direct risk by respondents. Several temporary public shelters—typically schools—were found in areas with flood water levels > 0.30 m. These shelters are surrounded by business units along streets where floodwaters tend to accumulate and extend (Figure 5C).
According to residents, this vulnerability has been exacerbated by unplanned urban development. Despite the concentration of pluvial drainage infrastructure within the most frequently flooded areas (Figure 5B,C), it remains insufficient. This reality has reinforced in the Proterritorio community a strong awareness of flood risks, emphasizing both infrastructural deficiencies and the need for urban planning to mitigate pluvial flooding. Many residents attributed their vulnerability to urban expansion, particularly the construction of shopping centers (2012 and 2015) and private residential developments. These structures, built approximately 0.5 m above the street level and the original land elevation, altered natural runoff patterns. As a result, floodwaters were redirected towards public spaces, further extending along the street and previously built housing.
In the collective memory of the inhabitants, severe UPF events still persist, leaving a lasting mark from shared experiences that have shaped the community perception of risk. The installation of the first storm drain in 1999 (Figure 5B,C) represented a milestone in local memory as it was seen as one of the first institutional responses to mitigate flooding. For several years, this investment was mentioned to help reduce puddles and flood risk during UPF events. However, subsequent modifications to the drainage system (Figure 5B,C), coupled with changes in urbanization, watershed size, and the drainage network (Figure 2), have resulted in the reappearance and recurrence of the same flood phenomenon, as well as maintaining the flood risk in the community’s memory.
Qualitative interviews with residents highlighted public health risks associated with UPF events in the region. A critical concern is the presence of households without access to sanitary drainage, where the use of latrines during flooding events promotes the mixing of wastewater and rainwater. This contamination has been associated with an increased incidence of skin diseases, nail infections, gastrointestinal disorders, eye infections, and vector-borne outbreaks. The connection of sanitary drainage systems from private developers to the original pluvial drainage also worsens this condition and overloads the drainage capacity due to rapid system saturation.
The presence of abandoned homes and temporary rental properties was informed, which tenants frequently vacate after flooding events. This dynamic transforms the urban landscape, as deteriorated facades and abandoned properties promote harmful fauna, illegal dumping, and the obstruction of stormwater infrastructure, further degrading local living conditions. Additionally, free WiFi hotspots were found to play a crucial role during floods by the residents, serving as an improvised communication hub, where internet access allowed the people to stay informed and coordinate emergency responses, mitigating the crisis’s impact.

4. Discussion

The use of specialized software for flood assessment is a crucial decision-making tool in disaster management. However, recommendations on the spatial and temporal resolution of rainfall measurements within urban catchments are scarce [51]. Also, the DEM resolution could affect hydrological modeling outputs. It may lead to a varied assessment of peak flows, depending on infiltration and overland flow parameterization [52]. Particularly, the 5 m-resolution DEMs were suitable for capturing the urban runoff paths along streets and the small-scale heterogeneity and microtopography features of the karstic sub-watershed. Similar studies report the improvement in model performance with a higher spatial resolution [53], but dependent on the drainage network width [54,55] (i.e., ~1–10 m within the urban area). Nevertheless, further scale-refinement analysis is needed to determine the suitability, accuracy, and limitations of DEMs for hydrological modeling in microtopographic coastal karstic environments.
Modeled urbanization scenarios described the critical issues in the development of UPF events, urban planning, and risk response implications considering the decrease in natural karst permeability. Rapid and unplanned urban expansion altered the natural hydrological processes, leading to increased runoff and water accumulation on streets and public spaces towards low-lying areas that historically functioned as ponds, lagoons, and wetlands. However, due to the impervious nature of urban surfaces and restricted infiltration, runoff accumulates, increasing flood depth before overflowing into adjacent areas.
In flat low-lying coastal environments, natural surface drainage capacity is highly reduced and further deteriorates with increased impervious surfaces, reduced roughness, and accelerated runoff velocities. Paved roads channel floodwaters, effectively constraining flow while contributing to the expansion of inundated zones inside the urbanized areas. Similar hydrodynamic alterations have been observed in terms of land use and land cover at a regional scale [56], changes in peak runoff and discharge due to impervious surface coverage and distribution [57], and synthetic urban patterns [58]. Localized runoff dynamics, flood water levels, and hydrological changes enhanced by urbanization effects were clearly defined. However, the standalone UPF event analysis is limited for capturing the full range of hydrometeorological variability and its effects. By integrating a probabilistic approach (e.g., [59,60]), a better extreme risk assessment could be achieved to support comprehensive flood risk management strategies.
Urban planning in the region should incorporate hydrological assessments to mitigate flood risks by preserving natural drainage features and preserving the permeability of the karstic environment through nature-based solutions. Management should consider site’s pre-development hydrology [61]. Implementing sustainable urban drainage systems (SUDSs) [62], green infrastructure, and improved stormwater management can also help counteract the adverse effects of urbanization on flood dynamics [63]. For the study area, bioretention systems could mitigate runoff volumes and peak flows during UPF events [64]. Floodable parks and non-occupied public spaces in Chetumal could stand for an alternative as temporary water retention zones [65]. These systems could promote water infiltration within the urban design and encourage urban identity through the recognition of the karstic landscape functionality.
As a coastal city with remaining natural wetlands and karst soils, Chetumal presents suitable conditions for the conservation, restoration, and construction of wetlands as an effective strategy to mitigate UPF effects. These systems can naturally filter stormwater and attenuate peak flows and flow velocities using the native vegetation [66]. Combining these nature-based solutions with existing conventional drainage infrastructure can enhance urban flood resilience. In this regard, drainage system designs should be developed for economic and non-economic damage as well as for protecting urban function dynamics and mobility [61].
The orthogonalization of the drainage network and reduction in surface roughness have led to higher peak velocities and shorter response times, limiting drainage infrastructure efficiency. However, these urban runoff paths can be reimagined as urban blue corridors—such as streets designed to channel water towards retention basins [67,68]. Critical nodes in the drainage network should integrate SUDSs, restore natural ponds, include bridged streets, and upgrade existing drainage infrastructure. Urban planning must also preserve natural flood-prone areas as buffer zones to decentralize and diversify drainage. This requires hydrogeological and ecological mapping, alongside participatory processes to incorporate local knowledge and address ineffective drainage strategies in karstic cities like Chetumal. Also, traditional but forgotten regional solutions for rainwater harvesting (e.g., chultunes, aljibes, and curvatos) [69,70] should be reconsidered and adapted to modern urban design and mitigate UPF.
Recent studies have emphasized the complexity of managing urban pluvial flooding (UPF), highlighting the role of land use change, reduced infiltration, and altered runoff pathways [71]. Urban flood risk assessments could provide valuable tools to drive adequate land use changes, possibly reverting karst environment threats (e.g., [72]). In the Caribbean and Latin America, research by [8,73] demonstrates how unregulated or unplanned urban growth intensifies flood risk, aligning with our findings in Chetumal. Additionally, transformative urbanization should improve science–policy–practice within the Caribbean context to achieve transformative urbanization processes [74]. These parallels reveal persistent governance and infrastructure gaps, reinforcing the need for integrative hydrosocial approaches to better manage UPF in vulnerable, karst–urban landscapes across the region.
Addressing these challenges requires an integrated approach combining hydrological modeling, urban design, and community-based adaptation to reduce flood vulnerability in rapidly urbanizing coastal areas [10]. Consequently, the effectiveness of these approaches depends on a comprehensive understanding of the study area, as models have limitations that can be addressed through qualitative approaches. These insights help validate modeled outputs and may also highlight discrepancies where flooding is either underestimated by models or not perceived by residents. Existing mismatches offer opportunities to improve risk communication strategies, assess the effectiveness of urban interventions for UPF mitigation, inform public policy, guide infrastructure planning, and calibrate early warning systems to better reflect community realities.
Community narratives and observations, derived from their collective memory, revealed local knowledge often absent in technical datasets (e.g., raising home levels, informal protective structures, memory of undocumented UPF events, and shared collective hazards). Field visits, surveys, and community interviews provided essential insights unavailable in existing databases or automated models, including artificial intelligence-based ones. These qualitative methods help identify human actions that exacerbate flooding, institutional constraints, urban transformations, community support mechanisms, and health and infrastructure-related vulnerabilities.
A comparative analysis of methodologies confirms a strong relationship between spatial modeling results and observed flood-affected areas from societal memory, validating the reliability of the applied approaches. However, the need for further research should be highlighted on how collective memory of floods influences social cohesion and risk perception, even among those not directly affected. Analyses based on the field measurements of flow velocities and floodwater levels during UPF events should be further considered in future research efforts. These measurements can support detailed risk assessments, the societal appraisal of UPF events, and the calibration–validation of numerical model outputs.
Social actions, such as improper waste disposal and drainage obstruction, can amplify flood impacts beyond immediate locations, emphasizing the interrelation of urban vulnerabilities [75]. Moreover, the normalization of flood impacts and over-reliance on protective measures could lead to complacency among both population and institutional actors, reducing proactive mitigation efforts, and transforming the societal memory on risk perception [76,77]. To address this challenge, it is imperative that the development of public policies revitalizes collective memory through participatory mechanisms (e.g., social cartography, community-based workshops, emergency drills based on the recognized hazards from UPF events). In parallel, risk communication should be strengthened through culturally sensitive and territorially informed approaches. Such frameworks could promote co-responsibility between institutions and citizens, encouraging joint action in disaster risk management. Educational strategies that connect past experiences with projected risk scenarios could improve awareness and emergency preparedness. Collectively, these actions might foster a conscious, critical, and sustained model of urban resilience—one that integrates technical expertise, societal memory, and civic participation.
The findings of this study provide a basis for developing context-specific public policies in Chetumal, supporting the efforts of civil society, academic institutions, and local authorities. Urban planning should formally integrate risk management by (a) preserving the remaining natural flood-prone areas in the northern portion of the sub-watershed or in the city, (b) restricting urban expansion into low-lying areas and high-runoff zones, and (c) requiring mandatory hydrological impact assessments prior to new developments. Improving community-based flood-risk education and enhancing institutional coordination are also essential. These actions would enable a more effective response to current hydrological dynamics and contribute to the reduction in socioeconomic vulnerabilities. Moreover, the formulation of regulatory frameworks for the implementation of SUDSs and adaptive urban planning is strongly recommended.
Strengthening community resilience is also essential. In this regard, although emergency shelter conditions were not the primary focus, this study highlights the need for further analysis of their accessibility, infrastructure, and public trust in using them during crises. Impacts from flooding related to the abandonment of housing after flooding and the urban dynamics should be further investigated. Moreover, the availability of public Wi-Fi was identified as an issue that could facilitate real-time communication between affected residents and emergency response authorities, when individual connections or properties are damaged, thus improving disaster response coordination. Future studies should examine the role of such digital infrastructure in emergency management and explore strategies to expand these services in public spaces.
Residents’ testimonies indicate that unplanned urban expansion in Chetumal has increased flood vulnerability, despite drainage infrastructure being concentrated in frequently affected zones (Figure 5). Its limited capacity fails to manage runoff effectively, especially after commercial and residential developments during 2012 and 2015, and elevated up to 0.5 m above the street level. Consequently, this urban growth disrupts natural drainage and reduces infiltration, causing floodwaters to be redirected towards older neighborhoods. Institutionally, the location of temporary shelters in flood-prone areas, combined with weak coordination between urban planning and risk management agencies, reflects fragmented governance. Economically, unregulated construction has shifted UPF risks to low-income areas without investing in resilient infrastructure. Socially, while affected communities recognize the causes of their vulnerability, their adaptive capacity is limited by fragmented social networks, insufficient access to technical information, and weak inclusion in urban planning and disaster risk governance.
Overall, while the challenges in the region reflect broader global trends, key issues lie in the limited integration of the societal memory into flood urban planning. Therefore, integrating hydrological modeling with community knowledge through participatory approaches could enhance flood risk management. Combining quantitative tools with local experiences not only improves model accuracy but also could strengthen community empowerment, foster collaboration with authorities, and promote more effective and sustainable urban planning to address extreme hydrometeorological events over karstic coastal urban areas. Finally, water management and policies should consider the watersheds as natural units for the administration of the flood hazard response and urban planning and operation, supported by stakeholder representation and community involvement [78].

5. Conclusions

This study highlights the impacts of urbanization on karstic hydrological urban systems and the relevance of integrating societal memory with spatial modeling. This approach enhanced the accuracy of UPF simulations while simultaneously contextualizing flood impacts through community-based knowledge. This results in the bridging of technical and community-lived experiences.
Model results reveal that urban growth in Chetumal’s karstic environment has orthogonalized the drainage network, increased impervious surfaces, and reduced infiltration capacity. These changes have diminished surface roughness, accelerated runoff, shortened watershed response times, and heightened vulnerability to UPF. Relevant implications from the modeling include the following:
Karstic urban watersheds should be conceptually treated as endorheic systems that may evolve into an exorheic condition due to urbanization. Traditional regional knowledge has primarily focused on their endorheic character, overlooking recent reductions in infiltration caused by land cover changes.
Urban expansion has reshaped runoff dynamics, developed new flood-prone areas, and introduced unexpected hydrological constraints (e.g., damming effects that further cause large water accumulation over the urban limits).
The critical UPF event analyzed demonstrates that coastal urban areas are vulnerable not only to coastal or hurricane-related flooding, but also to increasingly frequent and intense pluvial events.
On the social dimension, frequent flooding increased awareness in highly affected areas. However, rapid and recent urban expansion has altered societal memory, weakening risk perception and reducing preparedness. Therefore, the relationship between risk perception and social memory remains dynamic, actively influencing urban planning decisions and the future impact of UPF events. Consequently, the findings of this study provide a basis for developing context-specific public policies, which should aim at the following: (a) to conserve existing natural flood-prone areas and green spaces; (b) to restrict urban expansion into high-runoff and low-lying zones; (c) to make compulsory hydrological impact assessments for all new developments; (d) to promote SUDSs and adaptative infrastructure; and (e) to recover functional, traditional water management systems. This will effectively support adaptation to evolving hydrometeorological hazards by acknowledging both structural vulnerabilities and social dimensions of risk.

Author Contributions

Conceptualization, D.G.R.-P., J.M.C.-S., and J.C.A.-H.; data curation, C.C.V.-Q., J.M.C.-S., and R.C.-A.; formal analysis, C.C.V.-Q., J.M.C.-S., and R.C.-A.; funding acquisition, D.G.R.-P., J.M.C.-S., R.C.-A., and J.C.A.-H.; investigation, C.C.V.-Q., J.M.C.-S., R.C.-A., and J.C.A.-H.; methodology, D.G.R.-P., J.M.C.-S., and J.C.A.-H.; project administration, D.G.R.-P., J.M.C.-S., R.C.-A., and J.C.A.-H.; resources, C.C.V.-Q., D.G.R.-P., and J.C.A.-H.; software, C.C.V.-Q.; supervision, D.G.R.-P., J.M.C.-S., R.C.-A., and J.C.A.-H.; validation, C.C.V.-Q., J.M.C.-S., and R.C.-A.; visualization, J.C.A.-H.; writing—original draft, C.C.V.-Q. and J.C.A.-H.; writing—review and editing, D.G.R.-P., J.M.C.-S., and R.C.-A. All authors have read and agreed to the published version of the manuscript.

Funding

This research received no external funding. The APC was funded by the authors J.C.A.-H., J.M.C.-S., and R.C.-A.

Data Availability Statement

The original contributions presented in this study are included in the article. Further inquiries can be directed to the corresponding author.

Acknowledgments

Acknowledgements are due to the SECIHTI (Secretariat for Science, Humanities, Technology and Innovation) program ‘Investigadoras e Investigadores por México’ IIxM (Projects 77 and 761). The authors thank the individuals interviewed and surveyed in the study area (Chetumal, Q. Roo., Mexico), particularly the residents of the Proterritorio and Arboledas 2 neighborhoods, who shared their knowledge and experiences for the development of this research.

Conflicts of Interest

The authors declare no conflicts of interest.

References

  1. Rentschler, J.; Salhab, M.; Jafino, B.A. Flood Exposure and Poverty in 188 Countries. Nat. Commun. 2022, 13, 3527. [Google Scholar] [CrossRef] [PubMed]
  2. Glas, H.; Rocabado, I.; Huysentruyt, S.; Maroy, E.; Salazar Cortez, D.; Coorevits, K.; De Maeyer, P.; Deruyter, G. Flood Risk Mapping Worldwide: A Flexible Methodology and Toolbox. Water 2019, 11, 2371. [Google Scholar] [CrossRef]
  3. Manandhar, B.; Cui, S.; Wang, L.; Shrestha, S. Urban Flood Hazard Assessment and Management Practices in South Asia: A Review. Land 2023, 12, 627. [Google Scholar] [CrossRef]
  4. Prokić, M.; Savić, S.; Pavić, D. Pluvial Flooding in Urban Areas across the European Continent. Geogr. Pannonica 2019, 23, 216–232. [Google Scholar] [CrossRef]
  5. Van der Borght, R.; Pallares-Barbera, M. Greening to Shield: The Impacts of Extreme Rainfall on Economic Activity in Latin American Cities. Glob. Environ. Chang. 2024, 87, 102857. [Google Scholar] [CrossRef]
  6. Cea, L.; Sañudo, E.; Montalvo, C.; Farfán, J.; Puertas, J.; Tamagnone, P. Recent Advances and Future Challenges in Urban Pluvial Flood Modelling. Urban Water J. 2025, 22, 149–173. [Google Scholar] [CrossRef]
  7. Pinos, J.; Quesada-Román, A. Flood Risk-Related Research Trends in Latin America and the Caribbean. Water 2021, 14, 10. [Google Scholar] [CrossRef]
  8. Sandoval, V.; Sarmiento, J.P. A Neglected Issue: Informal Settlements, Urban Development, and Disaster Risk Reduction in Latin America and the Caribbean. Disaster Prev. Manag. Int. J. 2020, 29, 731–745. [Google Scholar] [CrossRef]
  9. Othmer, F.J.; Becker, D.; Schulte, L.M.; Greiving, S. A Methodological Approach to Municipal Pluvial Flood Risk Assessment Based on a Small City Case Study. Sustainability 2020, 12, 10487. [Google Scholar] [CrossRef]
  10. Azizi, K.; Diko, S.K.; Saija, L.; Zamani, M.G.; Meier, C.I. Integrated Community-Based Approaches to Urban Pluvial Flooding Research, Trends and Future Directions: A Review. Urban Clim. 2022, 44, 101237. [Google Scholar] [CrossRef]
  11. Rosenzweig, B.R.; McPhillips, L.; Chang, H.; Cheng, C.; Welty, C.; Matsler, M.; Iwaniec, D.; Davidson, C.I. Pluvial Flood Risk and Opportunities for Resilience. WIREs Water 2018, 5, e1302. [Google Scholar] [CrossRef]
  12. Fowler, H.J.; Ali, H.; Allan, R.P.; Ban, N.; Barbero, R.; Berg, P.; Blenkinsop, S.; Cabi, N.S.; Chan, S.; Dale, M.; et al. Towards Advancing Scientific Knowledge of Climate Change Impacts on Short-Duration Rainfall Extremes. Philos. Trans. R. Soc. A Math. Phys. Eng. Sci. 2021, 379, 20190542. [Google Scholar] [CrossRef]
  13. Singh, H.; Nielsen, M.; Greatrex, H. Causes, Impacts, and Mitigation Strategies of Urban Pluvial Floods in India: A Systematic Review. Int. J. Disaster Risk Reduct. 2023, 93, 103751. [Google Scholar] [CrossRef]
  14. Di Baldassarre, G.; Viglione, A.; Carr, G.; Kuil, L.; Salinas, J.L.; Blöschl, G. Socio-Hydrology: Conceptualising Human-Flood Interactions. Hydrol. Earth Syst. Sci. 2013, 17, 3295–3303. [Google Scholar] [CrossRef]
  15. Di Baldassarre, G. Socio-Hydrology of Floods. In Oxford Research Encyclopedia of Natural Hazard Science; Oxford University Press: Oxford, UK, 2017. [Google Scholar]
  16. Camargo, A.; Cortesi, L. Flooding Water and Society. WIREs Water 2019, 6, e1374. [Google Scholar] [CrossRef]
  17. Madani, K.; Shafiee-Jood, M. Socio-Hydrology: A New Understanding to Unite or a New Science to Divide? Water 2020, 12, 1941. [Google Scholar] [CrossRef]
  18. Wesselink, A.; Kooy, M.; Warner, J. Socio-hydrology and Hydrosocial Analysis: Toward Dialogues across Disciplines. WIREs Water 2017, 4, e1196. [Google Scholar] [CrossRef]
  19. Caretta, M.A.; Fernandez, R.; Zegre, N.; Shinn, J. Flooding Hazard and Vulnerability. An Interdisciplinary Experimental Approach for the Study of the 2016 West Virginia Floods. Front. Water 2021, 3, 656417. [Google Scholar] [CrossRef]
  20. Ross, A.; Chang, H. Socio-Hydrology with Hydrosocial Theory: Two Sides of the Same Coin? Hydrol. Sci. J. 2020, 65, 1443–1457. [Google Scholar] [CrossRef]
  21. Carey, M.; Baraer, M.; Mark, B.G.; French, A.; Bury, J.; Young, K.R.; McKenzie, J.M. Toward Hydro-Social Modeling: Merging Human Variables and the Social Sciences with Climate-Glacier Runoff Models (Santa River, Peru). J. Hydrol. 2014, 518, 60–70. [Google Scholar] [CrossRef]
  22. Ridolfi, E.; Mondino, E.; Di Baldassarre, G. Hydrological Risk: Modeling Flood Memory and Human Proximity to Rivers. Hydrol. Res. 2021, 52, 241–252. [Google Scholar] [CrossRef]
  23. Garde-Hansen, J.; McEwen, L.; Holmes, A.; Jones, O. Sustainable Flood Memory: Remembering as Resilience. Mem. Stud. 2017, 10, 384–405. [Google Scholar] [CrossRef]
  24. Bauer-Gottwein, P.; Gondwe, B.R.N.; Charvet, G.; Marín, L.E.; Rebolledo-Vieyra, M.; Merediz-Alonso, G. Review: The Yucatán Peninsula Karst Aquifer, Mexico. Hydrogeol. J. 2011, 19, 507–524. [Google Scholar] [CrossRef]
  25. Day, M. Challenges to Sustainability in the Caribbean Karst. Geol. Croat. 2010, 63, 149–154. [Google Scholar] [CrossRef]
  26. Gencer, E.A. An Overview of Urban Vulnerability to Natural Disasters and Climate Change in Central America & the Caribbean Region. FEEM Working Paper No. 78; 2013. Available online: https://ageconsearch.umn.edu/record/158728?v=pdf (accessed on 16 June 2025).
  27. Jones, I.C.; Banner, J.L. Estimating Recharge Thresholds in Tropical Karst Island Aquifers: Barbados, Puerto Rico and Guam. J. Hydrol. 2003, 278, 131–143. [Google Scholar] [CrossRef]
  28. Day, M. The Karstlands of Antigua, Their Land Use and Conservation. Geogr. J. 2007, 173, 170–185. [Google Scholar] [CrossRef]
  29. Rioja-Nieto, R.; Garza-Pérez, R.; Álvarez-Filip, L.; Ismael, M.-T.; Cecilia, E. The Mexican Caribbean: From Xcalak to Holbox. In World Seas: An Environmental Evaluation; Elsevier: Amsterdam, The Netherlands, 2019; pp. 637–653. [Google Scholar]
  30. INEGI Modelo Digital de Elevación Tipo Terreno/Superficie Con 5m de Resolución Derivado de Datos de Sensores Remotos Satelitales y Aerotransportados (E16A65F2, E16A65F4, E16A66A3, E16A66D1, E16A66D3, E16A76A1, E16A66A4, E16A66D2, E16A66D4, E16A66B3, E16A66E1). Available online: https://www.inegi.org.mx/app/mapas/ (accessed on 15 January 2025).
  31. SEDATU. Programa de Desarrollo Urbano de Chetumal, Calderitas, Subteniente López, Huay Pix y Xul-Há; H. Ayuntamiento de Othón P. Blanco, Quintana Roo-Secretaría de Desarrollo Agrario, Territorial y Urbano: Chetumal, Mexico, 2018. [Google Scholar]
  32. INEGI Información Demográfica y Social. Censos y Conteos de Población. Available online: https://www.inegi.org.mx/programas/ccpv/2020/ (accessed on 24 November 2024).
  33. Alcérreca-Huerta, J.C.; Callejas-Jiménez, M.E.; Carrillo, L. Small-Scale Energy Potential from Salinity Gradients at a Transboundary Riverine Estuary in the Yucatán Peninsula. Clean. Eng. Technol. 2022, 11, 100562. [Google Scholar] [CrossRef]
  34. Corrales-Suastegui, A.; Fuentes-Franco, R.; Pavia, E.G. The Mid-summer Drought over Mexico and Central America in the 21st Century. Int. J. Climatol. 2020, 40, 1703–1715. [Google Scholar] [CrossRef]
  35. Magaña, V.; Amador, J.A.; Medina, S. The Midsummer Drought over Mexico and Central America. J. Clim. 1999, 12, 1577–1588. [Google Scholar] [CrossRef]
  36. Rodríguez Alarcón, M.N. Huracán Janet y El Desastre de 1955 En Quintana Roo. Antrópica. Rev. De Cienc. Soc. Y Humanidades 2019, 5, 161–190. [Google Scholar] [CrossRef]
  37. Camacho-Sanabria, J.M.; Chávez-Alvarado, R.; Álvarez-Trinidad, J.A.; Velázquez-Torres, D. Index of Coastal Urban Resilience (ICURHF) When Coping with Hurricanes and Floods in the City of Chetumal, in the South East of Mexico. In GIS LATAM: First Conference, GIS LATAM 2020; Mata-Rivera, M.F., Zagal-Flores, R., Arellano Verdejo, J., Lazcano Hernandez, H.E., Eds.; Communications in Computer and Information Science; Springer: Cham, Switzerland, 2020; Volume 1276, pp. 136–150. [Google Scholar]
  38. Hardoy, J.; Hernández, I.; Pacheco, J.A.; Sierra, G. Institutionalizing Climate Change Adaptation at Municipal and State Level in Chetumal and Quintana Roo, Mexico. Environ. Urban. 2014, 26, 69–85. [Google Scholar] [CrossRef]
  39. Frausto, O.; Vazquez, A.; Arroyo, L.; Castillo, L.; Hernández, M.L. Hurricane Resilience Indicators in Mexican Caribbean Coastal Cities. Int. J. Saf. Secur. Eng. 2016, 6, 755–763. [Google Scholar] [CrossRef]
  40. Hernández, M.L.; Carreño, M.L.; Castillo, L. Methodologies and Tools of Risk Management: Hurricane Risk Index (HRi). Int. J. Disaster Risk Reduct. 2018, 31, 926–937. [Google Scholar] [CrossRef]
  41. Martínez Méndez, A.; Travieso Bello, A.C.; Frausto Martínez, O. Resiliencia Del Sistema de Drenaje Pluvial Ante Inundaciones: Caso de Estudio Chetumal, Quintana Roo, México. Antrópica. Revista Ciencias Sociales Humanidades 2018, 4, 273–300. [Google Scholar] [CrossRef]
  42. Strahler, A.N. Quantitative Analysis of Watershed Geomorphology. Eos Trans. Am. Geophys. Union 1957, 38, 913–920. [Google Scholar] [CrossRef]
  43. Bladé, E.; Cea, L.; Corestein, G.; Escolano, E.; Puertas, J.; Vázquez-Cendón, E.; Dolz, J.; Coll, A. Iber: Herramienta de Simulación Numérica Del Flujo En Ríos. Rev. Int. Métodos Numéricos Cálculo Diseño Ing. 2014, 30, 1–10. [Google Scholar] [CrossRef]
  44. García-Feal, O.; González-Cao, J.; Gómez-Gesteira, M.; Cea, L.; Domínguez, J.M.; Formella, A. An Accelerated Tool for Flood Modelling Based on Iber. Water 2018, 10, 1459. [Google Scholar] [CrossRef]
  45. Mockus, V. Hydrologic Soil Cover Complexes. In Part 630 Hydrology National Engineering Handbook; Natural Resources Conservation Service (NRCS)/Agricultural Research Service (ARS) Curve Number Work Group: Beltsville, MD, USA, 2004; p. 20. [Google Scholar]
  46. Mishra, S.K.; Singh, V.P. SCS-CN Method. In Soil Conservation Service Curve Number (SCS-CN) Methodology; Water Science and Technology Library; Springer: Dordrecht, The Netherlands, 2003; Volume 42, pp. 84–146. [Google Scholar]
  47. INEGI. Información Vectorial de Localidades Amanzanadas y Números Exteriores 2023, Othón P. Blanco. Available online: https://www.inegi.org.mx/app/mapas/ (accessed on 16 January 2025).
  48. Chow, V.T. Hidraulica de Canales Abiertos; McGraw-Hill: Santa fé de Bogotá, Colombia, 1994; ISBN 978-958-600-228-8. [Google Scholar]
  49. USBR. ACER Technical Memorandum No. 11, Assistant Commissioner—Engineering and Research, United States Bureau of Reclamation; United States Bureau of Reclamation: Denver, CO, USA, 1988; p. 57.
  50. Berndt, A.E. Sampling Methods. J. Hum. Lact. 2020, 36, 224–226. [Google Scholar] [CrossRef]
  51. Berne, A.; Delrieu, G.; Creutin, J.-D.; Obled, C. Temporal and Spatial Resolution of Rainfall Measurements Required for Urban Hydrology. J. Hydrol. 2004, 299, 166–179. [Google Scholar] [CrossRef]
  52. Ghosh, I.; Hellweger, F.L. Effects of Spatial Resolution in Urban Hydrologic Simulations. J. Hydrol. Eng. 2012, 17, 129–137. [Google Scholar] [CrossRef]
  53. Ichiba, A.; Gires, A.; Tchiguirinskaia, I.; Schertzer, D.; Bompard, P.; Ten Veldhuis, M.-C. Scale Effect Challenges in Urban Hydrology Highlighted with a Distributed Hydrological Model. Hydrol. Earth Syst. Sci. 2018, 22, 331–350. [Google Scholar] [CrossRef]
  54. Li, J.; Wong, D.W.S. Effects of DEM Sources on Hydrologic Applications. Comput. Environ. Urban Syst. 2010, 34, 251–261. [Google Scholar] [CrossRef]
  55. Muthusamy, M.; Casado, M.R.; Butler, D.; Leinster, P. Understanding the Effects of Digital Elevation Model Resolution in Urban Fluvial Flood Modelling. J. Hydrol. 2021, 596, 126088. [Google Scholar] [CrossRef]
  56. Huang, Q.; Wang, J.; Li, M.; Fei, M.; Dong, J. Modeling the Influence of Urbanization on Urban Pluvial Flooding: A Scenario-Based Case Study in Shanghai, China. Nat. Hazards 2017, 87, 1035–1055. [Google Scholar] [CrossRef]
  57. Feng, B.; Zhang, Y.; Bourke, R. Urbanization Impacts on Flood Risks Based on Urban Growth Data and Coupled Flood Models. Nat. Hazards 2021, 106, 613–627. [Google Scholar] [CrossRef]
  58. Bruwier, M.; Maravat, C.; Mustafa, A.; Teller, J.; Pirotton, M.; Erpicum, S.; Archambeau, P.; Dewals, B. Influence of Urban Forms on Surface Flow in Urban Pluvial Flooding. J. Hydrol. 2020, 582, 124493. [Google Scholar] [CrossRef]
  59. Mediero, L.; Soriano, E.; Oria, P.; Bagli, S.; Castellarin, A.; Garrote, L.; Mazzoli, P.; Mysiak, J.; Pasetti, S.; Persiano, S.; et al. Pluvial Flooding: High-Resolution Stochastic Hazard Mapping in Urban Areas by Using Fast-Processing DEM-Based Algorithms. J. Hydrol. 2022, 608, 127649. [Google Scholar] [CrossRef]
  60. Li, X.; Willems, P. A Hybrid Model for Fast and Probabilistic Urban Pluvial Flood Prediction. Water Resour. Res. 2020, 56, e2019WR025128. [Google Scholar] [CrossRef]
  61. Schmitt, T.G.; Scheid, C. Evaluation and Communication of Pluvial Flood Risks in Urban Areas. WIREs Water 2020, 7, e1401. [Google Scholar] [CrossRef]
  62. Woods Ballard, B.W.; Udale-Clarke, H.; Illman, S.; Scott, T.; Ashley, R.; Kellagher, R. The SuDS Manual, 6th ed.; CIRIA: London, UK, 2015; ISBN 978-0-86017-760-9. [Google Scholar]
  63. Fletcher, T.D.; Andrieu, H.; Hamel, P. Understanding, Management and Modelling of Urban Hydrology and Its Consequences for Receiving Waters: A State of the Art. Adv. Water Resour. 2013, 51, 261–279. [Google Scholar] [CrossRef]
  64. Davis, A.P.; Hunt, W.F.; Traver, R.G.; Clar, M. Bioretention Technology: Overview of Current Practice and Future Needs. J. Environ. Eng. 2009, 135, 109–117. [Google Scholar] [CrossRef]
  65. Martín Muñoz, S.; Elliott, S.; Schoelynck, J.; Staes, J. Urban Stormwater Management Using Nature-Based Solutions: A Review and Conceptual Model of Floodable Parks. Land 2024, 13, 1858. [Google Scholar] [CrossRef]
  66. Vymazal, J. Constructed Wetlands for Wastewater Treatment: Five Decades of Experience. Environ. Sci. Technol. 2011, 45, 61–69. [Google Scholar] [CrossRef] [PubMed]
  67. Kelly, S.; Robinson, J. FD2619 Developing Urban Blue Corridors: Scoping Study; Department for Environment, Food & Rural Affairs (DEFRA): London, UK, 2011.
  68. Rodríguez-Rojas, M.I.; Garrido-Jiménez, F.J.; Abarca-Álvarez, F.J.; Vallecillos-Siles, M.R. Advances in the Integration of Sustainable Drainage Systems into Urban Planning: A Case Study. Sustainability 2024, 16, 2658. [Google Scholar] [CrossRef]
  69. Llanes Salazar, R. El Agua En Las Humanidades y Ciencias Sociales de Yucatán. Una Introducción al Dosier. Península 2024, 20, 31–43. [Google Scholar] [CrossRef]
  70. Checa-Artasu, M.M. Aproximación Turístico Cultural Para Un Patrimonio En Vías de Extinción: La Arquitectura Histórica En Madera de Chetumal, Quintana Roo. El Periplo Sustentable 2012, 23, 49–78. [Google Scholar]
  71. Alshammari, E.; Rahman, A.A.; Rainis, R.; Seri, N.A.; Fuzi, N.F.A. The Impacts of Land Use Changes in Urban Hydrology, Runoff and Flooding: A Review. Curr. Urban Stud. 2023, 11, 120–141. [Google Scholar] [CrossRef]
  72. Tang, J.; Liu, D.; Shang, C.; Niu, J. Impacts of Land Use Change on Surface Infiltration Capacity and Urban Flood Risk in a Representative Karst Mountain City over the Last Two Decades. J. Clean. Prod. 2024, 454, 142196. [Google Scholar] [CrossRef]
  73. Rivosecchi, A.; Singh, M. Small Island City Flood Risk Assessment: The Case of Kingston, Jamaica. Water 2023, 15, 3936. [Google Scholar] [CrossRef]
  74. Mycoo, M.A. Caribbean Island Cities. Urban Issues, Urbanization Processes and Opportunities for Transformation. In The Routledge Handbook of Urban Studies in Latin America and the Caribbean; González-Pérez, J.M., Irazábal, C., Lois-González, R.C., Eds.; Routledge: New York, NY, USA, 2022; p. 24. [Google Scholar]
  75. Aziz, F.; Wang, X.; Qasim Mahmood, M.; Guild, R. Wastewater Flooding Risk Assessment for Coastal Communities: Compound Impacts of Climate Change and Population Growth. J. Hydrol. 2024, 645, 132136. [Google Scholar] [CrossRef]
  76. Luís, S.; Pinho, L.; Lima, M.L.; Roseta-Palma, C.; Martins, F.C.; Betâmio de Almeida, A. Is It All about Awareness? The Normalization of Coastal Risk. J. Risk Res. 2016, 19, 810–826. [Google Scholar] [CrossRef]
  77. Pfister, C. “The Monster Swallows You”: Disaster Memory and Risk Culture in Western Europe, 1500–2000. RCC Perspect. 2011, 1, 1–23. [Google Scholar]
  78. Warner, J.; Wester, P.; Bolding, A. Going with the Flow: River Basins as the Natural Units for Water Management? Water Policy 2008, 10, 121–138. [Google Scholar] [CrossRef]
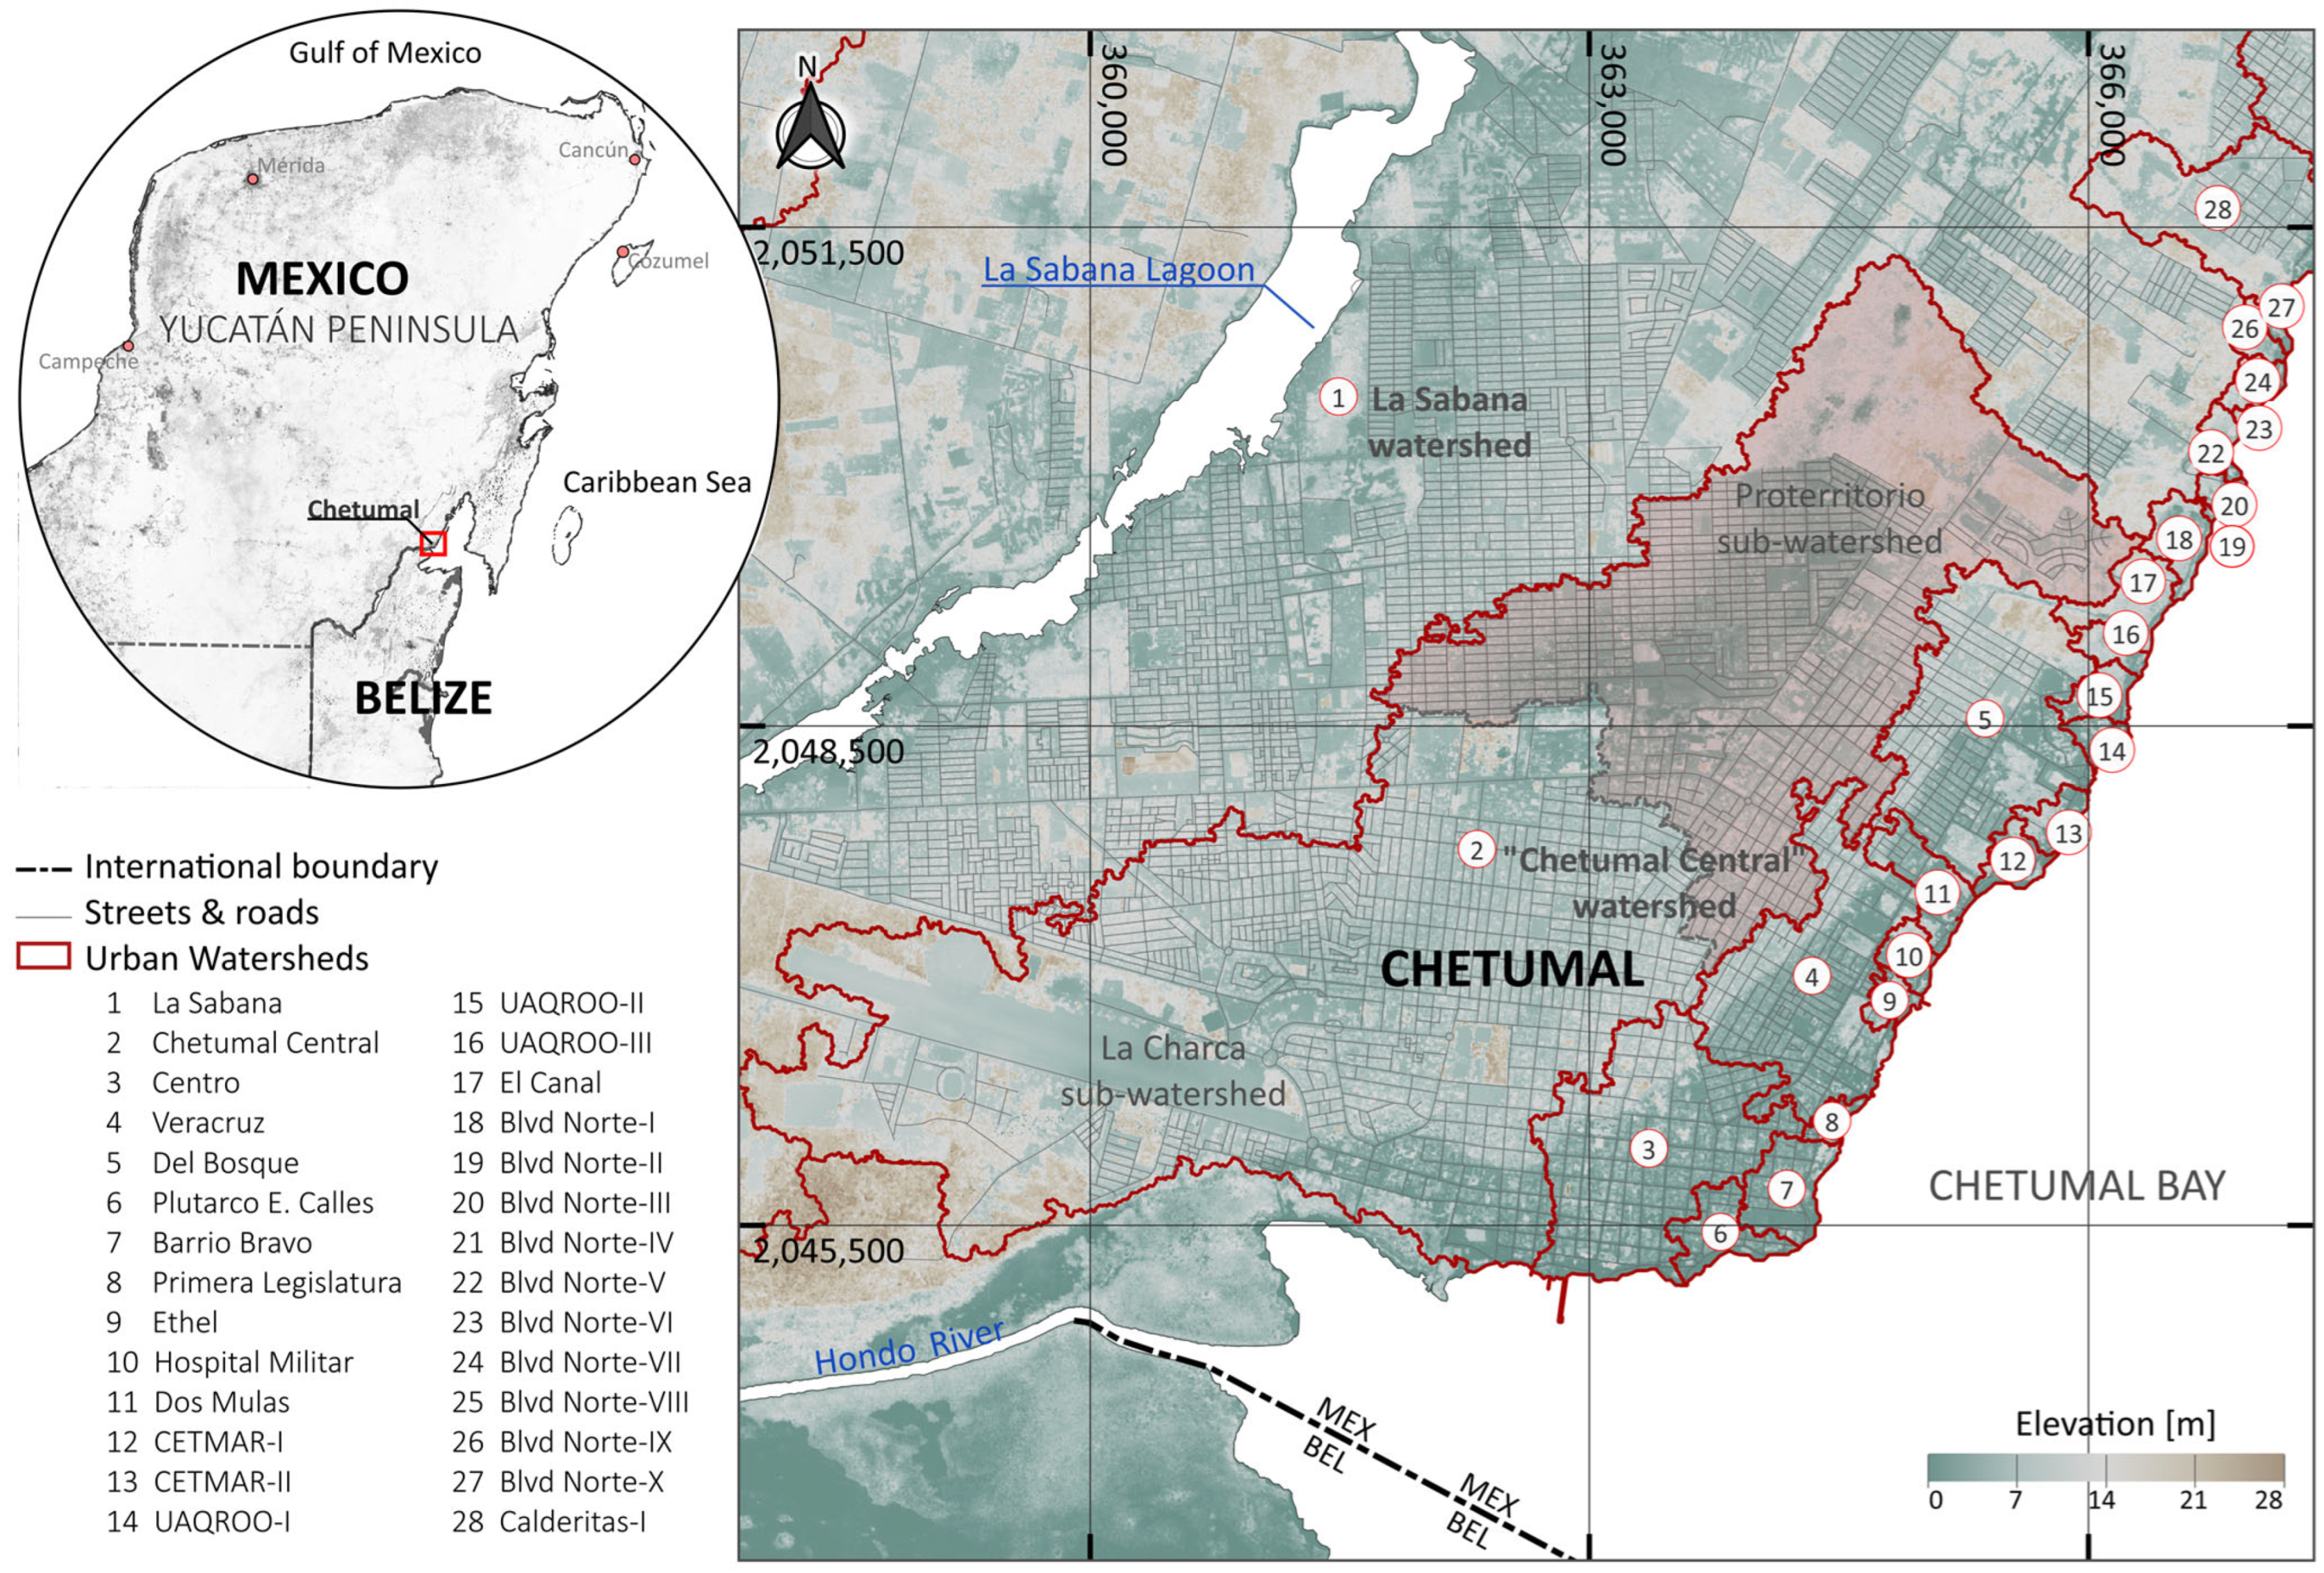
Figure 1. Urban watersheds, sub-watersheds, and elevation map of Chetumal City defined based on available Digital Elevation Models from [30]. Streets, roads, and water bodies around the urban area are also shown (Coordinate Reference System WGS84-UTM16N).
Environments 12 00237 g001
Figure 2. Historical urban growth towards the Proterritorio sub-watershed and channel drainage network changes for the years (A) 1928, (B) 1998, and (C) 2015 (Coordinate Reference System WGS84-UTM16N).
Environments 12 00237 g002
Figure 3. (A) The flooded areas for the different modeled scenarios, describing the water levels reached throughout the simulated UPF event. (B) The relationship between the average velocity of the drainage network (Vmean,DN) and both the mean (Vmean,MS) and maximum (Vmax,MS) velocities of the mainstream evaluated at different time steps (79, 100, 130, 160, 190, and 220 h) in the modeled UPF scenarios.
Environments 12 00237 g003
Figure 4. The results from the numerical modeling of the UPF event of 2015 for the urbanization scenarios of (A) 1928, (B) 1998, and (C) 2015, after 220 h of initiation, and considering the historical modifications of the Proterritorio sub-watershed (Coordinate Reference System WGS84-UTM16N).
Environments 12 00237 g004
Figure 5. (A) The distribution of inhabitants within an urban block at the Proterritorio sub-watershed. The comparison of flood levels based on the inhabitants’ appraisal given in the semi-structure interviews (B) and the results from the numerical model (C). Public temporary shelters, business units, and public schools are also presented (Coordinate Reference System WGS84-UTM16N).
Environments 12 00237 g005
Table 1. The description of the categories of flood danger for passenger vehicles, adults, and children just considering the flood water depth modified from [49].
CategoryWater Depth [m]Danger Description
VehiclesAdultsChildren
Very low0.10–0.30Occupants of almost any size in a passenger vehicle are not in serious danger.An adult of almost any size is not seriously threatened by flood water.A child of almost any size (excluding infants) is not seriously threatened by flood water.
Low0.30–0.50Incipient motion and limited maneuverability of passenger vehicles
Medium–High0.50–0.75Danger is based on the features of the passenger vehicle.A loss of stability for a child and danger based on the child’s features
0.75–1.00
Very High>1.00Occupants of almost any size in a passenger vehicle are in danger.A loss of stability for adults and danger from flood waterA child of almost any size is in danger from flood water.
Table 2. Land cover areas, roughness, and CN-values considering impervious areas and the open space within the Proterritorio sub-watershed for the years 1928, 1998, and 2015. Total sub-watershed area and composite CNII-value are also provided.
Land Cover Subareas, AiManning Roughness [−]CN-Value [−]Coverage [ha]
192819982015
Open space:
-
A1: lawns, parks, cemeteries, vacant lots (with grass cover >50%)
0.030390248.1341.1
-
A2: non-urbanized area (tropical forest)
0.06055585.4132.286.9
Impervious areas:
-
A3: paved streets, curbs, sidewalks, parking lots
0.0209806.0127.8
-
A4: dirt road area
0.01072093.40.00
-
A5: building basal area
0.015980122.4147.7
Total sub-watershed area585.4601.9702.3
Composite CNII-value55.060.264.2
Sub-watershed roughness0.0600.0300.029
Table 3. The average velocities of the drainage network (Vmean,DN) and the mean and maximum velocity of the mainstream (Vmean,MS, Vmax,MS) developed along the UPF event under the different modeled scenarios (1928, 1998, and 2015).
YearFlow VelocitiesTime of the Flooding EventAverage
79 h100 h130 h160 h190 h220 h
1928VDN,mean [m/s]:0.0060.0030.0070.0050.0030.0020.004
VMS,mean [m/s]:0.0070.0070.0210.0150.0100.0090.012
VMS,max [m/s]:0.0290.0290.0680.0470.0330.0370.041
1998VDN,mean [m/s]:0.0120.0090.0110.0090.0070.0120.010
VMS,mean [m/s]:0.0110.0050.0280.0220.0090.0660.024
VMS,max [m/s]:0.2410.2630.4570.3820.6080.6650.436
2015VDN,mean [m/s]:0.0130.0100.0130.0110.0100.0120.012
VMS,mean [m/s]:0.0200.0060.0420.0240.0100.0810.031
VMS,max [m/s]:0.5670.4621.2300.8720.3251.7530.868
Disclaimer/Publisher’s Note: The statements, opinions and data contained in all publications are solely those of the individual author(s) and contributor(s) and not of MDPI and/or the editor(s). MDPI and/or the editor(s) disclaim responsibility for any injury to people or property resulting from any ideas, methods, instructions or products referred to in the content.