


Assessing Environmental Risk Posed by Pharmaceuticals and Personal Care Products in Shallow Lakes, Florida, USA—Part B


Abstract

1. Introduction
2. Materials and Methods
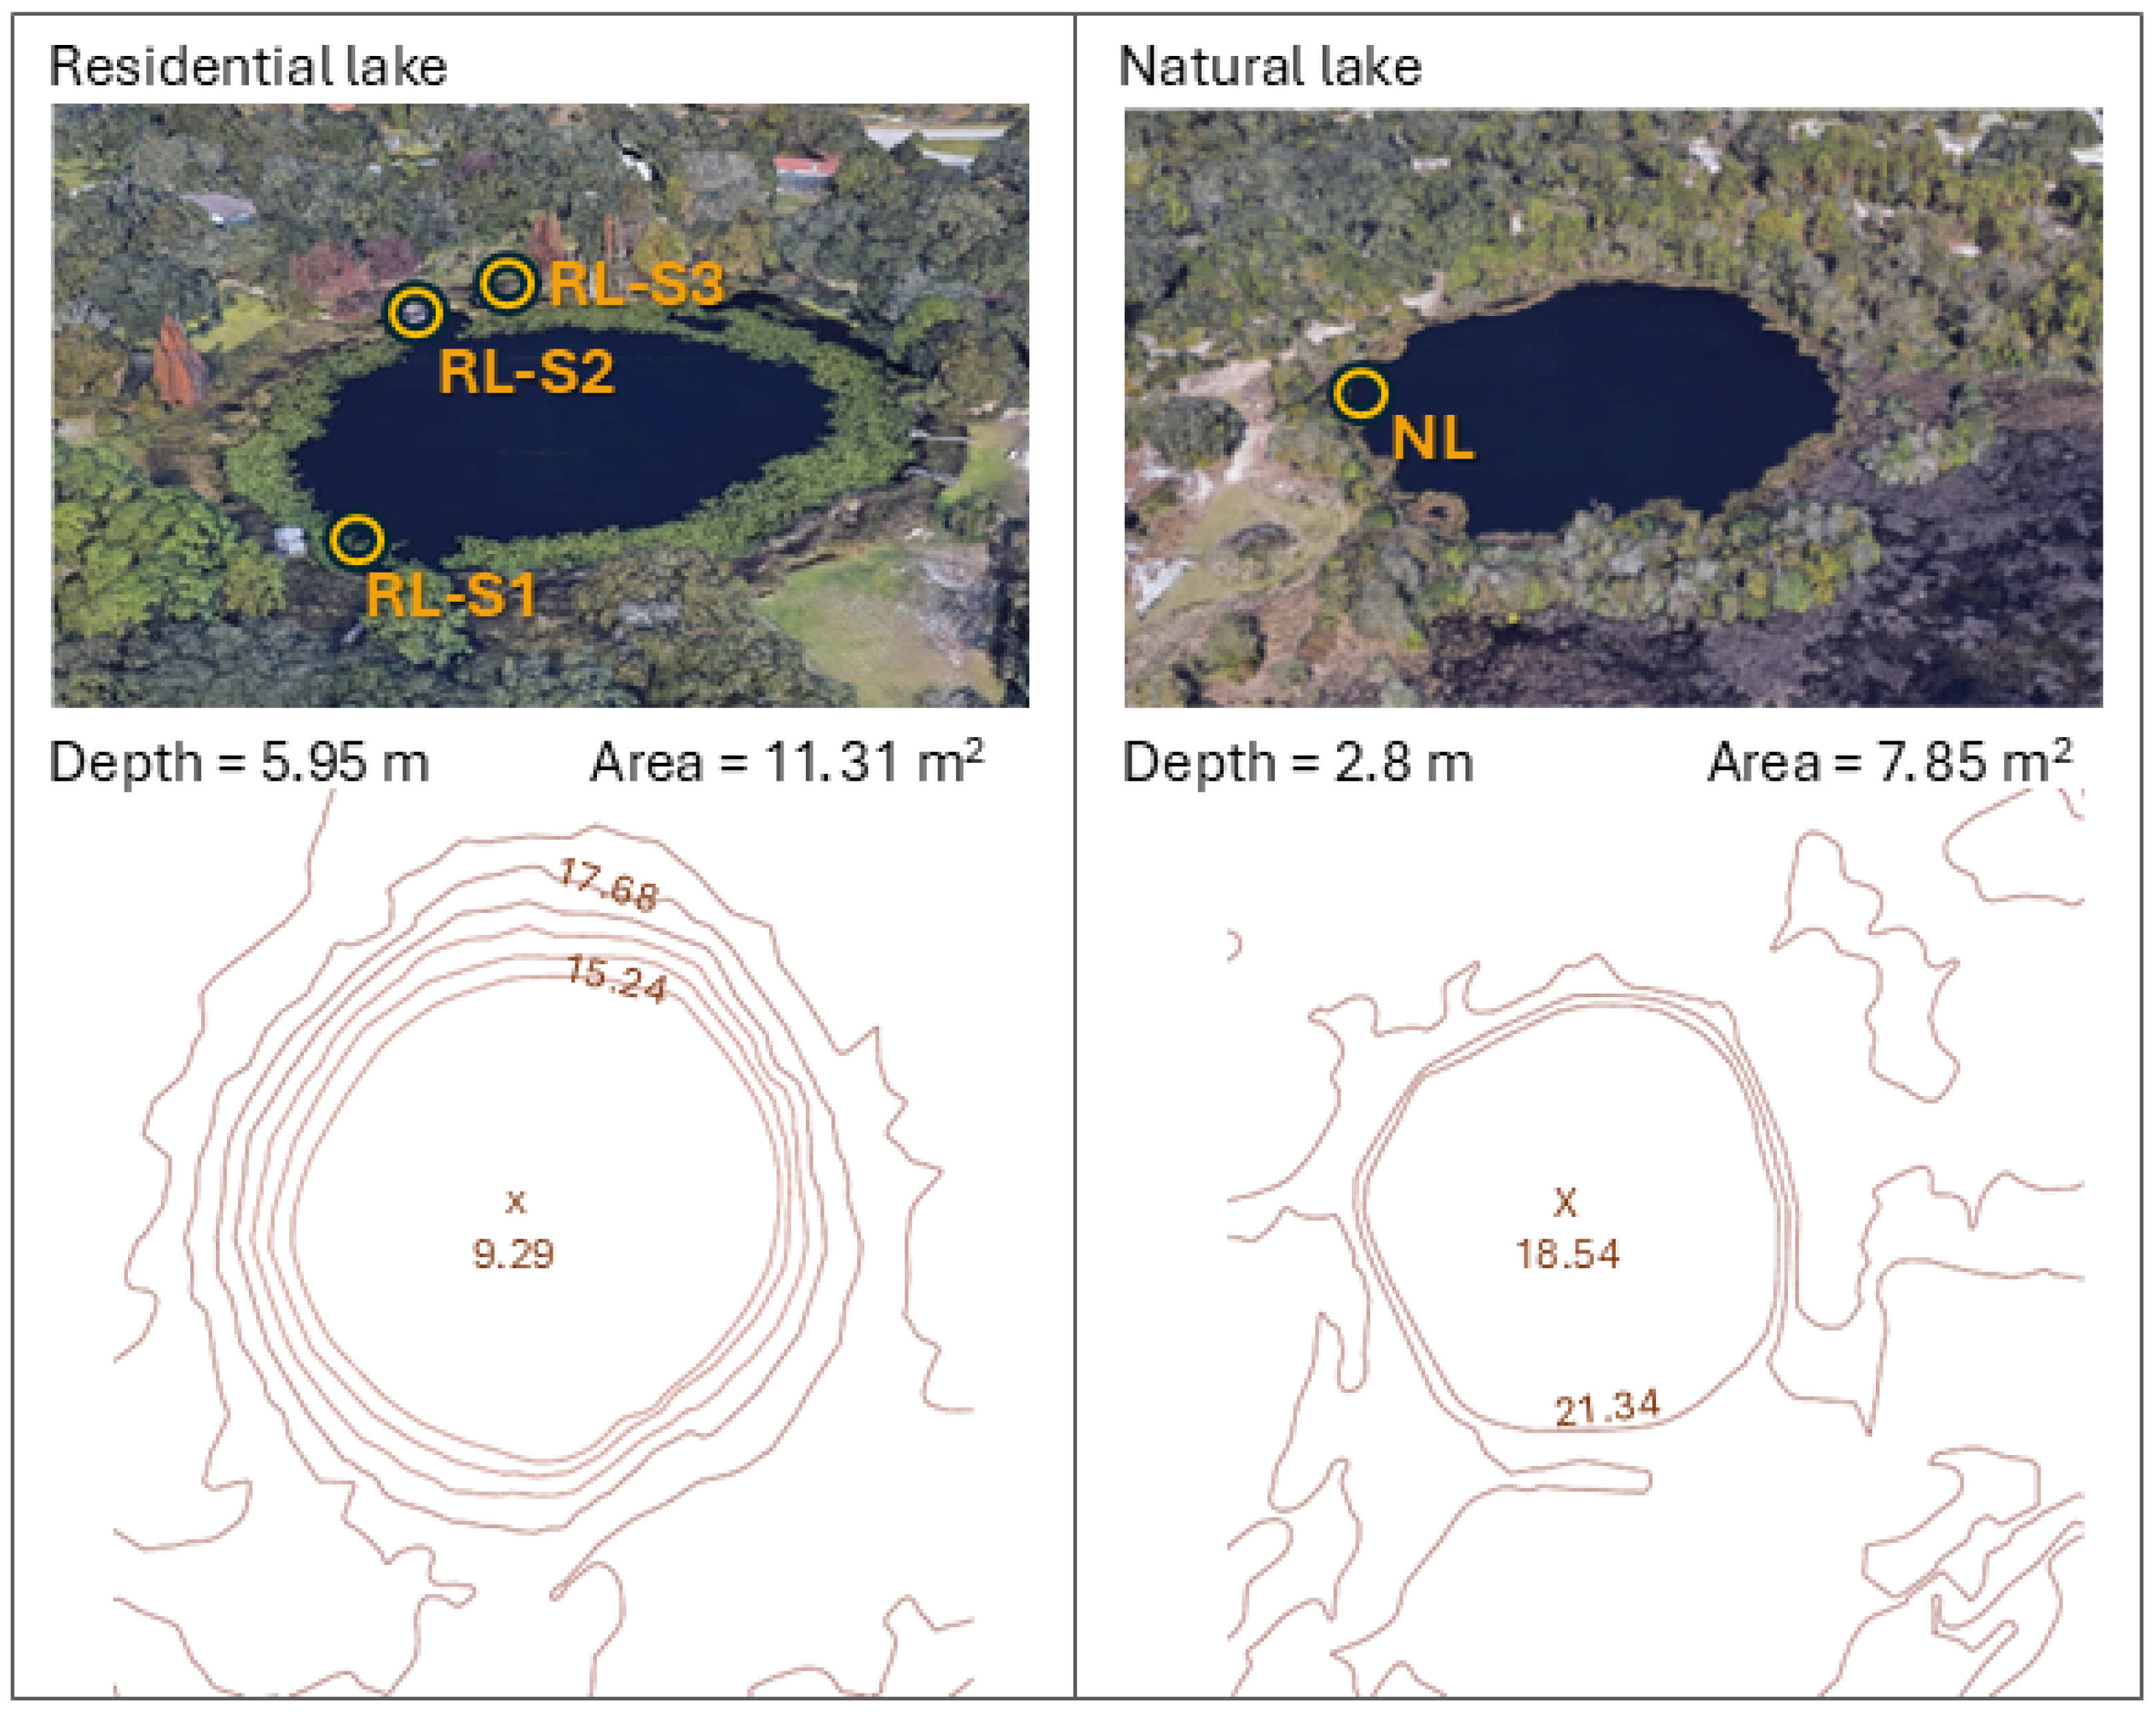
2.1. Study Area
2.2. Water Sampling and Analyses
2.3. Ecological Risk Assessment
- The maximum PPCP concentrations detected throughout the sampling campaign (RQmax).
- The maximum PPCP concentrations recorded during the dry and wet seasons (RQmax-dry and RQmax-wet).
- The mean PPCP concentrations observed during the dry and wet seasons (RQmean-dry and RQmean-wet).
2.4. Statistical Analysis
3. Results
3.1. Risk Assesment for Maxiumum PPCP Concentrations
3.2. Risk Assessment for Mean PPCP Concentrations
3.3. Risk Assessment for Maximum PPCP Concentrations During the Dry and Wet Seasons
3.4. Risk Assessment for Mean PPCP Concentrations During the Dry and Wet Seasons
4. Discussion
4.1. Aquatic Trophic Levels and Environmental Risk Assessment
4.2. Seasonal Risk to Aquatic Organisms
4.3. Concentration Level: Maximum or Mean?
4.4. Assumptions and Limitations
5. Conclusions
Supplementary Materials
Author Contributions
Funding
Data Availability Statement
Acknowledgments
Conflicts of Interest
References
- Gao, Q.; Blum, K.M.; Gago-Ferrero, P.; Wiberg, K.; Ahrens, L.; Andersson, P.L. Impact of On-Site Wastewater Infiltration Systems on Organic Contaminants in Groundwater and Recipient Waters. Sci. Total Environ. 2019, 651, 1670–1679. [Google Scholar] [CrossRef] [PubMed]
- Junaid, M.; Wang, Y.; Hamid, N.; Deng, S.; Li, W. Prioritizing Selected PPCPs on the Basis of Environmental and Toxicogenetic Concerns: A Toxicity Estimation to Confirmation Approach. J. Hazard. Mater. 2019, 380, 120828. [Google Scholar] [CrossRef]
- Brausch, J.M.; Connors, K.; Brooks, B.W.; Rand, G.M. Human Pharmaceuticals in the Aquatic Environment: A Review of Recent Toxicological Studies and Considerations for Toxicity Testing. In Reviews of Environmental Contamination and Toxicology; Whitacre, D.M., Ed.; Springer: Boston, MA, USA, 2012; pp. 1–99. [Google Scholar]
- Keerthanan, S.; Jayasinghe, C.; Biswas, J.K.; Vithanage, M. Pharmaceutical and Personal Care Products (PPCPs) in the Environment: Plant Uptake, Translocation, Bioaccumulation, and Human Health Risks. Crit. Rev. Environ. Sci. Technol. 2021, 51, 1221–1258. [Google Scholar] [CrossRef]
- Liu, N.; Jin, X.; Feng, C.; Wang, Z.; Wu, F.; Johnson, A.C.; Xiao, H.; Hollert, H.; Giesy, J.P. Ecological Risk Assessment of Fifty Pharmaceuticals and Personal Care Products (PPCPs) in Chinese Surface Waters: A Proposed Multiple-Level System. Environ. Int. 2020, 136, 105454. [Google Scholar] [CrossRef] [PubMed]
- Hernando, M.D.; Mezcua, M.; Fern, A.R.; Barcel, D. Environmental Risk Assessment of Pharmaceutical Residues in Wastewater Effluents, Surface Waters and Sediments. Talanta 2006, 69, 334–342. [Google Scholar] [CrossRef]
- Blair, B.D.; Crago, J.P.; Hedman, C.J.; Klaper, R.D. Pharmaceuticals and Personal Care Products Found in the Great Lakes above Concentrations of Environmental Concern. Chemosphere 2013, 93, 2116–2123. [Google Scholar] [CrossRef]
- Tewari, S.; Jindal, R.; Kho, Y.L.; Eo, S.; Choi, K. Chemosphere Major Pharmaceutical Residues in Wastewater Treatment Plants and Receiving Waters in Bangkok, Thailand, and Associated Ecological Risks. Chemosphere 2013, 91, 697–704. [Google Scholar] [CrossRef]
- Beiras, R. Environmental Risk Assessment of Pharmaceutical and Personal Care Products in Estuarine and Coastal Waters. In Pharmaceuticals in Marine and Coastal Environments; Duran-Alvarez, J.C., Jiménez-Cisneros, B., Eds.; Elsevier: Amsterdam, The Netherlands, 2021; pp. 195–252. [Google Scholar]
- Li, Z.; Xiang, X.; Li, M.; Ma, Y.; Wang, J.; Liu, X. Occurrence and Risk Assessment of Pharmaceuticals and Personal Care Products and Endocrine Disrupting Chemicals in Reclaimed Water and Receiving Groundwater in China. Ecotoxicol. Environ. Saf. 2015, 119, 74–80. [Google Scholar] [CrossRef]
- Gilart, N.; Marcé, R.M.; Borrull, F.; Fontanals, N. Determination of Pharmaceuticals in Wastewaters Using Solid-Phase Extraction-Liquid Chromatography-Tandem Mass Spectrometry. J. Sep. Sci. 2012, 35, 875–882. [Google Scholar] [CrossRef]
- Petrie, B.; Youdan, J.; Barden, R.; Kasprzyk-Hordern, B. Multi-Residue Analysis of 90 Emerging Contaminants in Liquid and Solid Environmental Matrices by Ultra-High-Performance Liquid Chromatography Tandem Mass Spectrometry. J. Chromatogr. A 2016, 1431, 64–78. [Google Scholar] [CrossRef]
- Althakafy, J.T.; Kulsing, C.; Grace, M.R.; Marriott, P.J. Liquid Chromatography–Quadrupole Orbitrap Mass Spectrometry Method for Selected Pharmaceuticals in Water Samples. J. Chromatogr. A 2017, 1515, 164–171. [Google Scholar] [CrossRef] [PubMed]
- Archer, E.; Petrie, B.; Kasprzyk-Hordern, B.; Wolfaardt, G.M. The Fate of Pharmaceuticals and Personal Care Products (PPCPs), Endocrine Disrupting Contaminants (EDCs), Metabolites and Illicit Drugs in a WWTW and Environmental Waters. Chemosphere 2017, 174, 437–446. [Google Scholar] [CrossRef] [PubMed]
- Styszko, K.; Proctor, K.; Castrignanò, E.; Kasprzyk-Hordern, B. Occurrence of Pharmaceutical Residues, Personal Care Products, Lifestyle Chemicals, Illicit Drugs and Metabolites in Wastewater and Receiving Surface Waters of Krakow Agglomeration in South Poland. Sci. Total Environ. 2021, 768, 144360. [Google Scholar] [CrossRef] [PubMed]
- Center for Drug Evaluation and Research. Validation of Analytical Procedures; Center for Drug Evaluation and Research: Silver Spring, MD, USA, 2024. [Google Scholar]
- Battaglin, W.A.; Bradley, P.M.; Iwanowicz, L.; Journey, C.A.; Walsh, H.L.; Blazer, V.S. Pharmaceuticals, Hormones, Pesticides, and Other Bioactive Contaminants in Water, Sediment, and Tissue from Rocky Mountain National Park, 2012–2013. Sci. Total Environ. 2018, 643, 651–673. [Google Scholar] [CrossRef]
- Anumol, T.; Merel, S.; Clarke, B.O.; Snyder, S.A. Ultra High Performance Liquid Chromatography Tandem Mass Spectrometry for Rapid Analysis of Trace Organic Contaminants in Water. Chem. Cent. J. 2013, 7, 1–14. [Google Scholar] [CrossRef]
- Bialkowska-Jelinska, E.; van Beynen, P.; Calcul, L. Seasonality of Pharmaceuticals and Personal Care Products in Shallow Lakes, Florida, USA—Part A. Environments 2025, 12, 219. [Google Scholar] [CrossRef]
- Lin, K.; Wang, R.; Han, T.; Tan, L.; Yang, X.; Wan, M.; Chen, Y.; Zhao, T.; Jiang, S.; Wang, J. Seasonal Variation and Ecological Risk Assessment of Pharmaceuticals and Personal Care Products (PPCPs) in a Typical Semi-Enclosed Bay—The Bohai Bay in Northern China. Sci. Total Environ. 2023, 857, 159682. [Google Scholar] [CrossRef]
- Sengar, A.; Vijayanandan, A. Human Health and Ecological Risk Assessment of 98 Pharmaceuticals and Personal Care Products (PPCPs) Detected in Indian Surface and Wastewaters. Sci. Total Environ. 2022, 807, 150677. [Google Scholar] [CrossRef]
- Ong, T.T.X.; Blanch, E.W.; Jones, O.A.H. Predicted Environmental Concentration and Fate of the Top 10 Most Dispensed Australian Prescription Pharmaceuticals. Environ. Sci. Pollut. Res. 2018, 25, 10966–10976. [Google Scholar] [CrossRef]
- United States Environmental Protection Agency (EPA) Ecological Structure Activity Relationships (ECOSAR) Predictive Model. Available online: https://www.epa.gov/tsca-screening-tools/ecological-structure-activity-relationships-ecosar-predictive-model (accessed on 12 November 2023).
- Li, Y.; Zhang, L.; Ding, J.; Liu, X. Prioritization of Pharmaceuticals in Water Environment in China Based on Environmental Criteria and Risk Analysis of Top-Priority Pharmaceuticals. J. Environ. Manag. 2020, 253, 109732. [Google Scholar] [CrossRef]
- Gao, X.; Wang, X.; Li, J.; Ai, S.; Fu, X.; Fan, B.; Li, W.; Liu, Z. Aquatic Life Criteria Derivation and Ecological Risk Assessment of DEET in China. Ecotoxicol. Environ. Saf. 2020, 188, 109881. [Google Scholar] [CrossRef] [PubMed]
- Anagnostopoulou, K.; Nannou, C.; Aschonitis, V.G.; Lambropoulou, D.A. Screening of Pesticides and Emerging Contaminants in Eighteen Greek Lakes by Using Target and Non-Target HRMS Approaches: Occurrence and Ecological Risk Assessment. Sci. Total Environ. 2022, 849, 157887. [Google Scholar] [CrossRef] [PubMed]
- Xu, M.; Huang, H.; Li, N.; Li, F.; Wang, D.; Luo, Q. Occurrence and Ecological Risk of Pharmaceuticals and Personal Care Products (PPCPs) and Pesticides in Typical Surface Watersheds, China. Ecotoxicol. Environ. Saf. 2019, 175, 289–298. [Google Scholar] [CrossRef] [PubMed]
- Yang, H.; Lu, G.; Yan, Z.; Liu, J.; Dong, H.; Bao, X.; Zhang, X.; Sun, Y. Residues, Bioaccumulation, and Trophic Transfer of Pharmaceuticals and Personal Care Products in Highly Urbanized Rivers Affected by Water Diversion. J. Hazard. Mater. 2020, 391, 122245. [Google Scholar] [CrossRef]
- Mojiri, A.; Zhou, J.L.; Ratnaweera, H.; Rezania, S.; Nazari, V.M. Pharmaceuticals and Personal Care Products in Aquatic Environments and Their Removal by Algae-Based Systems. Chemosphere 2022, 288, 132580. [Google Scholar] [CrossRef]
- Moore, B.C.; Roark, A.M.; Kohno, S.; Hamlin, H.J.; Guillette, L.J. Gene-Environment Interactions: The Potential Role of Contaminants in Somatic Growth and the Development of the Reproductive System of the American Alligator. Mol. Cell. Endocrinol. 2012, 354, 111–120. [Google Scholar] [CrossRef]
- Luna, T.O.; Plautz, S.C.; Salice, C.J. Chronic Effects of 17α-Ethinylestradiol, Fluoxetine, and the Mixture on Individual and Population-Level End Points in Daphnia magna. Arch. Environ. Contam. Toxicol. 2015, 68, 603–611. [Google Scholar] [CrossRef]
- Flaherty, C.M.; Dodson, S.I. Effects of Pharmaceuticals on Daphnia Survival, Growth, and Reproduction. Chemosphere 2005, 61, 200–207. [Google Scholar] [CrossRef]
- Bradley, P.M.; Journey, C.A.; Romanok, K.M.; Barber, L.B.; Buxton, H.T.; Foreman, W.T.; Furlong, E.T.; Glassmeyer, S.T.; Hladik, M.L.; Iwanowicz, L.R.; et al. Expanded Target-Chemical Analysis Reveals Extensive Mixed-Organic-Contaminant Exposure in U.S. Streams. Environ. Sci. Technol. 2017, 51, 4792–4802. [Google Scholar] [CrossRef]
- Fent, K.; Weston, A.A.; Caminada, D. Ecotoxicology of Human Pharmaceuticals. Aquat. Toxicol. 2006, 76, 122–159. [Google Scholar] [CrossRef]
- Backhaus, T.; Porsbring, T.; Arrhenius, Å.; Brosche, S.; Johansson, P.; Blanck, H. Single-Substance and Mixture Toxicity of Five Pharmaceuticals and Personal Care Products to Marine Periphyton Communities. Environ. Toxicol. Chem. 2011, 30, 2030–2040. [Google Scholar] [CrossRef] [PubMed]
- Bulgariu, L.; Gavrilescu, M. Bioremediation of Heavy Metals by Microalgae. In Handbook of Marine Microalgae: Biotechnology Advances; Academic Press: Cambridge, MA, USA, 2015; pp. 457–469. ISBN 978-0-12-800776-1. [Google Scholar]
- Zeraatkar, A.K.; Ahmadzadeh, H.; Talebi, A.F.; Moheimani, N.R.; McHenry, M.P. Potential Use of Algae for Heavy Metal Bioremediation, a Critical Review. J. Environ. Manag. 2016, 181, 817–831. [Google Scholar] [CrossRef] [PubMed]
- Xiong, J.Q.; Cui, P.; Ru, S. Biodegradation of Doxylamine From Wastewater by a Green Microalga, Scenedesmus Obliquus. Front. Microbiol. 2020, 11, 584020. [Google Scholar] [CrossRef] [PubMed]
- Couto, E.; Assemany, P.P.; Assis Carneiro, G.C.; Ferreira Soares, D.C. The Potential of Algae and Aquatic Macrophytes in the Pharmaceutical and Personal Care Products (PPCPs) Environmental Removal: A Review. Chemosphere 2022, 302, 134808. [Google Scholar] [CrossRef]
- Edwards, T.M.; Miller, H.D.; Toft, G.; Guillette, L.J. Seasonal Reproduction of Male Gambusia holbrooki (Eastern Mosquitofish) from Two Florida Lakes. Fish Physiol. Biochem. 2013, 39, 1165–1180. [Google Scholar] [CrossRef]
- Zillien, C.; van Loon, C.; Gülpen, M.; Tipatet, K.; Hanssen, B.; Beeltje, H.; Roex, E.; Oldenkamp, R.; Posthuma, L.; Ragas, A.M.J. Risk-Management Tool for Environmental Prioritization of Pharmaceuticals Based on Emissions from Hospitals. Sci. Total Environ. 2019, 694, 133733. [Google Scholar] [CrossRef]
- Nkoom, M.; Lu, G.; Liu, J. Occurrence and Ecological Risk Assessment of Pharmaceuticals and Personal Care Products in Taihu Lake, China: A Review. Environ. Sci. Process. Impacts 2018, 20, 1640–1648. [Google Scholar] [CrossRef]
- Raimondo, S.; Forbes, V.E. Moving beyond Risk Quotients: Advancing Ecological Risk Assessment to Reflect Better, More Robust and Relevant Methods. Ecologies 2022, 3, 145–160. [Google Scholar] [CrossRef]
- Amiard, J.-C.; Amiard-Triquet, C. Conventional Risk Assessment of Environmental Contaminants. In Aquatic Ecotoxicology: Advancing Tools for Dealing with Emerging Risks; Elsevier: Amsterdam, The Netherlands, 2015; pp. 25–49. [Google Scholar]
- Garber, K.; Etterson, M.; Odenkirchen, E.; Anderson, B. Use of Risk Quotient and Probabilistic Approaches to Assess Risks of Pesticides to Birds. In Proceedings of the Assessing Risks of Pesticides to Federally Listed (Threatened and Endangered) Species at a National Level, SETAC, Vancouver, BC, Canada, 9–13 November 2014. [Google Scholar]
- United States Environmental Protection Agency (USEPA). Guidelines for Ecological Risk Assessment, EPA/630/R-95/002F; United States Environmental Protection Agency (USEPA): Washington, DC, USA, 1998.

| PPCP | Chronic Toxicity Value (mg/L) | ||
|---|---|---|---|
| Fish | Crustacean | Algae | |
| Octocrylene (OCT) | 0.00086 | 0.0081 | 0.042 |
| Atorvastatin (ATV) | 0.055 | 0.257 | 1.61 |
| Fluoxetine (FLX) | 0.025 | 0.019 | 0.033 |
| Ibuprofen (IBU) | 4.94 | 4.31 | 15.6 |
| Testosterone (TST) | 5.84 | 0.637 | 2.43 |
| Propylparaben (PPB) | 0.406 | 2 | 1.69 |
| Carbamazepine (CBZ) | 1.05 | 1.17 | 0.096 |
| N,N-Diethyl-meta-toluamide (DEET) | 0.49 | 5.72 | 3.21 |
| Methylparaben (MPR) | 2.06 | 0.99 | 3.89 |
| Sulfamethoxazole (SMX) | 5 | 0.07 | 11.14 |
| Acetaminophen (APAP) | 0.124 | 0.189 | 0.352 |
| Cotinine (COT) | 6.13 | 109 | 19.8 |
| Caffeine (CAF) | 0.914 | 2.8 | 2.63 |
| Theophylline (THE) | 1.49 | 5.55 | 4.13 |
| PPCP Concentrations (μg/L) | ||||||||
|---|---|---|---|---|---|---|---|---|
| RL-S1 | RL-S2 | RL-S3 | NL | |||||
| PPCP | Dry | Wet | Dry | Wet | Dry | Wet | Dry | Wet |
| OCT | ND | 0.99 | ND | ND | ND | 0.01 | ND | ND |
| ATV | ND | 0.13 | ND | ND | ND | ND | ND | ND |
| FLX | ND | 0.02 | ND | 0.02 | ND | 0.07 | ND | 0.01 |
| IBU | ND | 10.95 | 8.63 | 9.42 | 8.53 | 15.17 | 15.08 | 14.13 |
| TST | 0.19 | 8.42 | 31.94 | 1.21 | 1.77 | 0.92 | 22.33 | 48.18 |
| PPB | ND | ND | ND | ND | ND | 1.11 | ND | ND |
| CBZ | ND | ND | ND | 0.27 | ND | 0.54 | ND | ND |
| DEET | 4.54 | 22.94 | 4.21 | 15.32 | 4.54 | 17.31 | 182.48 | 76.89 |
| MPR | ND | 0.28 | ND | ND | ND | ND | ND | ND |
| SMX | ND | 0.07 | 0.06 | 0.08 | ND | 0.10 | 0.05 | 0.06 |
| APAP | 0.17 | 1.08 | 0.10 | 6.99 | 0.42 | 0.75 | ND | 0.67 |
| COT | 8.50 | 8.96 | 7.96 | 8.12 | 8.82 | 8.14 | 4.07 | 1.31 |
| CAF | 454.2 | 374.91 | 51.22 | 16.92 | 29.13 | 68.30 | 197.11 | 249.50 |
| THE | 33.18 | 371.07 | 53.02 | 7.29 | 28.81 | 298.64 | 46.97 | 151.95 |
| PPCP Concentrations (μg/L) | ||||||||||||||||
|---|---|---|---|---|---|---|---|---|---|---|---|---|---|---|---|---|
| RL-S1 | RL-S2 | RL-S3 | NL | |||||||||||||
| PPCP | Dry | SD | Wet | SD | Dry | SD | Wet | SD | Dry | SD | Wet | SD | Dry | SD | Wet | SD |
| TST | 5.63 | 7.61 | 2.87 | 2.98 | 8.82 | 15.43 | 0.43 | 0.34 | 0.87 | 0.61 | 0.40 | 0.26 | 9.14 | 10.08 | 6.32 | 12.20 |
| DEET | 3.89 | 0.47 | 13.12 | 4.85 | 3.80 | 0.31 | 8.78 | 3.99 | 3.75 | 0.57 | 9.72 | 4.36 | 53.37 | 86.64 | 14.78 | 18.00 |
| APAP | 0.09 | 0.10 | 0.18 | 0.29 | 0.03 | 0.05 | 0.64 | 2.11 | 0.25 | 0.11 | 0.15 | 0.20 | 0.00 | 0.00 | 0.08 | 0.18 |
| COT | 8.16 | 0.37 | 6.53 | 1.40 | 7.85 | 0.08 | 6.83 | 1.12 | 8.35 | 0.44 | 6.51 | 1.18 | 2.96 | 1.28 | 0.77 | 0.23 |
| CAF | 147.15 | 209.10 | 100.71 | 104.92 | 24.67 | 18.15 | 6.64 | 3.62 | 23.58 | 5.33 | 11.71 | 17.57 | 91.33 | 85.64 | 96.79 | 64.91 |
| THE | 20.54 | 11.98 | 78.23 | 94.93 | 17.37 | 23.81 | 2.67 | 1.96 | 12.18 | 11.30 | 26.82 | 79.00 | 29.49 | 17.07 | 71.01 | 39.15 |
| Fish | Crustacean | Algae | ||||||||||
|---|---|---|---|---|---|---|---|---|---|---|---|---|
| PPCP | RL-S1 | RL-S2 | RL-S3 | NL | RL-S1 | RL-S2 | RL-S3 | NL | RL-S1 | RL-S2 | RL-S3 | NL |
| OCT | 115.116 | * | 1.163 | * | 12.222 | * | 0.123 | * | 2.357 | * | 0.024 | * |
| ATV | 0.231 | * | * | * | 0.049 | * | * | * | 0.008 | * | * | * |
| FLX | 0.080 | 0.072 | 0.280 | 0.056 | 0.105 | 0.095 | 0.368 | 0.074 | 0.061 | 0.055 | 0.212 | 0.042 |
| IBU | 0.222 | 0.191 | 0.307 | 0.305 | 0.254 | 0.219 | 0.352 | 0.350 | 0.070 | 0.060 | 0.097 | 0.097 |
| TST | 0.286 | 0.547 | 0.030 | 0.825 | 2.625 | 5.014 | 0.278 | 7.564 | 0.688 | 1.314 | 0.073 | 1.983 |
| PPB | ND | * | 0.273 | * | * | * | 0.056 | * | * | * | 0.066 | * |
| CBZ | 0.025 | 0.026 | 0.051 | * | 0.022 | 0.023 | 0.046 | * | 0.270 | 0.281 | 0.563 | * |
| DEET | 4.673 | 3.127 | 3.533 | 37.241 | 0.400 | 0.268 | 0.303 | 3.190 | 0.713 | 0.477 | 0.539 | 5.685 |
| MPR | 0.014 | * | * | * | 0.028 | * | * | * | 0.007 | * | * | * |
| SMX | 0.001 | 0.002 | 0.002 | 0.001 | 0.100 | 0.114 | 0.140 | 0.086 | 0.001 | 0.001 | 0.001 | 0.001 |
| APAP | 0.877 | 5.637 | 0.605 | 0.540 | 0.576 | 3.698 | 0.397 | 0.354 | 0.309 | 1.986 | 0.213 | 0.190 |
| COT | 0.146 | 0.132 | 0.144 | 0.066 | 0.008 | 0.007 | 0.008 | 0.004 | 0.045 | 0.041 | 0.045 | 0.021 |
| CAF | 49.694 | 5.604 | 7.473 | 27.298 | 16.221 | 1.829 | 2.439 | 8.911 | 17.270 | 1.948 | 2.597 | 9.487 |
| THE | 24.904 | 3.558 | 20.043 | 10.198 | 6.686 | 0.955 | 5.381 | 2.738 | 8.985 | 1.284 | 7.231 | 3.679 |
| Fish | Crustacean | Algae | ||||||||||
|---|---|---|---|---|---|---|---|---|---|---|---|---|
| PPCP | RL-S1 | RL-S2 | RL-S3 | NL | RL-S1 | RL-S2 | RL-S3 | NL | RL-S1 | RL-S2 | RL-S3 | NL |
| TST | 0.060 | 0.046 | 0.009 | 0.113 | 0.546 | 0.419 | 0.080 | 1.035 | 0.143 | 0.110 | 0.021 | 0.271 |
| DEET | 2.259 | 1.520 | 1.712 | 4.765 | 0.194 | 0.130 | 0.147 | 0.408 | 0.345 | 0.232 | 0.261 | 0.727 |
| APAP | 0.129 | 0.387 | 0.137 | 0.048 | 0.085 | 0.254 | 0.090 | 0.032 | 0.045 | 0.136 | 0.048 | 0.017 |
| COT | 0.112 | 0.116 | 0.113 | 0.020 | 0.006 | 0.007 | 0.006 | 0.001 | 0.035 | 0.036 | 0.035 | 0.006 |
| CAF | 12.148 | 1.253 | 1.570 | 10.457 | 3.965 | 0.409 | 0.513 | 3.414 | 4.222 | 0.435 | 0.546 | 3.634 |
| THE | 4.390 | 0.442 | 1.582 | 4.146 | 1.179 | 0.119 | 0.425 | 1.113 | 1.584 | 0.160 | 0.571 | 1.496 |
| Dry Season | ||||||||||||
|---|---|---|---|---|---|---|---|---|---|---|---|---|
| Fish | Crustacean | Algae | ||||||||||
| PPCP | RL-S1 | RL-S2 | RL-S3 | NL | RL-S1 | RL-S2 | RL-S3 | NL | RL-S1 | RL-S2 | RL-S3 | NL |
| OCT | * | * | * | * | * | * | * | * | * | * | * | * |
| ATV | * | * | * | * | * | * | * | * | * | * | * | * |
| FLX | * | * | * | * | * | * | * | * | * | * | * | * |
| IBU | 0.188 | 0.175 | 0.173 | 0.305 | 0.215 | 0.200 | 0.198 | 0.350 | 0.059 | 0.055 | 0.055 | 0.097 |
| TST | 0.286 | 0.547 | 0.030 | 0.382 | 2.625 | 5.014 | 0.278 | 3.505 | 0.688 | 1.314 | 0.073 | 0.919 |
| PPB | * | * | * | * | * | * | * | * | * | * | * | * |
| CBZ | * | * | * | * | * | * | * | * | * | * | * | * |
| DEET | 0.927 | 0.859 | 0.927 | 37.241 | 0.079 | 0.074 | 0.079 | 3.190 | 0.141 | 0.131 | 0.141 | 5.685 |
| MPR | * | * | * | * | * | * | * | * | * | * | * | * |
| SMX | * | 0.001 | * | 0.001 | * | 0.086 | * | 0.074 | * | 0.001 | * | 0.000 |
| APAP | 0.137 | 0.081 | 0.339 | 0.004 | 0.090 | 0.053 | 0.222 | 0.003 | 0.048 | 0.028 | 0.119 | 0.001 |
| COT | 0.139 | 0.130 | 0.144 | 0.066 | 0.008 | 0.007 | 0.008 | 0.004 | 0.043 | 0.040 | 0.045 | 0.021 |
| CAF | 49.694 | 5.604 | 3.187 | 21.566 | 16.221 | 1.829 | 1.040 | 7.040 | 17.270 | 1.948 | 1.108 | 7.495 |
| THE | 2.227 | 3.558 | 1.934 | 3.152 | 0.598 | 0.955 | 0.519 | 0.846 | 0.803 | 1.284 | 0.698 | 1.137 |
| Wet Season | ||||||||||||
| Fish | Crustacean | Algae | ||||||||||
| PPCP | RL-S1 | RL-S2 | RL-S3 | NL | RL-S1 | RL-S2 | RL-S3 | NL | RL-S1 | RL-S2 | RL-S3 | NL |
| OCT | 115.116 | * | 1.163 | * | 12.222 | * | 0.123 | * | 2.357 | * | 0.024 | * |
| ATV | 0.231 | * | * | * | 0.049 | * | * | * | 0.008 | * | * | * |
| FLX | 0.080 | 0.072 | 0.280 | 0.056 | 0.105 | 0.095 | 0.368 | 0.074 | 0.061 | 0.055 | 0.212 | 0.042 |
| IBU | 0.222 | 0.191 | 0.307 | 0.286 | 0.254 | 0.219 | 0.352 | 0.328 | 0.070 | 0.060 | 0.097 | 0.091 |
| TST | 0.144 | 0.021 | 0.016 | 0.825 | 1.322 | 0.190 | 0.144 | 7.564 | 0.347 | 0.050 | 0.038 | 1.983 |
| PPB | * | * | 0.273 | * | * | * | 0.056 | * | * | * | 0.066 | * |
| CBZ | 0.025 | 0.026 | 0.051 | * | 0.022 | 0.023 | 0.046 | * | 0.271 | 0.281 | 0.563 | * |
| DEET | 4.673 | 3.127 | 3.533 | 15.686 | 0.400 | 0.268 | 0.303 | 1.344 | 0.713 | 0.477 | 0.539 | 2.394 |
| MPR | 0.014 | * | * | * | 0.028 | * | * | * | 0.007 | * | * | * |
| SMX | 0.001 | 0.002 | 0.002 | 0.001 | 0.100 | 0.114 | 0.140 | 0.083 | 0.001 | 0.001 | 0.001 | 0.001 |
| APAP | 0.871 | 5.637 | 0.605 | 0.540 | 0.571 | 3.698 | 0.397 | 0.354 | 0.307 | 1.986 | 0.213 | 0.190 |
| COT | 0.146 | 0.132 | 0.132 | 0.021 | 0.008 | 0.007 | 0.007 | 0.001 | 0.045 | 0.041 | 0.041 | 0.007 |
| CAF | 41.019 | 1.851 | 7.473 | 27.298 | 13.390 | 0.604 | 2.439 | 8.911 | 14.255 | 0.643 | 2.597 | 9.487 |
| THE | 24.904 | 0.489 | 20.043 | 10.198 | 6.686 | 0.131 | 5.381 | 2.738 | 8.985 | 0.177 | 7.231 | 3.679 |
| Dry Season | ||||||||||||
|---|---|---|---|---|---|---|---|---|---|---|---|---|
| Fish | Crustacean | Algae | ||||||||||
| PPCP | RL-S1 | RL-S2 | RL-S3 | NL | RL-S1 | RL-S2 | RL-S3 | NL | RL-S1 | RL-S2 | RL-S3 | NL |
| TST | 0.096 | 0.151 | 0.015 | 0.157 | 0.884 | 1.385 | 0.137 | 1.435 | 0.232 | 0.363 | 0.036 | 0.376 |
| DEET | 0.793 | 0.776 | 0.765 | 10.892 | 0.068 | 0.066 | 0.066 | 0.933 | 0.121 | 0.118 | 0.117 | 1.663 |
| APAP | 0.073 | 0.024 | 0.202 | 0.000 | 0.048 | 0.016 | 0.132 | 0.000 | 0.026 | 0.009 | 0.071 | 0.001 |
| COT | 0.133 | 0.128 | 0.136 | 0.048 | 0.007 | 0.007 | 0.008 | 0.003 | 0.041 | 0.040 | 0.042 | 0.015 |
| CAF | 16.100 | 2.699 | 2.582 | 9.992 | 5.255 | 0.881 | 0.842 | 3.262 | 5.595 | 0.938 | 0.897 | 3.473 |
| THE | 1.379 | 1.162 | 0.817 | 3.979 | 0.370 | 0.312 | 0.219 | 0.531 | 0.497 | 0.419 | 0.295 | 0.714 |
| Wet Season | ||||||||||||
| Fish | Crustacean | Algae | ||||||||||
| PPCP | RL-S1 | RL-S2 | RL-S3 | NL | RL-S1 | RL-S2 | RL-S3 | NL | RL-S1 | RL-S2 | RL-S3 | NL |
| TST | 0.049 | 0.007 | 0.007 | 0.108 | 0.451 | 0.068 | 0.063 | 0.992 | 0.118 | 0.018 | 0.016 | 0.260 |
| DEET | 2.678 | 1.792 | 1.984 | 3.016 | 0.229 | 0.153 | 0.170 | 0.258 | 0.409 | 0.274 | 0.303 | 0.460 |
| APAP | 0.145 | 0.516 | 0.121 | 0.065 | 0.095 | 0.339 | 0.079 | 0.042 | 0.051 | 0.182 | 0.043 | 0.023 |
| COT | 0.108 | 0.111 | 0.106 | 0.013 | 0.006 | 0.006 | 0.006 | 0.001 | 0.033 | 0.034 | 0.033 | 0.004 |
| CAF | 11.019 | 0.726 | 1.281 | 10.590 | 3.597 | 0.237 | 0.418 | 3.457 | 3.829 | 0.252 | 0.445 | 3.680 |
| THE | 5.250 | 0.179 | 1.800 | 4.766 | 1.410 | 0.048 | 0.483 | 1.279 | 1.894 | 0.065 | 0.649 | 1.719 |
Disclaimer/Publisher’s Note: The statements, opinions and data contained in all publications are solely those of the individual author(s) and contributor(s) and not of MDPI and/or the editor(s). MDPI and/or the editor(s) disclaim responsibility for any injury to people or property resulting from any ideas, methods, instructions or products referred to in the content. |
© 2025 by the authors. Licensee MDPI, Basel, Switzerland. This article is an open access article distributed under the terms and conditions of the Creative Commons Attribution (CC BY) license (https://creativecommons.org/licenses/by/4.0/).
Share and Cite
Bialkowska-Jelinska, E.; van Beynen, P.; Calcul, L. Assessing Environmental Risk Posed by Pharmaceuticals and Personal Care Products in Shallow Lakes, Florida, USA—Part B. Environments 2025, 12, 231. https://doi.org/10.3390/environments12070231
Bialkowska-Jelinska E, van Beynen P, Calcul L. Assessing Environmental Risk Posed by Pharmaceuticals and Personal Care Products in Shallow Lakes, Florida, USA—Part B. Environments. 2025; 12(7):231. https://doi.org/10.3390/environments12070231
Chicago/Turabian StyleBialkowska-Jelinska, Elzbieta, Philip van Beynen, and Laurent Calcul. 2025. "Assessing Environmental Risk Posed by Pharmaceuticals and Personal Care Products in Shallow Lakes, Florida, USA—Part B" Environments 12, no. 7: 231. https://doi.org/10.3390/environments12070231
APA StyleBialkowska-Jelinska, E., van Beynen, P., & Calcul, L. (2025). Assessing Environmental Risk Posed by Pharmaceuticals and Personal Care Products in Shallow Lakes, Florida, USA—Part B. Environments, 12(7), 231. https://doi.org/10.3390/environments12070231