Article

A Field-Scale Assessment of the Impact of Conventional and Permeable Concrete Pavements on Surface and Air Temperatures

1
Department of Agricultural and Biological Engineering, University of Illinois at Urbana-Champaign, 1304 W. Pennsylvania Avenue, Urbana, IL 61801, USA
2
JW Eco-Technology, Ding Tai Co., Ltd. No. 23, Ln. 123, Junying Street, Shulin District, New Taipei City 23878, Taiwan
*
Author to whom correspondence should be addressed.
Environments 2025, 12(6), 192; https://doi.org/10.3390/environments12060192
Submission received: 24 April 2025 / Revised: 29 May 2025 / Accepted: 31 May 2025 / Published: 7 June 2025

Abstract

Environmental impacts, such as elevated temperatures due to urban heat islands (UHIs), associated with land cover change due to urbanization, should not be ignored. In contrast to conventional impermeable concrete, permeable pavements have been implemented as green infrastructure strategies for achieving environmental benefits, such as stormwater management. Their impacts and benefits on other environmental aspects should not be ignored, especially for those with limited discussion in the literature. Therefore, this study monitored the surface and air temperatures of three types of pavements: conventional impermeable concrete (IC), pervious concrete (PC), and the patented JW Eco-technology (JW). As UHIs are more intense in the summer, temperature profiles during targeted periods when surface temperatures exceeded 40 °C for consecutive days were examined. In addition, as an available option at the study site, shade was created to evaluate its effect on surface temperatures across the pavement systems. Overall, the annual average surface and air temperatures of the three pavements were similar. However, seasonal and diurnal variations in temperatures were both observed, suggesting summer was the season when the differences in temperatures among pavements were most noticeable. Investigation during the targeted periods revealed that the average surface temperatures of PC were 2.4–2.7 °C and 3.2–3.3 °C higher than those observed on IC and JW, and the average air temperature of PC was 1.8 °C greater than that of IC and JW between 12:00 and 16:00. On the contrary, the average surface temperatures of PC were significantly lower than those on IC (1.3–1.4 °C) and JW (1.5 °C) between 21:00 and 5:00. Results also indicate that shade was an effective way to alleviate the high surface temperatures during the warm hours by lowering surface temperatures 21.0 °C, 15.4 °C, and 15.0 °C, for PC, IC, and JW, respectively. Finally, temperatures associated with the aqueducts of JW Eco-technology and the impacts on overall surface temperatures will be discussed.

1. Introduction

The estimated global temperature will likely increase or exceed 1.5 °C above pre-industrial levels between 2021 and 2040. If it continues to rise at the current rate, it will pose threats to the environment and will negatively affect human health and life [1]. Besides, an additional 13% increase in the population of cities and metropolitan areas by the middle of this century [2] may lead to more advanced developments with land use changes to meet economic demand and essential activities for human needs in urban habitats.
The urban heat island (UHI) effect is the observed phenomenon that warmer temperatures occur in urban atmospheres, such as city and metropolitan areas than in the surrounding rural environment [3,4,5,6,7,8,9]. Studies suggest that common contributing factors of UHIs are the change in land use and physical properties of materials used for land surfaces [4,5,10,11,12,13,14,15]. With the conversion of natural-covered lands into tightly sealed surfaces in an urbanized environment, in addition to the unintended increase in UHIs, paved spaces will likely generate more surface runoff that may carry pollutants to neighboring water bodies. Therefore, with the migration of people into urban areas, urban development efforts should consider implementing sustainable land use and planning, adoption of green infrastructure, and water management to alleviate some of the projected environmental challenges [16]. Permeable pavements, as opposed to conventional impermeable concrete and asphalt, have voids that allow water to infiltrate and percolate into the subsurface layers. Low-impact development (LID) recommends permeable (pervious or porous) pavements for stormwater management approaches to reduce surface runoff that is mainly caused by impermeable surfaces [17]. Common permeable pavement options include but are not limited to, pervious asphalt, pervious concrete, permeable pavers, permeable interlocking concrete, and pavement systems with plastic grids [18,19,20,21].
The Permeable Pavement Project (P3) study site was constructed at the Agricultural Engineering Research Farm and Training Center (FRTC) of the University of Illinois at Urbana-Champaign (UIUC) in 2016. It has three pavement systems installed, including conventional impermeable concrete (IC), pervious concrete (PC), and the patented JW Eco-technology (JW). In one aspect, PC and JW differ from IC primarily in the ability of water to infiltrate the surface. The two permeable pavements, PC and JW, differ primarily in the essential structure of the surface layer or the distribution of voids across the surface layer. JW utilizes aqueduct frames that are made from recycled polypropylene (PP), which are filled with conventional impermeable concrete, to construct IC pavement into the formation of its structure [21,22,23]. In addition to allowing water to flow down one-dimensionally through the aqueduct openings to the subsurface layer, the network formed by the frames in the concrete further reinforces the structure and provides a high-loading property as a type of permeable pavement [20,23,24]. The name of this method, JW, refers to the initials of the first name of the inventor, Jui-Wen Chen. In Asia, JW Eco-technology is the only brand name pavement method listed in the Manual of Low Embodied-carbon Building Rating System, published recently by the official Architecture and Building Research Institute of Taiwan, to evaluate the embodied carbon utilizing specific construction materials [25]. It has also been a method in technical manuals for building a sponge city and in the technical regulations in China [26]. While IC and PC have been commonly used for various applications, JW’s first and only installation in the USA was constructed as a component of the P3 study site in 2016. Limited literature on its environmental impacts can be found, and there remains a gap in the literature on using JW. This research that explored surface temperatures and air temperatures at the P3 site will provide information and better understating for applications at a larger scale using these pavement systems. Temperature profiles across IC, PC, and JW were monitored and documented. Since UHIs are commonly more intense in summer months, further analyses of temperature distribution focused on the summer season in 2022 and 2023. In addition to utilizing data collected during the whole summer season, selected periods with daily maximum pavement surface temperatures exceeding 40 °C (104 °F) for consecutive days were evaluated. As strategies to lower overheated pavements in the summer have been a key topic of mitigating UHIs, this study also simulated the effect of shade using widely available plywood to compare temperature profiles, with and without shade and within the above-selected periods, to determine the shade effect on IC, PC, and JW pavement systems.

2. Materials and Methods

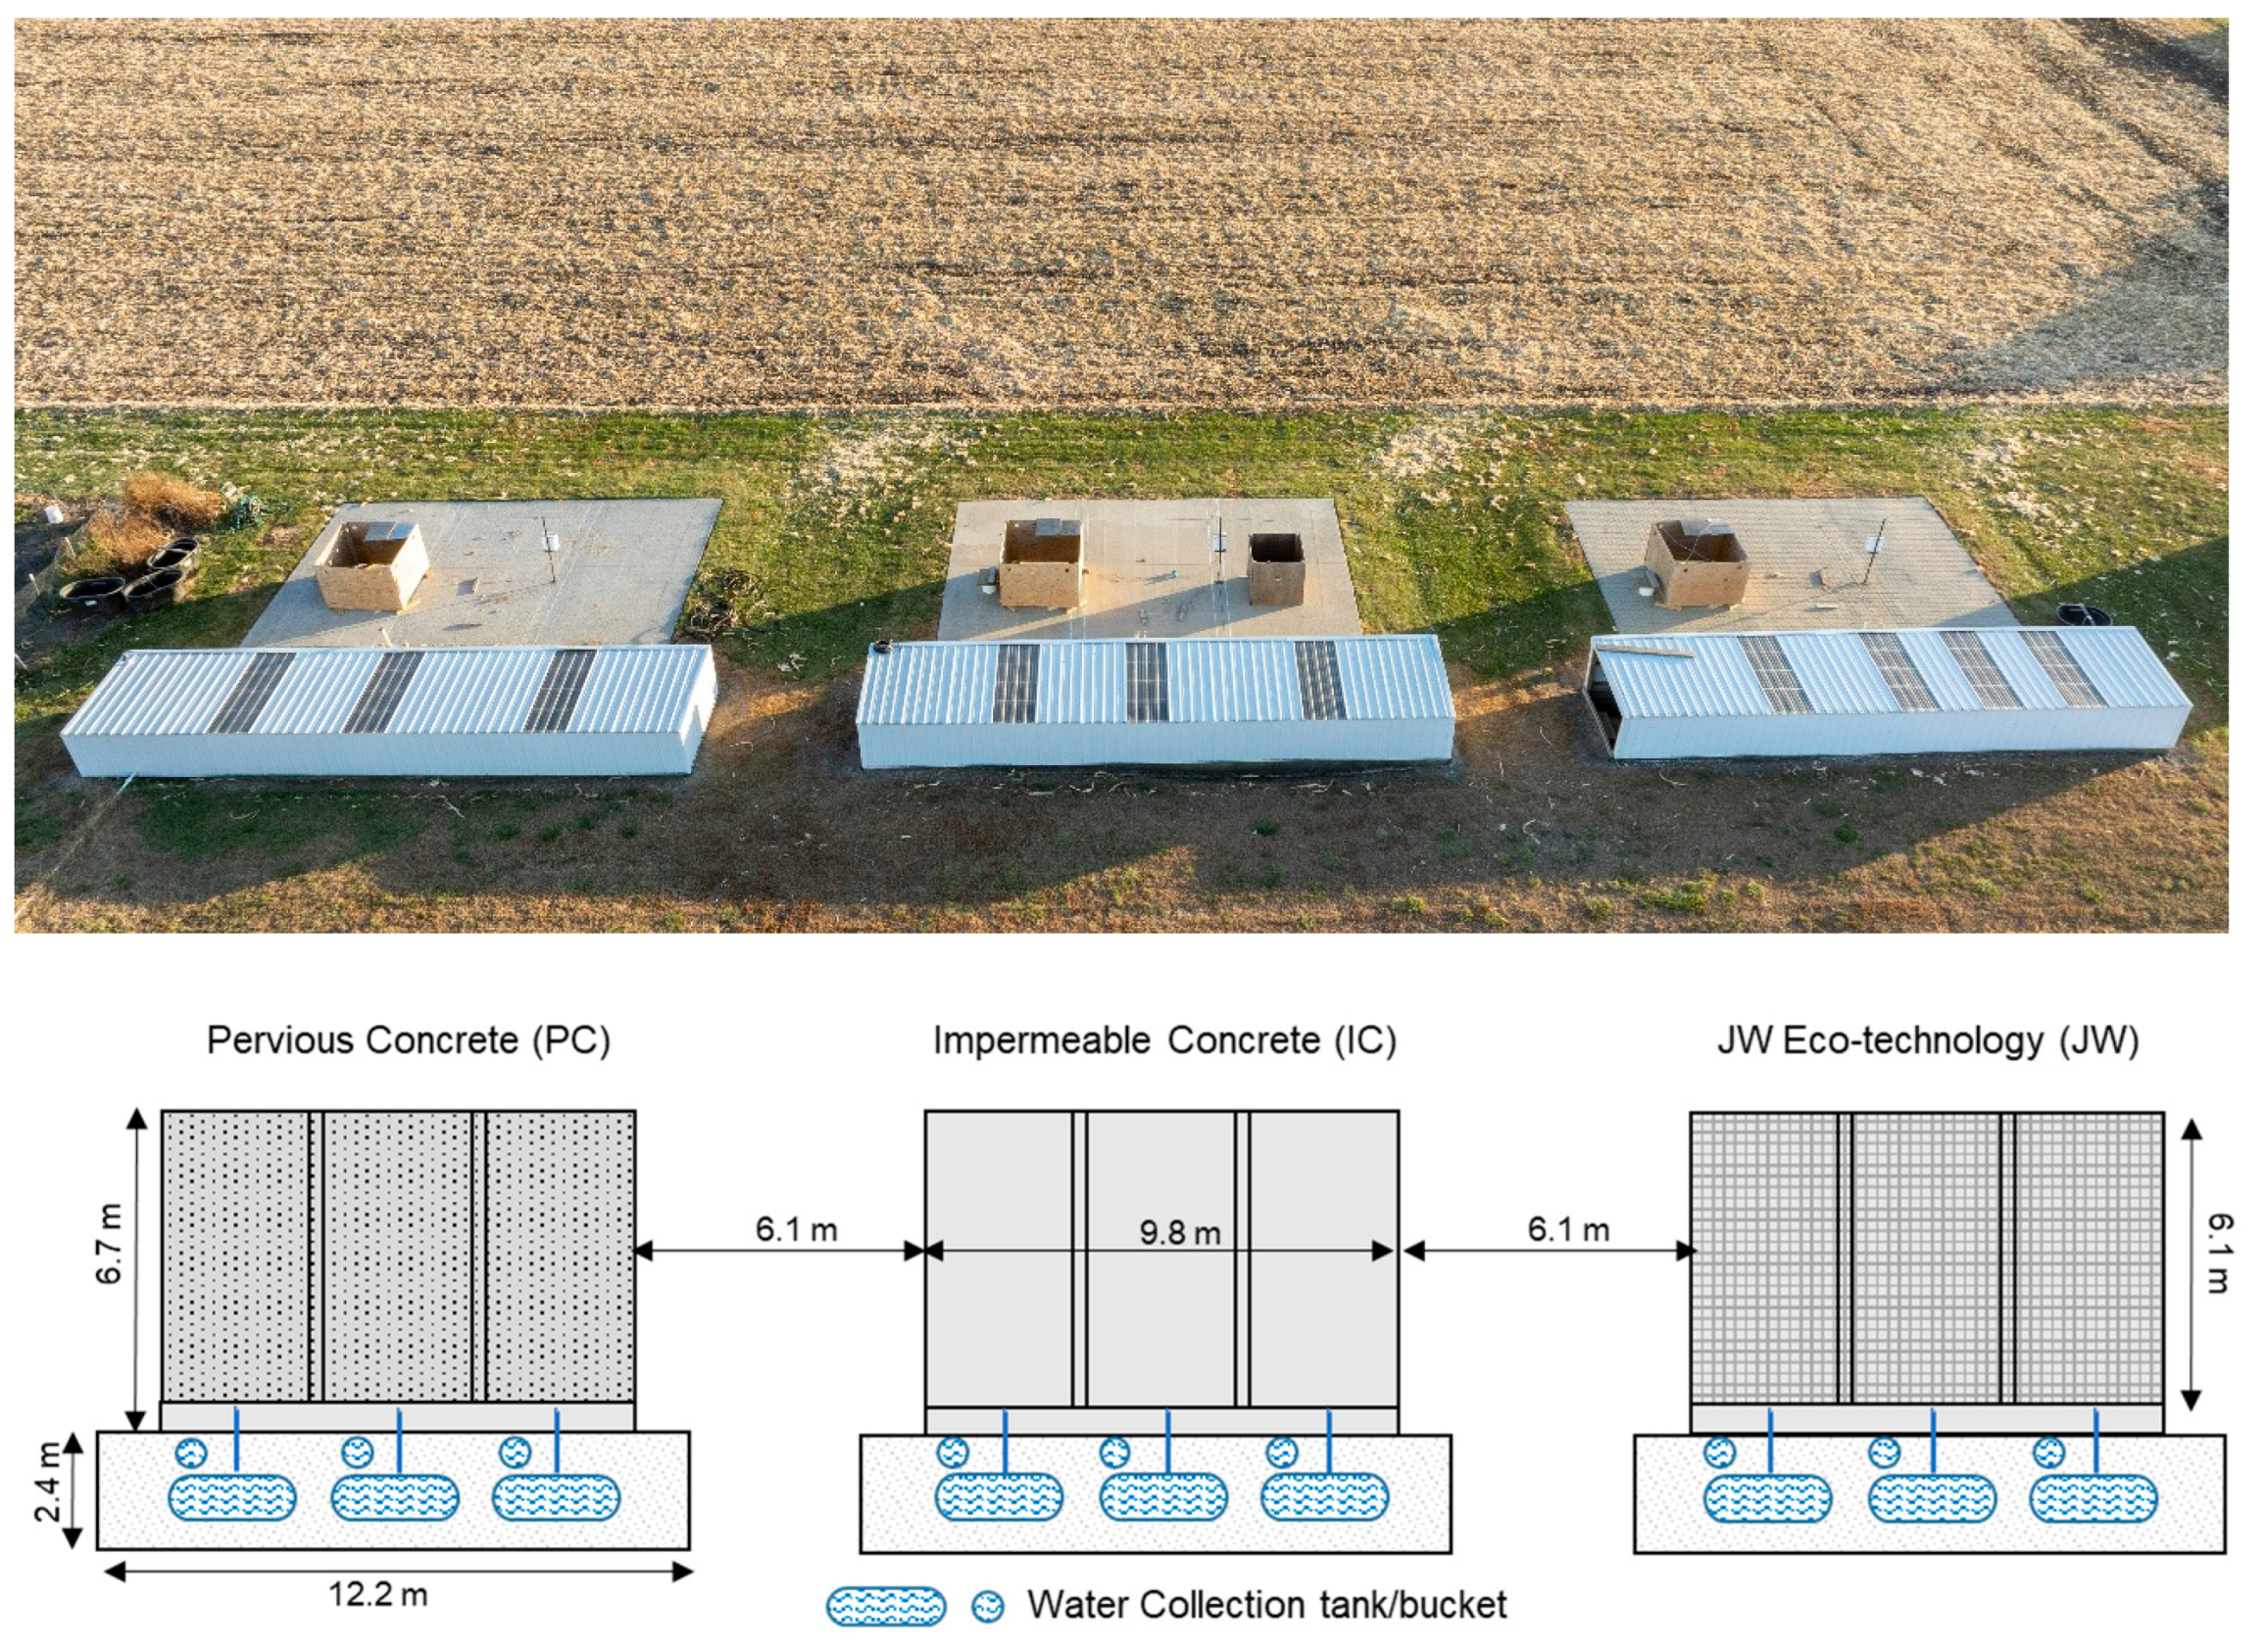
2.1. Study Site and Pavement Systems Descriptions

This study was carried out at the pilot-scale P3 research and demonstration site, which is in an open area surrounded by farmland and absent of any tall buildings nearby. Each of the three pavement materials (IC, PC, and JW) has a total area of 9.8 m × 6.1 m (32 ft × 20 ft), including three replicates of 3.1 m × 6.1 m (10 ft × 20 ft), with a 0.3 m × 6.1 m (1 ft × 20 ft) buffer strip in between the replicates of the same paving material. There is a 6.1 m (20 ft) wide grass strip between pavement slabs. All pavement pad replicates were constructed to simulate a driveway or space with several parking spots. The overview of the current status and the design of the P3 site are shown in Figure 1.
Each of the three types of pavements consists of three layers with a total depth of 55.9 cm (22 in), including the 15.2 cm (6 in) paving surface layer on top and the subsurface gravel and soil layers, each of which is 20.3 cm (8 in) in depth. The surface layers of IC and PC were furnished with 15.2 cm (6 in) of concrete and pervious concrete, respectively. For the JW pavement system, individual units of the plastic aqueduct frame were installed and leveled across the desired area, and 15.2 cm (6 in) of concrete was then poured and evenly leveled over the frame. The materials and installation of JW followed the standard procedure for this system, and the aqueducts used in this study were about 20.3 cm (8 in) in length. More detailed information about the installation procedure, materials and accessories used, and maintenance of the site can be found in publications by the P3 research team [21,22]. The three pavement systems have been exposed to the same environment since construction in 2016. There have been no vehicular activities or experiments involving the use of chemicals on any of the pavement systems since their installation. During the study period, while IC was not water permeable, the test areas on PC and JW demonstrated the capacity to transition water downward to the subsurface layers [22].

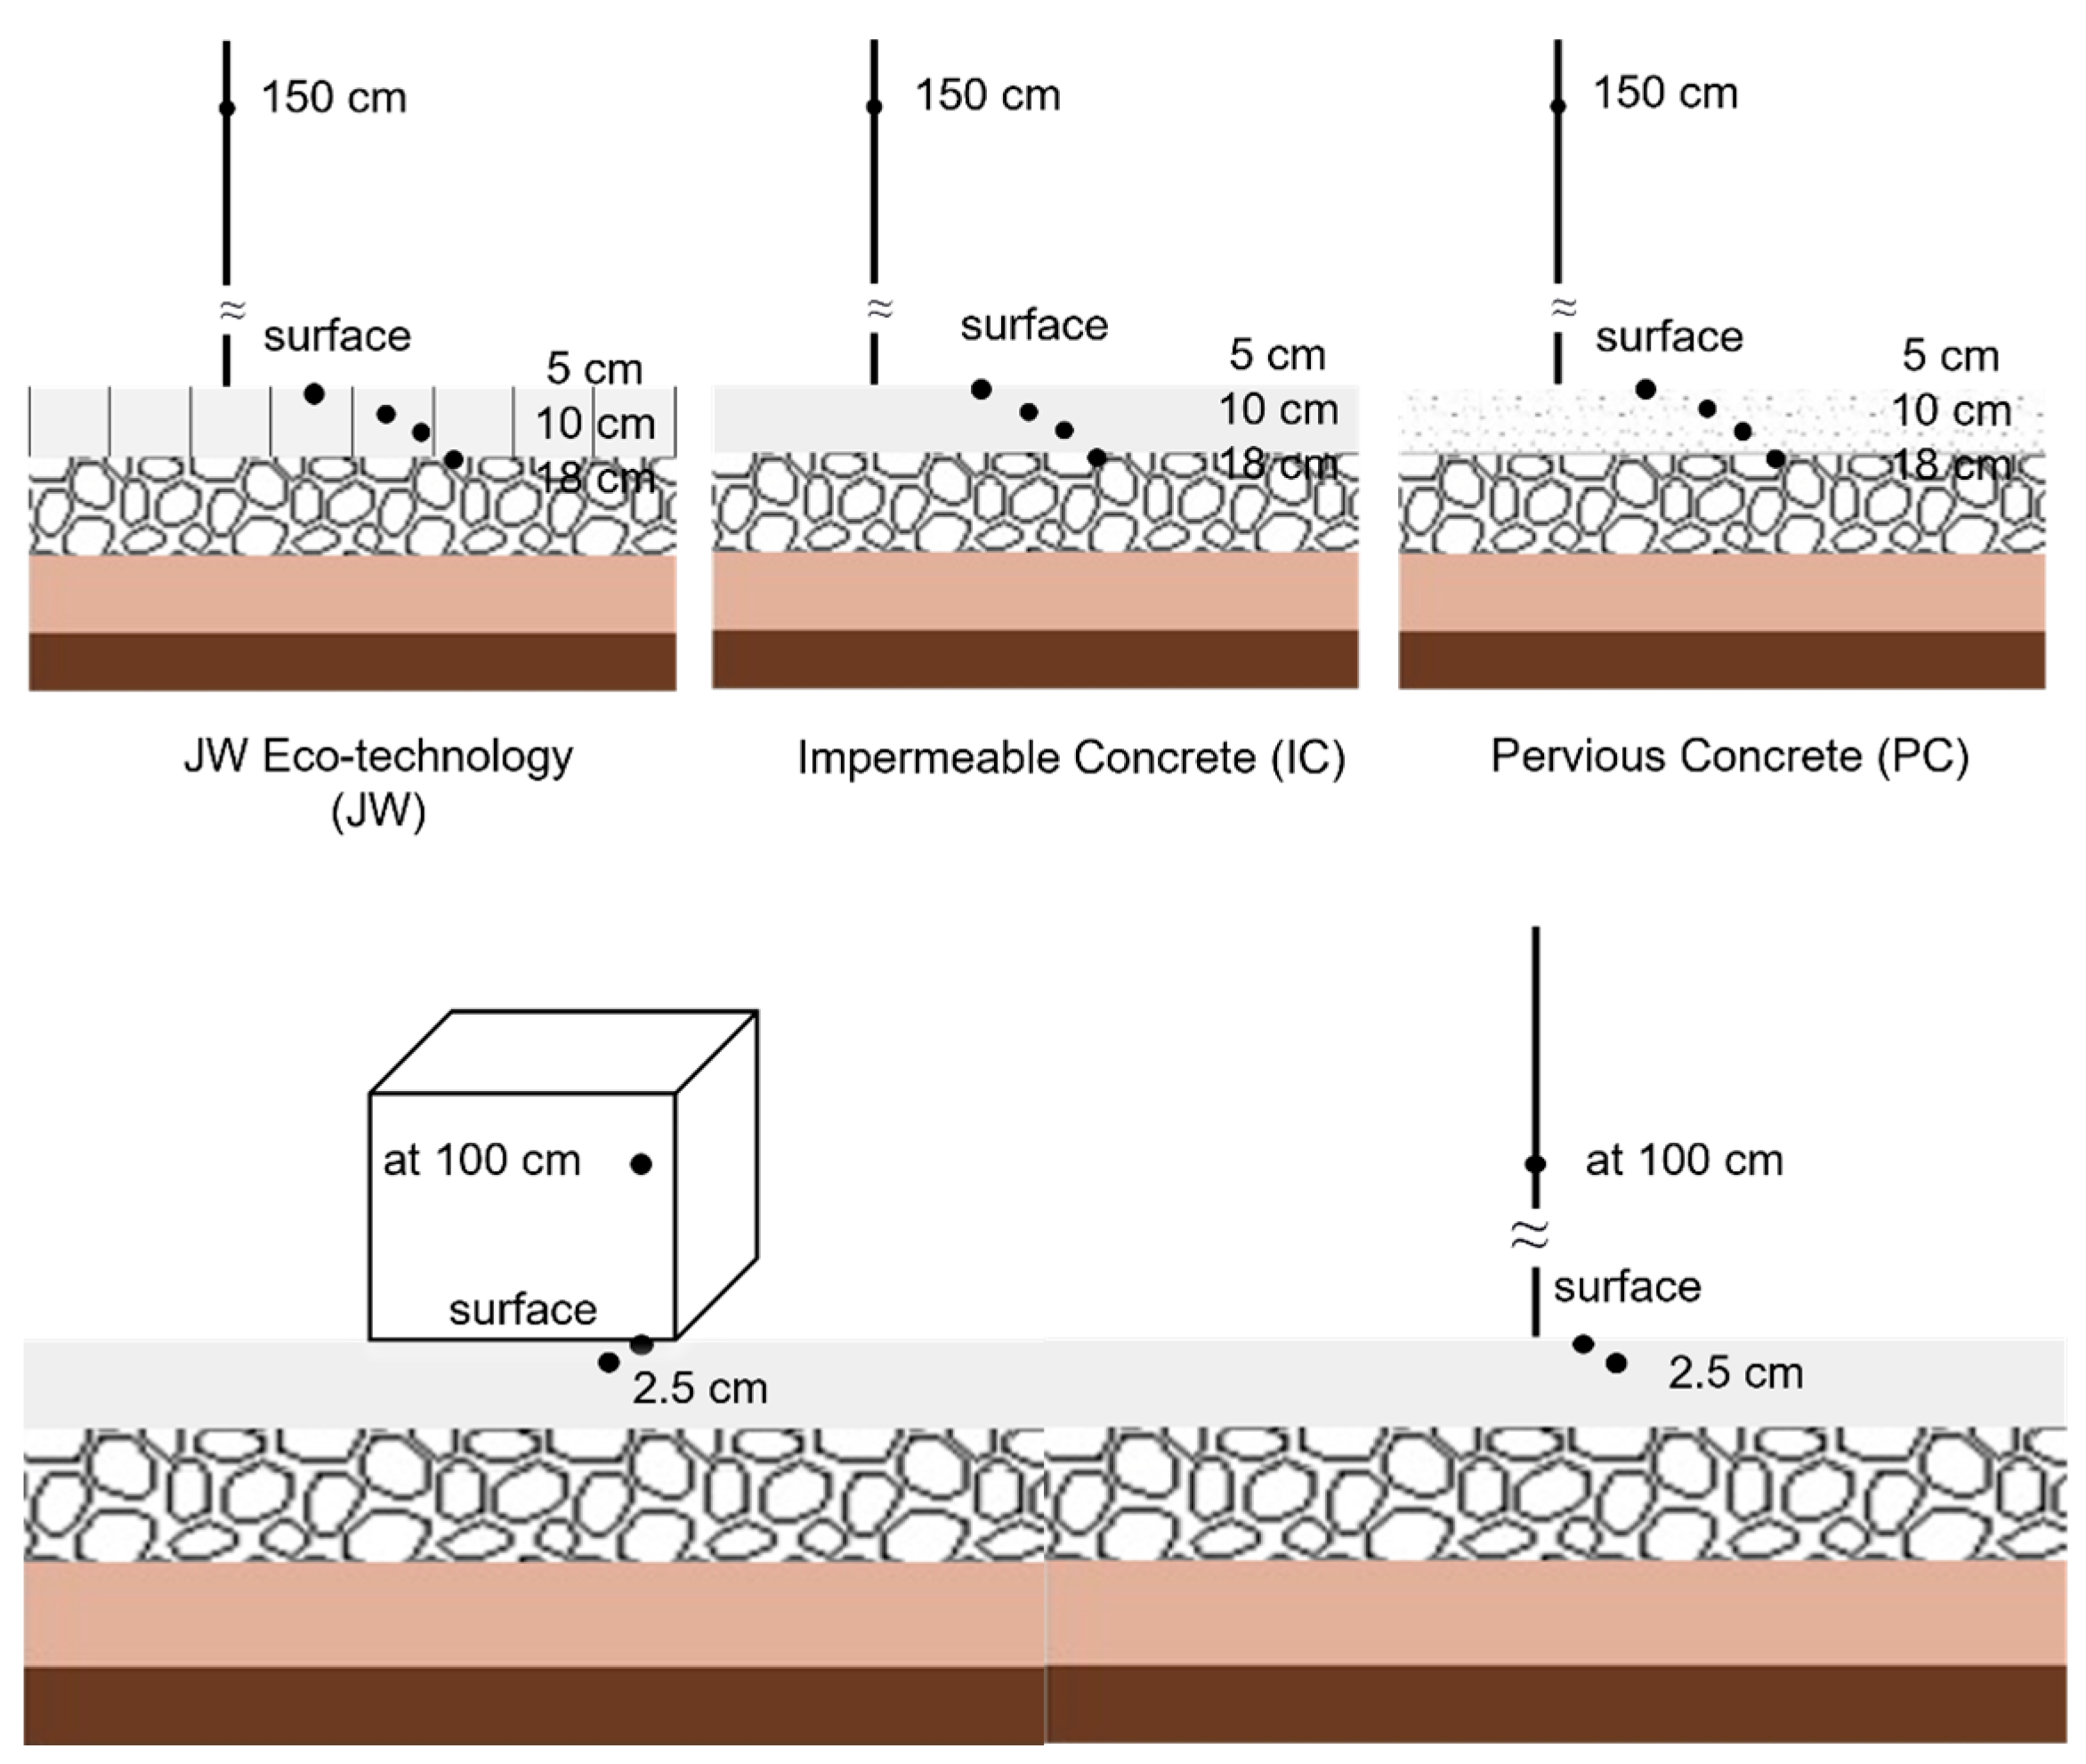
2.2. Temperature Measurement

2.2.1. Investigation Periods and Designs

In this study, two primary experimental designs were carried out to measure temperatures associated with the three pavement systems. Surface and air temperatures were recorded regularly between January 2022 and February 2024, except for periods when site maintenance and adjustments for designated experiments were made. Temperature profiles other than surface and air temperatures were collected based on one of the two designs and for a limited time. For Experiment A, sensors were placed near the center of the whole pavement slab for each pavement system and for surface and air temperatures above the pavement. Additional sensors were positioned at various depths within the pavements in the summer of 2023. As for Experiment B, the objective was to determine how shade affected the pavement surface temperatures. While sensors were placed near the center of each of the pavement pads without being sheltered or shaded, additional sensors were placed inside a 1.2 m × 1.2 m × 1.2 m (4 ft × 4 ft × 4 ft) open-top box. The sensors for surface temperature measurements were placed near the wall on the south side, and a piece of wood was put on top of the box above the sensors. This design allowed the sensors within the boxes to be covered by the shade of the wall of the box and the piece of wood. Detailed designs for the locations of sensors in both experiments are illustrated in Figure 2. Surface and air temperatures were collected based on the design for Experiment A between January 2022 and April 2022 and between May 2023 and February 2024; air temperatures were measured at 150 cm above the pavement surface, which was the same height as the near-site weather station. Surface and air temperatures were collected based on the design for Experiment B between May 2022 and April 2023; air temperatures were measured at 100 cm above the pavement surface, which was chosen because it was lower than the height of the boxes and allowed for the accurate measurement of temperature under shaded conditions.

2.2.2. Instruments

Pavement surface temperatures and air temperatures above each pavement system were measured by type K thermocouple sensors (measurement accuracy of 1.1 °C or 0.4% of reading) from Omega Engineering Inc. (Norwalk, CT, USA). Sper Scientific (Scottsdale, AZ, USA) 800024 four-channel data logging thermometers (accuracy 0.1% of reading and 0.7 °C) were used to record measurements at a 15-min interval. The loggers were secured in gasket-sealed, weatherproof outdoor enclosures with a layer of insulation in the inner wall. The loggers were placed in insulated bags to avoid damage due to inclement weather conditions in the winter. The meteorological parameters that reflected the weather and environmental conditions at the P3 site, including air temperature (at 150 cm height), solar radiation, and rainfall, were monitored every 15 min by Watchdog model 2900ET weather station (Spectrum Technologies Inc., Aurora, IL, USA) that was installed above a grass-covered surface approximately 30 m from the west side of the P3 site. Visual inspection served as a means to observe the status of the pavement surfaces with the aid of photos taken by trail cameras placed at the east and west ends of the P3 study site.

2.3. Data Analysis

In addition to utilizing descriptive statistics on temperature data, ANOVA tests were performed to determine significant differences across the three types of pavements. Tukey–Kramer post hoc tests were accessed to determine the material variations. Student’s t-test was used to determine significant temperature differences on the same pavement systems under different conditions. Correlations between surface and air temperatures, as well as between temperatures and certain meteorological and environmental parameters, were also investigated.

3. Results and Discussion

3.1. Surface and Air Temperatures Across the Pavement Systems

3.1.1. Overall Annual Surface and Air Temperature Profiles

The P3 site showed similar average surface temperatures across the pavement types, which were 14.8–15.1 °C, 14.6–15.8 °C, and 14.8–15.7 °C, while air temperatures above the corresponding pavement system ranged from 11.8–12.8 °C, 11.7–13.1 °C, and 11.8–13.6 °C, for IC, PC, and JW, respectively. Annual average surface temperatures were 2.1–3.1 °C higher than air temperatures for the same type of pavement. Overall, the three types of pavement systems produced similar annual average temperatures, with the surface and air temperatures differing by no more than 0.7 °C and 0.8 °C, respectively. The maximum surface temperatures ranged from 47.3–54.3 °C, while maximum air temperatures ranged from 37.4–42.1 °C, both of which were measured in the summer. On the contrary, the minimum surface temperatures recorded in winter decreased to −11.4–−22.4 °C, while air temperatures dropped to −14.3–−24.6 °C. In addition, the annual air temperatures measured at the near-site weather station on a grass-only area were lower than those measured above the three pavements most times during the study period; records showed air temperatures measured were lower than those above the pavements in the summer, and equal or slightly lower than those in the winter. In the summer season, the observation was inconsistent with studies showing that air temperatures above naturally covered surfaces tend to be cooler in comparison to artificial pavements [27,28]. This might be partially due to the evapotranspiration mechanism from the grass zone where the weather station was placed, which cools the surrounding environment by replenishing moisture. As the grass dried in the winter, such an effect might have less of an impact. Annual surface and air temperatures measured at the P3 site are summarized in Table 1. In addition, differences by average between summer maximum and winter minimum temperatures were distinct, with 67.4 °C, 69.9 °C, and 65.0 °C in surface temperature, and 59.3 °C, 57.1 °C, and 57.8 °C in air temperature for IC, PC, and JW, respectively, further analyses focused on temperature profiles in these two seasons (Table 1). It should be noted that while the annual temperature data shown in Table 1 were collected in the same calendar year (1 January to 31 December), the period of the summer season is defined as June, July, and August of the respective year, and winter season includes December the same year as summer months, and January and February the following year. The maximum surface temperature of the pavements exceeded 50 °C in the summer and dropped below −20 °C in the winter. Therefore, it is worth noting that some studies have suggested that freeze–thaw cycles can impact phase changes between water and ice and damage the pavement structure [29,30,31]. During this study period, the number of times the temperature transitioned through 0 °C was 24, 28, and 37 in the winter of 2022 and 25, 24, and 33 in the winter of 2023, for JW, IC, and PC, respectively. The impact of these temperature cycles was not explored in this study, but it is suggested as a future area of research on permeable pavements.

3.1.2. Seasonal Variations

As indicated in Table 1, for all three pavement systems, the average surface and air temperatures in the summer ranged from 29.2–30.0 °C and 23.4–24.3 °C, respectively. In the winter, average surface and air temperatures ranged from 1.4–2.7 °C and 1.0–1.9 °C, respectively. The trend showed that the ranges of surface and air temperatures were wider in the winter than in the summer during the study period. In another aspect, data displayed in Table 1 revealed different patterns between the gap of surface and air temperatures in the two seasons. The differences in surface and air temperatures were 5.5–6.6 °C in summer and 0.4–0.8 °C in winter across all pavement systems. Overall, annual average surface and air temperatures among the three pavements showed close ranges of values, temperature profiles in the summer and winter revealed seasonal variation, and the surface and air temperatures showed more profound differences in the summer than in the winter.

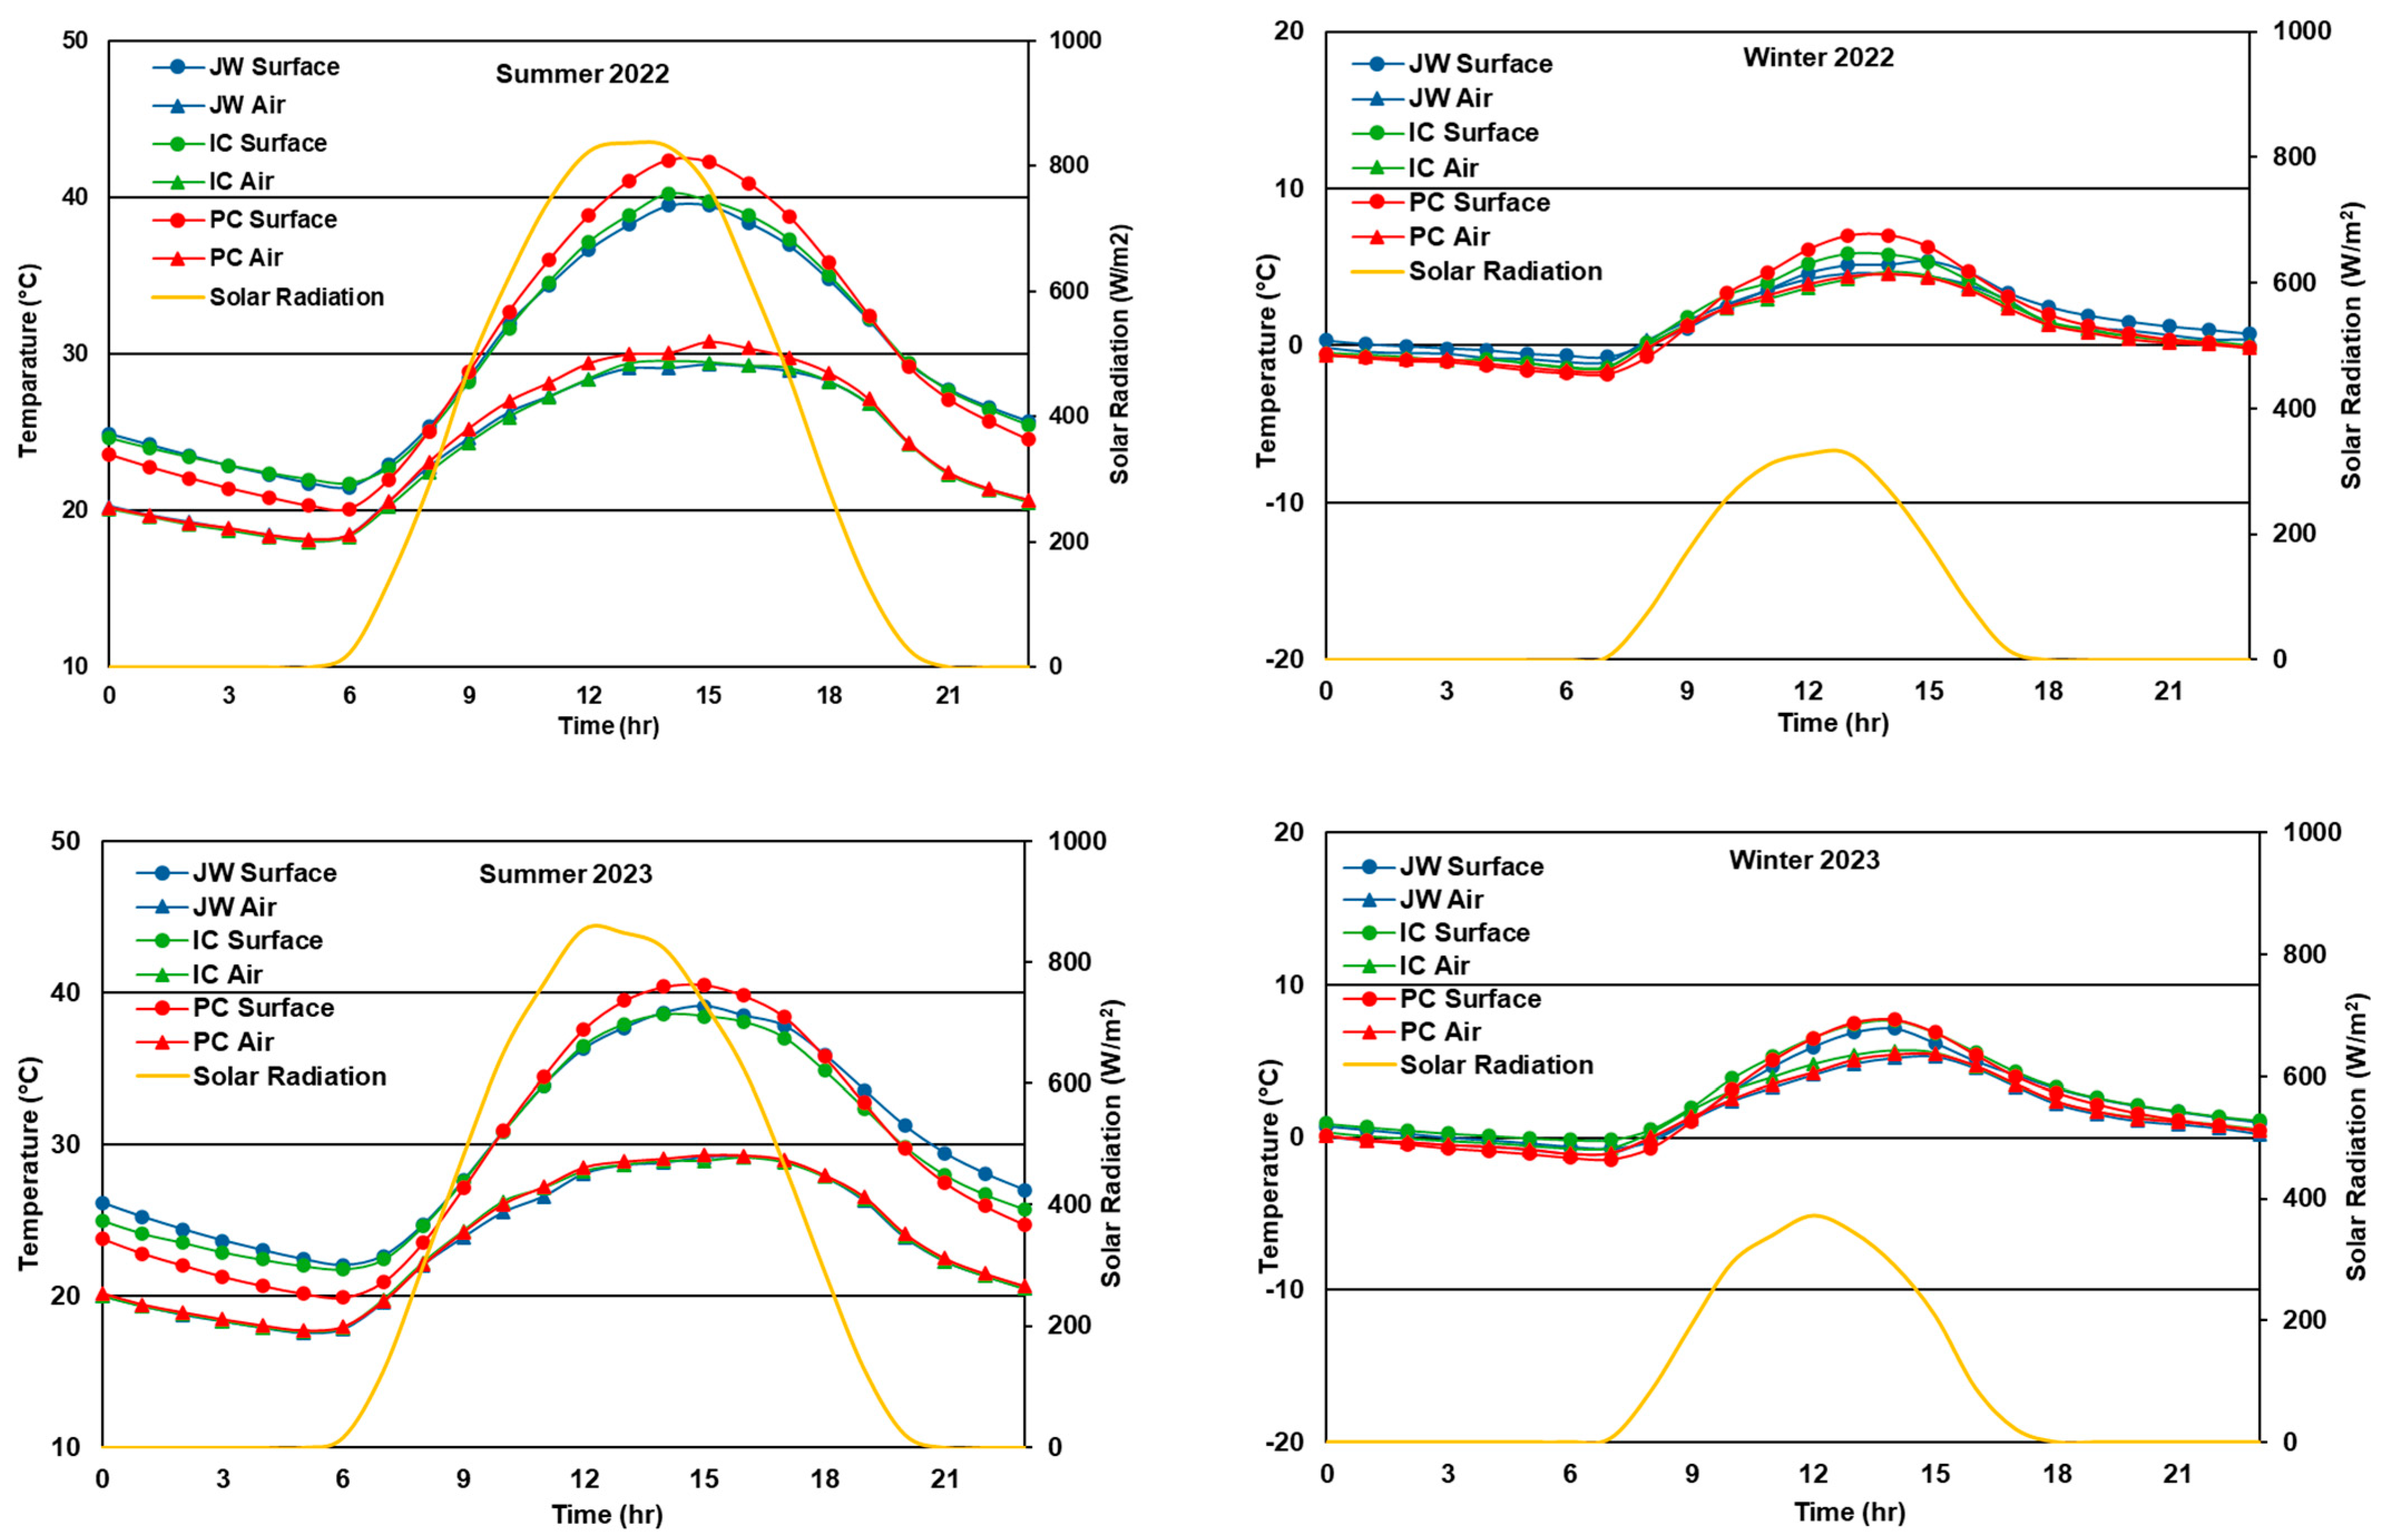
3.1.3. Diurnal Variation Observed in Summer and Winter

In this section, average hourly temperature curves for the summer and winter seasons in 2022 and 2023 are used as examples to display temperature profiles in the two seasons. Figure 3 illustrates the diurnal variation in surface and air temperatures associated with the three pavements in both the summer and winter. More descriptive statistics regarding temperature profiles in this figure are summarized in Supplementary Materials (Tables S1–S4).
In the summer, surface temperatures reached peak values between 14:00 and 15:00, at which time the temperature started to decrease overnight and until the early morning hours between 5:00 and 6:00, when minimum values were observed. The air temperature profile showed a similar trend to that of surface temperature, but the air temperature was lower than the surface temperature every hour, especially during daytime hours. It was observed that the surface temperature increased faster than the air temperature, starting in the early morning hours and continuing until both temperatures reached daily maximums. The surface temperature started to decrease faster than the air temperature until 19:00. Both temperatures displayed similar decreasing trends until the next morning. In the winter, a similar curve was observed with higher surface temperatures occurring between 14:00 and 15:00 and minimum values observed during early morning hours between 5:00 and 7:00. The air temperature profile also showed a similar trend to that of surface temperature in the winter, but the daily variation showed a more moderate fluctuation compared to the surface temperature. Similar to what was observed in the summer season, the air temperature was lower than the surface temperature every hour in the winter season, but the most distinct difference was around 12:00, and the difference was smaller than that in the summer season.
For each type of pavement system, the differences in annual surface and air temperatures were 3.0 °C, 2.9 °C, and 3.0 °C in 2022, and were 2.3 °C, 2.7 °C, and 2.1 °C in 2023 for IC, PC, and JW, respectively. The differences between average surface and air temperature in the two winter seasons ranged from 0.3–0.8 °C across the three pavement systems, implying that the differences between the two temperature values were comparatively narrower in the winter for all three pavement systems. However, on the other hand, the range of the differences in surface and air temperatures by average widened to 5.9 °C, 5.6 °C, and 6.2 °C for IC, PC, and JW, respectively, in summer. The curves of daily variation shown in Figure 3 displayed notable hourly differences between the surface and air temperature profiles of the three pavement systems, with profound differences in daytime hours for their surface temperatures in the summer for all three pavement systems, but air temperatures above each pavement system were comparatively closer. As illustrated in Figure 3, hourly temperature profiles between surface and air temperatures were substantially greater in the summer than in the winter for each type of pavement, and profound differences between surface and air temperatures occurred during daytime hours, from noon to afternoon. Meanwhile, solar radiation also peaked during those hours. During daytime hours in the summer, solar radiation was detected more than two times more than that detected in the winter, which resulted in the seasonal variation in the energy absorbed by the pavement surface from the sun. Figure 3 also displayed a phase lag between solar radiation and surface temperatures of the pavements. As the surface temperature rose after absorbing solar radiation, the air temperature obtained heat and warmed up through a heat exchange process. These findings are consistent with studies that have suggested that surface temperatures were strongly correlated with solar radiation [28,32,33]. The data further provide peak and trough values and the time at which they occurred (Table S5 in Supplementary Materials). Since the seasonal and daily variations suggest that the summer season exhibits more variation across the pavement systems, the following detailed analyses focus only on the summer temperatures in order to better understand the impact these pavements may have on urban heat islands.

3.2. Differences in Surface and Air Temperatures Across the Pavement Systems in Summer

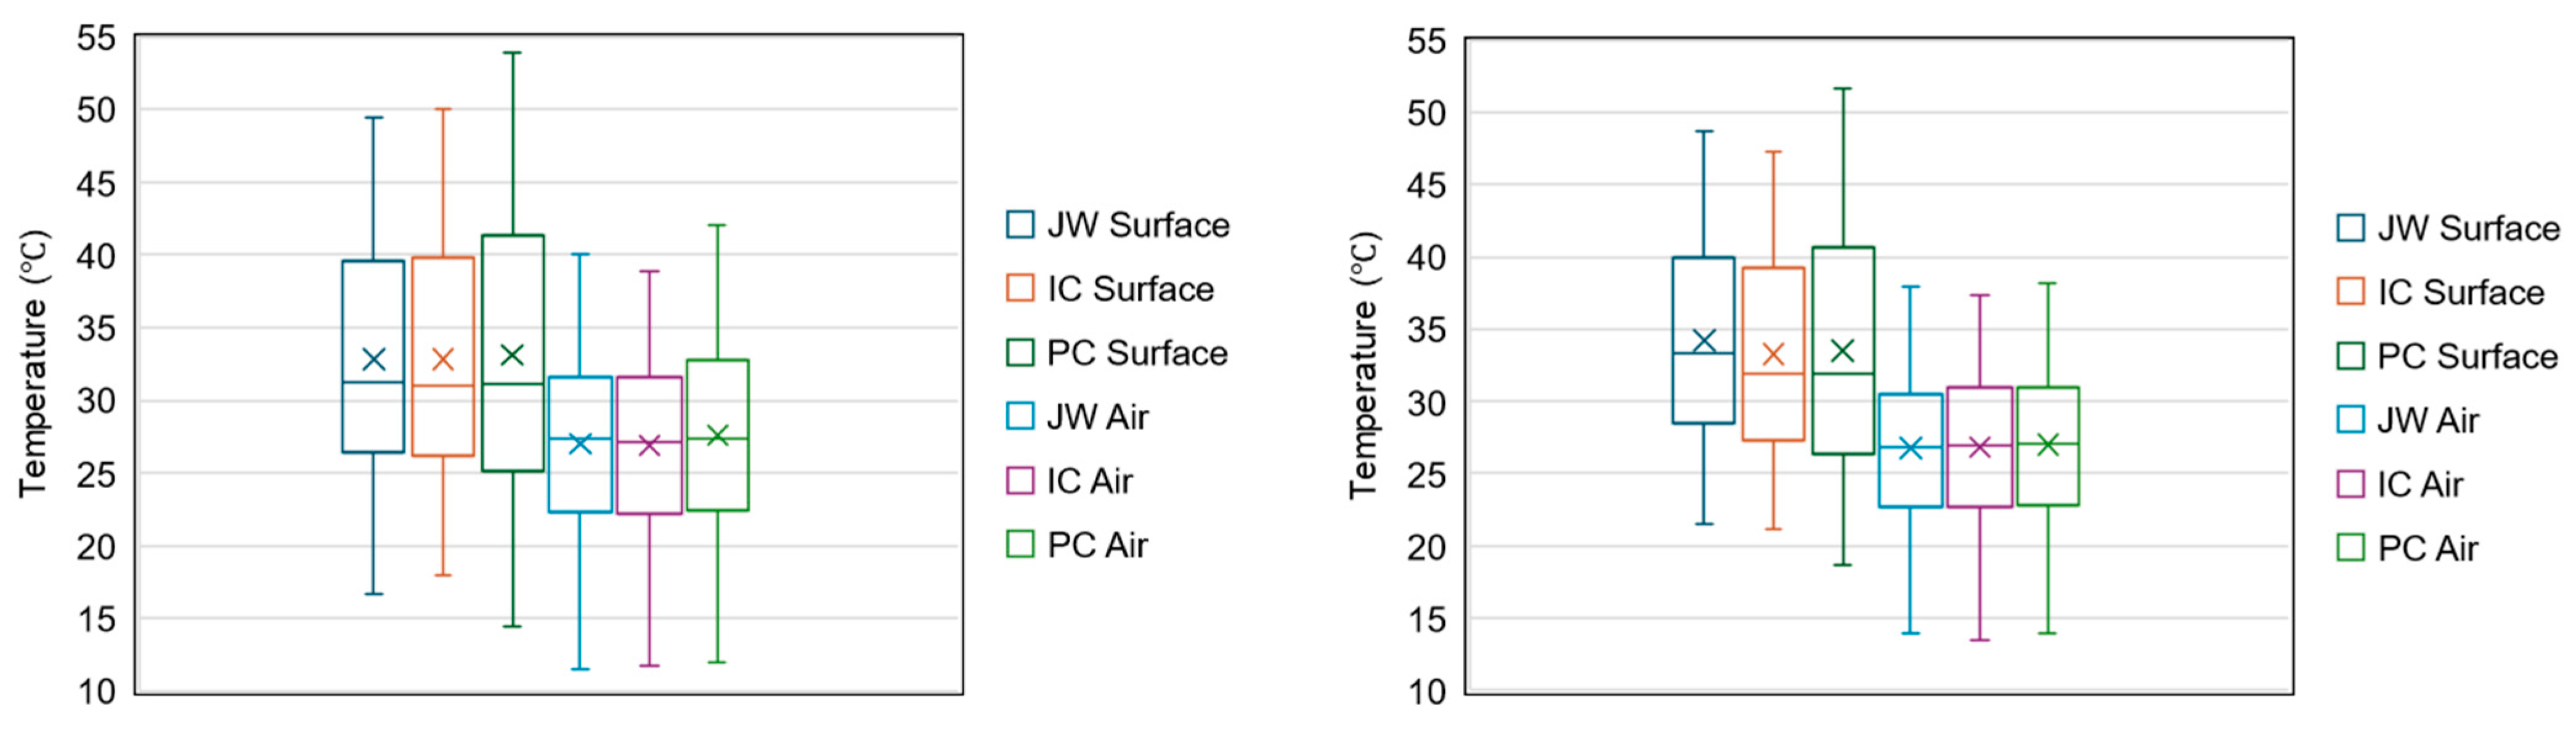
3.2.1. Average Surface and Air Temperatures

Overall, PC displayed a slightly higher daily variability in air temperatures than IC and JW, with differences ranging from 0.1–1.4 °C in summer. PC also showed greater daily variability in surface temperatures, with differences ranging from 3.8–5.3 °C.
Statistically, there were no significant differences in average surface temperatures in the two summers. To further analyze data by narrowing the time to multiple segments ranging from 6:00 to 20:00 when solar radiation was detected and from 21:00 to 5:00 h without solar radiation, an ANOVA test showed the existence of a significant difference (p < 0.05) among the pavement systems between 12:00 and 16:00. Tukey–Kramer post hoc tests determined that PC was significantly higher than IC and JW. As more temperature data under selected periods will be discussed, the results of ANOVA tests from this section will be summarized later.

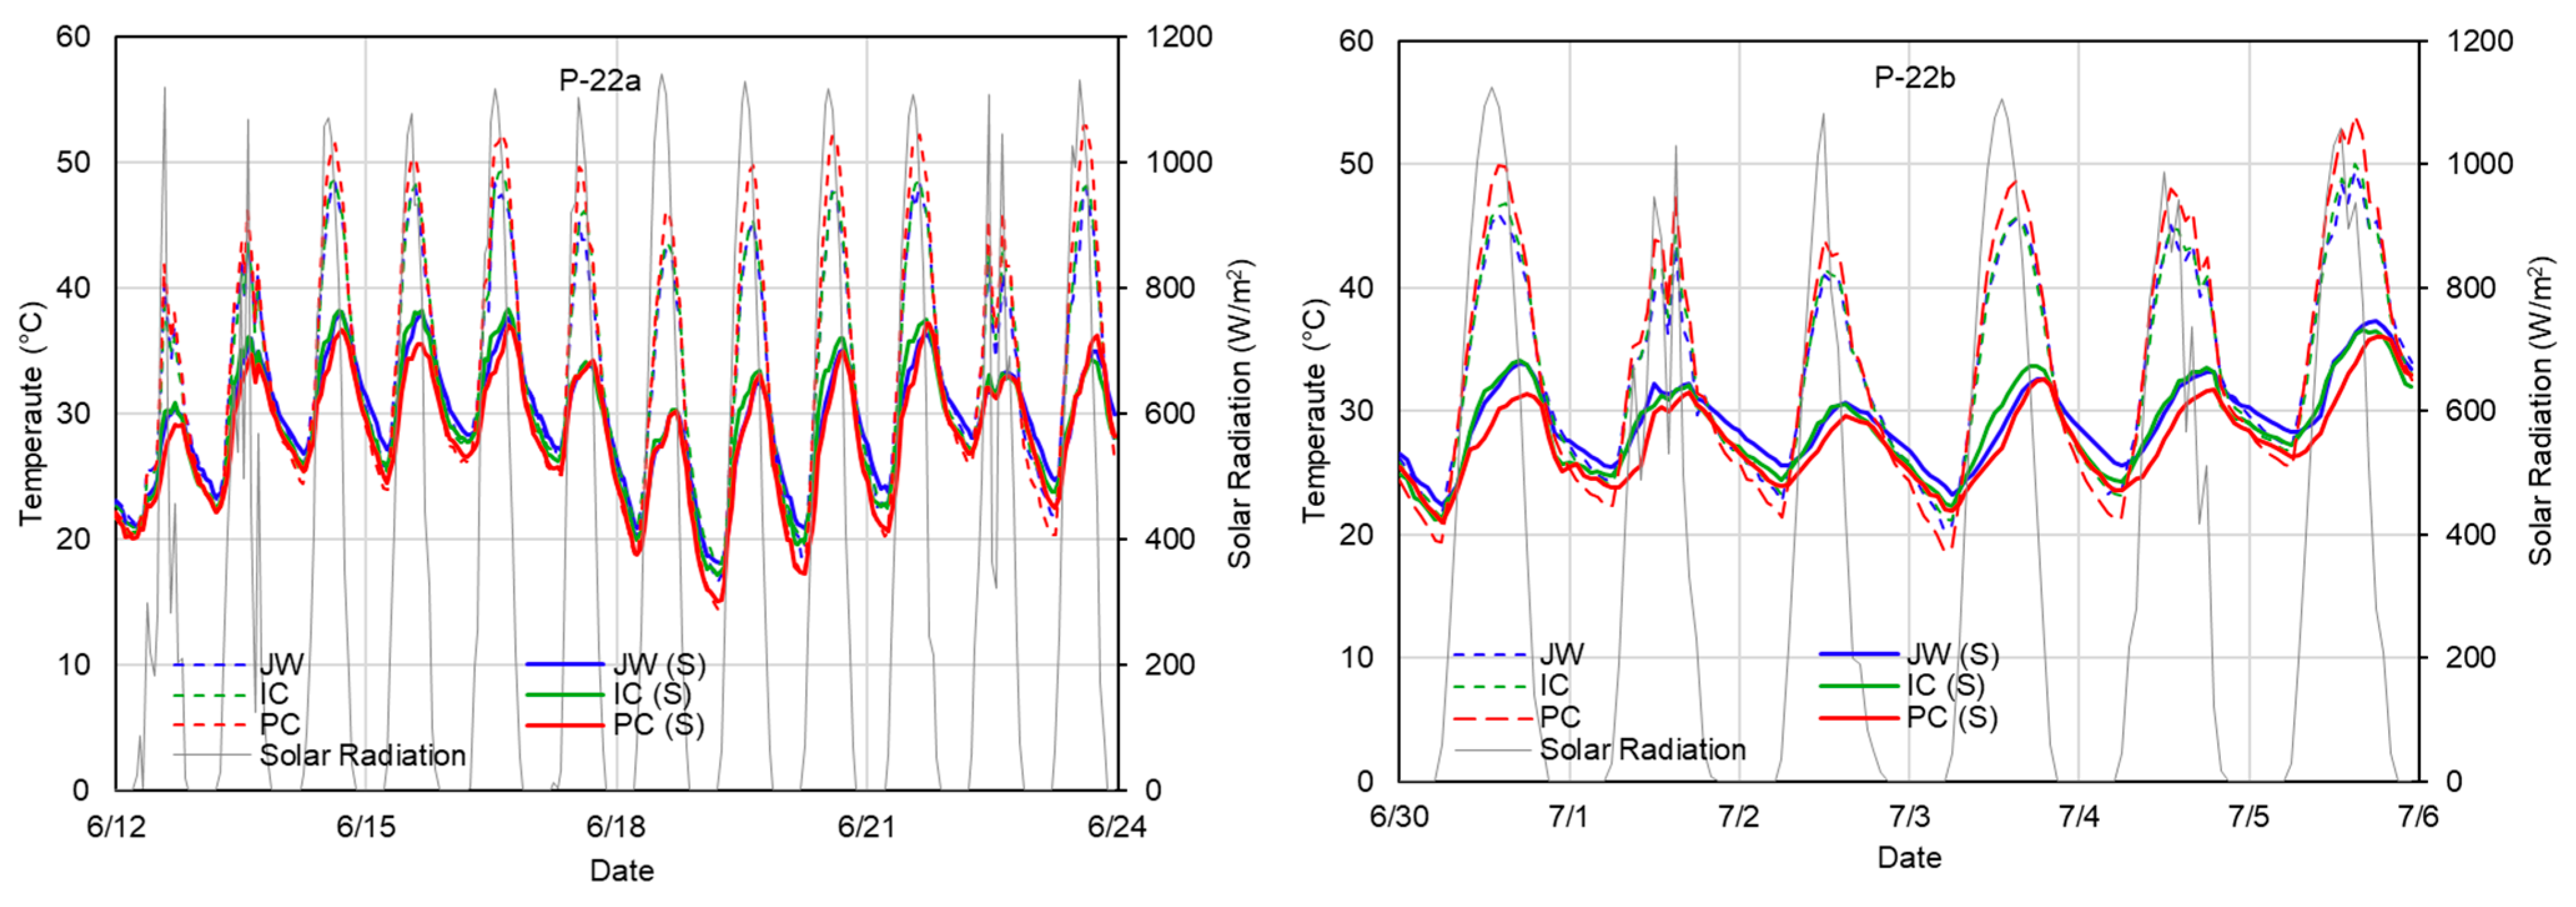
3.2.2. Comparison of Temperature Profiles During Consecutive Hot Days in Summer

As a crucial part of the project was to study the performance of the three pavement systems under hot weather conditions in the summer, this subsection will discuss data collected in the two selected periods, 12 June–23 June and 30 June–5 July, defined as P-22a and P-22b, respectively in 2022. Similarly, another two periods, 27 July–1 August and 20 August–25 August, in 2023 are defined as P-23a and P-23b, respectively, during which the daily maximum surface temperatures of at least one pavement system exceeded 40 °C (104 °F) for consecutive days, and during which rainfall was only observed one night during P-23b. Figure 4 summarizes the distribution of hourly surface and air temperatures during the selected periods.
During these selected periods, the three pavement systems showed similar average air temperatures across the pavements, between 26.9 °C and 27.6 °C in the selected periods in 2022 and between 26.8 °C and 27.0 °C in 2023. Similar average surface temperatures were also observed, between 32.8 °C and 33.1 °C in the selected periods in 2022 and between 33.2 °C and 34.2 °C in 2023. Comparing the temperature data in the selected periods, both average surface and air temperatures of the three pavement systems were 3.0–4.3 °C higher than those data for the two entire summer seasons.

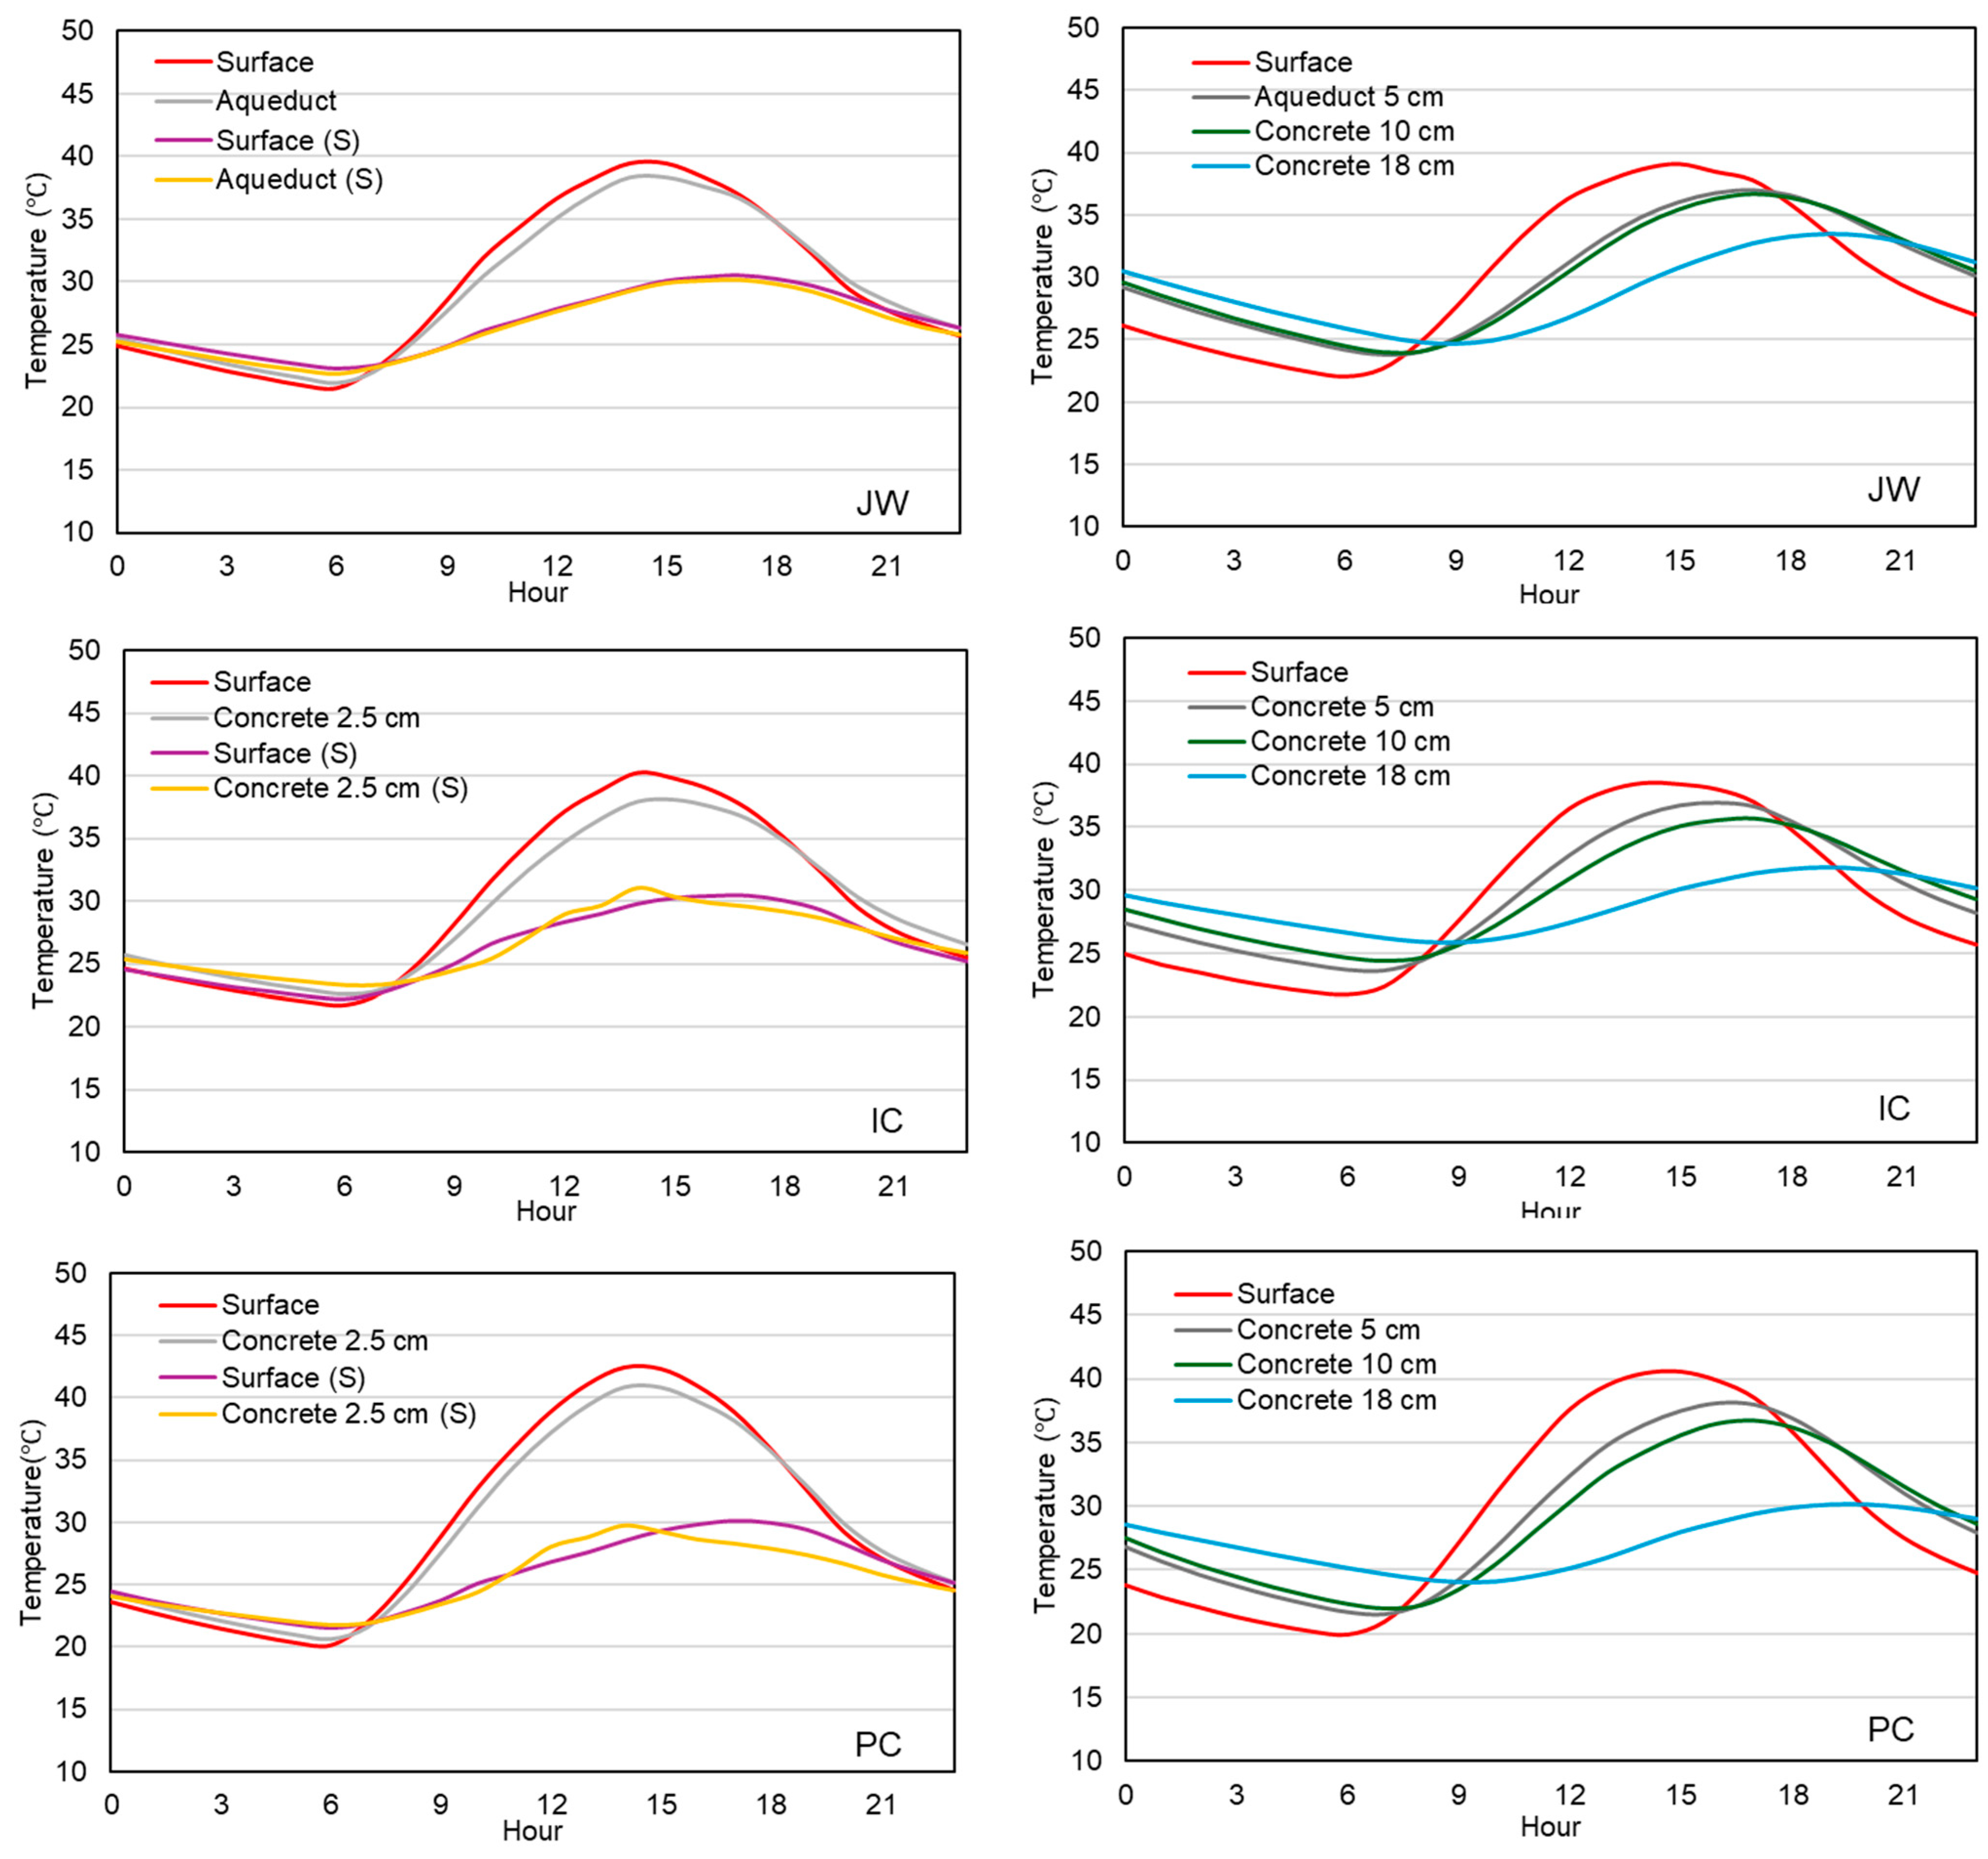
3.2.3. Comparison of Temperature Profiles Among Pavement Systems During Selected Hours

From Figure 4, PC also demonstrated a larger temperature range, with higher maximum and upper quartile and lower minimum and lower quartile, than that observed in IC and JW. Results from ANOVA tests performed with multiple ranges of daily hours are summarized in Table 2, along with ANOVA tests indicated in Section 3.2.1. More information about ANOVA tests is also available in Table S6 in Supplementary Materials.
Overall, there were no significant differences (p > 0.05) in surface temperatures nor in average air temperatures over 24-h data in the selected periods. Significant differences existed between PC and IC and between PC and JW, mostly in daytime hours between 12:00 and 16:00. Surface and air temperatures of PC were significantly higher than those of IC and JW. In another aspect, significant differences also existed between PC and JW and sometimes IC in nighttime hours between 21:00 and 5:00. However, on the contrary, the condition was when surface temperatures of JW were significantly higher than PC. It should be noted that ANOVA tests were also carried out for daytime hours ranging from 10:00 to 18:00, a few hours before and after the peak values of solar radiation, and when average surface temperatures were higher than 30 °C. However, significant differences were only found in the selected periods in 2022 but not in 2023, with temperatures of PC greater than those of IC and JW. Regardless of the significance of differences among the pavement systems, this was inconsistent with data showing that during the selected time, 6:00–20:00, surface temperatures of PC were higher than that of IC and JW. The results showed the materials likely determined the performance since the concrete used to fill the assembled frames of JW was the same material used for IC; the surface color of both was lighter than PC. Albedo is a measurement used to express the ratio of incident solar radiation received to the radiation reflected from a material. The lighter color—indicating higher albedo—absorbed less energy than the darker surface color [7,10,11,27,34]. On the contrary, the darker surface color emitted more heat in the form of longwave radiation on clear nights [32,34]. It has been reported that surface roughness also affected solar radiation absorption as materials with rougher textures on the surface suggested more areas received solar energy [33]. Furthermore, compared to differences in surface temperatures in summer 2022, the differences between PC and the other two pavements during 12:00–16:00 were lower in summer 2023. It is worth reiterating that the three pavement systems at the P3 site were exposed to the same physical environment and absent of any vehicular traffic. However, weathering might have contributed to a lighter surface color [14], and consequently, the appearance of the color of PC against IC and JW was less distinct and narrowed the differences in the surface temperatures. It is worth noting that a Bonferroni adjustment was performed in selected periods and further suggested that PC showed a significant difference (p = 0.0005, adjusted α = 0.00083) in surface temperatures between 12:00 and 16:00 in P22-a.

3.2.4. Correlation Between Surface Temperature, Air Temperature and Meteorological Parameters

In Table 3, a very strong correlation is displayed between surface and air temperatures for each type of pavement system, along with a strong correlation between surface temperature and solar radiation. These indicate that the pavement materials received and absorbed energy originating from sunlight, which caused an increase in temperature at the pavement surface and the air above the surface. Similarly, a lower but still strong correlation was observed between solar radiation and air temperatures measured above the surface.
A higher ambient air temperature may also indicate a higher air temperature above the surfaces, regardless of the paving material, since there is a strong correlation between ambient air temperatures and air temperatures above the pavement systems. Relative humidity showed moderate negative correlations with air temperatures. Wind speed showed moderate correlations with surface temperatures and moderate to strong correlations with air temperatures. This was partially due to low wind speed, 0–1 m/s, during the nighttime of the study period; wind speed during daytime hours was higher.

3.2.5. Comparison of Surface Temperatures of the P3 Sites and the Nearby Road

While it was not recorded continuously, during the selected period, the surface temperatures were measured on the side of the asphalt road outside FRTC between 14:00 and 16:00 most days during P-22a. Its average surface temperature was 54.2 °C, which was higher than those measured on any of the pavement systems at the P3 site during that period. The average surface temperature of the asphalt road was 9.3 °C, 6.6 °C, and 10.1 °C higher than that of IC, PC, and JW, respectively. The general trend is that the difference between the surface temperatures of the asphalt road and IC, PC, or JW increased as the temperature rose. The air temperatures measured by the side at 100 cm above the asphalt road did not show as much difference as shown in surface temperatures, less than 0.8 °C from PC.
As the period was on consecutive sunny days, the temperature difference was not likely due to evaporative cooling through water in or on top of the pavement [27,34,35]. As non-permeable asphalt pavement has a dark surface with a low albedo of around 0.1, and the average albedo of permeable concrete ranged from 0.25 to 0.35, which was approximately 0.05–0.15 lower than the conventional impermeable concrete [32,33,34,35,36]. Combined with the discussion in the previous section, this study suggests that thermal properties affect the absorption of solar energy, impacting the surface temperatures of various pavement systems. Furthermore, the P3 site and the section of asphalt road are located in an open area without many buildings, with average wind speed and gust winds of 2.4 m/s and 7.6 m/s, respectively. Studies suggested that wind convection lowered overall temperature and enhanced the decreasing rate of temperature of the pavement [10,29], but the differences in surface temperatures among these pavement systems were still observed.

3.3. Influence of Shade on the Surface Temperatures of the Pavement Systems

In this section, data recorded during P-22a and P-22b are utilized to show the shade effect observed on the P3 study site. Surface temperatures measured within the area covered by shade were compared with those temperatures measured outside the shadowy area, as demonstrated in Figure 5.
In general, as the sky was clear most of the time, solar radiation maintained a certain level of intensity during the periods. Overall, the phenomenon observed was that the surface temperature of PC was higher than that of IC and JW without any shade, similar to summer data presented in the previous section, but the surface temperatures were lower in the areas covered by shade for all pavement systems. Table 4 summarizes the differences in surface temperature with and without shade effect.
By looking at the 24-h average, it can be seen that the temperature lowered 4.0 °C, 5.1 °C, and 3.5 °C for IC, PC, and JW, respectively, when shade was introduced. Between 12:00 and 16:00, the average surface temperature cooled down to 10.7 °C on IC, 15.1 °C on PC, and 10.5 °C on JW with shades. During the same hours, the surface temperatures dropped as much as 15.0 °C on IC, 20.0 °C on PC, and 14.8 °C on JW in the areas covered by shades. PC cooled down much more than IC and JW, and the surface temperature of PC was lower than that of IC and JW in the shade. Consequently, the surface temperatures across the pavements were closer, which implied that the effectiveness of shade might mitigate overheated surface temperature in summer, regardless of the type of pavement used.
Furthermore, the result of the Student’s t-test (α = 0.05) applied to the average hourly data obtained for the whole summer in 2022 also showed that with the shade effect, average surface temperatures were significantly lower than those measured at locations without shade. The detailed temperature difference was 3.4 °C for IC (p = 0.002), 4.1 °C for PC (p = 0.002), and 2.8 °C for JW (p = 0.004). It was noticed that while the average surface temperature in the summer had differences less than 0.2 °C across pavement systems, the differences in surface temperatures measured covered by shade were as much as 1.1 °C, as PC that already showed cooler surface temperature during nighttime was much cooler in the shade in the daytime. In this study, creating shaded areas on the pavements proved to be a practical and efficient strategy to cool down the pavement surface temperatures efficiently. While there are strategies and available materials and pavement options, some of which are known to maintain a lower surface temperature [33,37,38,39,40,41], shade can be an easy way to reduce surface temperatures for pavement systems that are already installed and are similar to the systems in this study.

3.4. Additional Discussion on JW Eco-Technology Aqueducts

As the JW pavement system has not been used anywhere else in the USA, the temperatures associated with its aqueduct frame, a primary part of JW’s structure that also serves as rebar or steel rods to support the concrete and allow expansion and contraction of the poured concrete [23], were measured for the first time at the field-scale experimental site. The photos in Figure 6 are presented to further illustrate the aqueducts and frames in the structure of the JW pavement system.
Including temperatures associated with the JW aqueducts, Figure 7 demonstrates hourly average temperature profiles associated with the three pavement systems measured during summer 2022 and 2023.
As revealed in Figure 7, the temperatures measured at the aqueduct opening showed a similar trend to the surface temperatures. In the daytime, from 7:00 to 18:00, the temperature was lower than that of the surface, with differences of more than 1 °C between 10:00 and 15:00. The temperatures of the aqueduct opening obtained during nighttime hours were constantly lower than the surface temperature by approximately 0.6–0.7 °C. The temperature profile was also similar to the paving temperatures measured at a 2.5 cm depth in IC and PC. In addition, hourly average temperatures obtained at the JW concrete surface covered by shade revealed slightly warmer temperatures than the aqueduct opening covered by shade. Furthermore, Figure 7 showed temperatures measured at 5 cm in the JW aqueduct were higher than those measured at 5 cm depth in the concrete of IC and PC between evening hours and by 9:00 in the morning. It also showed temperatures measured at 5 cm in the JW aqueduct were lower than those measured at 5 cm depth in the concrete of IC and PC, primarily between 11:00 and 16:00. Overall, the data showed temperatures measured at 5 cm in the JW aqueduct were closer to those measured at 10 cm depth, regardless of the surface temperature. The aqueduct openings were fully surrounded by concrete. As indicated, the material of the JW aqueduct is polypropylene (PP) and is considered a good thermal insulative material with a low thermal conductivity of 0.11–0.17 W/Mk at approximately room temperature [42,43,44]. Therefore, the material might somewhat prevent heat transfer from the concrete. In another aspect, it was observed that the position in the aqueduct was not always directly exposed to sunlight, which caused slightly lower temperatures. Also, as described as an air-cycle frame [20,23], the JW aqueducts might somewhat encourage air circulation that helps transfer heat with the aid of wind advection above the surface; temperatures measured along the aqueduct might be affected. As results shown in the section were temperature data measured at the aqueduct opening and another position associated with the aqueduct, additional studies may be necessary to fully assess the performance of the full depth of the aqueduct, from the pavement surface to the gravel layer below. Also, discussions in this section were based on the hourly average data in the summer, while daily weather conditions were not the same every day. Furthermore, at the P3 site, there are 5,152 aqueduct openings evenly distributed on the JW surface, creating 0.4 m2 of total opening area, which is 0.7% of the total area of 59.5 m2 that is paved with the JW Eco-technology. At the current scale, how the comparatively lower temperature in the aqueduct influenced overall surface temperature and air temperature might not be clearly seen. As limited literature could be found, more experiments are needed to ensure proper interpretation of the effects of JW aqueducts related to the thermal properties and air circulation dynamics. Further investigations on measuring temperature profiles along the aqueducts and under various weather conditions are necessary and highly recommended.

4. Conclusions

This study investigated temperatures associated with conventional impermeable concrete (IC), pervious concrete (PC), and the patented JW Eco-technology (JW). Annual average temperatures over the study period were consistent for the three types of pavement systems. Overall, the trend showed that annual average surface temperatures were higher than the average air temperatures for each type of pavement every year during the study period. Seasonal variations were observed in the summer and winter seasons, and the differences between the two values were higher in the summer season than in the winter season. Furthermore, the diurnal variations observed suggested that the differences between surface and air temperatures were primarily during daytime hours, especially in the summer. No significant differences in average surface temperatures nor in air temperatures were found across the three pavements in the summer season. Nonetheless, significant differences among pavement systems were observed during selected hot periods in the summer season, when average surface temperatures of PC were significantly higher than that of IC and JW during 12:00–16:00 in the daytime, while the surface temperature of PC was lower than that of IC and JW during 21:00–5:00 nighttime and morning hours. To alleviate the surface temperature of the pavement on hot summer days, it was found that shade effectively lowered surface temperatures across all three pavements. Average surface temperatures measured in the area covered by shade were significantly lower than the area directly exposed to sunlight for each type of pavement. Moreover, the surface temperatures of PC were lower than those of IC and JW in the shade. Notable findings of this study indicate that:
  • PC, IC, and JW demonstrated consistent average annual temperatures;
  • Seasonal and diurnal variations revealed that summer is the season when significant differences were found across PC, IC, and JW;
  • PC showed higher surface temperature during 12:00–16:00 but was lower during 21:00–5:00 than that of IC and JW;
  • Shade effectively reduced the surface temperatures of all pavements during hot summer days.
Future work may also include measurements of energy flux and heat storage of each type of pavement under various weather conditions. In addition, the shade effect to cool down surface temperatures observed in the study may be extended and combined with the effect of spraying water on the pavement surface. Finally, JW’s temperature measured in the aqueduct opening showed lower values than the surface temperature, and the temperature measured 5 cm deep in the aqueduct was closer to the temperatures measured at 10 cm deep in the concrete. Therefore, its potential to impact overall pavement temperatures at a larger scale is suggested for further investigation.

Supplementary Materials

The following supporting information can be downloaded at: https://www.mdpi.com/article/10.3390/environments12060192/s1. Table S1: Descriptive statistics of surface and air temperatures (°C) of the pavement systems in summer 2022; Table S2: Descriptive statistics of surface and air temperatures (°C) of the pavement systems in winter 2022; Table S3: Descriptive statistics of surface and air temperatures (°C) of the pavement systems in summer 2023; Table S4: Descriptive statistics of surface and air temperatures (°C) of the pavement systems in winter 2023; Table S5: Maximum and minimum hourly average surface and air temperatures (°C) of the pavement systems in summer and winter seasons in 2022 and 2023; Table S6: ANOVA run on surface and air temperatures (°C) across the three pavement systems in summer 2022 and summer 2023 (α = 0.05); Table S7: ANOVA tests run on surface and air temperatures (°C) across the three pavement systems in selected periods during summer 2022 (α = 0.05); Table S8: ANOVA tests run on surface and air temperatures (°C) across the three pavement systems in selected periods during summer 2023 (α = 0.05).

Author Contributions

Conceptualization, L.-M.C., J.-W.C., T.J.L. and P.C.D.; Resource, L.-M.C., J.-W.C., T.J.L. and P.C.D.; Methodology, L.-M.C., T.J.L. and P.C.D.; P.C.D.; Investigation, L.-M.C., T.J.L. and P.C.D.; Formal analysis, L.-M.C.; Data curation, L.-M.C. and P.C.D.; Funding acquisition, P.C.D.; Project administration, P.C.D.; Writing—original draft, L.-M.C. and P.C.D.; Writing—review and editing, L.-M.C. and P.C.D. All authors have read and agreed to the published version of the manuscript.

Funding

This work was funded by gifts from a consortium of sources.

Data Availability Statement

The data presented in this study are available upon request from the corresponding author.

Acknowledgments

This study would not have been possible without in-kind support, including materials and consultation for the installation of JW Eco-technology, from the whole team of Ding Tai Co., Ltd. The authors would also like to thank the following UIUC colleagues: James Baltz, Computer-Assisted Instructional Design Specialist of the Department of Agricultural and Consumer Economics, for the photo of the P3 study site.

Conflicts of Interest

The author, Jui-Wen Chen, is the patent holder of JW Eco-technology. However, he was only engaged in site development and installation to ensure proper implementation of the JW Eco-technology system, as it had never been installed in the U.S. previously. He declares no influence over the study design, data interpretation, results, discussion, or conclusions of this study. Other authors declare no conflicts of interest. The funders had no role in the design of the study; in the collection, analyses, or interpretation of data; in the writing of the manuscript, or in the decision to publish the results.

References

  1. Masson-Delmotte, V.P.; Zhai, P.; Pirani, S.L.; Connors, C.; Péan, S.; Berger, N.; Caud, Y.; Chen, L.; Goldfarb, M.I.; Scheel Monteiro, P.M. IPCC, 2021: Summary for policymakers. In Climate Change 2021: The Physical Science Basis. Contribution of Working Group I to the Sixth Assessment Report of the Intergovernmental Panel on Climate Change; Cambridge University Press: Cambridge, UK, 2021. [Google Scholar]
  2. United Nations, Department of Economic and Social Affairs. World Urbanization Prospects: The 2018 Revision; United Nations: New York, NY, USA, 2019. [Google Scholar] [CrossRef]
  3. Oke, T.R. The distinction between canopy and boundary-layer urban heat islands. Atmosphere 1976, 14, 268–277. [Google Scholar] [CrossRef]
  4. Williams, T.B. Microclimatic temperature relationships over different surfaces. J. Geogr. 1991, 90, 285–291. [Google Scholar] [CrossRef]
  5. Rosenfeld, A.H.; Akbari, H.; Bretz, S.; Fishman, B.L.; Kurn, D.M.; Sailor, D.; Taha, H. Mitigation of urban heat islands: Materials, utility programs, updates. Energy Build. 1995, 22, 255–265. [Google Scholar] [CrossRef]
  6. Gago, E.J.; Roldan, J.; Pacheco-Torres, R.; Ordóñez, J. The city and urban heat islands: A review of strategies to mitigate adverse effects. Renew. Sustain. Energy Rev. 2013, 25, 749–758. [Google Scholar] [CrossRef]
  7. Edmondson, J.L.; Stott, I.; Davies, Z.G.; Gaston, K.J.; Leake, J.R. Soil surface temperatures reveal moderation of the urban heat island effect by trees and shrubs. Sci. Rep. 2016, 6, 33708. [Google Scholar] [CrossRef]
  8. Founda, D.; Santamouris, M. Synergies between urban heat island and heat waves in Athens (Greece), during an extremely hot summer (2012). Sci. Rep. 2017, 7, 10973. [Google Scholar] [CrossRef]
  9. Chen, Y.C.; Chiu, H.W.; Su, Y.F.; Wu, Y.C.; Cheng, K.S. Does urbanization increase diurnal land surface temperature variation? Evidence and implications. Landsc. Urban Plan. 2017, 157, 247–258. [Google Scholar] [CrossRef]
  10. Tan, S.A.; Fwa, T.F. Influence of pavement materials on the thermal environment of outdoor spaces. Build. Environ. 1992, 27, 289–295. [Google Scholar] [CrossRef]
  11. Gui, J.; Phelan, P.E.; Kaloush, K.E.; Golden, J.S. Impact of pavement thermophysical properties on surface temperatures. J. Mater. Civ. Eng. 2007, 19, 683–690. [Google Scholar] [CrossRef]
  12. Shooshtarian, S.; Rajagopalan, P. Daytime thermal performance of different urban surfaces: A case study in educational institution precinct of Melbourne. Archit. Sci. Rev. 2018, 61, 29–47. [Google Scholar] [CrossRef]
  13. Asaeda, T.; Ca, V.T.; Wake, A. Heat storage of pavement and its effect on the lower atmosphere. Atmos. Environ. 1996, 30, 413–427. [Google Scholar] [CrossRef]
  14. Akbari, H.; Matthews, H.D.; Seto, D. The long-term effect of increasing the albedo of urban areas. Environ. Res. Lett. 2012, 7, 024004. [Google Scholar] [CrossRef]
  15. Mohajerani, A.; Bakaric, J.; Jeffrey-Bailey, T. The urban heat island effect, its causes, and mitigation, with reference to the thermal properties of asphalt concrete. J. Environ. Manag. 2017, 197, 522–538. [Google Scholar] [CrossRef] [PubMed]
  16. Zhao, L.; Oleson, K.; Bou-Zeid, E.; Krayenhoff, E.S.; Bray, A.; Zhu, Q.; Zheng, Z.; Chen, C.; Oppenheimer, M. Global multi-model projections of local urban climates. Nat. Clim. Chang. 2021, 11, 152–157. [Google Scholar] [CrossRef]
  17. U.S. Environmental Protection Agency (U.S. EPA). Low Impact Development (LID): A Literature Review; EPA-841-B-00-005; U.S. Environmental Protection Agency: Washington, DC, USA, 2000.
  18. Scholz, M.; Grabowiecki, P. Review of permeable pavement systems. Build. Environ. 2007, 42, 3830–3836. [Google Scholar] [CrossRef]
  19. Mullaney, J.; Lucke, T. Practical review of pervious pavement designs. CLEAN–Soil Air Water 2014, 42, 111–124. [Google Scholar] [CrossRef]
  20. Liu, C.M.; Chen, J.W.; Hsieh, Y.S.; Liou, M.L.; Chen, T.H. Build sponge eco-cities to adapt hydroclimatic hazards. In Handbook of Climate Change Adaptation; Filho, W.L., Ed.; Springer: Berlin/Heidelberg, Germany, 2015. [Google Scholar] [CrossRef]
  21. Chen, L.M.; Chen, J.W.; Chen, T.H.; Lecher, T.; Davidson, P.C. Measurement of permeability and comparison of pavements. Water 2019, 11, 444. [Google Scholar] [CrossRef]
  22. Chen, L.M.; Chen, J.W.; Lecher, T.; Chen, T.H.; Davidson, P. Assessment of clogging of permeable pavements by measuring change in permeability. Sci. Total Environ. 2020, 749, 141352. [Google Scholar] [CrossRef]
  23. Liu, C.M.; Chen, J.W.; Tsai, J.H.; Lin, W.S.; Yen, M.T.; Chen, T.H. Experimental studies of the dilution of vehicle exhaust pollutants by environment-protecting pervious pavement. J. Air Waste Manag. Assoc. 2012, 62, 92–102. [Google Scholar] [CrossRef]
  24. Fan, L.F.; Wang, S.F.; Chen, C.P.; Hsieh, H.L.; Chen, J.W.; Chen, T.H.; Chao, W.L. Microbial community structure and activity under various pervious pavements. J. Environ. Eng. 2013, 140, 04013012. [Google Scholar] [CrossRef]
  25. Architecture and Building Research Institute of Taiwan. Manual of Low Embodied-Carbon Building Rating System; Architecture and Building Research Institute of Taiwan: New Taipei City, Taiwan, 2023. [Google Scholar]
  26. China Municipality. Sponge City Construction: Practical Technical Handbook; China Building Materials Industry Press: Beijing, China, 2017. [Google Scholar]
  27. Lin, T.P.; Ho, Y.F.; Huang, Y.S. Seasonal effect of pavement on outdoor thermal environments in subtropical Taiwan. Build. Environ. 2007, 42, 4124–4131. [Google Scholar] [CrossRef]
  28. Srivanit, M.; Hokao, K. Evaluating the cooling effects of greening for improving the outdoor thermal environment at an institutional campus in the summer. Build. Environ. 2013, 66, 158–172. [Google Scholar] [CrossRef]
  29. Simonsen, E.; Isacsson, U. Thaw weakening of pavement structures in cold regions. Cold Reg. Sci. Technol. 1999, 29, 135–151. [Google Scholar] [CrossRef]
  30. ud Din, I.M.; Mir, M.S.; Farooq, M.A. Effect of Freeze-Thaw Cycles on the Properties of Asphalt Pavements in Cold Regions: A Review. Transp. Res. Procedia 2020, 48, 3634–3641. [Google Scholar] [CrossRef]
  31. Bäckström, M. Ground temperature in porous pavement during freezing and thawing. J. Transp. Eng. 2000, 126, 375–381. [Google Scholar] [CrossRef]
  32. Wu, H.; Sun, B.; Li, Z.; Yu, J. Characterizing thermal behaviors of various pavement materials and their thermal impacts on ambient environment. J. Clean. Prod. 2018, 172, 1358–1367. [Google Scholar] [CrossRef]
  33. Doulos, L.; Santamouris, M.; Livada, I. Passive cooling of outdoor urban spaces: The role of materials. Sol. Energy 2004, 77, 231–249. [Google Scholar] [CrossRef]
  34. Li, H.; Harvey, J.T.; Holland, T.J.; Kayhanian, M. The use of reflective and permeable pavements as a potential practice for heat island mitigation and stormwater management. Environ. Res. Lett. 2013, 8, 015023. [Google Scholar] [CrossRef]
  35. Kevern, J.T.; Schaefer, V.R.; Wang, K.J. Temperature behavior of pervious concrete systems. Transp. Res. Rec. 2009, 2098, 94–101. [Google Scholar] [CrossRef]
  36. Zhang, R.; Jiang, G.; Liang, J. The albedo of pervious cement concrete linearly decreases with porosity. Adv. Mater. Sci. Eng. 2015, 2015, 746592. [Google Scholar] [CrossRef]
  37. Efthymiou, C.; Santamouris, M.; Kolokotsa, D.; Koras, A. Development and testing of photovoltaic pavement for heat island mitigation. Sol. Energy 2016, 130, 148–160. [Google Scholar] [CrossRef]
  38. Price, A.; Jones, E.C.; Jefferson, F. Vertical greenery systems as a strategy in urban heat island mitigation. Water Air Soil Pollut. 2015, 226, 247. [Google Scholar] [CrossRef]
  39. Qin, Y. A review on the development of cool pavements to mitigate urban heat island effect. Renew. Sustain. Energy Rev. 2015, 52, 445–459. [Google Scholar] [CrossRef]
  40. Rossi, F.; Castellani, B.; Presciutti, A.; Morini, E.; Anderini, E.; Filipponi, M.; Nicolini, A. Experimental evaluation of urban heat island mitigation potential of retro-reflective pavement in urban canyons. Energy Build. 2016, 126, 340–352. [Google Scholar] [CrossRef]
  41. Santamouris, M.; Synnefa, A.; Karlessi, T. Using advanced cool materials in the urban built environment to mitigate heat islands and improve thermal comfort conditions. Sol. Energy 2011, 85, 3085–3102. [Google Scholar] [CrossRef]
  42. Weidenfeller, B.; Höfer, M.; Schilling, F.R. Thermal conductivity, thermal diffusivity, and specific heat capacity of particle filled polypropylene. Compos. Part A Appl. Sci. Manuf. 2004, 35, 423–429. [Google Scholar] [CrossRef]
  43. Guidetti, G.P.; Rigosi, G.L.; Marzola, R. The use of polypropylene in pipeline coatings. Prog. Org. Coat. 1996, 27, 79–85. [Google Scholar] [CrossRef]
  44. Hongyu Chen, H.; Ginzburg, V.V.; Yang, J.; Yang, Y.; Liu, W.; Huang, Y.; Du, L.; Chen, B. Thermal conductivity of polymer-based composites: Fundamentals and applications. Prog. Polym. Sci. 2016, 59, 41–85. [Google Scholar] [CrossRef]
Figure 1. (top) The overview of the current status of the P3 site, including the water collection tanks below the white metal enclosures (photo courtesy of James Baltz). (bottom) Overview of the design of the three pavement systems at the P3 site.
Environments 12 00192 g001
Figure 2. Experimental designs and positions where thermocouple sensors were placed. The black dots indicate the placement of the sensors. (Top) Experiment A: in addition to surface and air temperatures, pavement temperatures were measured at various depths in summer 2023. (Bottom) Experiment B: surface and air temperatures in the shadowed area were compared to those outside of the box on the same pavement system. Surface temperatures for JW in Experiment B included measurements on the concrete part and in the plastic aqueduct opening.
Environments 12 00192 g002
Figure 3. Daily variations in average surface and air temperatures of JW, IC, and PC, as well as the average solar radiation intensity during summer and winter seasons. Data used to calculate for both summer seasons were between 1 June and 31 August; for winter 2022 was between 1 December 2022 and 28 February 2023, and for winter 2023 was between 1 December 2023 and 29 February 2024.
Environments 12 00192 g003
Figure 4. Box plots show the distribution of hourly temperature profiles collected in periods P-22a and P-22b in summer 2022 (left) and periods P-23a and P-23b in summer 2023 (right). The x symbol and the line in the box indicate the average, and the median of the data, respectively.
Environments 12 00192 g004
Figure 5. Surface temperatures measured in shaded area (S) inside the boxes and outside the boxes according to Experiment B during selected periods.
Environments 12 00192 g005
Figure 6. (left) A demo unit of JW frame with aqueducts; (middle) a section of JW frames installed at the P3 site; (right) the surface of a section of the completed JW pavement system.
Environments 12 00192 g006
Figure 7. Comparison of average hourly temperature profiles at different positions associated with JW, IC, and PC in (left) summer 2022 and (right) summer 2023. The pavement type is indicated in the bottom right corner of each graph. S: Surface temperatures measured in shaded areas.
Environments 12 00192 g007
Table 1. Average annual summer and winter temperature profiles for each type of pavement system. Maximum (Max) and minimum (Min) temperatures during the year are also shown.
Temperature (°C)20222023
AnnualMaxMinSummerWinterAnnualMaxMinSummerWinter
ICSurface14.850.4−22.429.71.415.147.3−14.729.42.7
Air11.842.1−22.923.81.112.838.2−15.323.51.9
PCSurface14.654.3−20.829.81.615.851.7−12.929.22.1
Air11.739.6−22.924.31.013.137.4−14.323.61.7
JWSurface14.850.6−18.829.61.815.748.7−11.830.02.3
Air11.840.1−23.123.91.413.637.9−14.523.41.5
Near-site weather station (Air)10.837.7−23.423.30.712.334.9−15.322.71.2
Table 2. ANOVA tests for surface and air temperatures (°C) across the three pavement systems (α = 0.05). The groups of pavement systems where significant differences exist are categorized in the corresponding p-value columns.
2022 Summer2023 Summer
PavementTimeSurfaceAirSurfaceAir
Meanp-ValueMeanp-ValueMeanp-ValueMeanp-Value
IC
PC
JW
24 h29.6
29.8
29.6
0.99523.8
24.3
23.9
0.92429.4
29.2
30.0
0.90623.5
23.6
23.4
0.986
IC
PC
JW
21:00–5:00 24.3
23.1
24.4
0.37819.8
19.9
19.9
0.97324.5
23.2
25.5
0.13519.6
19.7
19.5
0.972
IC
PC
JW
12:00–16:00 38.9
41.1
38.5
0.015
PC, IC
PC, JW
29.2
30.1
29.0
0.006
PC, IC
PC, JW
37.9
39.5
38.0
0.05028.8
29.0
28.8
0.573
P-22aP-22b
PavementTimeSurfaceAirSurfaceAir
Meanp-ValueMeanp-ValueMeanp-ValueMeanp-Value
IC
PC
JW
24 h32.8
33.1
32.8
0.90027.2
27.9
27.3
0.34432.8
33.1
32.8
0.90026.3
26.9
26.3
0.580
IC
PC
JW
21:00–5:00 26.4
25.0
26.5
0.006
PC, IC
PC, JW
22.4
22.6
22.5
0.95626.4
25.0
26.5
0.006
PC, IC
PC, JW
21.3
21.5
21.4
0.979
IC
PC
JW
12:00–16:0043.8
46.5
43.2
0.0005
PC, IC
PC, JW
33.3
35.1
33.3
0.009
PC, IC
PC, JW
43.8
46.5
43.2
0.004
PC, IC
PC, JW
31.6
32.9
31.5
0.075
P-23aP-23b
PavementTimeSurfaceAirSurfaceAir
Meanp-ValueMeanp-ValueMeanp-ValueMeanp-Value
IC
PC
JW
24 h33.0
33.0
33.9
0.49125.8
25.9
25.6
0.90033.0
33.7
34.1
0.43827.8
28.0
27.8
0.889
IC
PC
JW
21:00–5:0027.6
26.6
29.0
0.005
PC, JW
21.3
21.5
21.5
0.96628.3
27.9
29.7
0.004
IC, JW
PC, JW
24.2
24.3
24.2
0.979
IC
PC
JW
12:00–16:00 42.8
45.1
43.6
0.017
PC, IC
31.0
32.1
31.5
0.71341.7
44.3
42.3
0.003
PC, IC
PC, JW
33.1
33.8
33.3
0.362
Table 3. Correlation coefficient between surface and air temperatures and between temperatures and selected meteorological parameters in selected periods.
PeriodP-22a and P-22bP-23a and P-23b
ICPCJWICPCJW
SurfaceAirSurfaceAirSurfaceAirSurfaceAirSurfaceAirSurfaceAir
Air *0.9111.0000.9361.0000.9271.0000.9251.0000.9361.0000.9211.000
SR0.8210.6790.8500.7320.8150.6820.7860.7110.7700.7110.7300.681
RH−0.778−0.647−0.761−0.676−0.757−0.651−0.722−0.585−0.706−0.577−0.698−0.562
Air **0.8900.9910.8860.9800.9050.9900.9130.9810.9210.9850.9130.989
WS0.6210.7390.6100.7360.6210.7360.5150.5200.5030.5230.4990.515
* Corresponding to the same pavement system listed in the columns. ** Ambient air. SR: solar radiation; RH: relative humidity; WS: Wind speed.
Table 4. Surface temperatures with and without shade effect during selected periods. Avg: average; MD: maximum surface temperature difference with and without shade; MT: maximum surface temperature measured; MaxT: maximum temperatures.
P-22aP-22b
PavementJWICPCJWICPC
Time (h)No ShadeShadeNo ShadeShadeNo ShadeShadeNo ShadeShadeNo ShadeShadeNo ShadeShade
24 Avg32.829.432.829.033.128.133.229.633.229.133.628.1
12–16 Avg43.233.143.833.846.532.242.932.143.732.446.230.4
12–16 MD47.732.947.932.952.132.144.929.548.834.352.731.7
12–16 MT48.435.749.338.252.936.449.436.350.136.253.933.9
21–5 Avg26.527.126.425.825.025.227.428.427.227.025.926.7
MaxT48.438.149.338.352.937.149.437.350.136.653.936.1
Disclaimer/Publisher’s Note: The statements, opinions and data contained in all publications are solely those of the individual author(s) and contributor(s) and not of MDPI and/or the editor(s). MDPI and/or the editor(s) disclaim responsibility for any injury to people or property resulting from any ideas, methods, instructions or products referred to in the content.

