1. Introduction
Strawberry (
Fragaria ananassa) is one of the most economically significant fruit crops globally, with production exceeding 9 million metric tons in 2022 [
1]. Major producers include China, the United States, Mexico, and Turkey, with the U.S. contributing over 1.3 million tons annually, generating approximately USD 3.42 billion in economic value [
2,
3]. California dominates national production in the U.S., but Florida ranks second, cultivating strawberries on 10,000 to 12,000 acres annually, with a market value exceeding USD 500 million [
4]. The fruit’s high market demand stems from its nutritional benefits, including high antioxidant content, making it a consumer favorite worldwide [
5]. While most production is concentrated in Central Florida, South Florida, including Miami-Dade County, is emerging as a valuable region due to its subtropical climate and unique winter growing window [
6]. However, production here remains small-scale and understudied despite increasing interest in local markets and organic production systems.
Despite its economic value, strawberry cultivation is highly input-intensive and vulnerable to various pests and diseases. In Florida, strawberries are predominantly grown using raised-bed plasticulture with drip irrigation, requiring frequent pesticide applications to combat pests such as the two-spotted spider mite (
Tetranychus urticae), fall armyworm (
Spodoptera frugiperda), southern armyworm (
Spodoptera eridania), aphids, and thrips [
7,
8]. The phase-out of methyl bromide soil fumigant has increased reliance on chemical pesticides, leading to resistance development and environmental concerns [
9]. Over 63 pesticide products are registered for strawberry cultivation [
10], and nearly 70% of market strawberries have been found to carry over 20 different pesticide residues [
11], placing them consistently at the top of the “Dirty Dozen” list for several years [
12]. These challenges have driven interest in organic management strategies, including using organic soil amendments that enhance fertility and improve pest and disease resilience. In South Florida, the challenge is compounded by unique agronomic conditions such as calcareous, shallow soils with low organic matter, high rainfall variability, and elevated temperatures, which affect nutrient availability and pest dynamics. These site-specific challenges show the need for regionally tailored nutrient and pest management approaches that support long-term sustainability.
Vermicompost (VC), often referred to as “black gold,” is a nutrient-rich organic amendment produced through the microbial decomposition of organic waste by earthworms [
13]. Its aqueous derivative, vermicompost tea (VCT), is prepared by steeping VC in water under aerated or non-aerated conditions to extract soluble nutrients and beneficial microbes [
14]. VC is rich in essential nutrients, beneficial microbes, phytohormones, and phenolic acids that can enhance plant growth and suppress soilborne pests and pathogens [
14,
15]. Recent studies have also highlighted the role of vermicompost in disease suppression and plant health promotion in various crops [
16]. VCT, commonly applied as a foliar spray, provides similar benefits in a liquid form. The VC functions as a slow-release nutrient source, while VCT provides readily available plant nutrients, improving soil structure and biological activity while minimizing leaching [
13,
17]. While several studies have documented the short-term benefits of VC and VCT on strawberries [
18,
19], little is known about their effectiveness when applied during a preceding crop cycle, such as corn, a heavy nutrient feeder. This raises important questions about whether residual nutrients from organic amendments such as VC and VCT, which are applied to a preceding crop like corn, can support strawberry yield, fruit quality, and nutrient availability in a subsequent rotation in regions like South Florida, where input efficiency and pest suppression are critical.
Incorporating strawberries after corn can improve soil health and promote pest management in crop rotation. Corn is typically rotated with crops like soybeans, peas, wheat, and beans [
20,
21], replenishing nitrogen levels in the soil, while strawberries are usually rotated with peas, beans, and leafy greens [
22,
23]. Introducing strawberries into corn rotation can help break pest and disease cycles, as strawberries are not closely related to corn and share one or two common pests or diseases. However, the residual nutrient effects of VC and VCT on strawberry yield and physiology following corn cultivation have not been quantified in subtropical cropping systems.
This study addresses these gaps by evaluating the residual impacts of VC and VCT applied during a corn-growing season on the subsequent growth and nutrient performance of strawberries grown without additional fertilization within a real field rotation context. Specifically, this study aimed to (1) assess the effects of residual VC and VCT treatments on strawberry morphological traits and physiological responses; (2) quantify macro- and micronutrient concentrations in soil and plant tissues to determine the extent of nutrient carryover from the previous crop season; and (3) evaluate treatment-induced differences in fruit quality, particularly Brix sugar content, as a proxy for marketable quality under organic management.
While strawberry–corn rotation is not widely practiced, the experimental design allowed for assessing the residual impacts of organic inputs across growing seasons. These findings offer broader implications for agricultural systems incorporating organic nutrient sources, managing salinity risks, and reducing dependence on synthetic fertilizers in high-value horticultural crops.
2. Methodology
2.1. Experimental Setup
This study was conducted at the organic garden (1.5 acres) of the Agroecology Program, Department of Earth and Environment, Florida International University, Miami, FL, USA (25.7539281, −80.3800388). The site is characterized by calcareous sandy loam soils with a history of organic management under the USDA People’s Garden Initiative [
24]. This research served as a follow-up to a previous corn experiment [
25], exactly one month after the experiment concluded, using the same six raised beds (457 × 30 × 91 cm, L × W × H). The aim was to evaluate the residual effects of prior VC treatments on strawberry growth without any additional fertilizer inputs. Treatments applied during the preceding corn experiment were as follows: V0 (control—The Old Farmer’s Almanac organic fertilizer with NPK percentage of 8-4-8, applied twice at a rate of 0.3 ton/acre); VC1 (vermicompost at 1 ton/acre); VCT100 (vermicompost tea, 100 mL per plant); VC1+VCT50 (vermicompost 1 ton/acre and vermicompost tea, 50 mL per plant); VC3 (vermicompost 3 ton/acre), and VC3+VCT50 (vermicompost 3 ton/acre and vermicompost tea, 50 mL per plant). The VC and VCT were sourced from Lions Fruit Farm, Redlands, Miami, FL, using rabbit manure, fruit waste (e.g., avocado), and cocoplum as feedstock. VC and VCT preparation details are described in [
25]. Soil nutrient content following the corn harvest and before strawberry planting is summarized in
Table 1, derived from the same study (Table 2 in [
25]), to contextualize nutrient availability at the start of the strawberry trial. The nutrient composition of the VC used in the preceding corn study, whose residues were evaluated here, is detailed in [
25], including total N, P, K, and Na levels.
Beds were covered with cloth mulch, and each was planted with 12 Chandler bare-root strawberry plants (sourced from Willis Orchards, Cartersville, GA, USA) in November 2022. To ensure consistent replication across treatments, the strawberry plants in each raised bed were grouped into three replicates by dividing the 12 plants into three sets of four. These plant-based replicates were used for biomass and nutrient analysis within each treatment. The experiment lasted six months, ending in April 2023. Throughout the strawberry growing season, beds were irrigated manually using a hand-held sprinkler every evening to ensure uniform moisture coverage across each raised bed. Watering was skipped on days when rainfall occurred. The weather data of the study area during the strawberry growing season (November 2022 to April 2023) were obtained from the National Oceanic and Atmospheric Administration (NOAA,
https://www.weather.gov/wrh/Climate?wfo=mfl accessed on 15 May 2025). Monthly average temperatures ranged from 22.3 °C in January to 26.3 °C in April. The precipitation was low with values of 7.1 mm (November 2022), 1.5 mm (December 2022), 0 mm (January 2023), 5.1 mm (February 2023), 3.8 mm (March 2023), and 8.4 mm (April 2023).
2.2. Strawberries Physiology
Physiological measurements were taken weekly between weeks 10 and 24 after transplanting, corresponding to Chandler strawberry’s vegetative stage, flowering, and early fruit development stages in subtropical climates. These time points were selected to capture changes in chlorophyll content, water use efficiency, and canopy development during peak physiological activity. The relative chlorophyll content was determined using a Soil-Plant Analysis Development chlorophyll meter (SPAD 502 plus, Spectrum Technologies Inc., Aurora, IL, USA) from weeks 10 to 24 after planting. The stomatal conductivity of the strawberries was measured using a porometer and fluorometer (Li-600, LI-COR Environmental, Lincoln, NE, USA) from week 10 to week 24. The SPAD readings and stomatal conductance were taken from five mature leaves (at the mid-height of the plant) per plant between 8:30 am and 10:30 am to reduce diurnal variations. Leaf-level (five leaves per plant, four plants per replicate) and canopy-level (three plants per replicate) spectral reflectance of the strawberries was taken in week 17 at 11:00 am using a hand-held spectral radiometer (Spectral Evolution Inc., Haverhill, MA, USA) across the 350–2500 nm.
2.3. Strawberry Harvesting and Yield Determination
The strawberry fruits were harvested continuously throughout the experimental period from November 2022 to April 2023, coinciding with the typical fruiting window for Chandler strawberries in subtropical climates. Harvesting was performed manually on multiple dates as fruits reached full ripeness (entirely red). Only marketable-quality fruits free from deformities, pest damage, or disease symptoms were collected and included in the yield analysis. Treatments VC3 and VC3+VCT50 were excluded from the yield data due to insufficient production of marketable fruits.
The fresh weight of harvested strawberries was recorded immediately after harvest using a digital balance (precision ± 0.01 g). This approach reflects commercial practices, where strawberries are sold fresh. Brix sugar content was also measured immediately upon harvest using a hand-held Brix digital pocket refractometer (Atago Co., Ltd., Bellevue, WA, USA) to ensure accuracy, and the sugar content was compared with organic strawberries purchased from the grocery store (Publix, Miami, FL, USA). The total yield per treatment was calculated by summing the cumulative fresh fruit weight collected across all harvests. The yield was then expressed per acre (kg/acre) by scaling the total fruit mass to the area of the raised beds used in each treatment using the following equation:
2.4. Plant and Soil Sampling and Chemical Analysis
At the termination of the experiment (end of April 2023), despite ongoing fruiting, plants were uprooted, and biomass (shoots and roots) was harvested for final biomass determination. Strawberry plants were at the late reproductive stage, characterized by ongoing fruit production and senescence of early leaves. Fresh biomass per bed was weighed immediately after uprooting the plants. From this, representative subsamples were collected for laboratory analysis. These subsamples were carefully washed with clean water to remove soil and debris, particularly from the roots. The cleaned subsamples were oven-dried at 70 °C until constant weight to determine dry biomass. Once dried, the roots were manually separated from the shoot tissue. Both roots and leaves were then ground separately into a fine powder using a Mixer/Mill (SPEX Sample Prep, Metuchen, NJ, USA). The resulting ground root and leaf samples were analyzed for nutrient content following the procedure previously described in [
25]. Briefly, the total carbon and total nitrogen content in the leaves and root samples were determined using dry combustion with a C/N elemental analyzer (LECO TruSpec, LECO Corporation, St. Joseph, MI, USA).
The elemental concentrations of Ca, K, Mg, P, S, B, Fe, Mn, Zn, and Cu were determined using Inductively Coupled Plasma Mass Spectroscopy (ICP-MS; Agilent 7900, Santa Clara, CA, USA). The powdered plant samples were digested using a standard acid digestion procedure, using concentrated nitric acid, to solubilize macro- and micronutrients. Quantification was performed using multi-element calibration standards, and quality control was maintained using reagent blanks and certified reference materials. Elemental concentrations were expressed in mg/kg or ppm (parts per million) dry weight.
Furthermore, the soil samples from all 12 plants were collected from two depths, that is, 0–10 cm (surface soils) and 10–20 cm (subsurface soils), and pooled to make three soil samples per bed per depth. The soil samples and background soil collected just before planting strawberries were air-dried and sieved through a 2 mm mesh and analyzed for nutrient and elemental concentrations [
25]. The soil pH was determined in CaCl
2 solution, CEC was determined using unbuffered 1 M NH
4Cl, and organic matter was determined by the loss-on-ignition method. Total nitrogen in the soil was measured using the same C/N elemental analyzer. At the same time, P, K, Ca, Mg, Zn, and Na concentrations were determined using the same ICP-MS procedure for plant samples.
2.5. Statistical Analysis
All data collected in the study were analyzed using Minitab (version 21, Minitab LLC, State College, PA, USA) at a 5% significance level. A one-way analysis of variance (ANOVA) was conducted to evaluate the effect of different treatments on soil and plant parameters. For each parameter, ANOVA was first used to test whether there were significant differences among treatment means (p < 0.05). A post hoc test (Tukey’s Honestly Significant Difference (HSD)) was performed to separate treatment means only when ANOVA indicated a significant difference. All assumptions for ANOVA, including normality and homogeneity of variances, were checked before conducting the analyses.
4. Discussion
This study explored the residual effects of VC and VCT treatments on strawberry growth and physiology in a rotation system following corn cultivation. The findings show the significance of VC applications for immediate crop enhancement and their prolonged impact on subsequent crop rotations.
4.1. Soil Chemical Analysis
Soil nutrient content data (
Table 1) from the preceding corn experiment [
25] confirmed that VC and VCT treatments significantly influenced post-harvest soil fertility across surface and subsurface layers. These residual nutrients provided a fertility baseline for the subsequent strawberry trial. However, while subsurface %OM and %C increased under these treatments (
Table 1), CEC remained statistically unchanged. This is due to the short-term nature of the amendment, limited biological activity at this depth, and the insensitivity of the unbuffered 1 M NH
4Cl method to modest organic matter contributions in lower horizons [
26].
After strawberry cultivation, post-harvest soil nutrient content analysis showed significant differences among the various treatment groups for all the elemental concentrations, especially in the surface soils, except for pH, K, and Zn. High vermicompost application rates, specifically VC3 and VC3+VCT50, were associated with elevated N, P, Mg, Na, OM, and CEC (
Table 2). This demonstrates vermicompost’s potential to significantly enhance soil fertility by increasing the availability of macro- and micronutrients and improving soil structure, aligning with previous research findings [
27]. It also shows the slow-release nature of vermicompost, which provides a steady nutrient supply essential for chlorophyll synthesis and plant growth [
28]. Additionally, the increased P availability in all treatments illustrates VC’s ability to solubilize P, enhancing energy transfer and root development [
13].
The elevated Na concentrations in the soils of all treatments could be attributed to using vermicompost with high Na content [
25], which affected the VC and VCT applications. The high soil Na concentration might have contributed to high plant stress and poor growth in the VC3+VCT50-treated plants since strawberries are highly salinity-sensitive [
29]. Stress in the VC3+VCT50-treated plants was also evident with low SPAD readings (
Figure 2), low conductance (
Figure 3), and lower chlorophyll reflectance peak (
Figure 3 and
Figure 4). These stress indicators corresponded to the reduced strawberry yield and slightly lower Brix sugar content observed in the VC3+VCT50 treatment.
In subsurface soils (10–20 cm), while nutrient content was generally lower than in surface soils, significant improvements were still observed in treatments with higher VC applications. The VC3 treatment, for instance, showed the highest N content (0.60%) in subsurface soils (
Table 2), illustrating VC’s potential to promote nutrient availability beyond the immediate root zone and support deeper nutrient uptake [
13,
14,
15]. Furthermore, higher Ca and Mg levels, as well as increased CEC, were observed in the VC3 and VC3+VCT50 treatments, improving soil structure and plant health [
30]. The higher OM content in these treatments indicates enhanced soil aggregation and microbial activity, promoting long-term soil fertility.
The study findings demonstrate that nutrient levels are generally higher in surface soils than in subsurface soils across all treatments. The limited vertical movement of nutrients from the surface to the subsurface soil depths emphasizes the effectiveness of surface application techniques, which maximize nutrient availability in the critical root zone. This pattern can be attributed to the direct application of vermicompost to the soil surface, where it undergoes decomposition and nutrient release. The higher nutrient content in surface soils is crucial for crop establishment and early growth, providing readily available nutrients for young plants. The findings from
Table 2 affirm that the observed strawberry responses were due to inherent soil properties and a direct consequence of nutrient carryover from the previous corn cropping season.
4.2. Plant Chemical Analysis
The distinct partitioning of nutrients between leaves and roots shows the different roles these plant parts play in nutrient dynamics. Leaves had higher concentrations of macronutrients, which are essential for photosynthesis and growth, while roots exhibited higher levels of micronutrients, reflecting their role in absorbing nutrients from the soil.
The leaf N concentrations were highest in the VC3+VCT50 treatment, indicating that a combination of vermicompost and VCT can potentially enhance N uptake (
Table 3). In contrast, roots showed the highest N content in the VC1 treatment, suggesting that moderate vermicompost applications might be more effective for N uptake in roots. This differentiation in nutrient uptake patterns between leaves and roots could be attributed to how residual vermicompost influences soil nutrient availability, potentially enhancing microbial activity and N mineralization [
31]. The P content in leaves was relatively higher in the control (V0) and VC3+VCT50 treatments, indicating that residual vermicompost might improve P availability even when applied in previous crop cycles. The inverse relationship between K content and the VC application rate in leaves suggests that higher vermicompost rates might inhibit K uptake or redistribution. This could be due to competitive absorption dynamics with other nutrients, such as Ca and Mg.
Iron and Mn showed enhanced availability in treatments with higher vermicompost rates, particularly VC3 and VC3+VCT50. This indicates that residual vermicompost may improve the solubility and uptake of certain micronutrients by producing chelating agents and improving soil structure. Interestingly, the VC1+VCT50 treatment exhibited the highest Fe content (
Table 3) in roots, emphasizing the role of specific treatment combinations in optimizing micronutrient uptake. The differential effects observed across treatments highlight the importance of optimizing vermicompost application rates to achieve balanced nutrient availability. These findings align with previous research, such as Refs. [
18,
32], which reported positive impacts of vermicompost on plant growth and soil health.
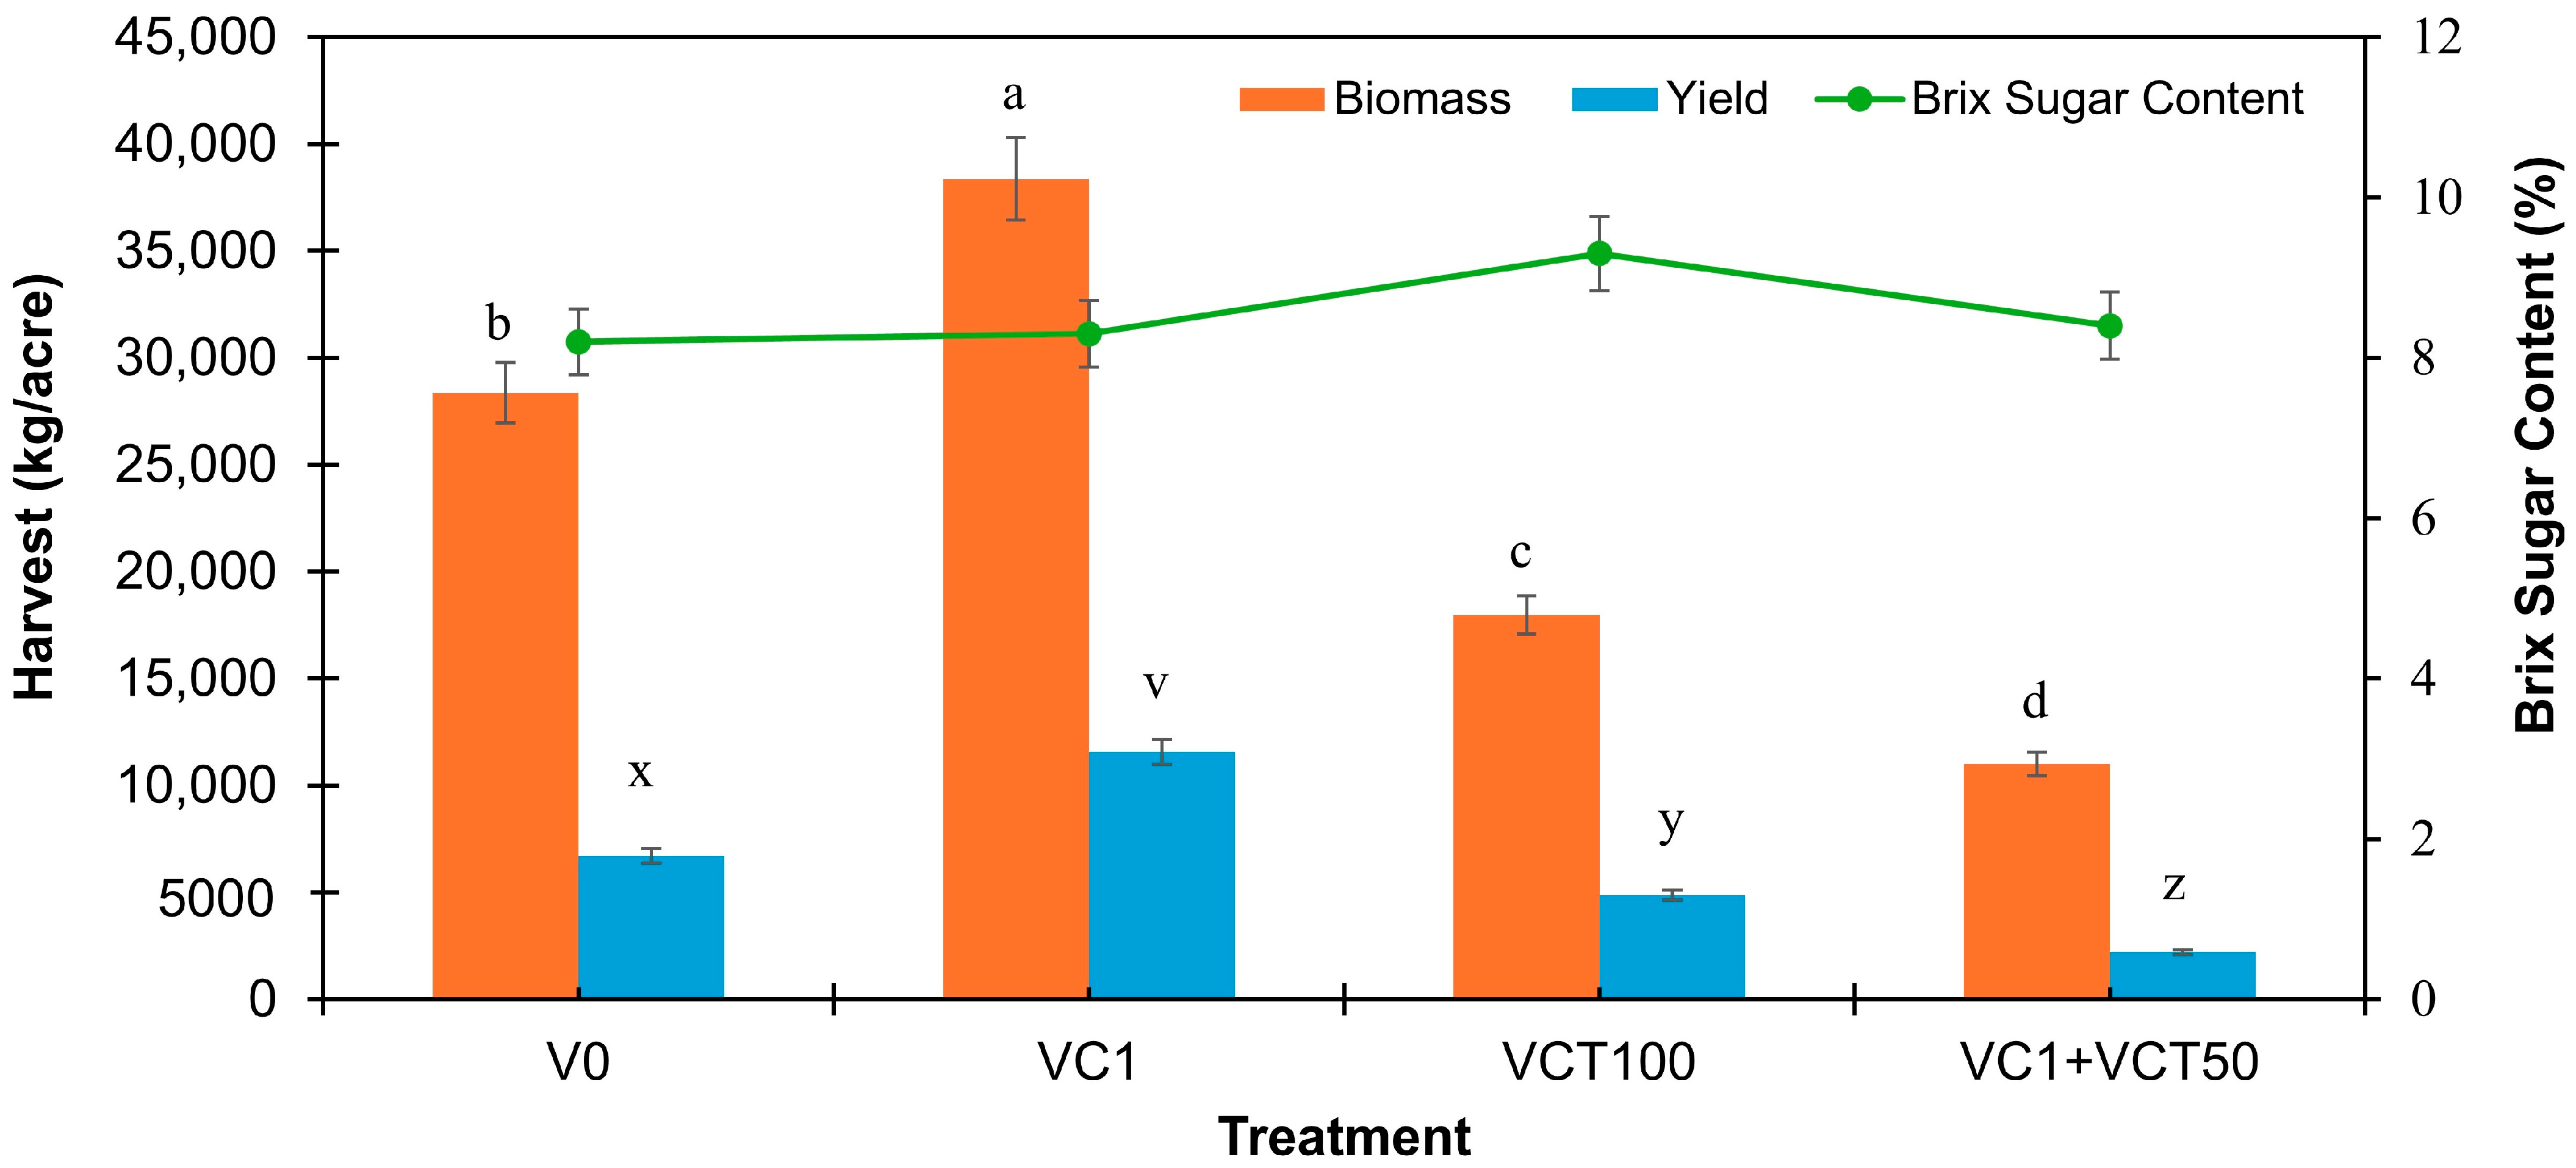
4.3. Strawberry Biomass, Brix Sugar Content, and Yield
4.3.1. Biomass Production
The VC1 treatment resulted in the highest dry biomass at 38,364 kg/acre, followed by the control (V0) with 28,364 kg/acre. This suggests that moderate vermicompost applications can significantly enhance biomass production due to improved nutrient availability and soil structure, a consequence of the slow-release nature of vermicompost. This finding is consistent with studies indicating that moderate organic amendment rates optimize biomass production by improving soil health without overwhelming the plant’s nutrient uptake systems [
30].
The statistical analysis and
Figure 1 showed that the superior performance of VC1 likely stems from its optimal nutrient profile, which promoted plant vigor without inducing salt stress. In contrast, treatments such as VC3 and VC3+VCT50 were excluded from biomass measurement due to poor plant establishment and health, consistent with their high sodium content (
Table 1), which can lead to osmotic stress and growth inhibition.
In contrast, excessive VC applications likely introduced increased salinity, as shown by the elevated Na concentrations in the post-corn soils under VC3 and VC3+VCT50 treatments (
Table 1). This salinity stress may have persisted into the strawberry season (
Table 2), contributing to inhibited plant growth and reduced biomass accumulation. This finding aligns with previous studies indicating that strawberries are susceptible to soil salinity. High salinity levels can lead to leaf edge burn, necrosis, nutrient imbalances, specific ion toxicity, reduced fruit quality and yield, and even potential plant death if salinity stress persists or worsens [
33].
4.3.2. Brix Sugar Content
This measures sugar concentration in fruit and is an essential quality indicator, showing variability across treatments but less pronounced differences than biomass and yield. The VCT100 treatment exhibited the highest Brix sugar content (9.3%), although it was not significantly different from other treatments, suggesting that VC and VCT applications enhance fruit quality. Notably, the lack of statistical significance across treatments (except between VCT100 and store-bought strawberries) indicates that while nutrient amendments may enhance sweetness, other factors such as genetics, maturity, and water availability may also play critical roles.
Interestingly, when comparing the Brix sugar content of strawberries from these treatments to organic strawberries available on the market, the market-bought strawberries had a lower Brix sugar content of 6.8%. This finding aligns with other studies that show organic amendments can enhance fruit quality by improving sugar accumulation compared to conventional practices [
34].
4.3.3. Strawberry Yield
The impact of VC and VCT on strawberry yield was notable. The VC1 treatment produced the highest yield, comparable to the average of 11,300 kg/acre reported for South Florida [
35]. This suggests that moderate vermicompost applications can optimize strawberry production by providing balanced nutrient availability and improving soil structure. In contrast, yields declined sharply in treatments with higher VC and VCT rates (e.g., VC3 and VC3+VCT50), likely due to increased soil Na levels causing salinity stress [
18]. The low yield observed in VC1+VCT50 also suggests that even moderate rates, when combined, may affect nutrient dynamics or exacerbate salinity-related effects if not well-calibrated.
4.4. Relative Chlorophyll Content in Plants
The analysis of chlorophyll content, as indicated by SPAD values, shows varying trends across different treatments over several weeks after planting. The chlorophyll content is a critical indicator of plant health and N status, and its variation provides insights into how different treatments influence plant physiology and growth.
The decrease in chlorophyll content (
Figure 2) from weeks 10 to 17 after planting is likely due to the plants reallocating energy resources from chlorophyll production to fruit development as the strawberry plants matured. As the plant shifts its focus to developing flowers, fruits, and seeds, less energy is available to maintain chlorophyll levels in the leaves. This is consistent with the understanding that plants often redirect energy to support reproductive structures as they mature, which can result in reduced leaf chlorophyll levels [
36,
37]. All treatments showed relatively high SPAD values in weeks 10 to 17, indicating that the residual effects of vermicompost and the inherent soil nutrients provided adequate N and other nutrients to support early growth and chlorophyll synthesis.
The reduced chlorophyll content in VC3+VCT50-treated plants can be attributed to the higher sodium levels observed in these treatments (
Table 2), which are known to disrupt chlorophyll biosynthesis and accelerate leaf senescence [
33]. Vermicompost and VCT applications influence chlorophyll indirectly by altering soil nutrient availability and salinity balance. Moderate VC rates (e.g., VC1) likely provided sufficient nitrogen and micronutrients to support healthy chlorophyll formation, while excessive applications led to ion toxicity and reduced photosynthetic pigment retention.
4.5. Stomatal Conductance in Plants
Stomatal conductance is a physiological parameter that reflects the openness of plant stomata, affecting both transpiration and photosynthesis. It is an essential indicator of plant response to environmental conditions and nutrient availability. In this study, stomatal conductance showed an overall increase from week 10 to week 17, suggesting an adaptation of the plants to their environment and treatments.
At the initial stage (week 10), all treatments exhibited relatively similar stomatal conductance, ranging from 0.10 to 0.15 (
Figure 3), except for high VC rates (VC3 and VC3+VCT50), which showed the lowest initial conductance. This initial low conductance could be due to the higher organic matter content in these treatments, potentially leading to increased soil moisture retention and reduced stomatal opening, as plants may not need to open their stomata as broadly or as often because there is less need for water uptake from the soil [
38,
39,
40]. The steady conductance observed in VC3 up to week 17 indicates that plants in this treatment maintained a relatively constant water and nutrient uptake strategy. Furthermore, VC3+VCT50 consistently has lower stomatal conductance in weeks 10 to 17, consistent with lower SPAD values. The persistently low stomatal conductance in VC3+VCT50 plants could also be attributed to residual salinity stress from the elevated sodium levels observed in these soils following the corn experiment (
Table 2), which may have limited water uptake and physiological activity.
Treatment-related changes similarly influenced stomatal conductance in soil chemistry. In treatments with moderate nutrient levels (e.g., VC1), plants maintained optimal stomatal function, likely due to balanced water and nutrient uptake. In contrast, VC3+VCT50 showed persistently low conductance, which can be explained by salinity-induced osmotic stress, limiting water availability at the root–soil interface, and prompting partial stomatal closure to conserve moisture [
39]. This physiological response is consistent with lower chlorophyll content, reduced SPAD values, and spectral reflectance patterns observed in the same treatment.
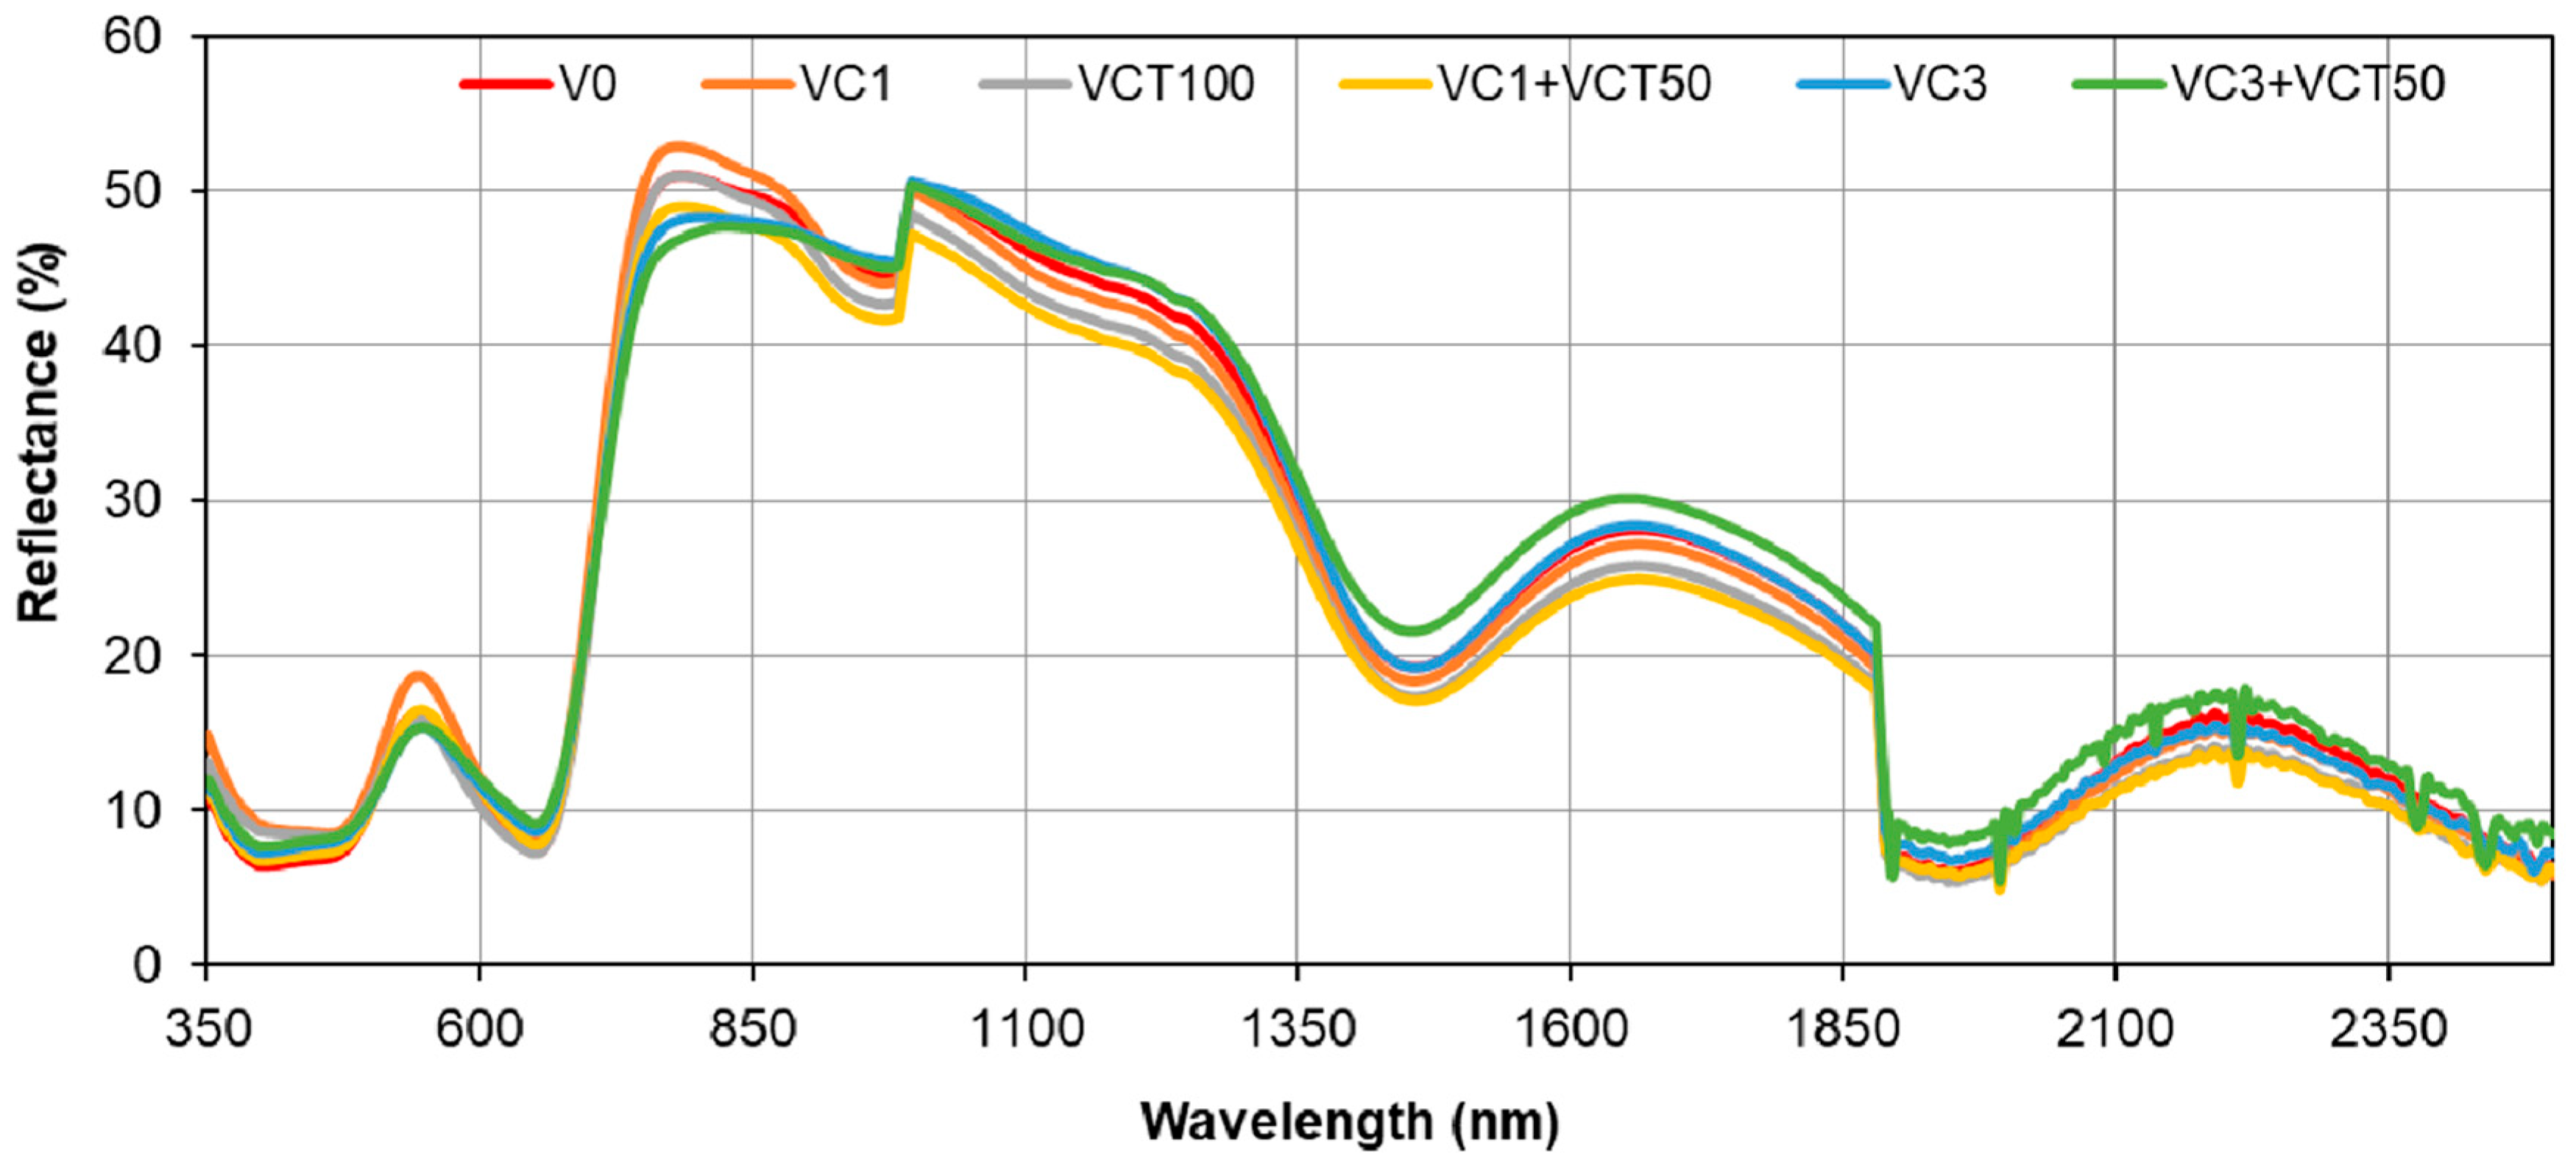
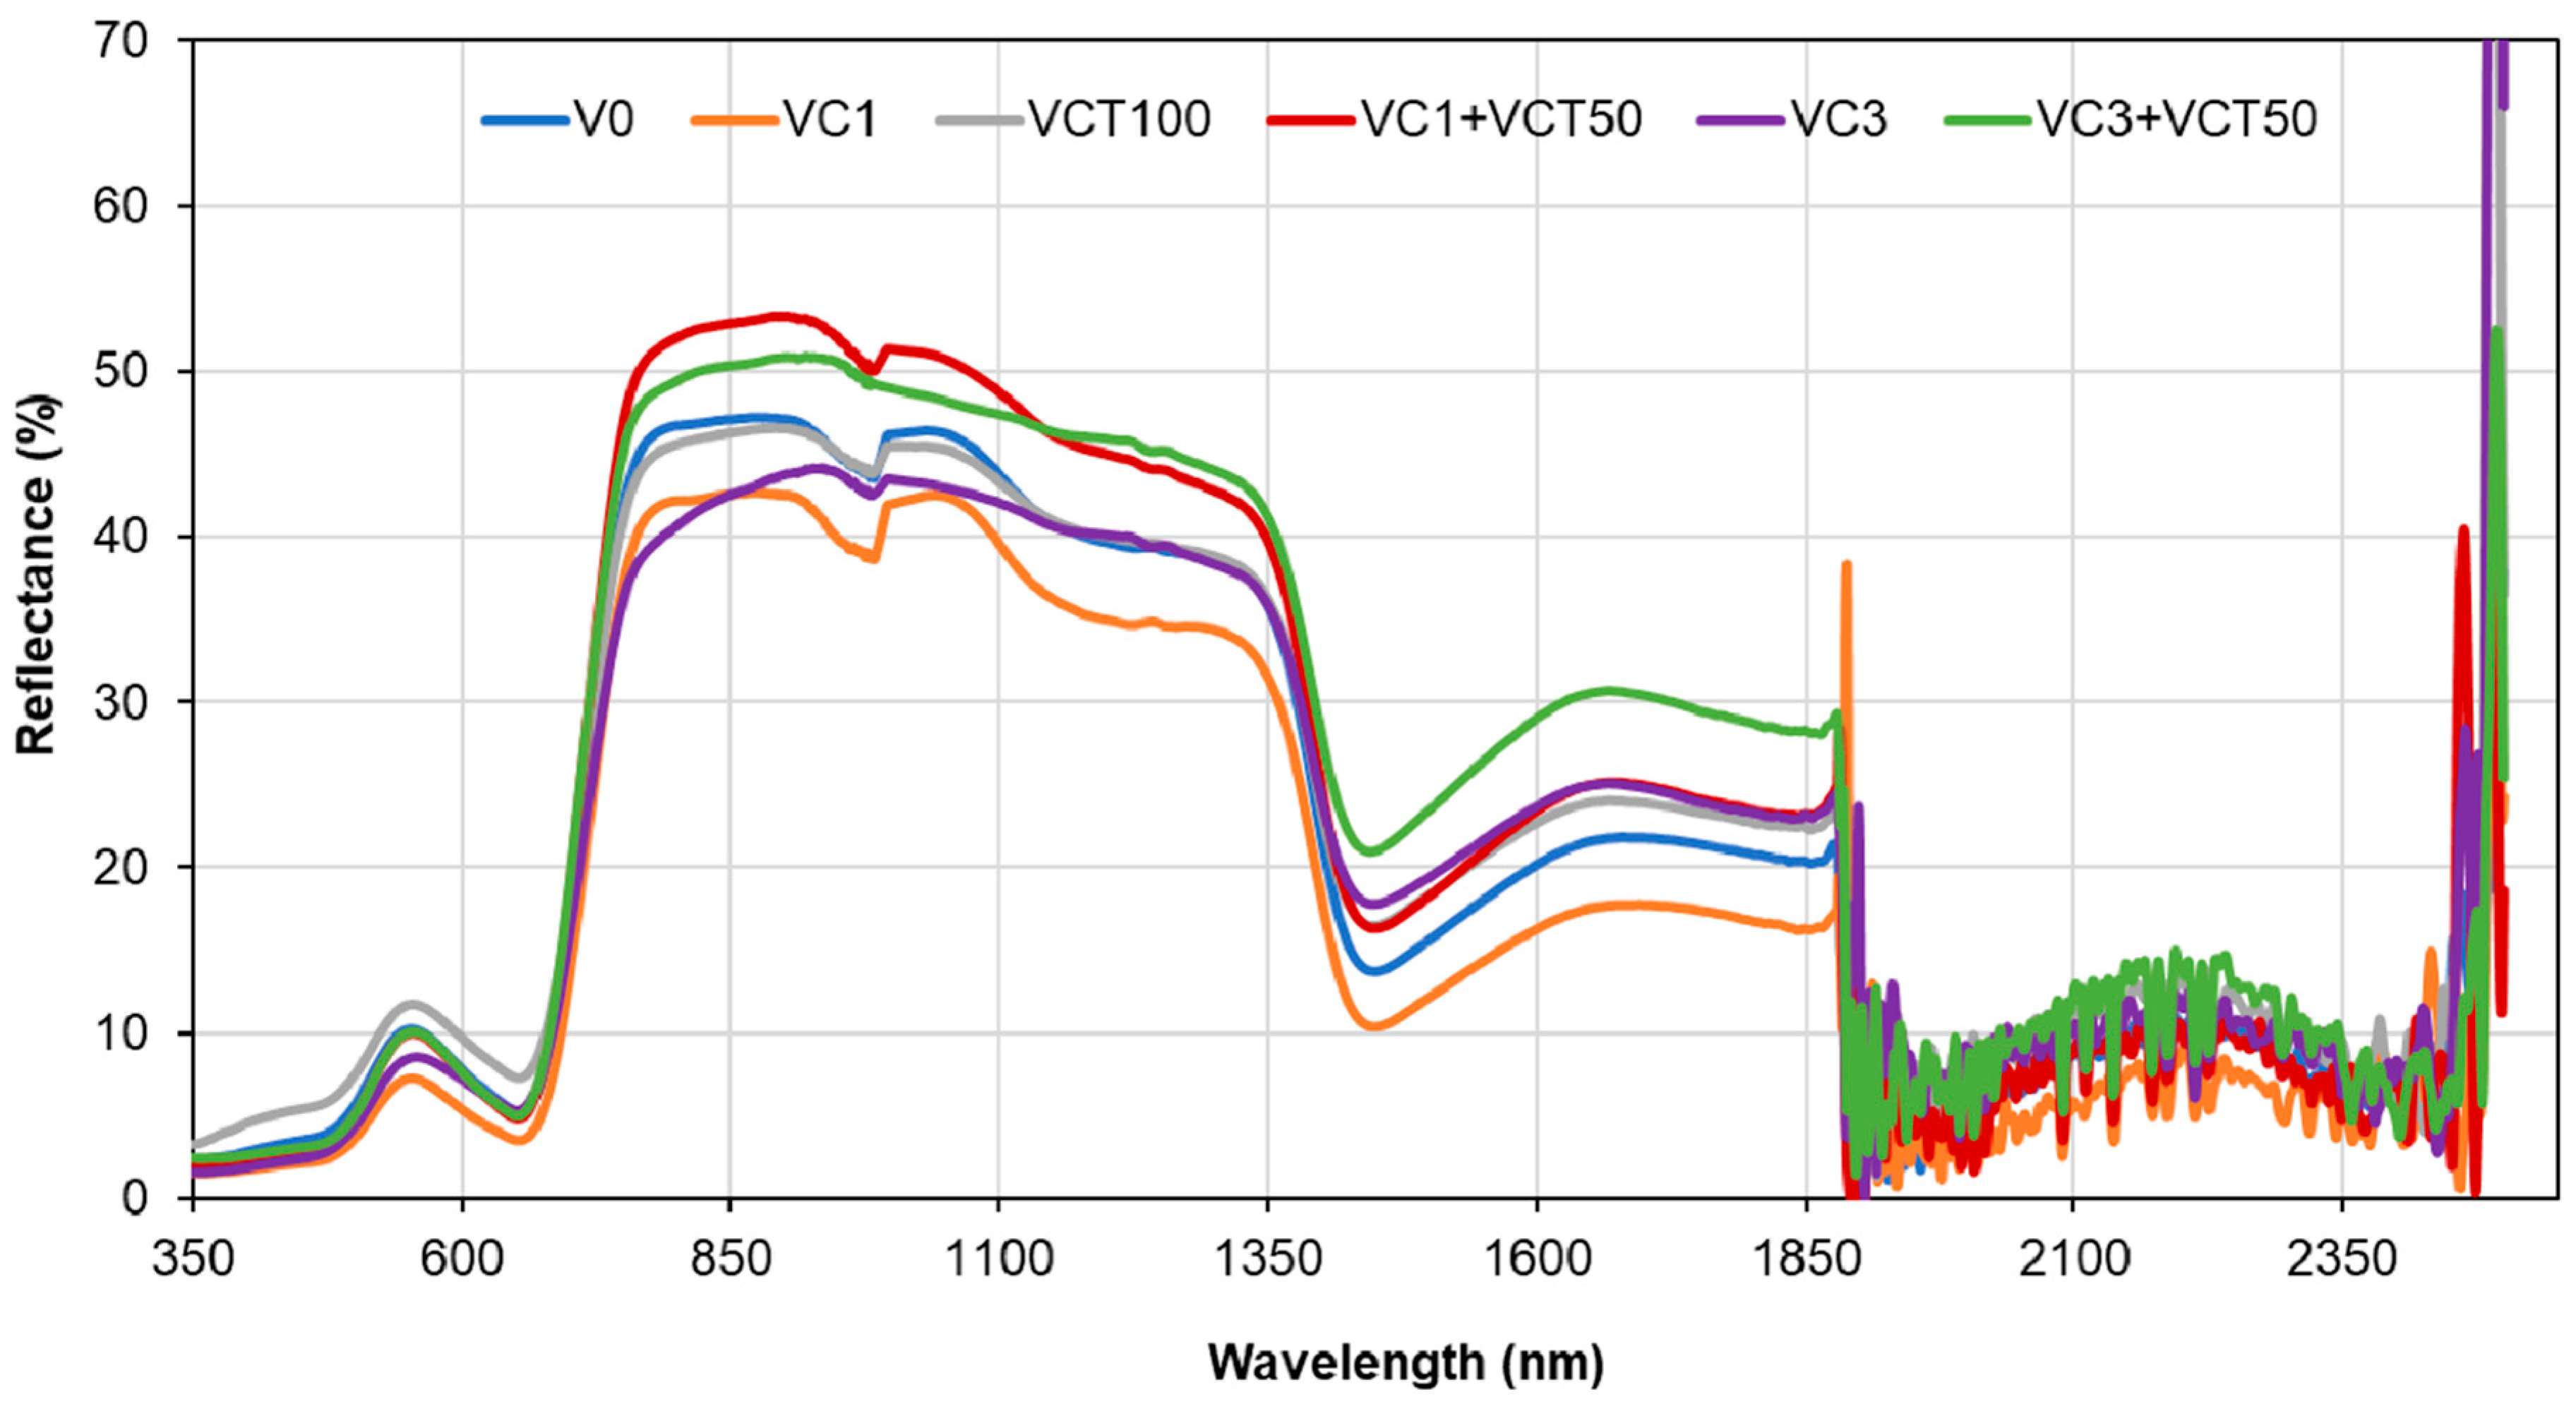
4.6. Plant- and Leaf-Level Spectral Reflectance and Vegetative Indices
The spectral reflectance data show differences between leaf-level and canopy-level measurements, particularly in the visible and near-infrared (NIR) regions. The leaf-level spectra of VC3+VCT50 have lower chlorophyll peaks than other treatments, indicating lower chlorophyll content. Also, low spectral absorption in the blue (400–500 nm) and red (600–700 nm) regions of the VC3+VCT50 spectra indicates a lower rate of photosynthesis, which is consistent with SPAD and stomatal conductance values. The high-water absorption bands at 1400 nm and 1900 nm in both leaf-level and canopy-level reflectance for VC3+VCT50 indicate water stress in plants. These spectral patterns correspond with the observed reductions in biomass, yield, and Brix sugar content in the same treatment, highlighting a clear link between physiological stress signals and diminished agronomic performance.
The higher reflectance in the green band at the leaf level suggests that individual leaves reflect more green light, which is typical for healthy, chlorophyll-rich leaves. The absorption troughs observed in the blue (400–500 nm) and red (600–700 nm) regions further indicate active photosynthesis and chlorophyll absorption [
41]. At the canopy level, the reduced reflectance in the green band and more pronounced absorption in the blue and red regions can be attributed to the increased complexity of the canopy structure, including overlapping leaves, shadows, and varying leaf orientations [
42,
43]. In the NIR region (760–900 nm), the distinct separation of spectral curves at the canopy level, compared to the indistinguishable curves at the leaf level, reflects differences in canopy architecture, biomass, and leaf area index (LAI). The internal leaf structure and canopy geometry influence the NIR reflectance, with higher NIR reflectance indicating healthier and denser canopies [
44]. These findings suggest that canopy-level measurements provide a more integrated view of plant health and structure, whereas leaf-level measurements offer detailed physiological insights.
The Normalized Difference Vegetation Index (NDVI) is a widely used indicator of plant health, reflecting chlorophyll content and photosynthetic activity. The lower NDVI values (
Table 4) observed in high VC application rates (VC3 and VC3+VCT50) may indicate nutrient imbalances affecting chlorophyll content and photosynthetic efficiency. At the canopy level, the NDVI values were generally higher than at the leaf level, reflecting the integrated health and vigor of the entire plant canopy. The differences between leaf and canopy NDVI highlight the complexity of scaling leaf-level measurements to whole-canopy assessments, as canopy-level indices capture the combined effects of the leaf area, density, and structure [
44,
45]. The comparison of vegetative indices at leaf and canopy levels showed that leaf-level NDVI values were lower for VC1 and VC3+VCT50 compared to their respective canopy level values. Leaf-level GNDVI values were lower for all treatments except V0 and VCT100 compared to their canopy-level counterparts, suggesting that canopy measurements integrate more comprehensive plant responses, capturing variations in leaf area and distribution.
The Normalized Difference Moisture Index (NDMI) assesses plant water content and stress. NDMI values were generally lower than 0.4 for all treatments at both the leaf and canopy levels, indicating potential water stress [
46,
47]. NDMI is particularly useful for assessing relative plant water content and detecting moisture-related stress before visual symptoms appear. The consistently low NDMI values observed in the VC3 and VC3+VCT50 treatments likely reflect reduced water uptake due to elevated soil salinity, as indicated by high Na concentrations in
Table 2. This is on par with the lower stomatal conductance (
Figure 3) and reduced SPAD values (
Figure 2), suggesting that the high Na content in the VC used may have disrupted plant water balance in this study. It is, therefore, essential to characterize vermicompost composition, as salinity-related stress effects may vary depending on feedstock sources. In contrast, higher NDMI in VC1 reflects better water retention and nutrient availability, contributing to improved physiological performance and yield.
Therefore, the corn–strawberry rotation used in this study was intended to simulate conditions where organic inputs are applied to one crop, and their residual effects are observed on a subsequent high-value crop. While this rotation is not standard practice in many production systems, it allowed for a controlled evaluation of nutrient carryover, soil salinity, and plant physiological responses. We recognize that outcomes might differ under alternative rotations, soil types, or amendment application timings. Therefore, caution should be taken when generalizing these results beyond the experimental setup.
5. Conclusions
This study showed the importance of the residual effects of vermicompost (VC) and vermicompost tea (VCT) on strawberry production in a corn–strawberry rotation system. A moderate vermicompost application (1 ton/acre, VC1) significantly enhanced strawberry yield, biomass accumulation, and fruit quality, as evidenced by increased Brix sugar content. These improvements reflect the role of VC in maintaining residual soil fertility and supporting plant physiological performance without additional fertilizer inputs.
However, high-rate applications (VC3 and VC3+VCT50) reduced plant vigor and yield, coinciding with elevated soil sodium concentrations and stress responses in plant physiology. In addition, VCT100, VC1+VCT50, and VC3+VCT50 treatments also resulted in diminished physiological performance and yields compared to VC1. It is important to note that these outcomes were specific to the vermicompost source used in this study, which contained atypically high sodium levels. Such salinity-induced effects may not be observed in vermicompost derived from low-sodium feedstocks. We recommend routine analysis of vermicompost sodium content, especially when applying high rates or using composts derived from salt-accumulating species, to prevent potential salinity stress in salt-sensitive crops like strawberries.
This study was limited to a single growing season under subtropical field conditions, and findings may not fully represent long-term or broader climatic responses. Additionally, the experiment was based on a specific corn–strawberry rotation designed to assess residual amendment effects. Therefore, outcomes may vary depending on alternative cropping systems or environmental conditions. Nevertheless, vermicompost and its derivatives offer a sustainable, rotation-compatible, cost-effective alternative to synthetic fertilizers; it is one that enhances strawberry productivity while reducing chemical input dependence, as long as salinity risks are managed through appropriate feedstock selection and pre-application testing.


