Article

Biological Evaluation of Water Quality with the BMWP Index in a Section of the Tlapaneco River Affected by Two Rural Communities in the Guerrero Mountains, Mexico

by
Aide Pantiga-Tapia
1,
José Luis Rosas-Acevedo
1,*,
María Guzmán-Martínez
2,
José Alberto Solís-Navarrete
3,
Ramón Bedolla-Solano
4 and
Karla Rosalba Anzaldúa-Soulé
5
1
Centro de Ciencias de Desarrollo Regional, Universidad Autónoma de Guerrero, Privada de Laurel No. 13, Col. El Roble, Acapulco 39640, Mexico
2
Facultad de Matemáticas, Universidad Autónoma de Guerrero, Chilpancingo 39087, Mexico
3
Centro de Investigaciones en Geografía Ambiental, Universidad Nacional Autónoma de México, Antigua Carretera a Pátzcuaro 8701, Col. Ex hacienda de San José de la Huerta, Morelia 58190, Mexico
4
Escuela Superior de Sociología, Universidad Autónoma de Guerrero, Colonia Alta Progreso, Acapulco 39610, Mexico
5
Facultad de Turismo, Universidad Autónoma de Guerrero, Cerrada de Papantla, Av. Adolfo Ruiz Cortínez s/n Col. Progreso, Acapulco 39574, Mexico
*
Author to whom correspondence should be addressed.
Environments 2025, 12(3), 91; https://doi.org/10.3390/environments12030091
Submission received: 10 January 2025 / Revised: 17 February 2025 / Accepted: 28 February 2025 / Published: 14 March 2025

Abstract

:
Anthropic activities such as agriculture, livestock, and wastewater discharges affect water quality in the Tlapaneco River in the mountain region of the state of Guerrero, México, which is a tributary of the Balsas. The river flows from the mountain region and discharges into the Pacific Ocean; the water resource in the localities mentioned is used for agriculture, recreation, and domestic activities. The aim of this study was to evaluate water quality in the stretch of influence of two localities, Patlicha and Copanatoyac. The instrument used was the Biological Monitoring Working Party biotic index (BMWP) and physicochemical parameters. Nine sampling sites were selected according to the perception of the local community with respect to disturbance; the study area was divided into three parts: high, medium, and low. Twenty-seven collections of macroinvertebrates and water were analyzed, in dry and rainy seasons, through the presence–absence of these organisms and physicochemical analysis, to evaluate water quality. The results showed that the conditions of the riverbed associated with daily activities and domestic discharges are important factors in the composition of the families. Water quality was very poor to regular, according to the macroinvertebrate assemblages collected. The BMWP index was of acceptable quality when the orders (Family) Ephemeroptera (Leptohyphidae; Leptophlebiidae; Baetidae; Ephemerellidae), Diptera (Chironomidae; Simulidae), Trichoptera (Hydropsychidae), Hemiptera (Veliidae; Corixidae), Coleoptera (Hydrophylidae), and Odonata (Lestidae) were present; in sites with poor quality, the families Chironomidae, Leptophlebiidae, Veliidae, Corixidae, Hydropsychidae, Leptohyphidae, Hydrophilidae, Baetidae, and Simuliidae were found, while in very poor quality water, only family Corixidae was present.

1. Introduction

Lotic ecosystems and other water resources provide different ecosystemic services to organisms such as flora, fauna, and human populations [1,2]. These services are classified into four categories: providing, regulating, cultural, and supporting [3]. Moreover, in relation to their biological value, they are distinguished by harboring a rich and diverse biota [4]. However, these water bodies are subjected to multiple anthropogenic pressures, which impact these aquatic ecosystems [2,5]. Agricultural intensification and other anthropogenic activities drive transformations in rural landscapes, such as changes in land use for their own activities and the establishment of human settlements [6,7], which affect freshwater ecosystems through the discharge of wastewater, due to the lack of drainage and sewage systems and the lack of treatment of these discharges with a record of more than 70% freshwater pollution worldwide [8]; in developing countries, this is limited; with a remarkable representation of 80% of untreated water discharge to these environments [9], resulting in freshwater pollution recorded at more than 70% worldwide [10]. It is estimated that by 2050, water demand will increase by 80%, affecting 86% of the population, so that the annual water availability will be reduced in the next 55 years [11,12,13]; likewise, a water deficit is estimated in 2030, with a projected demand of 25% [12]. As part of the socio-environmental characterization of a section of the Tlapaneco River, a tributary of the Balsas River (Water Region 18), an approach was applied to the biological condition, seasonality (rainfall, dryness), and cumulative impacts of anthropogenic activity using aquatic macroinvertebrates. The studied stretch is influenced by two rural communities (Patlicha–Copanatoyac) in the mountains of the state of Guerrero, Mexico, a region considered as highly marginalized [14], where water quality is affected by anthropogenic activities, which is why it is necessary to assess water quality by means of instruments accessible to the inhabitants. The aim of this study was to determine water quality using the Biological Monitoring Working Party biotic index (BMWP), to lay the foundations for future community monitoring for self-management of the water resource before local authorities, which will allow its conservation and the sustainability of ecosystem services.

2. Materials and Methods

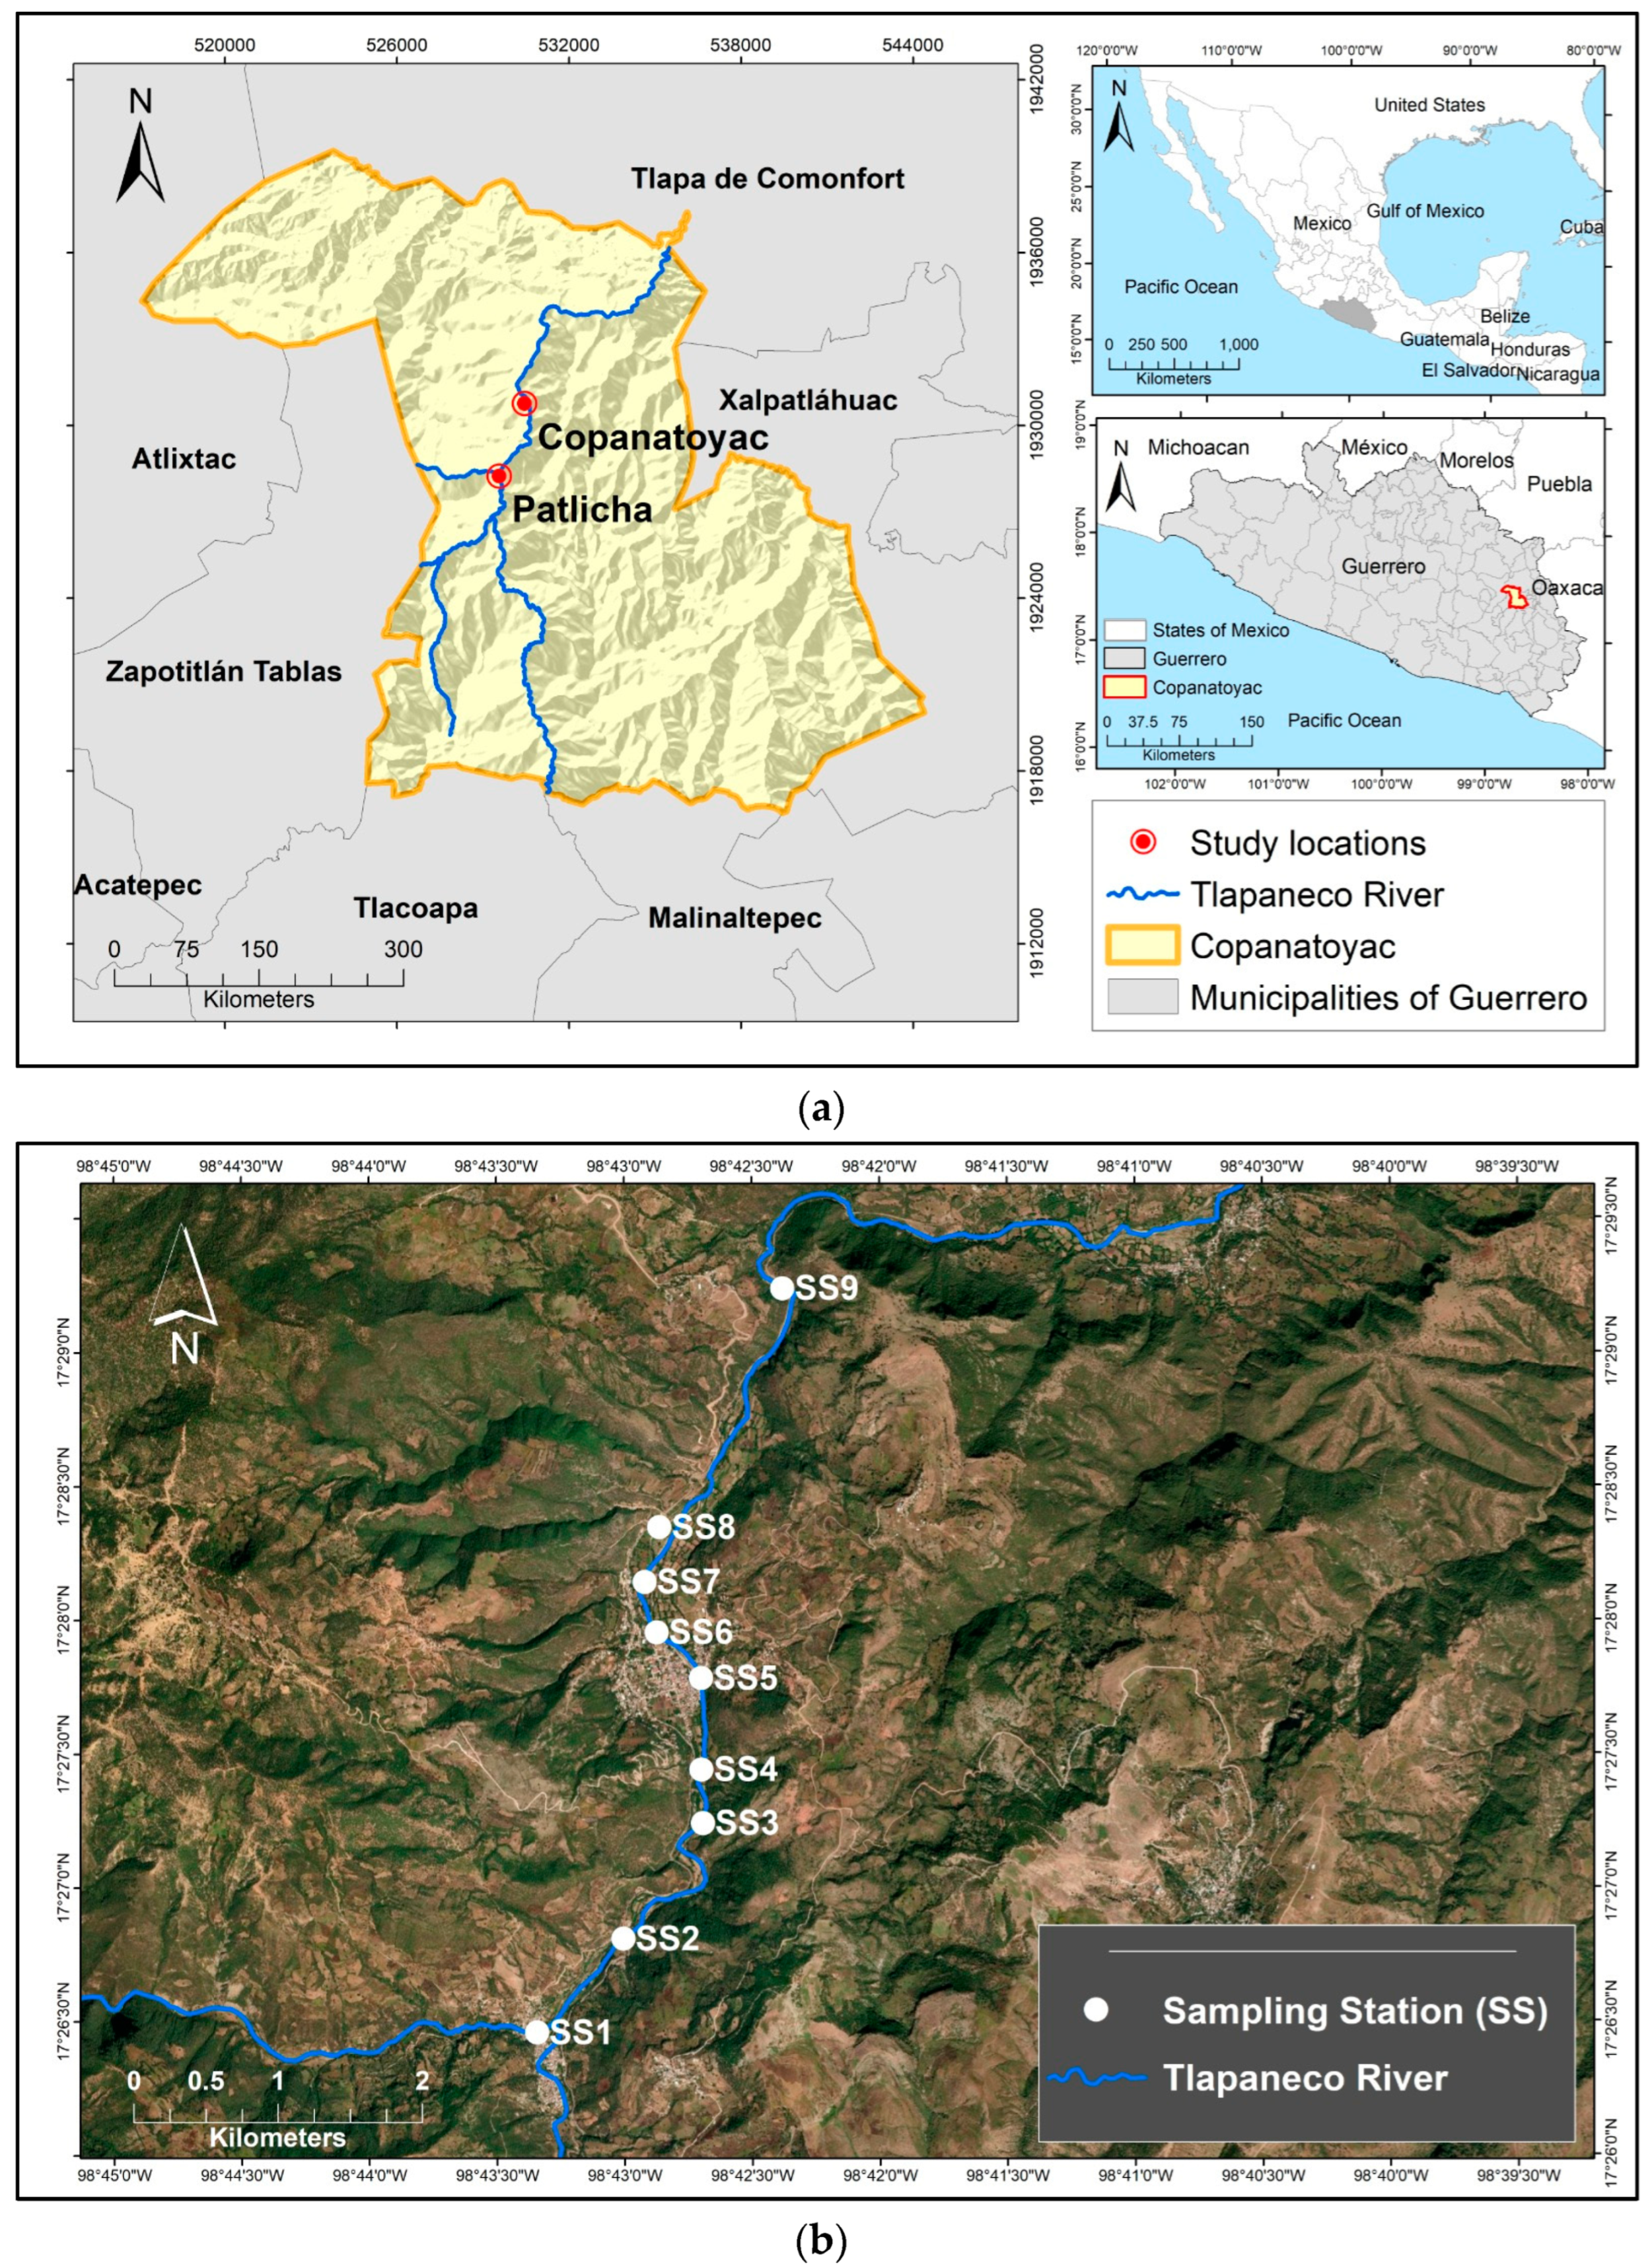
2.1. Study Area and Selection of Sampling Sites

The study was carried out in the Montaña of Guerrero region, geospatially co-named as Middle Mountain, in the municipality of Copanatoyac, specifically in a section of the Tlapaneco River (5722.64 m length), which crosses the localities of Copanatoyac and Patlicha [15]. It belongs to hydrological region 18 of the Balsas, located in the Sierra Madre del Sur, with a surface area of 4981.53 km2 [16]. It has a warm sub-humid climate with rainfall in summer, with precipitation between 700 and 1500 mm and low deciduous forest vegetation [17]. The months with the lowest rainfall are from November to April, and the highest are from May to October [18].
Nine collection stations were established, covering a section of the Tlapaneco River, from the exit of the Patlicha region, which corresponds to the upper upstream (SS1, SS2, SS3) until reaching the locality of Copanatoyac, which was considered the middle (SS4, SS5, SS6) and lower (SS7, SS8, SS9) downstream. The location of the stations followed the current flow, considering the multihabitat representativeness (Figure 1), in consideration of the inhabitants of the Copanatoyac locality, including their perception of the different disturbance conditions of the river section (Table 1).

2.2. Data Collection

2.2.1. Macroinvertebrate Sampling

The collections were carried out in April 2022 and 2023 (dry season) and in December 2022 (after the rainy season); the total number of macroinvertebrate collections was 27; the collection in the rainy season of 2023 was not carried out because of hurricane Otis (category 5) restricting accessibility of the sampling sites. The collections were in replicates of 3 per site (high, medium, and low) and season, to cover the multihabitat condition within each sampling station. The duration of the sampling was 20 to 30 min per station. A 300 µm D-type collection net and a 500 µm Surber net were used for collection [19]; collections were carried out by the same operator, to ensure comparability between collection stations and samples. Macroinvertebrates were separated in situ and fixed in 70% ethanol, in the laboratory with a ZEISS ® stereo microscope, using a scope of 20 to 60 magnifications 20/60 X, and were regrouped according to their external morphology for subsequent taxonomic identification using specialized keys and pictographic guides [20,21].

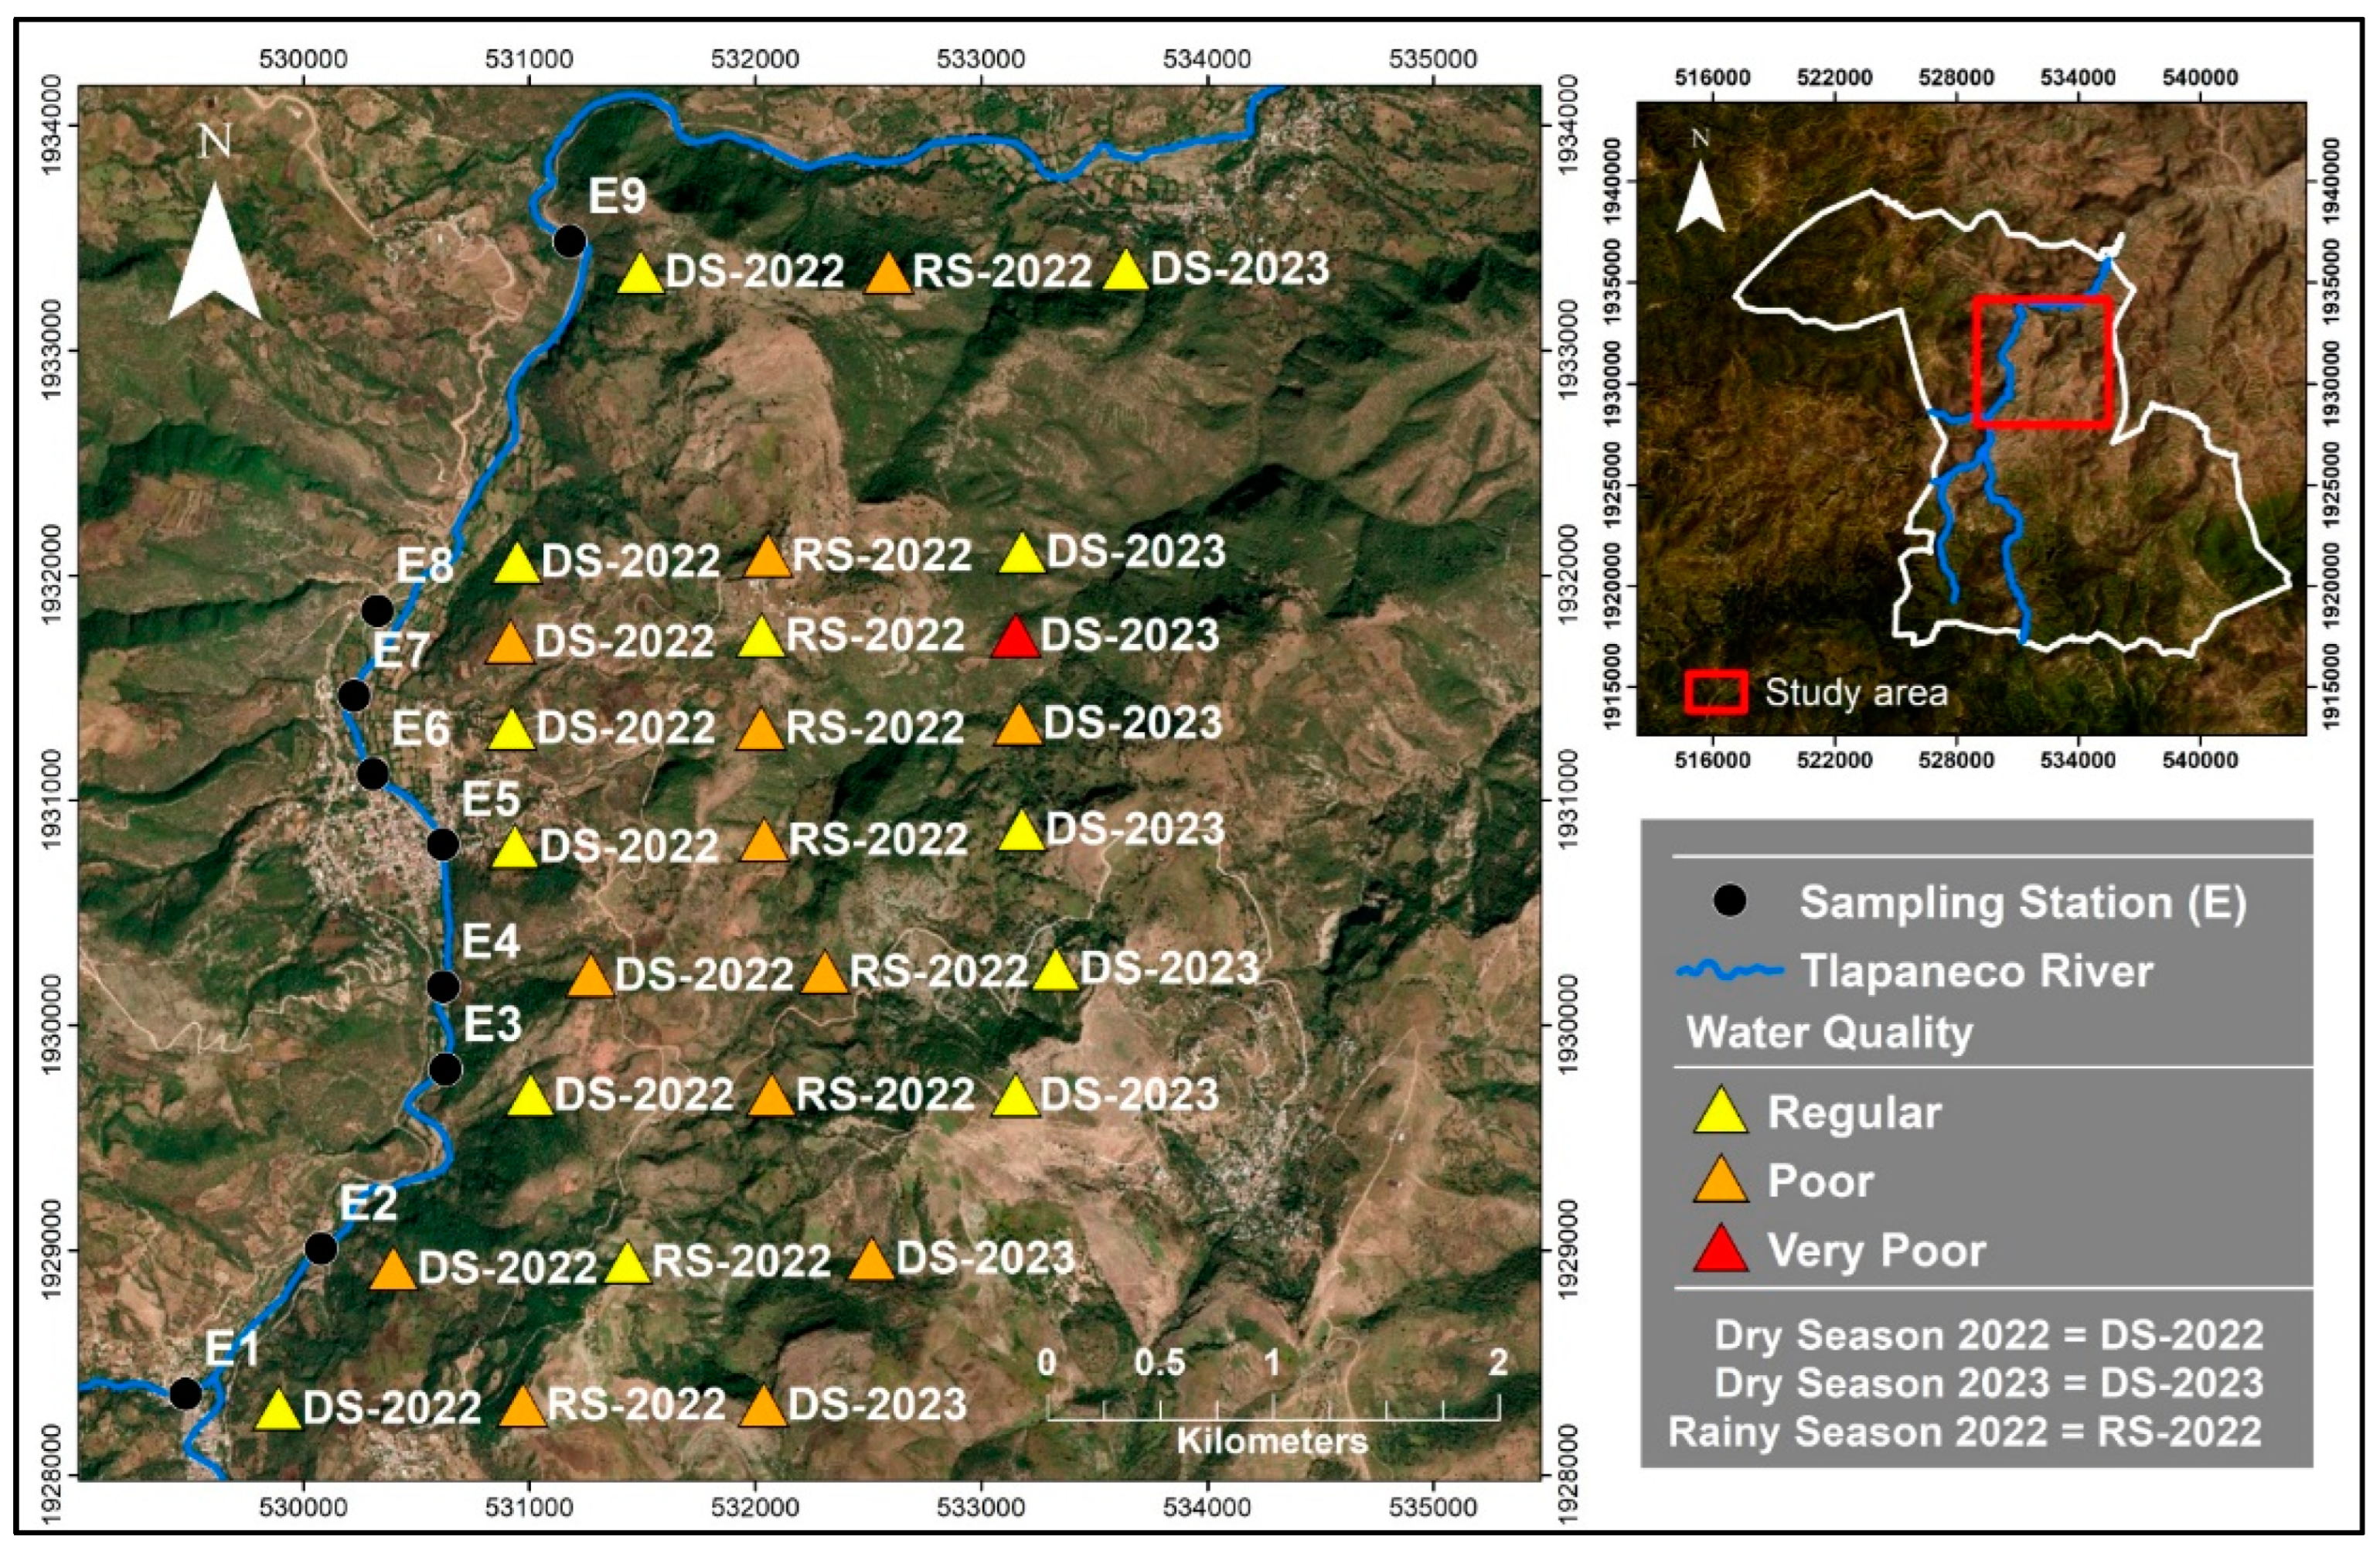
2.2.2. Assessment of Water Quality with the BMWP-CR Index

The BMWP-CR biotic index was chosen, which presents scores (1 to 10) of tolerances assigned to the macroinvertebrate families according to the degree of sensitivity to organic pollution, as this proposal was considered adequate for the conditions of the study area. The total BMWP-CR score for each sampling station was obtained by adding the scores of the families present. Water quality was determined according to the values of this index: >120 (excellent quality waters), 101–120 (good quality waters, not polluted or not sensitively altered), 61–100 (fair quality waters, eutrophic, moderate pollution), 36–60 (poor quality waters, contaminated), 16–35 (poor quality waters, very polluted), and <15 (very poor quality waters, extremely polluted) [19].

2.2.3. Specific Physicochemical Analysis

The following parameters were determined in situ: temperature (°C), hydrogen potential (pH), electrical conductivity (EC), and total dissolved solids (TDS), using a HANNA ® (Hong Kong) portable potentiometer, model HI98129; dissolved oxygen (DO) was determined by volumetric oxidation–reduction titration (metric iodine method—NMX-AA-012-SCFI-2001).

2.3. Data Analysis

Statistical analyses were performed using R free software version 4.3.2. A two-factor analysis of variance was performed with the BMWP index and the variables temporality and zone, to see if there is a relationship between the levels of these variables and the observed value of the BMWP. To study the ranges’ variabilities in temperature, pH, EC, TDS, and DO in the three seasons (dry 2022, dry 2023, and rainy 2022), a comparison of means was made. Only the temperature met the assumption of normality (A = 0.638, p-value = 0.086) and homogeneity of variance (B = 0.292, p-value = 0.864), so the Tukey test statistic was used for this variable. To stabilize the variance and ensure that the data fit a normal distribution with the rest of the variables, the following Box and Cox transformation [22] was used:
y * = y λ 1 λ
However, only pH (W = 0.931, p-value = 0.073) and OD (W = 0.949, p-value = 0.210) met the normality assumption (Rayston, 1995), while the assumption of homogeneity of variance [23] was met only by CE (B = 0.428, p-value = 0.807) and SDT (B = 0.477, p-value = 0.787). Therefore, the nonparametric Kruskal–Wallis test [24] was used to compare the means of these four variables as a reference for their influence on the presence of macroinvertebrates in the study area [25].

3. Results

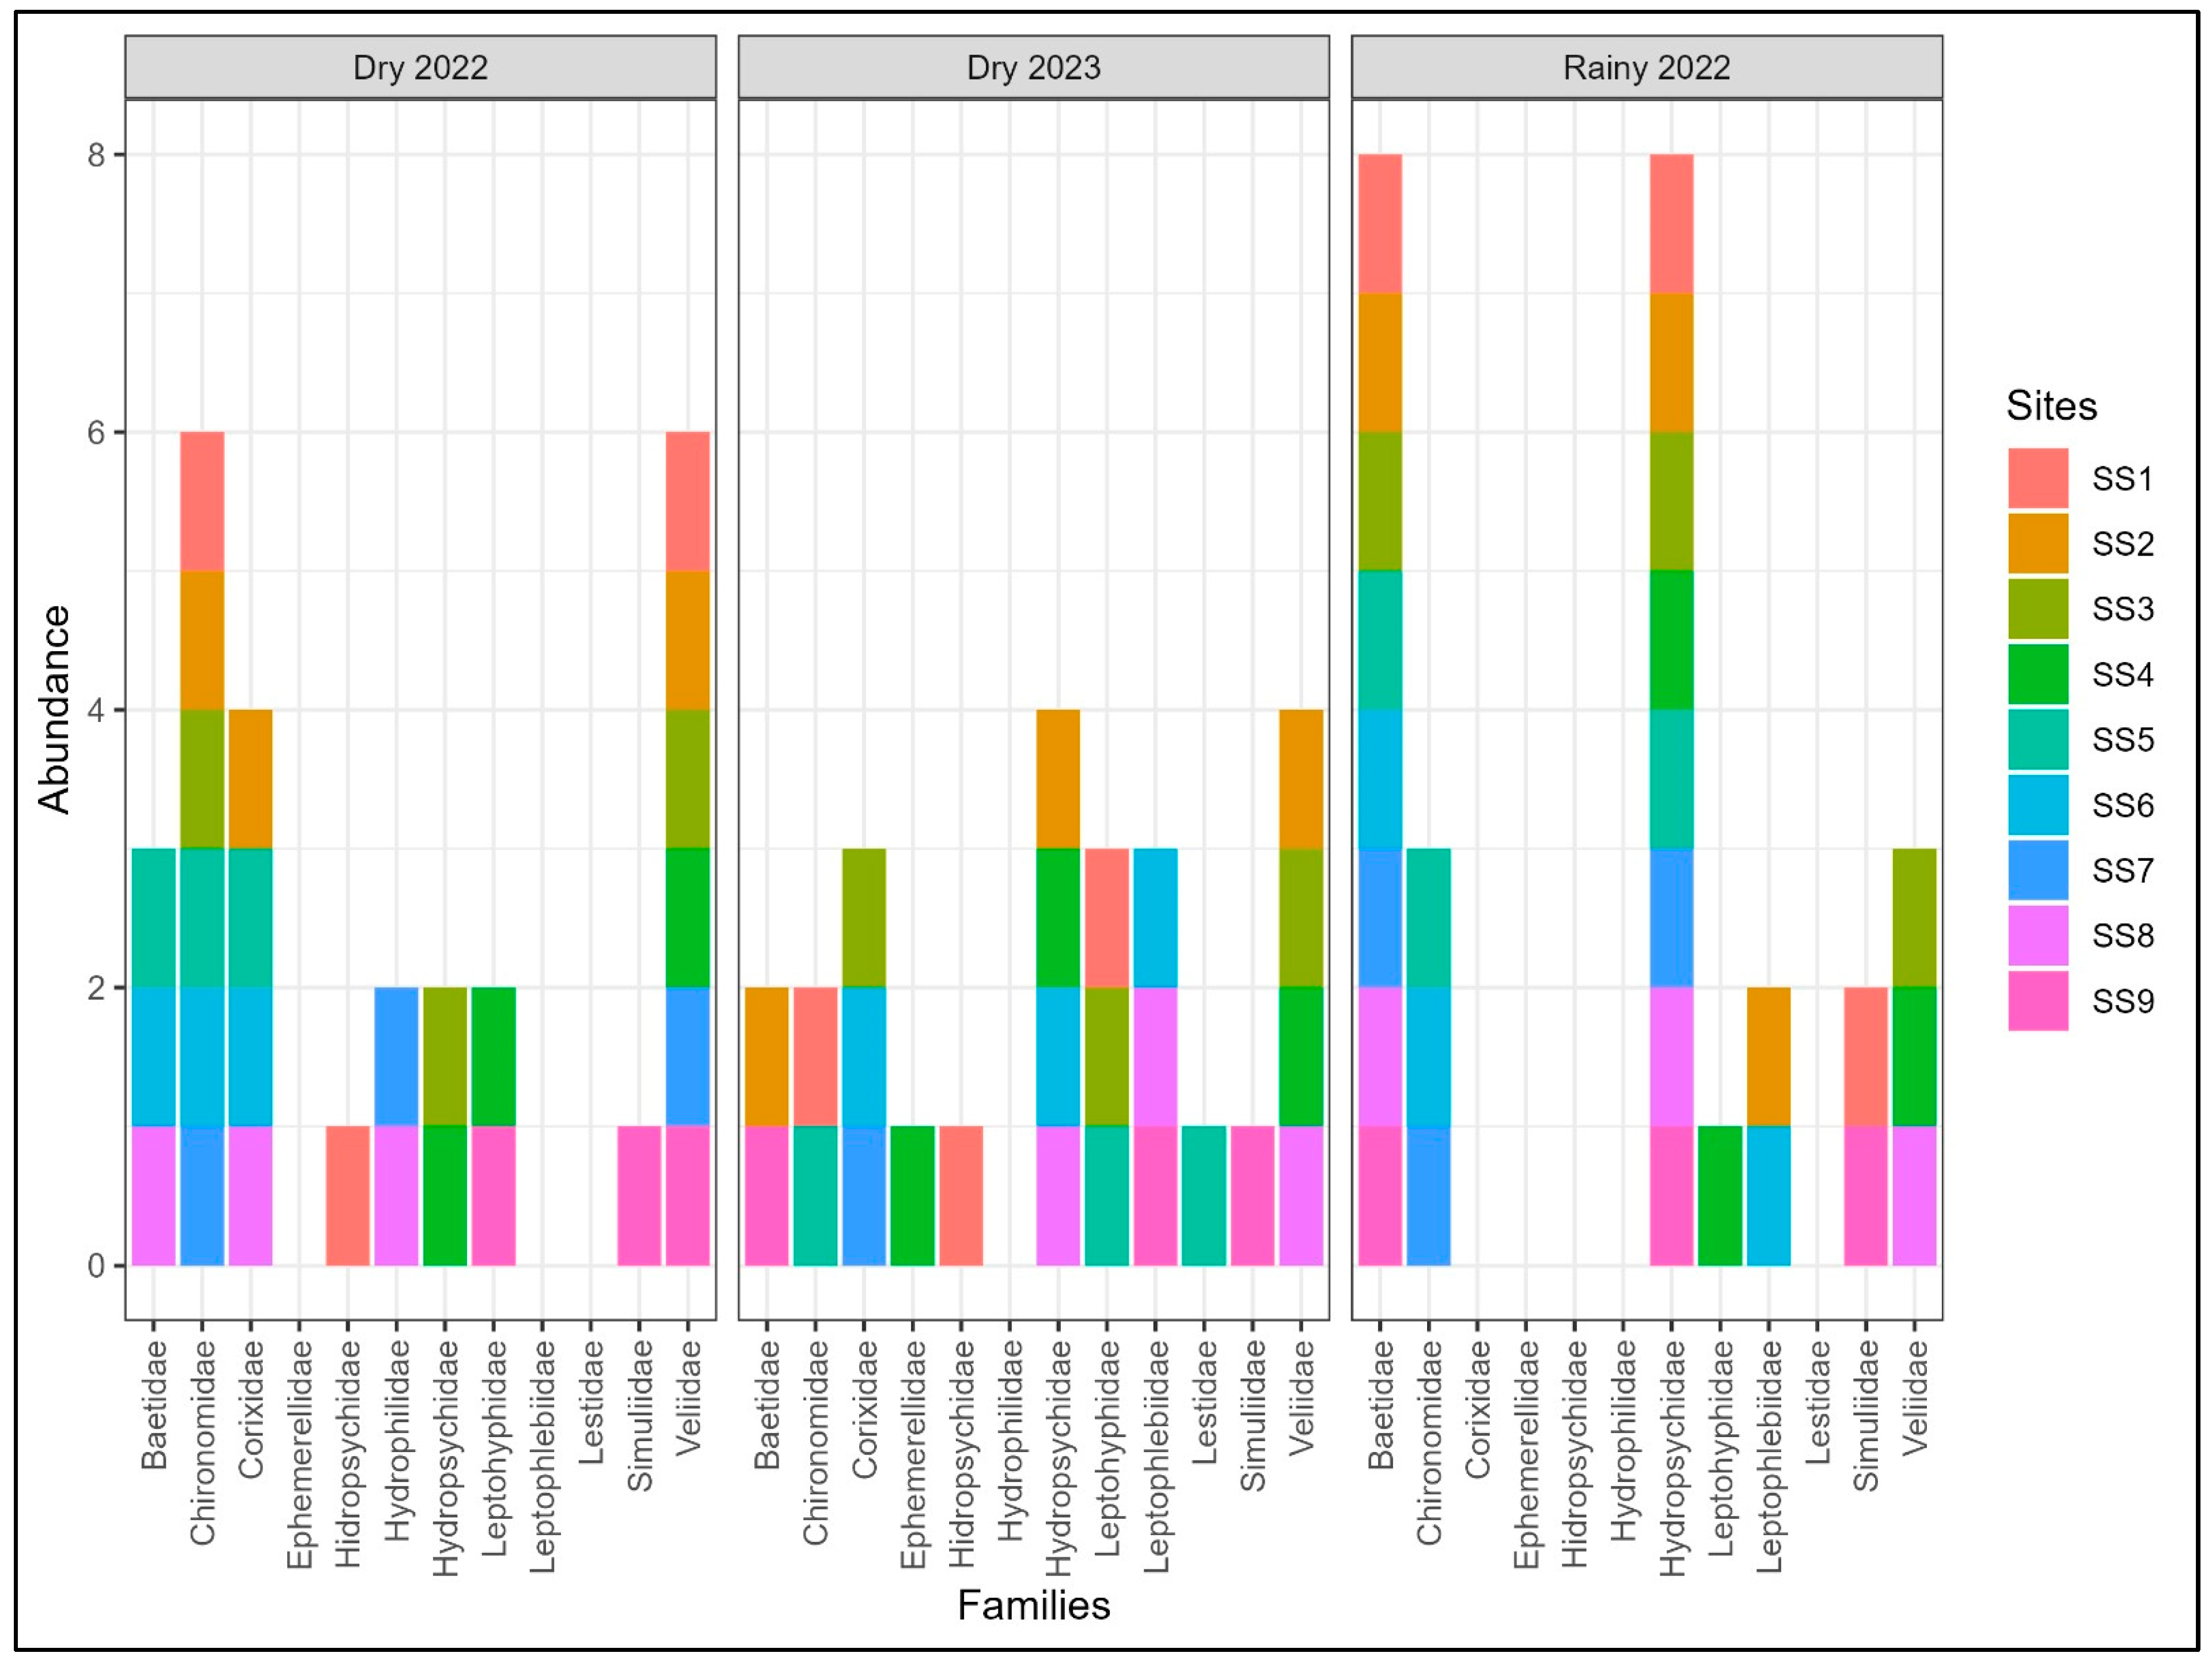
3.1. Macroinvertebrate Biodiversity

A total of 5810 organisms were identified from the 27 collections in the study area, grouped into nine orders and 33 families (only the 11 most abundant are presented in Figure 2). The Hemiptera-Veliidae groups were the most abundant in dry season 2022 SS2 (439 specimens) and SS4 (383) and in 2023 SS2 (335) and SS4 (147); moreover, in the rainy season, the abundance was higher in SS4 (231 specimens) and in SS3 (181), while Trichoptera-Hydropsychidae was the most abundant only in the rainy season in SS7 (170 specimens) and SS4 (105).
Figure 3 and Figure 4 shows the water quality in the nine stations, which corresponds to three zones (high, medium, and low) of the evaluated section of the river during two seasons (dry and rainy). In relation to the BMWP-CR index, in the dry season of 2022, in stations two, four, and seven, the water quality was determined to be poor; in the remaining stations, it was regular quality. On the other hand, in the 2022 rainy season, in stations two and seven, the water quality was regular and in the remaining stations poor. However, in the dry season of 2023, at station seven, the water quality was determined to be very poor; in stations one, two, and seven, while in the remaining stations the water quality was determined to be poor and regular, respectively. In addition, Figure 3 shows the sampling sites in the river, in the upper, middle, and lower parts, in relation to the BMWP-CR index; in the dry season of 2022, the water quality was determined to be fair; in the rainy season of 2022, it was poor, and in the dry season of 2023, in the upper and lower parts, it was determined to be poor and, in the middle part, fair.
According to the results, there is no relationship between the observed values of the BMWP index with seasonality nor study site. That is, the BMWP values do not depend on the seasonality (dry and rainy) nor on the location of the collection sites (high, medium, and low); this depends on the physical condition of the channel and anthropic activity (Table 1). A two-factor analysis of variance was performed with the BMWP index, and the variables seasonality and zone, to identify the correlation between the levels of these variables and the observed value of the BMWP; the assumption of normality (A = 0.45813, p-value = 0.2439) and homogeneity of variances (B= 4.1232, df = 2, p-value = 0.1272) were fulfilled (Table 2).

3.2. Physicochemical Analysis

The comparison of means of the physicochemical variances in three collections during two periods is presented in Table 3. The temperature in the three zones and in the two seasons fluctuated between 13 and 28.9 °C. In the dry season of 2022, it was 20–28.9 °C; on the other hand, in 2023, it was 18.7–26.5 °C. However, in the rainy season, the lowest temperatures were recorded, 13–20.8 °C. In terms of the temperature, there are mean differences in the three seasons.
The pH fluctuated (7.7–9.47) all over the stations and seasons. In dry 2022, it was 7.7–8.6 and in 2023, 7.56–9.47. However, in terms of rainfall, it was 8.1–8.7. In pH, no differences were found.
The EC in the three zones and in the two seasons oscillated (144–747 µs/cm). In dry season 2022, it was 238–747 µs/cm. In dry season 2023, it was 207–614 µs/cm. However, in the rainy season, the lowest values were recorded between 144 and 320 µs/cm. TDS ranged (73–374 mg/L) in the three zones and in the two seasons. In the dry 2022 season, it was 119–374 mg/L; in dry season 2023, it was 111–304 mg/L. However, in the rainy season, the lowest values were recorded (73–161 mg/L), while the averages of EC and SDT in the rainy seasons were statistically different from those in the dry seasons. According to the results (Table 3), the temperature decreased from one year to the next during the dry season and was higher in the dry season of 2022. Regarding pH, it remained constant throughout the evaluation period, while the levels of EC and TDS were higher in dry seasons than in rainy seasons, which indicates greater accumulation of TDS and EC in dry seasons. Finally, the OD was higher in the dry season of 2023 than in the dry season of 2022.
On the other hand, the DO in the three zones and in the two seasons ranged between 3.46 and 12.10 mg/L. In dry 2022, it was 3.75–9.52 mg/L. On the other hand, in dry 2023, it was 3.46–12.10. However, in rainy 2022, it was 7.12–8.44 mg/L (Table 4). For DO, there are differences in averages in the two dry seasons.

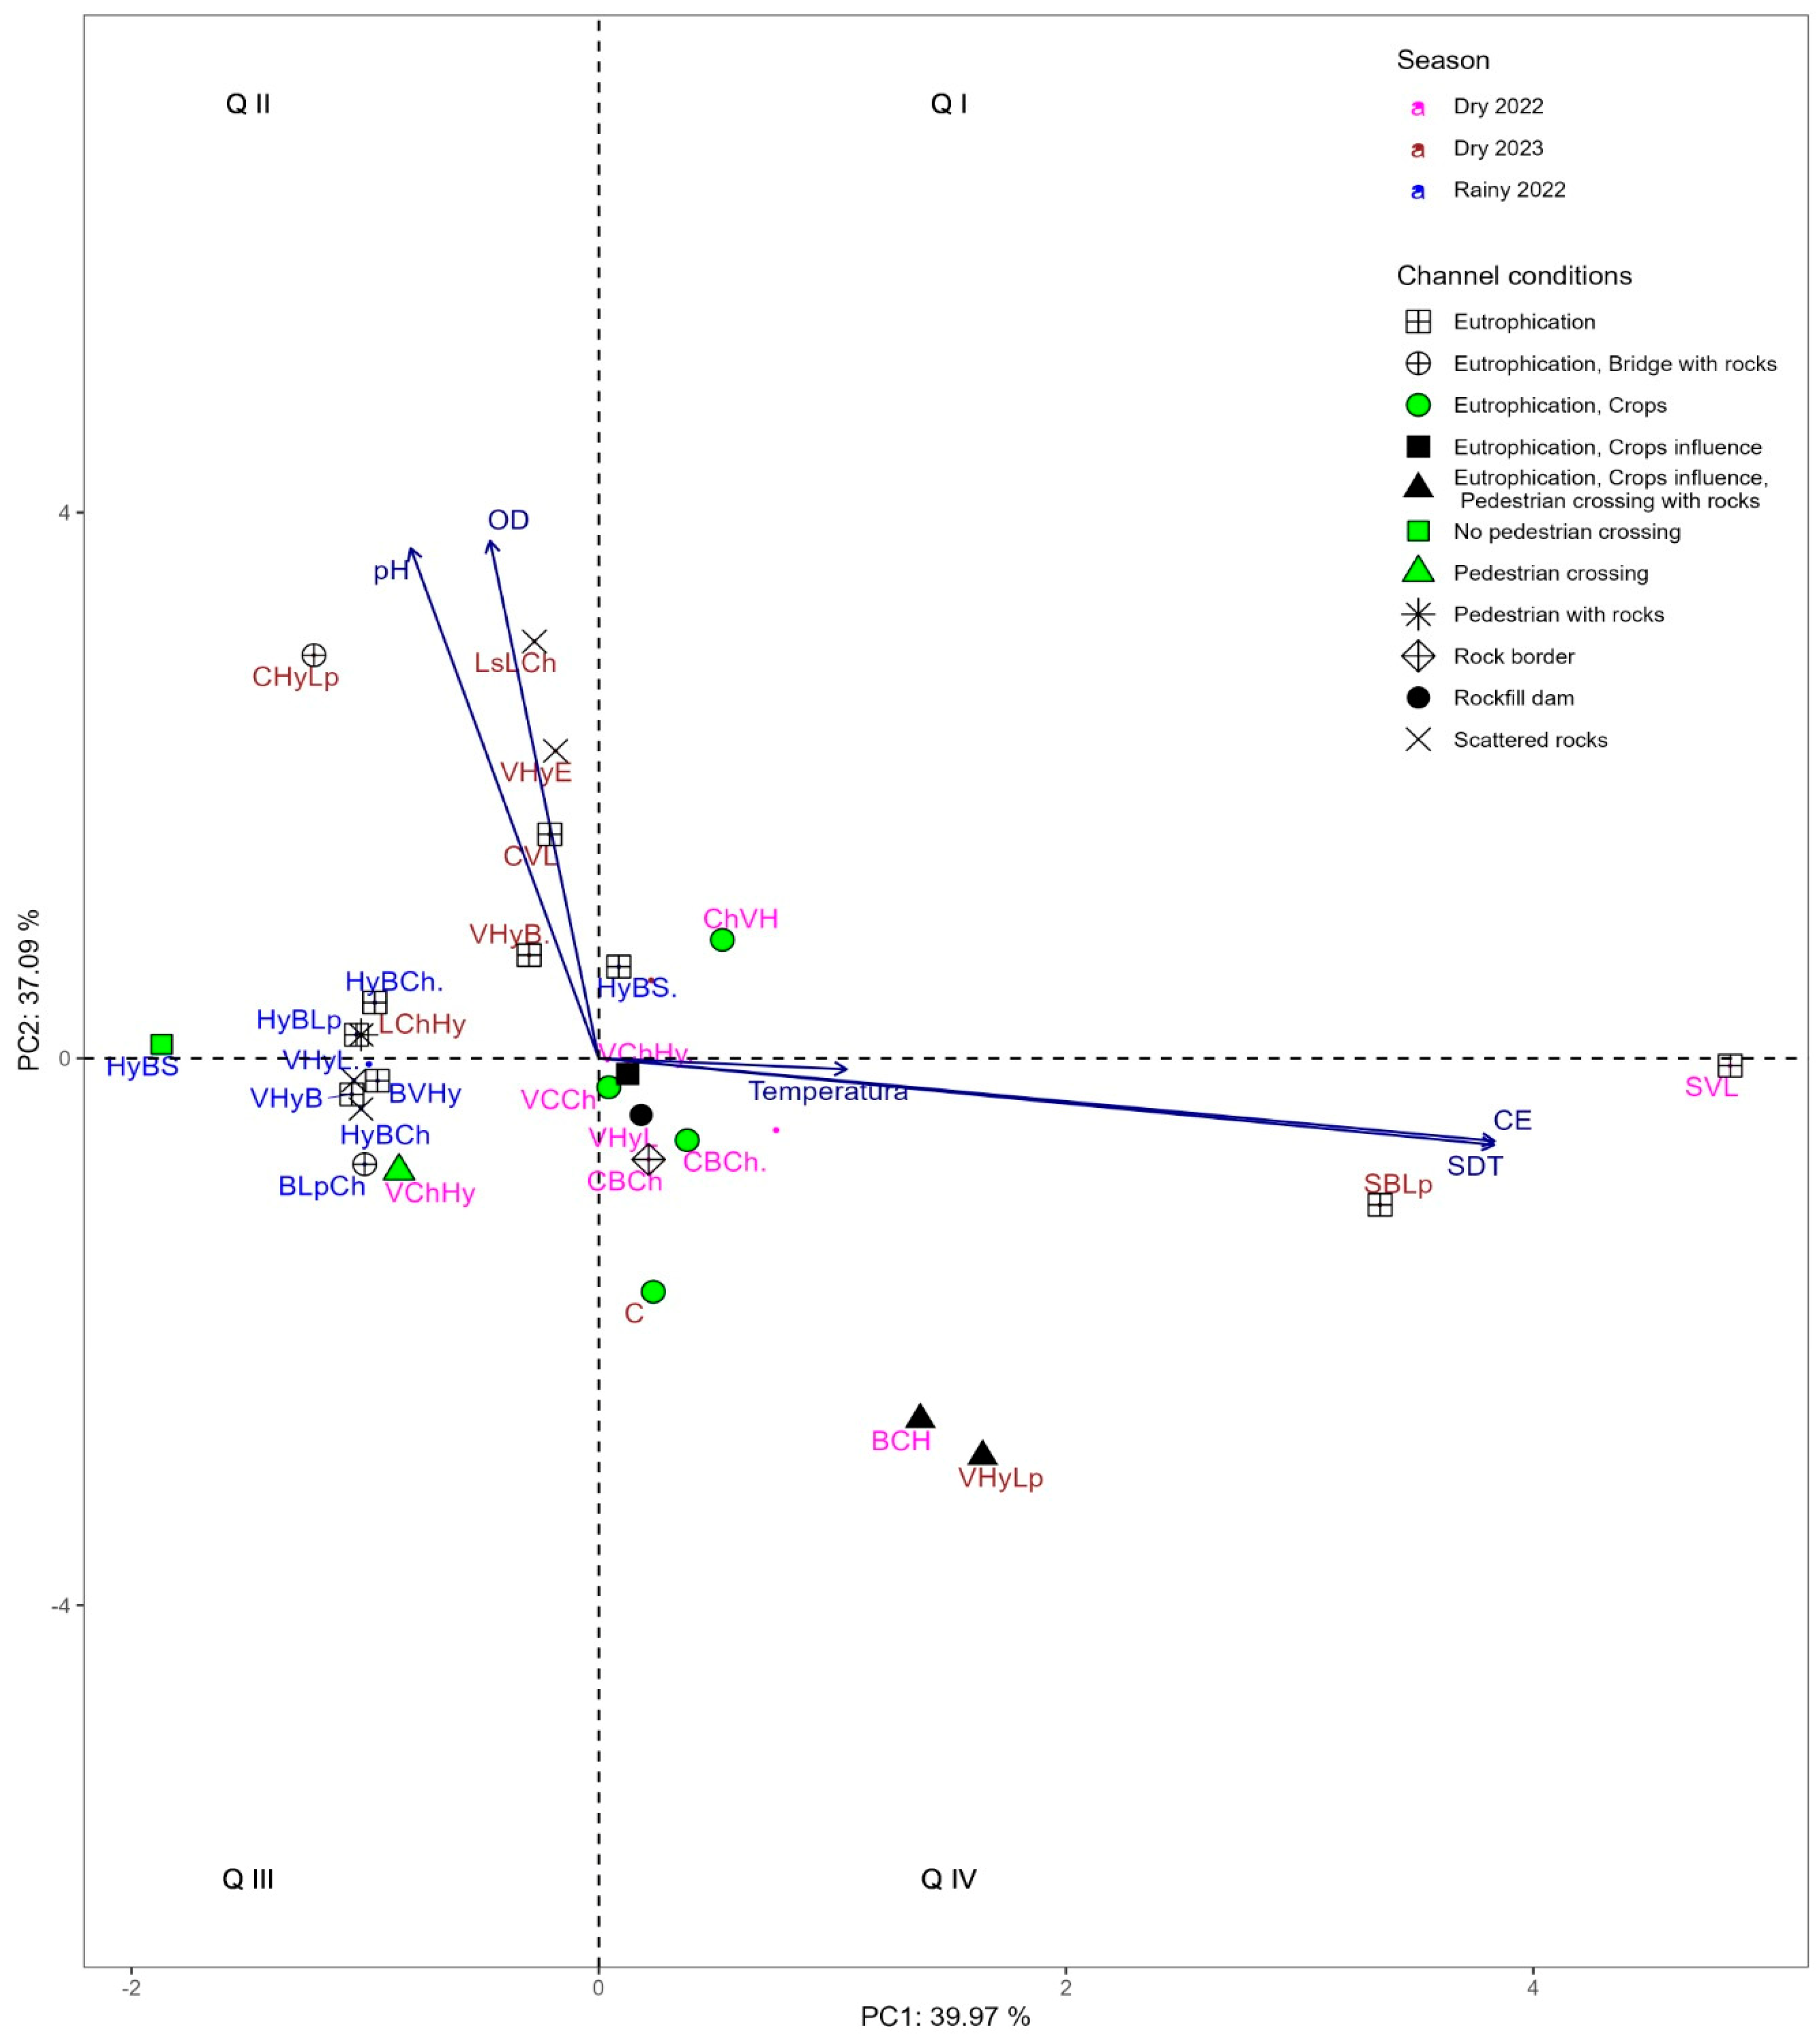
Principal Component Analysis of Physicochemical Variables

The principal component analysis [26] explains 77.06% of the total variability of the 27 water samples; consequently, EC and TDS contribute more to the first component, PC1, resulting in PC1 being an indicator of EC and TDS. In the second component, PC2, pH and DO contribute more, indicating that PC2 is an indicator of pH and DO (Table 5).
Figure 5 and Figure 6 show the relationship of the macroinvertebrate families found in the 27 collections and water samples from the nine sampling sites under the first two linear combinations taking temporality, channel conditions, and permanent anthropic activity.
In quadrant QII are located the families with the highest presence of high pH and DO levels, with eutrophication, rock bridges, and scattered rocks in the channel (Figure 5), while in Figure 6 are located the conditions of permanent anthropogenic activity with wastewater discharges, domestic use, and recreation. The assemblages of the Corixidae, Hydropsychidae, Leptophlebiidae (CHyLp), Lestidae, Leptohyphidae, Chironomidae (LsLCh), Veliidae, Hydropsychidae, Ephemerellidae (VHyE), and Corixidae, Veliidae, Leptohyphidae (CVL) families were observed in this quadrant during the dry season of 2023 with pH values of 9.5, 9.4, 9.1, and 8.8 and DO values of 11.29, 12.10, 10.88, and 10.78 mg/L, respectively (Table 4).
Furthermore, in quadrants QII and QIII, families were concentrated in the rainy season, with low levels of temperature, pH, DO, EC, and TDS; because the temperature ranged from 13 to 20.8 °C; pH 8.1–8.7; DO 7.12–8. 44 mg/L; EC 144–320 µs/cm; and TDS 73–161 mg/L (Table 4); these assemblages occurred in eutrophication channel conditions, rock bridge, scattered rocks, without crosswalk (Figure 5), as well as in conditions of permanent anthropic activity with wastewater discharges, domestic use, farms, and recreation sites (Figure 6). Among these family assemblages, Hydropsychidae, Baetidae, Simuliidae (HyBS), Baetidae, Leptophlebiidae, Chironomidae (BLpCh), Hydropsychidae, Baetidae, Leptophlebiidae (HyBLp), Hydropsychidae, Baetidae, Chironomidae (HyBCh), Veliidae, Hydropsychidae, Baetidae (VHyB), Baetidae, Veliidae, Hydropsychidae (BVHy), and Veliidae, Hydropsychidae, Leptohyphidae (VHyL) were found. However, in quadrant QIV, the families present at low pH (8.4, 8.0) and DO (7.50, 6.51 mg/L) and high EC (747, 614 µs/cm) and TDS (374, 304 mg/L), with eutrophication conditions (Figure 6), as well as permanent anthropogenic activity with wastewater discharges, sand, and gravel extraction (Figure 6), were found in quadrant QIV. The family assemblages that stood out are SVL and Simuliidae, Baetidae, Leptophlebiidae (SBLp) in the dry periods of 2022 and 2023, respectively.
Quadrant QIV, the families with the highest presence at the lowest pH (7.7, 7.6) and DO (3.75, 3.46 mg/L) levels were found in eutrophication channel conditions, crop, and pedestrian influence with rocks (Figure 5), as well as conditions of permanent anthropic activity with wastewater discharges and cattle watering places (Figure 6). Among these assemblages, Baetidae, Corixidae, Hydrophilidae (BCH) and Veliidae, Hydropsychidae, Leptophlebiidae (VHyLp) were highlighted in the dry seasons of 2022 and 2023, respectively. Likewise, in this same quadrant, the Corixidae family (C) was located at low DO levels (4.27 mg/L) in dry 2023, associated with conditions with eutrophication and the presence of cress crop invasion in the stream bed in areas associated with cultivation and wastewater discharges (Table 1, Figure 5 and Figure 6).

4. Discussion

The implementation of fordable monitoring methods for the evaluation of water quality in lotic ecosystems is an important issue for the inhabitants of the localities in this and other regions, specifically in neotropical rivers in the mountain region of the State of Guerrero, Mexico. The Tlapaneco River provides ecosystemic services for daily activities, from domestic and recreational use to irrigation of corn crops (the main economic activity). This river, like many others, both in urban and rural areas, is affected by wastewater discharges, waste, and agricultural activities [27].
It is important to mention that for this region, the findings represent a reference point for future studies in the evaluation of water quality through biomonitoring, with community participation in this activity.

4.1. Anthropic Influence and the Relationship of Macroinvertebrates Are Present in the Study Area

In general, in the dry and rainy seasons, the Hydropsychidae family was present in most of the stations, related to moderate to strong sewage discharges [28]; this influence is permanently present in the study area in all the collection stations during the two seasons (Table 1 and Table 2, Figure 6).
However, when the BMWP-CR biotic index indicated regular water quality, the macroinvertebrate family assemblages present were Leptohyphidae, Chironomidae, Hydropsychidae, Leptophlebiidae, and Baetidae, which are tolerant to contamination [29]; this coincides with what has been reported by other authors [28,30] in areas with wastewater discharges, similar to our study. However, the Simuliidae family (SS9) was present under eutrophication conditions in areas of wastewater discharges, associated with the collection sites of sand and gravel extraction and cultivation sites (Table 1, Figure 2, Figure 3, Figure 5 and Figure 6), in addition to bedrock. In that sense, study [29] points out that simulids are in shallow areas of slow to strong currents and use rocks as substrates to which they adhere; it should be noted that this group is found in degraded environments with sewage [31]. It is noteworthy that in our study, families that were also present were Veliidae, Corixidae, Hydrophilidae, Lestidae, and Ephemerellidae, of which we did not find such records from other authors in terms of this water quality.
With respect to regular water quality, the seasonality and conditions of the water body are similar to those reported by [28,30,32], who pointed out that this quality was reflected in sites with wastewater discharges from urban areas and small localities, contrary to the environmental conditions found in this study (Table 1, Figure 2, Figure 3, Figure 5 and Figure 6).
On the other hand, other authors have reported families Chironomidae and Leptophlebiidae, when the quality is poor, in sites with wastewater discharges [28]; similar to this study, however, the families Veliidae, Corixidae, Hydropsychidae, Leptohyphidae, Hydrophilidae, Baetidae, and Simuliidae were present, which are tolerant to contamination [29,31] and indicators of poor quality based on the BMWP-CR [33]. This finding is similar to that reported by [28,32,34,35], who pointed out that this quality was reflected in sites with wastewater discharges from urban areas, anthropogenic activities, deforestation in riparian corridors, erosion, sedimentation, changes in channel morphology, use of agricultural pollutants, as well as in areas where corn is grown; the above reflects the general panorama prevailing in the study area (Table 1, Figure 2, Figure 3, Figure 5 and Figure 6).
In this study, the Chironomidae family was found in regular and poor water quality; reference [35] points out that it is predominant in urban and agricultural areas. However, when water quality was very poor, for example, in areas different from our neotropical region, authors such as [36] found the families Chironomidae and Baetidae in channeled water bodies with concrete and without vegetation. However, this study reveals that solely the family Corixidae (SS7) was present in dry season 2023, where the channel conditions presented wastewater discharges, eutrophication, watercress cultivation that covered the entire sampling site (Table 1, Figure 2, Figure 3, Figure 5 and Figure 6), as well with areas without riparian vegetation and clayey sediment; on the other hand, the location of this family was associated with roots. In that sense, the Corixidae family prefers areas of slow-flowing, shallow lentic waters, with free surface and little submerged vegetation [37], a similar environment provided by the Corixidae family, similar to that provided by the cress crop. In addition, this family is tolerant to pollution and can live in environments with low oxygen [31]; in SS7, it presented 4.27 mg/L of DO; therefore, we attribute that this family is cosmopolitan because it can be found in neotropical and Andean areas, which places it in a wide parameter of environmental conditions.
Our results have shown that in the rainy season in the nine sampling sites from the studied area, the most abundant orders were Ephemeroptera and Trichoptera, and the families Hydropsychidae and Baetidae were the most representative (Figure 2, Figure 5 and Figure 6), in conditions along the channel: No crosswalk, eutrophication, scattered rocks, bridge with rocks and concrete debris (Table 1, Figure 5), in addition to sewage discharges, farms, domestic use, recreation areas, cattle watering troughs, and sand and gravel extraction (Table 1, Figure 6). Therefore, the presence of Hydropsychidae is attributed to their ability to build fine nets that allow them to build shelters fixed in the current, and thus filter the water to obtain food; they are usually found in areas of moderate to strong currents where they filter organic matter in suspension; they can also be crawling, grasping, swimming, and burrowing larvae that use fragments of heavy materials to avoid being dragged by the current [38]. On the other hand, family Baetidae members have modified bodies for swimming and crawling, and well-developed claws on the legs, which allow them to hold on in very fast currents [39]. These two families are tolerant to pollution [29,38,39].

4.2. Physicochemical Parameters

In the stretch of the Tlapaneco River in the dry season of 2022, the average temperature was 25.86 °C, with a range of 24.3 to 28.9 °C (Table 4); these values are similar to those recorded in two rivers of the Ecuadorian Amazon with an averages of 23.9 °C (range of 23.5 to 24.5 °C) and 25 °C (range of 23 to 28 °C), respectively [28,35]. In relation to the 2023 dry season in the Tlapaneco River, the average was 22.91 °C, with oscillations between 18.7 and 26.5 °C (Table 4). These values are like those reported in another river in Ecuador (average 21.7 °C, range 19–24.2 °C) [40], as well as that reported in the Cupatitzio River in Mexico (average 20.77 °C). However, in the Tlapaneco River, the temperature was 18.4 °C, ranging from 13.0 to 20.8 °C (Table 4). These values are like those reported for the Cupatitzio River in Mexico (average 18.39 °C) [6]. The spatial contrast between Ecuador and Mexico allowed us to observe the variability in temperatures in the neotropical region, an essential factor for the growth and distribution of invertebrates.
The average pH values in the Tlapaneco River reach (Table 4) in the dry seasons of 2022 and 2023 were 8.37 and 8.62, respectively. These values are like those obtained in a river in Ecuador (average pH 8.2, range 8–8.5) where there is the presence of wastewater discharges [40], as well as in the Cupatitzio River in Mexico (average 7.36) where there is the presence of urban areas, livestock, rainfed and irrigated agriculture, and wastewater discharge [6]. However, the average pH in rainfall (Table 4) in the Tlapaneco River was 8.42. These values are like those recorded in the Ecuadorian coastal region (average 8.69), where there is a presence of crops and urban areas [41], as well as in the Cupatitzio river in Mexico (average 7.64) [6]. In general, the pH in the studied section was around 8, like that found in natural areas [35]; thus, this study reflects appropriate values in the dry seasons of 2022 and 2023 (7.6 to 9.5) according to NOM-001-SEMARNMAT-2021; the appropriate pH in Mexico is in a range of 6 to 9, and conversely 8.1 to 8.7 in the rainy season. Furthermore, environmental Mexican laws are generalized for all of the Mexican territory and frequently not regionalized to specific environments in several areas of Mexico [42].
With respect to dissolved oxygen, when levels are below 4 to 5 mg/L, fish and macroinvertebrate reproduction is disproportionate because this element affects the organism’s metabolism and development [43]. The average DO in the dry 2022 reach of the Tlapaneco River was 6.47 mg/L (3.75 to 9.52 mg/L) (Table 4). This average was like that reported in Ecuador in the northern coastal region (determined value 6.00 mg/L) associated with agricultural lands [44]. In dry season 2023 in our study area, the average was 8.51 mg/L (3.46 to 12.10 mg/L) (Table 4), values like those obtained in another river in Ecuador in the dry season (average 8.4, range 8.1–9.3 mg/L) [40], and averages (8.65 mg/L) have also been recorded in Mexico [6].
On the other hand, in relation to the minimum dissolved oxygen values reported in our study, 3.75 and 3.46 mg/L (SS8) in both dry seasons (Table 4) are like those recorded in the Ecuadorian Amazon (average 4.38 mg/L) [28] and in Mexico (average 3.54 mg/L) [5], in both of which there is the presence of wastewater discharges.
However, the maximum DO values recorded in our study, 9.52 mg/L (SS7) and 12.10 mg/L (SS5) in dry seasons 2022 and 2023, respectively (Table 4), are similar to those reported in Colombia (average 8.9 mg/L) where there is good penetration of sunlight, riverbed with rapids and backwaters, presence of rocks, and discharge of residual water from fish ponds [45]; our study area is a recipient of wastewater from urban and agricultural areas. In that sense, these stations have good sunlight penetration (SS7 dry 2022) and presence of rapids and scattered rocks (SS5 dry 2023). As in Ecuador, in the north coast region in the same season (determined value 9.08 mg/L) [44] has the same conditions that the stations in the study area have (Table 1). However, the average rainfall DO in the Tlapaneco River was 7.69 mg/L, (7.12 to 8.44 mg/L) (Table 4). These values are like those reported in Colombia (average 7.9 mg/L, range 7.8–8 mg/L).
The average EC of the water in the Tlapaneco River reach in dry 2022 was 382 µs/cm (Table 4); this is like that reported in a stream in the Ecuadorian coastal region (average 361.56 µs/cm), with the presence of crops, urban area, as well as the lithological composition of limestone, red sandstone, and limonite, in which carbonates predominate [41]; these exist in the study area due to the presence of sandstone conglomerate and limestone [17].
In relation to the dry season of 2023 in the Tlapaneco River, the average was 332.89 µs/cm (Table 4). This value is like those obtained for Mexico (determined value of 332 µs/cm) where, in addition to the presence of wastewater discharges, there is also clay and silt substrate and an irrigation channel through which most of the water resources are captured for irrigation of agricultural areas (corn, beans, onions, squash) [5], as well as in the northern coastal region of Ecuador (determined value 284 µs/cm) [44]. However, the average conductivity in rainfall in the Tlapaneco River was 223.78 µs/cm (Table 4), a value like that reported in the Ecuadorian coastal region (average 216.38 µs/cm) [41], as well as in the Cupatitzio River in Mexico (average 218.10 µs/cm) [6].
The average total dissolved solids (TDS) in the study reach in dry 2022 and 2023 were 191 and 166.44 mg/L, respectively (Table 4). These averages are like that reported in Mexico (determined value of 183.75 mg/L) [5]. However, in the Tlapaneco River, the average rainfall was 112.11 mg/L (Table 4), a value like that recorded in southern Brazil in the northern region of Paraná (average of 112 mg/L) where there is a large urban area, agriculture, pasture, and little natural cover [46].

5. Conclusions

The water quality in the section of the Tlapaneco River is influenced by wastewater discharges, agricultural activity, and other anthropogenic activities, and is fair to very poor, which is attributed to the presence of watercress crops and watering places in the riparian areas of this lotic ecosystem.
Variations in water quality at the sampling points are mainly influenced by stream conditions. According to the macroinvertebrate assemblages, the quality was acceptable when Leptohyphidae, Chironomidae, Hydropsychidae, Leptophlebiidae, Baetidae, Simuliidae, Veliidae, Corixidae, Hydrophilidae, Lestidae, and Ephemerellidae were present; poor when Chironomidae, Leptophlebiidae, Veliidae, Corixidae, Hydropsychidae, Leptohyphidae, Hydrophilidae, Baetidae, and Simuliidae were present; and very poor when Corixidae was present.
A biomonitoring program with aquatic macroinvertebrates allows early identification of changes in the water sources on which their livelihoods depend and the implementation of appropriate conservation measures. By establishing community groups to assess water quality using macroinvertebrates and monitoring the pollutants that reach the ecosystem, restrictive and control measures can be implemented to avoid continuous impacts to this water resource from urban discharges and agricultural activities, especially recreational and domestic use, as well as actions managed before regional and national environmental authorities, for the conservation of the resource; monitoring the macroinvertebrates in the Tlapaneco River basin is also important to increase knowledge of parameters such as BOD5, fats and oils, and total coliforms, among others.
The importance of aquatic macroinvertebrates in the locality, together with their surprising appearance, behavior, and biological significance, make these organisms very attractive for the development of environmental awareness and social innovation initiatives that promote the participation and empowerment of the indigenous and non-indigenous populations that inhabit the area, improving the quality of life of these communities. It is hoped that this research will serve as a diagnostic tool for local communities to evaluate the water resource, with the inclusion of aquatic macroinvertebrates as key organisms for their conservation.
A key aspect for the sustainable success of community participation is the continuous engagement of and with local communities. Therefore, it is crucial to implement a robust community engagement plan that includes ongoing support and facilitation of participatory workshops. These spaces will allow for the co-creation of strategies that reflect the needs, expectations, and concerns of traditional communities. Feedback from these meetings will be critical for tailoring initiatives to local realities. Such programs will improve their capacity to manage community education initiatives in an autonomous and effective manner that not only benefit communities economically, but also contribute to biodiversity conservation, promote cultural appreciation, and encourage long-term community leadership.
Community participation is important for the conservation and maintenance of the ecosystem services provided by the water resources. In the current conditions, it was determined through biomonitoring that water quality is deteriorating, and the population is unaware of this and uses it for recreational purposes, domestic activities, as well as agriculture.

Author Contributions

Conceptualization, A.P.-T. and J.L.R.-A.; methodology, J.L.R.-A. and A.P.-T.; software, M.G.-M.; validation, J.L.R.-A., A.P.-T. and M.G.-M.; formal analysis, A.P.-T., M.G.-M. and J.L.R.-A.; investigation, A.P.-T. and J.L.R.-A.; resources, J.L.R.-A.; data curation, A.P.-T., J.L.R.-A. and M.G.-M.; writing—original draft preparation, A.P.-T. and J.L.R.-A.; writing—review and editing, J.L.R.-A., A.P.-T. and M.G.-M.; visualization, A.P.-T., J.L.R.-A., M.G.-M., J.A.S.-N., R.B.-S. and K.R.A.-S.; supervision, J.L.R.-A. and M.G.-M.; project administration, J.L.R.-A. and A.P.-T. All authors have read and agreed to the published version of the manuscript.

Funding

This research was funded by SECIHTI, Mexico, through a graduate scholarship received by the first author (grant 776173).

Data Availability Statement

All data presented in this research are contained in the article.

Acknowledgments

The authors would like to thank the “Common Property Authorities” and the Municipal Council of Copanatoyac for their support during the research. Also, thanks to the teacher Pedro Marcelino Pantiga Perez and the students of the program DELFIN-SECIHTI, México: Montse Campusano and Armando Rojas for their collaboration during the collections at the sampling sites and taxa identification at CCDR-UAGro, Biomonitoring Laboratory in charge of J.L.R-A. Anonymous reviewers made valuable comments to improve the early version of the manuscript.

Conflicts of Interest

The authors declare no conflicts of interest.

References

  1. Garcia, X.; Pargament, D. Rehabilitating rivers and enhancing ecosystem services in a water-scarcity context: The Yarqon River. Int. J. Water Resour. Dev. 2015, 31, 73–87. [Google Scholar] [CrossRef]
  2. Rincón-Bello, M.T.; Soler-Romero, F.Y.; Calderón-Rivera, D.S.; Sierra-Parada, R.J.; Jaramillo-Londoño, A.M. Macroinvertebrados acuáticos como bioindicadores de calidad de agua en el río Chicú, Cundinamarca, Colombia. Hidrobiológica 2021, 31, 17–29. [Google Scholar] [CrossRef]
  3. Orozco-González, C.E.; Ocasio-Torres, M.E. Aquatic Macroinvertebrates as Bioindicators of Water Quality: A Study of an Ecosystem Regulation Service in a Tropical River. Ecologies 2023, 4, 209–228. [Google Scholar] [CrossRef]
  4. Odum, E.P. Ecología; Nueva Editorial Interamericana: Mexico City, Mexico, 1972. [Google Scholar]
  5. Gudiño-Sosa, L.F.; Moncayo-Estrada, R.; Velázquez-Machuca, M.A.; Cruz-Cárdenas, G.; Ávila-Meléndez, L.A.; Pimentel-Equihua, J.L. Biotic Integrity, Water Quality, and Landscape Characteristics of a Subtropical River. Water 2023, 15, 1748. [Google Scholar] [CrossRef]
  6. Gudiño-Sosa, L.F.; Escalera-Gallardo, C.; Cruz-Cárdenas, G.; Moncayo-Estrada, R.; Silvia-García, J.T.; Flores-Magallón, R.; Damián-Arroyo, M.; Chávez-Tinoco, M.A. Evaluación de la calidad del agua en un río subtropical y tributarios utilizando índices fisicoquímicos y macroinvertebrados acuáticos. Hidrobiológica 2022, 32, 33–50. [Google Scholar] [CrossRef]
  7. Ruiz-Picos, R.A.; Kohlmann, B.; Sedeño-Díaz, J.E.; López-López, E. Assessing ecological impairments in Neotropical rivers of Mexico: Calibration and validation of the Biomonitoring Working Party Index. Int. J. Environ. Sci. Technol. 2017, 14, 1835–1852. [Google Scholar] [CrossRef]
  8. UNESCO. Informe Mundial de las Naciones Unidas Sobre el Desarrollo de los Recursos Hídricos 2023. Alianzas y Cooperación por el Agua. Datos, cifras y Ejemplos de Acción. Available online: https://www.pseau.org/outils/ouvrages/un_water_unesco_informe_mundial_de_las_naciones_unidas_sobre_el_desarrollo_de_los_recursos_hidricos_2023_alianzas_y_cooperacion_por_el_agua_datos_cifras_y_ejemplos_de_accion_2023.pdf (accessed on 3 February 2024).
  9. UNESCO. Informe Mundial de las Naciones Unidas Sobre el Desarrollo de los Recursos Hídricos 2023. Alianzas y Cooperación por el Agua. Available online: https://aneas.com.mx/wp-content/pdf/documentos-internacionales/05-un-wwdr-2023-spanish_web-version.pdf (accessed on 3 February 2024).
  10. CDP. Treading Water. Corporate Responses to Rising Water Challenges. Available online: https://cdn.cdp.net/cdp-production/cms/reports/documents/000/004/232/original/CDP_Global_Water_Report_2018.pdf?1554392583 (accessed on 5 February 2024).
  11. Flörke, M.; Schneider, C.; McDonald, R.I. Water competition between cities and agriculture driven by climate change and urban growth. Nat. Sustain. 2018, 1, 51–58. [Google Scholar] [CrossRef]
  12. Martínez-Austria, P.F. Los retos de la seguridad hídrica. Tecnol. Cienc. Agua 2013, 4, 165–180. [Google Scholar]
  13. CESOP. En Contexto: Los Ríos Revueltos, Radiografía de la Contaminación. Available online: http://www5.diputados.gob.mx/index.php/camara/Centros-de-Estudio/CESOP/Novedades/En-contexto.-Los-rios-revueltos-radiografia-de-la-contaminacion (accessed on 8 February 2024).
  14. CONAPO. Informe Anual Sobre la Situación de Pobreza y Rezago Social 2023. Guerrero. Available online: https://www.gob.mx/cms/uploads/attachment/file/793094/12020-Copanatoyac23.pdf (accessed on 10 February 2024).
  15. Rodríguez, A.L.; López, R.; Bautista, S. Culturas adaptativas en la cuenca del río Tlapaneco, Guerrero, México. Tlamati 2015, 6, 51–54. [Google Scholar]
  16. Jaramillo-Villanueva, J.L.; Galindo-de-Jesús, G.; Bustamante-González, Á.; Cervantes-Vargas, J. Valoración económica del agua del río Tlapaneco en la “Montaña de Guerrero”, México. Trop. Subtrop. Agroecosystems 2013, 16, 363–376. [Google Scholar] [CrossRef]
  17. INEGI. Compendio de Información Geográfica Municipal 2010. Available online: https://www.inegi.org.mx/contenidos/app/mexicocifras/datos_geograficos/12/12020.pdf (accessed on 7 February 2024).
  18. CONAGUA. Normales Climatológicas por Estado. Base de Datos Climatológica Nacional. Available online: https://smn.conagua.gob.mx/es/climatologia/informacion-climatologica/normales-climatologicas-por-estado (accessed on 15 February 2024).
  19. Mafla, M. Guía para Evaluaciones Ecológicas Rápidas con Indicadores Biológicos en Ríos de Tamaño Mediano Talamanca-Costa Rica; Centro Agronómico Tropical de Investigación y Enseñanza, CATIE: Turrialba, Costa Rica, 2005. [Google Scholar]
  20. Merritt, R.W.; Cummins, K.W.; Berg, M.B. An Introduction to the Aquatic Insects of North America; Kendall/Hunt: Dubuque, IA, USA, 2008. [Google Scholar]
  21. Gutiérrez Fonseca, P.E.; Alonso-Rodríguez, A.M. Guía Fotográfica de Familias de Macroinvertebrados Acuáticos de Puerto Rico. Available online: https://www.researchgate.net/publication/295854904_Guia_fotografica_de_familias_de_macroinvertebrados_acuaticos_de_Puerto_Rico (accessed on 23 August 2024).
  22. Box, G.E.P.; Cox, D.R. An Analysis of Transformations. J. R. Stat. Soc. Ser. B Metholodogical 1964, 26, 211–243. [Google Scholar] [CrossRef]
  23. Bartlett, M.S. Properties of Sufficiency and Statistical Tests. Proc. R. Soc. London Ser. A Math. Phys. Sci. 1937, 160, 268–282. [Google Scholar]
  24. Conover, W.J. Practical Nonparametric Statistics; John Wiley & Sons, Inc.: Hoboken, NJ, USA, 1999. [Google Scholar]
  25. Royston, P. Remark AS R94: A remark on algorithm AS 181: The W-test for normality. J. R. Stat. Society. Ser. C Appl. Stat. 1995, 44, 547–551. [Google Scholar] [CrossRef]
  26. Mavrou, I. Análisis factorial exploratorio: Cuestiones conceptuales y metodológicas. Nebrija Lingüística Apl. Enseñanza Leng. 2015, 19, 71–80. [Google Scholar] [CrossRef]
  27. Bustamante-González, A.; Galindo-De Jesús, G.; Jaramillo-Villanueva, J.L.; Vargas-López, S. Percepción de la contaminación del río Tlapaneco por la población ribereña. Agric. Soc. Desarro. 2016, 13, 47–62. [Google Scholar] [CrossRef]
  28. Vargas-Tierras, T.; Suárez-Cedillo, S.; Morales-León, V.; Vargas-Tierras, Y.; Tinoco-Jaramillo, L.; Viera-Arroyo, W.; Vásquez-Castillo, W. Ecological River Water Quality Based on Macroinvertebrates Present in the Ecuadorian Amazon. Sustainability 2023, 15, 5790. [Google Scholar] [CrossRef]
  29. Oscoz, J.; Galicia, D.; Miranda, R. Identification Guide of Freshwater Macroinvertebrates of Spain; Springer: Berlin/Heidelberg, Germany, 2011. [Google Scholar]
  30. Rodríguez, L.; Ríos, P.; Espinosa, M.; Cedeño, P.; Jiménez, G. Caracterización de la calidad de agua mediante macroinvertebrados bentónicos en el río Puyo, en la Amazonía Ecuatoriana. Hidrobiológica 2016, 26, 497–507. [Google Scholar] [CrossRef]
  31. Thakur, Y.; Grover, A.; Sinha, R. Differential distribution of macroinvertebrate associated with water quality. World Water Policy 2023, 9, 84–112. [Google Scholar] [CrossRef]
  32. Cabrera, S.; Forio, M.A.E.; Lock, K.; Vandenbroucke, M.; Oña, T.; Gualoto, M.; Goethals, P.L.M.; Van der heyden, C. Variations in Benthic Macroinvertebrate Communities and Biological Quality in the Aguarico and Coca River Basins in the Ecuadorian Amazon. Water 2021, 13, 1692. [Google Scholar] [CrossRef]
  33. Enger, E.D.; Smith, B.F. Ciencia Ambiental. Un Estudio de Interrelaciones; The McGraw-Hill Companies, Inc.: Chicago, IL, USA, 2006. [Google Scholar]
  34. Echeverría-Sáenz, S.; Ugalde-Salazar, R.; Guevara-Mora, M.; Quesada-Alvarado, F.; Ruepert, C. Ecological Integrity Impairment and Habitat Fragmentation for Neotropical Macroinvertebrate Communities in an Agricultural Stream. Toxics 2022, 10, 346. [Google Scholar] [CrossRef]
  35. Cabrera, M.; Capparelli, M.V.; Nacato-Ch, C.; Moulatlet, G.M.; Lopez-Heras, I.; Diaz, M.; Alvear-S, D.; Rico, A. Effects of intensive agriculture and urbanization on water quality and pesticide risks in freshwater ecosystems of the Ecuadorian Amazon. Chemosphere 2023, 337, 139286. [Google Scholar] [CrossRef]
  36. Cabrera-Garcia, S.; Goethals, P.L.M.; Lock, K.; Domínguez-Granda, L.; Villacís, M.; Galárraga-Sánchez, R.; Van der Heyden, C.; Forio, M.A.E. Taxonomic and Feeding Trait-Based Analysis of Macroinvertebrates in the Antisana River Basin (Ecuadorian Andean Region). Biology 2023, 12, 1386. [Google Scholar] [CrossRef] [PubMed]
  37. Coayla-Peñaloza, P.; Cheneaux-Díaz, A.A.; Moreno-Salazar, C.V.; Cruz-Remache, C.E.; Colque-Rondón, E.W.; Damborenea, C. Benthic macroinvertebrate communities and water quality assessment in high Andean wetlands Callali-Oscollo, Arequipa-Cusco, Peru. Rev. Mex. Biodivers. 2023, 94, e944206. [Google Scholar] [CrossRef]
  38. Quesada-Alvarado, F.; Umaña, G.; Springer, M.; Picado, J. Variación estacional y características fisicoquímicas e hidrológicas que influyen en los macroinvertebrados acuáticos, en un río tropical. Biol. Trop. 2020, 68, 54–67. [Google Scholar] [CrossRef]
  39. Flowers, R.W.; De la Rosa, C. Capítulo 4. Ephemeroptera. Rev. Biol. Trop. 2010, 58, 63–93. [Google Scholar]
  40. Damanik-Ambarita, M.N.; Lock, K.; Boets, P.; Everaert, G.; Nguyen, T.H.T.; Forio, M.A.E.; Musonge, P.L.S.; Suhareva, N.; Bennetsen, E.; Landuyt, D.; et al. Ecological water quality analysis of the Guayas river basin (Ecuador) based on macroinvertebrates indices. Limnologica 2016, 57, 27–59. [Google Scholar] [CrossRef]
  41. Lafuente, W.; Carpio, A.J.; Alcácer, C.; Moreno, J.L. Spatio-temporal variability of physicochemical conditions in the headwaters of neotropical streams. J. South Am. Earth Sci. 2023, 126, 104361. [Google Scholar] [CrossRef]
  42. Jaime, S.; Cervantes-Martínez, A.; Gutiérrez-Aguirre, M.A.; Hernández-Flores, G.; González-Herrera, R.A.; Sánchez-Rivera, G.; Enseñat-Soberanis, F.; Delgado-Blas, V.H. Toward an Integrative Overview of Stygobiotic Crustaceans for Aquifer Delimitation in the Yucatan Peninsula, Mexico. Diversity 2025, 17, 77. [Google Scholar] [CrossRef]
  43. Mihelcic, J.R.; Zimmerman, J.B. Ingeniería Ambiental: Fundamentos, Sustentabilidad, Diseño; Editorial Alfaomega: Mexico City, Mexico, 2012. [Google Scholar]
  44. Molinero, J.; Barrado, M.; Guijarro, M.; Ortiz, M.; Carnicer, O.; Zuazagoitia, D. The Teaone River: A snapshot of a tropical river from the coastal region of Ecuador. Limnetica 2019, 38, 587–605. [Google Scholar] [CrossRef]
  45. Contreras, J.; Roldán, G.; Arango, A.; Álvarez, L.F. Evaluación de la calidad del agua de las microcuencas La Laucha, La Lejía y La Rastrojera utilizando los macroinvertebrados como bioindicadores, Municipio de Durania, Departamento Norte de Santander, Colombia. Rev. Acad. Colomb. Cienc. Exactas Físicas Nat. 2008, 32, 171–194. [Google Scholar] [CrossRef]
  46. Contieri, B.B.; Rosa, J.; Scoarize, M.M.R.; Urbano, V.A.; Benedito, E. Anthropogenic land uses lead to changes in limnological variables in Neotropical streams. Environ. Monit. Assess. 2024, 196, 702. [Google Scholar] [CrossRef] [PubMed]
Figure 1. (a) Location of the study area. (b) Geographical location of the sampling sites (runoff runs from south to north): SS1, SS2, SS3 (upper part), SS4, SS5, SS6 (middle part), SS7, SS8, SS9 (lower part) of the Tlapaneco River reach.
Environments 12 00091 g001
Figure 2. Macroinvertebrates in the sampling sites (dry and rainy season) in the studied section of the Tlapaneco River, Guerrero, Mexico.
Environments 12 00091 g002
Figure 3. (a) BMWP-CR biotic index scores in the nine stations: high, medium, and low zones in dry season 2022, rainy season 2022, and dry season 2023. (b) Average biotic index scores of the BMWP-CR in the high, medium, and low seasons in the dry season of 2022, the rainy season of 2022, and the dry season of 2023.
Environments 12 00091 g003
Figure 4. Map showing the water quality at the sampling stations according to season. Acceptable (poor water quality, polluted), poor (poor water quality, very polluted), and very poor (very poor water quality, extremely polluted).
Environments 12 00091 g004
Figure 5. Principal component analysis explaining 77.06% of the total variability of the sample, with the first two linear combinations. Relationships of families with channel conditions and season. The assemblages of the families present are VChHy = Veliidae, Chironomidae, Hydropsychidae; VCCh = Veliidae, Corixidae, Chironomidae; VHyL = Veliidae, Hydropsychidae; Leptohyphidae; CBCh = Corixidae, Baetidae, Chironomidae; ChVH = Chironomidae, Veliidae, Hidrophilidae; BCH = Baetidae, Corixidae, Hydrophilidae; SVL = Simuliidae, Veliidae, Leptohyphidae; HyBS = Hydropsychidae, Baetidae, Simuliidae; HyBLp = Hydropsychidae, Baetidae, Leptophlebiidae; VHyB = Veliidae, Hydropsychidae, Baetidae; HyBCh = Hydropsychidae, Baetidae, Chironomidae; BLpCh = Baetidae, Leptophlebiidae, Chironomidae; BVHy = Baetidae, Veliidae, Hydropsychidae; LChHy = Leptohyphidae, Chironomidae, Hydropsychidae; CVL = Corixidae, Veliidae, Leptohyphidae; VHyE = Veliidae, Hydropsychidae, Ephemerellidae; LsLCh = Lestidae, Leptohyphidae, Chironomidae; CHyLp = Corixidae, Hydropsychidae, Leptophlebiidae; C = Corixidae; VHyLp = Veliidae, Hydropsychidae, Leptophlebiidae; SBLp = Simuliidae, Baetidae, Leptophlebiidae.
Environments 12 00091 g005
Figure 6. Principal component analysis explaining 77.06% of the total variability of the sample, with the first two linear combinations. Relationships of families with permanent and seasonal anthropogenic activities. The assemblages of the families present are VChHy = Veliidae, Chironomidae, Hydropsychidae; VCCh = Veliidae, Corixidae, Chironomidae; VHyL = Veliidae, Hydropsychidae; Leptohyphidae; CBCh = Corixidae, Baetidae, Chironomidae; ChVH = Chironomidae, Veliidae, Hidrophilidae; BCH = Baetidae, Corixidae, Hydrophilidae; SVL = Simuliidae, Veliidae, Leptohyphidae; HyBS = Hydropsychidae, Baetidae, Simuliidae; HyBLp = Hydropsychidae, Baetidae, Leptophlebiidae; VHyB = Veliidae, Hydropsychidae, Baetidae; HyBCh = Hydropsychidae, Baetidae, Chironomidae; BLpCh = Baetidae, Leptophlebiidae, Chironomidae; BVHy = Baetidae, Veliidae, Hydropsychidae; LChHy = Leptohyphidae, Chironomidae, Hydropsychidae; CVL = Corixidae, Veliidae, Leptohyphidae; VHyE = Veliidae, Hydropsychidae, Ephemerellidae; LsLCh = Lestidae, Leptohyphidae, Chironomidae; CHyLp = Corixidae, Hydropsychidae, Leptophlebiidae; C = Corixidae; VHyLp = Veliidae, Hydropsychidae, Leptophlebiidae; SBLp = Simuliidae, Baetidae, Leptophlebiidae.
Environments 12 00091 g006
Table 1. Generic description of the study area in the section of the Tlapaneco River, Guerreo, Mexico.
Sampling Sites Permanent Anthropic Activity Dry Season
2022
Rainy Season 2022Dry Season 2023
SS1Sewage discharge, farm, domestic use, leaving the urban Patlicha area, crops areaPedestrian crossingNo pedestrian crossingPedestrian with rocks
SS2Sewage discharge, crops areaEutrophication, partial crops in the riverbedEutrophicationEutrophication
SS3Sewage discharge, crops areaEutrophication, crops influenceEutrophicationEutrophication
SS4Sewage discharge, recreational, entrance to the Copanatoyac urban area, crops areaRockfill dam Scattered rocksScattered rocks
SS5Sewage discharge, domestic use, center of the Copanatoyac urban area, crops areaRock borderScattered rocks, anthropogenic siltingScattered rocks, concrete remains
SS6Sewage discharge, recreational, leaving the urban Copanatoyac area, crops areaEutrophication Riparian zone cultivationEutrophication, bridge with rocks and concrete remains Eutrophication, bridge with rocks and concrete remains
SS7Sewage discharge, crops areaEutrophication, partial crops in the riverbedEutrophicationEutrophication, total cultivation in the riverbed
SS8Sewage discharge, livestock watering place, crops areaEutrophication, crops influence, pedestrian crossing with rocksEutrophicationEutrophication, crops influence, pedestrian crossing with rocks
SS9Sewage discharge, sand and gravel extraction, crops areaEutrophicationEutrophicationEutrophication
Crops areas located in permanent anthropic activity are located on the riverbanks; these correspond to irrigated and rainfed corn crops; irrigated crops are sown in January and harvested in May, rainfed crops are sown in June and harvested in October; however, in the remaining months, other crops such as cilantro, radishes, papaloquelite, lucerne, garlic, and purple onion are sown and harvested. In both seasons, watercress grows in the riparian zone and invades the water body. Garbage is also burned along the riverbanks.
Table 2. Analysis of variance of the BMWP index with seasonality and zone.
SourceDfSum SqMean SqF Valuep-Value
Season2425.852212.9261.1920.326
Zone211.6305.8150.0330.968
Season: Zone4240.81560.2040.3370.849
Residuals183215.333178.630
Table 3. Comparison of the means of physicochemical variances in three collections during two seasons.
VariablenTest StatisticDry 2022Dry 2023Rainy 2022
Temperature9T = 3.53225.86 ± 2.81 (a)22.91 ± 2.52 (b)18.4 ± 2.32 (c)
pH9KW = 1.2268.37 ± 0.29 (a)8.62 ± 0.64 (a)8.42 ± 0.18 (a)
EC9KW = 12.710382 ± 145.99 (a)332.89 ± 127.02 (a)223.78 ± 44.38 (b)
TDS9KW = 12.641191 ± 73.2 (a)166.44 ± 63.42 (a)112.11 ± 22.27 (b)
DO9KW = 4.4926.47 ± 1.7 (b)8.51 ± 3.17 (a)7.69 ± 0.42 (ab)
Groups with different letters have statistically significant differences at the 0.05 confidence level.
Table 4. Physicochemical values. Mean data and SD in the nine stations (SS1…SS9) of the Tlapaneco River section in the dry season of 2022, the rainy season of 2022, and the dry season of 2023.
VariablesSeasonSS1SS2SS3SS4SS5SS6SS7SS8SS9MeanSD
T °CDry 202227.8026.8024.3028.6027.1020.0024.1025.1028.9025.862.81
Rainy 202217.7019.3020.3020.8019.1018.8017.2019.4013.0018.402.32
Dry 202318.7020.0021.3023.3024.7026.5025.2023.5023.0022.912.52
pHDry 20228.338.358.438.638.528.378.597.668.448.370.29
Rainy 20228.508.508.308.408.308.108.608.408.708.420.18
Dry 20238.548.528.809.149.379.478.117.568.048.620.64
E.C (µs/cm)Dry 2022238316324334337348359435747382.00145.99
Rainy 2022144219217219221221224229320223.7844.38
Dry 2023222283292298290207336454614332.89127.02
TDS (mg/L)Dry 2022119158162167168174179218374191.0073.20
Rainy 202273110108109110110115113161112.1122.27
Dry 2023111142146148144103168232304166.4463.42
DO
(mg/L)
Dry 20225.777.507.405.485.076.289.523.757.506.471.70
Rainy 20227.737.937.637.437.327.128.147.438.447.690.42
Dry 20237.739.5610.7810.8812.1011.294.273.466.518.513.17
Table 5. Explained variances of the principal components (eigenvalues), percentages of explained variances of the components (% variations), percentages of accumulated variances of the PCs (Cum. % variations), and loading of the variables in the PCs (eigenvalues).
Principal ComponentsPC1PC2PC3PC4PC5
Eigenvalue2.001.851.040.110.00
% variation39.9737.0920.762.180.00
Cum. % variation39.9777.0697.82100.00100.00
VariablesEigenvalues
Temperature0.530.49−0.690.080.00
pH−0.660.72−0.05−0.22−0.00
EC0.880.380.28−0.02−0.01
TDS0.880.370.28−0.020.01
DO−0.680.650.260.210.00
Disclaimer/Publisher’s Note: The statements, opinions and data contained in all publications are solely those of the individual author(s) and contributor(s) and not of MDPI and/or the editor(s). MDPI and/or the editor(s) disclaim responsibility for any injury to people or property resulting from any ideas, methods, instructions or products referred to in the content.

