Article

Integrating Nature-Based Solutions into Circular Economy Practices: A Case Study on Achieving Net-Zero Emissions at the Asian Institute of Technology

1
Natural Resources Management, Asian Institute of Technology, P.O. Box 4, Khlong Luang, Pathumthani 12120, Thailand
2
Center for Policy Research in Agriculture and Rural Development, Cambodia Development Resource Institute, P.O. Box 622, Tuol Kork, Phnom Penh 120508, Cambodia
3
Sasin School of Management, Chulalongkorn University, Bangkok 10330, Thailand
4
Faculty of Career Development, Kyoto Koka Women’s University, Kyoto 615-0882, Japan
5
Environmental Engineering Management, Asian Institute of Technology, P.O. Box 4, Khlong Luang, Pathumthani 12120, Thailand
*
Author to whom correspondence should be addressed.
Environments 2025, 12(3), 90; https://doi.org/10.3390/environments12030090
Submission received: 5 February 2025 / Revised: 1 March 2025 / Accepted: 11 March 2025 / Published: 14 March 2025
(This article belongs to the Special Issue Environments: 10 Years of Science Together)

Abstract

:
As global efforts to achieve net-zero emissions intensify, the role of nature-based solutions (NbSs) in mitigating climate change through circular economy practices is increasingly recognized. This study evaluates the potential of various NbS strategies at the Asian Institute of Technology (AIT) campus to contribute to ambitious net-zero targets by 2030. Our research systematically analyzes baseline carbon emissions, stocks, and removals associated with the following three NbS strategies: improved forest management (IFM), afforestation on available land, and biochar application for soil carbon sequestration. The campus’s baseline emissions were calculated at 8367 MgCO2e, with electricity consumption contributing 61% of total emissions. Our findings indicate that improved forest management can sequester 2476 MgCO2 annually, while afforestation strategies utilizing fast-growing species, bamboo species, and slow-growing species have the potential to remove 7586 MgCO2, 4711 MgCO2, and 2131 MgCO2 per year, respectively. In addition, biochar application across 70 hectares could result in cumulative carbon sequestration of 603 MgCO2 per hectare by 2050. While net-zero emissions may not be achieved by 2030 under retrospective and stable baselines, projections suggest it will be realized shortly thereafter, with Scenario 1—combining IFM, fast-growing species, and biochar—achieving net-zero by 2033.5. These findings highlight the critical role of tailored NbSs in enabling small institutions like the AIT to effectively contribute to global net-zero targets, provided that these strategies are implemented and scaled appropriately.

1. Introduction

Global warming presents an existential threat to our planet, largely propelled by carbon emissions from key sectors such as energy, industry, buildings, transport, and agriculture, forestry, and other land uses (AFOLU) as identified by the Intergovernmental Panel on Climate Change [1]. Responding to this crisis, global initiatives like the Paris Agreement aim to significantly reduce GHG emissions within the decade 2020–2030 [2]. Concurrent efforts include the UN’s Decade on Ecosystem Restoration and commitments at COP26 to halt deforestation and restore forests by 2030 [3,4]. Despite broad pledges, the challenge of achieving net-zero emissions remains particularly acute for small organizations in urban settings, where traditional large-scale emission reduction strategies may be impractical.
To achieve net-zero emissions, the following two principal strategies are commonly employed: technology-based solutions and NbSs [5]. Technology-based solutions include advanced technologies such as carbon capture, utilization, and storage (CCUS), which not only sequester CO2 emissions from industrial and power sources underground but also repurpose them for uses like enhanced oil recovery or chemical production. This category also encompasses next-generation renewable energy technologies, including solar panels, wind turbines, and hydroelectric systems, which serve as sustainable alternatives to fossil fuels and play a critical role in reducing greenhouse gas emissions. In parallel, NbSs leverage the inherent capacity of the natural environment to absorb carbon, employing forests, soils, wetlands, and oceans to sequester atmospheric CO2. These natural systems not only capture and store CO2 but also enhance biodiversity and stabilize ecosystems, offering a holistic approach to carbon sequestration [6,7]. Such strategies are increasingly utilized in urban settings, including educational campuses like the Asian Institute of Technology, where they contribute not only to achieving net-zero emissions but also to enhancing urban wellness and fostering a circular economy through the continuous use of natural resources in a sustainable cycle. The circular economy is a regenerative system designed to minimize waste, maximize resource efficiency, and extend product life cycles through practices such as reuse, recycling, and remanufacturing [8,9]. As a conceptual framework, it challenges the traditional linear economy model of “take–make–dispose” by promoting closed-loop systems that minimize resource input and waste output. In practice, circular economy strategies involve designing products for durability, implementing waste-to-resource pathways, and enhancing the recovery of materials [10].
Historically, global carbon research has concentrated on ecosystems located primarily in non-urban areas, such as natural forests and areas subjected to afforestation and reforestation [6,11]. However, the focus has increasingly shifted towards urban ecosystems in response to growing concerns over urban greenhouse gas emissions. This shift is evidenced by extensive studies aimed at quantifying the carbon footprint of urban environments, which seek to mitigate escalating urban emissions [12,13]. Research has particularly emphasized the role of urban green spaces, exploring their biodiversity and their significant potential to sequester carbon dioxide [14,15]. Furthermore, investigations into systematic design strategies for zero-carbon campuses and stakeholder perceptions of such initiatives highlight the progressive integration of sustainable practices into urban planning and development [16,17]. Despite these important advances, a gap persists in understanding how NbSs can be optimized within small organizations in urban areas to achieve net-zero emissions.
Closing this gap involves exploring the circular economy’s principles of reducing resource input, maximizing reuse, and enhancing recycling within these settings, ensuring that urban ecosystems contribute effectively to both environmental sustainability and economic circularity. For instance, in 2022, the AIT launched its Sustainability Plan, with ambitious objectives, including transforming its campus into a Botanical Garden aimed at achieving net-zero emissions by 2030. This initiative reflects the AIT’s commitment to sustainability, merging its verdant, tropical setting with its academic and research activities to foster a cohesive and sustainable educational environment. The layout for the Botanical Garden Campus is meticulously designed to integrate the campus’s natural assets into a coherent structure that not only aims for net-zero emissions but also supports the Bio-Circular Green Economy. This plan delineates distinct zones for academic pursuits, residential life, and public engagements, ensuring a balanced approach to campus sustainability and functionality [12,18]. This aligns well with government policy, as Thailand is actively pursuing climate action strategies to achieve carbon neutrality by 2050 and net-zero emissions by 2065, as outlined in its Long-Term Low Emission Development Strategy (LT-LEDS). The country has implemented several policy instruments, including renewable energy targets, carbon pricing mechanisms, and the promotion of NbSs to enhance carbon sequestration [19].
In the context of global sustainability, University Social Responsibility (USR) plays a pivotal role in promoting sustainable practices within educational institutions [20,21]. By integrating campus sustainability and environmental education, universities not only reduce their carbon footprints but also serve as catalysts for societal change. Educational institutions contribute to environmental awareness by fostering a culture of sustainability among students and staff [22]. This is particularly relevant for the Asian Institute of Technology, where environmental stewardship is integrated into its academic and operational strategies. The present study explores how the AIT leverages its sustainability plan to achieve net-zero emissions, thereby contributing to the broader goals of USR and environmental education.
The objective of this study is to evaluate and project the outcomes of implementing NbSs on carbon emissions, carbon stocks, and their removal at the Asian Institute of Technology campus. This research directly supports the AIT’s commitment to achieving net-zero emissions by 2030, in line with global sustainability targets, over a study period from 2023 to 2050. Specifically, the study explores three forest restoration strategies utilizing fast-growing species, bamboo species, and slow-growing species, each selected for their potential to optimize carbon sequestration within an urban academic environment. By offering a comprehensive analysis of various NbS approaches, this study aims to shed light on the efficacy of forest-based strategies in not only reducing carbon footprints but also contributing to a circular economy by recycling carbon through natural processes. This research is guided by the following four key questions: What are the current and projected baseline emissions at the AIT campus? What are the potential carbon stocks and removals from each nature-based solution? Which NbS scenarios can effectively achieve net-zero emissions on campus? And what strategic policy implications and lessons learned can be derived from scenario analyses to inform decision making for net-zero pathways in small organizations and educational institutions?
This study contributes to the field by introducing a holistic carbon balance approach that integrates carbon accounting, projections, and removals, offering a comprehensive pathway to net-zero emissions for small urban institutions. To ensure a robust analysis, both projected and constant baseline emissions were considered. Carbon balance was estimated through three scenarios designed to optimize NbSs for carbon sequestration while supporting circular economy principles. Scenario 1 maximizes carbon removal through improved urban forest management, fast-growing species for forest restoration, and strategic biochar application. Scenarios 2 and 3 build on this by varying the species used—Scenario 2 uses bamboo, while Scenario 3 employs slow-growing species—allowing for a comparative analysis of each species’ effectiveness in carbon sequestration. This approach highlights the potential of natural ecosystems to enhance urban sustainability through circular resource flows. Additionally, by collecting data from approximately 2000 tree measurements, the study provides valuable baseline information on the AIT’s forest carbon stock, supporting future research and policy development in urban sustainability. It also offers a replicable model for universities and similar institutions, demonstrating how NbSs and circular economy approaches can be effectively implemented to achieve net-zero emissions.
This study is structured as follows: it begins by establishing baseline carbon emissions at the AIT, providing a foundation for subsequent analyses. It then conducts a detailed examination of carbon removal through enhanced urban forest management, forest restoration practices, and biochar application for soil carbon enhancement. Additionally, the study explores the dual role of biochar and timber products in balancing the carbon equation. The findings are ultimately synthesized into actionable policy recommendations, offering strategic guidance for sustainable carbon management.

2. Materials and Methods

2.1. Description of the Study Site

The study was conducted at the Asian Institute of Technology campus, located in Pathumthani Province, Thailand, just 40 km north of Bangkok, serves as an appealing retreat for city dwellers looking for a respite from urban life. This is particularly significant given the reduction in green spaces in the surrounding regions [23]. The AIT is an international postgraduate institution offering more than 40 academic programs. Currently, it accommodates 1699 students distributed across various schools: the School of SOM, with 478 students, the School of SERD—SOM, with 1 student, the School of SET, with 695 students, the School of SERD—SET, with 38 students, and OD-2, with 2 students, drawing a diverse student body from over 48 countries. The faculty comprises 139 world-class members from over 20 countries, supported by 586 research and support staff. The campus spans 60% of the total 132 hectares, featuring urban forests that provide a habitat for over 60 tree species and more than 70 wildlife species, contributing to its rich biodiversity (Figure 1).

2.2. Estimation of the Baseline Emission Levels at the AIT Campus

In this study, a baseline approach was used to estimate the carbon emission benefits of various nature-based solutions. Baseline estimation is crucial in carbon accounting, as it provides a reference scenario against which emission reductions and removals are measured. It involves calculating the expected emissions in the absence of any interventions. The following three types of baselines are commonly used: retrospective baselines, which rely on historical data; projected baselines, which are based on future scenarios; stable baselines, which assume constant emissions over time [1,6]. In this study, both retrospective and stable baselines were utilized to ensure a robust analysis of carbon balance and net-zero targets. This approach allows for a comprehensive evaluation of emission reductions attributable to improved urban forest management, forest restoration, and biochar application. The GHG Protocol divides carbon footprint emissions into three distinct scopes (www.ghgprotocol.org). Scope 1 covers direct on-site emissions, such as the combustion of fossil fuels. Scope 2 accounts for indirect emissions from purchased energy, and Scope 3 includes all other indirect emissions not related to energy consumption, such as business travel and waste management [24,25].
This study comprehensively accounted for emissions across all three scopes using activity data provided by the AIT—Office of Facilities and Asset Management (AIT—OFAM), detailed in Table 1. The analysis specifically utilized activity data from the year 2022 to evaluate the carbon emissions on the AIT campus. The method for estimating the carbon emissions at AIT is outlined as follows:
EMS ( t ) = AD i t × EF i   ( t )
where EMS (t) represents the average emissions at the AIT campus at time t (MgCO2e), AD i t denotes the quantity from each activity i within each scope, and EF i   ( t ) is the coefficient that converts activity data i into greenhouse gas emissions data. It is worth noting that the data reflect exactly 12 months in 2022.
The emission factors (EFs) for all scopes were sourced from Thailand Greenhouse Gas Management Organization (TGO)’s emission factors, recognized by the Designated National Authority in Thailand.
Using the retrospective approach [6], we calculated the baseline emissions by multiplying the per capita emissions with the annual population on campus from 2008 to 2022 (Table 2). This provided a basis for future emission projections. For forecasting carbon emissions, we employed the Autoregressive Integrated Moving Average (ARIMA) method. Initially, the dataset was imported and verified to ensure that it was formatted correctly for the time series analysis. Subsequently, the data frame was transformed into a time series object.
To analyze the data, we loaded the forecast and tseries packages and plotted the time series to identify any patterns. The “tseries” package in R is a statistical package designed for time series analysis. It provides tools for handling, modeling, and forecasting time series data, including functions for stationarity tests (e.g., the Augmented Dickey–Fuller test), time series decomposition, and fitting autoregressive models. It is commonly used in econometrics and financial analysis. We then examined the autocorrelation and partial autocorrelation of the series. The stationarity of the data was assessed using the Augmented Dickey–Fuller test, where a p-value smaller than 0.05 confirmed that the data were stationary.
The ARIMA model was constructed using the auto.arima function from the forecast package, and the residuals of the model were evaluated to check for any autocorrelation. We forecasted carbon emissions for a 28-year period from 2023 to 2050, with predictions made at a 95% confidence interval. The model’s validity was tested using the Box test, where a p-value of less than 0.05 suggested an autocorrelation issue within the forecast data. Finally, the model’s accuracy was assessed through the Root Mean Square Error (RMSE), Mean Absolute Error (MAE), and Mean Absolute Percentage Error (MAPE) metrics.

2.3. Carbon Stocks and Removals from Improved Urban Forest Management, Forest Restoration, and Soil Carbon Biochar

Improved urban forest management at the AIT campus entails the upkeep of campus forests through a variety of activities, including watering, fertilizing, pest control, pruning, replanting, and tree removals. This initiative covers an area of 20 hectares. Forest restoration was conducted on 30 hectares of land and focuses on revitalizing degraded forest lands by planting selected species, which are listed in Table 3. Additionally, soil carbon biochar, which involves the application of biochar to the soil to enhance carbon capture, was implemented over an area of 70 hectares. The availability of land for each intervention was accurately determined using Google Earth Pro.

2.3.1. Improved Urban Forest Management

The natural growth of the campus forest continues even without deliberate intervention. Nevertheless, implementing improved urban forest management techniques, such as selective thinning and enrichment planting [28], soil enhancement, and pest management, can significantly enhance forest development and health, leading to increased carbon sequestration. These management practices help to optimize tree growth, improve species diversity, and enhance the forest’s resilience to environmental stressors.
For example, research by [29] demonstrated that the average CO2 accumulation rate in various managed forests in Ethiopia, including woodlands, tropical rainforests, subtropical forests, and lowland forests, was about 5.5 MgCO2 ha⁻1 y⁻1. This rate far exceeds the 0.5 MgCO2 ha⁻1 y⁻1 observed in unmanaged tropical rainforests. The higher sequestration rates in managed forests result from active interventions that promote tree growth and soil carbon storage [28].
Drawing from these findings, we estimate that the AIT campus forest, when managed using similar techniques, can achieve a minimum annual carbon stock increase of 5.5 MgCO2 ha⁻1 y⁻1. This estimate is based on comparable ecological conditions and the assumption that targeted interventions will stimulate growth rates similar to those observed in Ethiopian managed forests. Converting this estimate into carbon mass, this corresponds to 1.5 MgC ha⁻1 y⁻1. This increase is in addition to the natural carbon accumulation already occurring in the existing forest.
To assess the carbon stocks of the existing campus forest, we established 17 stratified plots scattered throughout the campus area. These plots were organized based on uniformity in tree height, age, and size, among other factors. Each plot, measuring 20 × 20 m, included trees with a diameter at breast height (DBH) of at least 10 cm. The estimation of the campus forest’s carbon stocks utilizes Equation (2). The biomass derivation is achieved by averaging nine allometric equations, including Equations (3) and (4) by [30], Equations (5) to (7) by [31], and Equations (8) to (11) by [32].
The equations are as follows:
AGC EF t = ABG EF   ×   0.47
AGB EF t   = e ( 1.996 + 2.32   ×   ln   ( DBH ) )
AGB EF t   = 42.69     12.8   × DBH + 1.242   × DBH 2
AGB EF t   = e α + β 1 × ln ( DBH ) + β 2 × ln ( H ) + β 3 × ln ( ρ )
AGB EF t   = e α + β 2 × ln ( D 2   H ρ )  
AGB EF t   = e α + ln ( D 2   H ρ )  
AGB EF t   = a × DBH b
AGB EF t   = a × DBH b × H c
AGB EF t   = a × DBH b × WD c
AGB EF t   = a × DBH b × H c × WD c
where AGC EF t is the aboveground carbon of the existing campus forest (MgC ha−1), AGB EF t is the aboveground biomass of the existing campus forests (Mg ha−1), D is the diameter at breast height (DBH) (cm), H is the tree height (m), ρ is the wood density (0.58 Mg m−3) [33], and Ln is the natural logarithm.
The parameters for Equations (5)–(7) can be referred to in detail in [31], which improved allometric models to estimate the aboveground biomass of tropical trees. The parameters for Equations (8)–(11) can be referred to in detail in [32], which developed equations for mixed species of the dipterocarp forests in Vietnam.

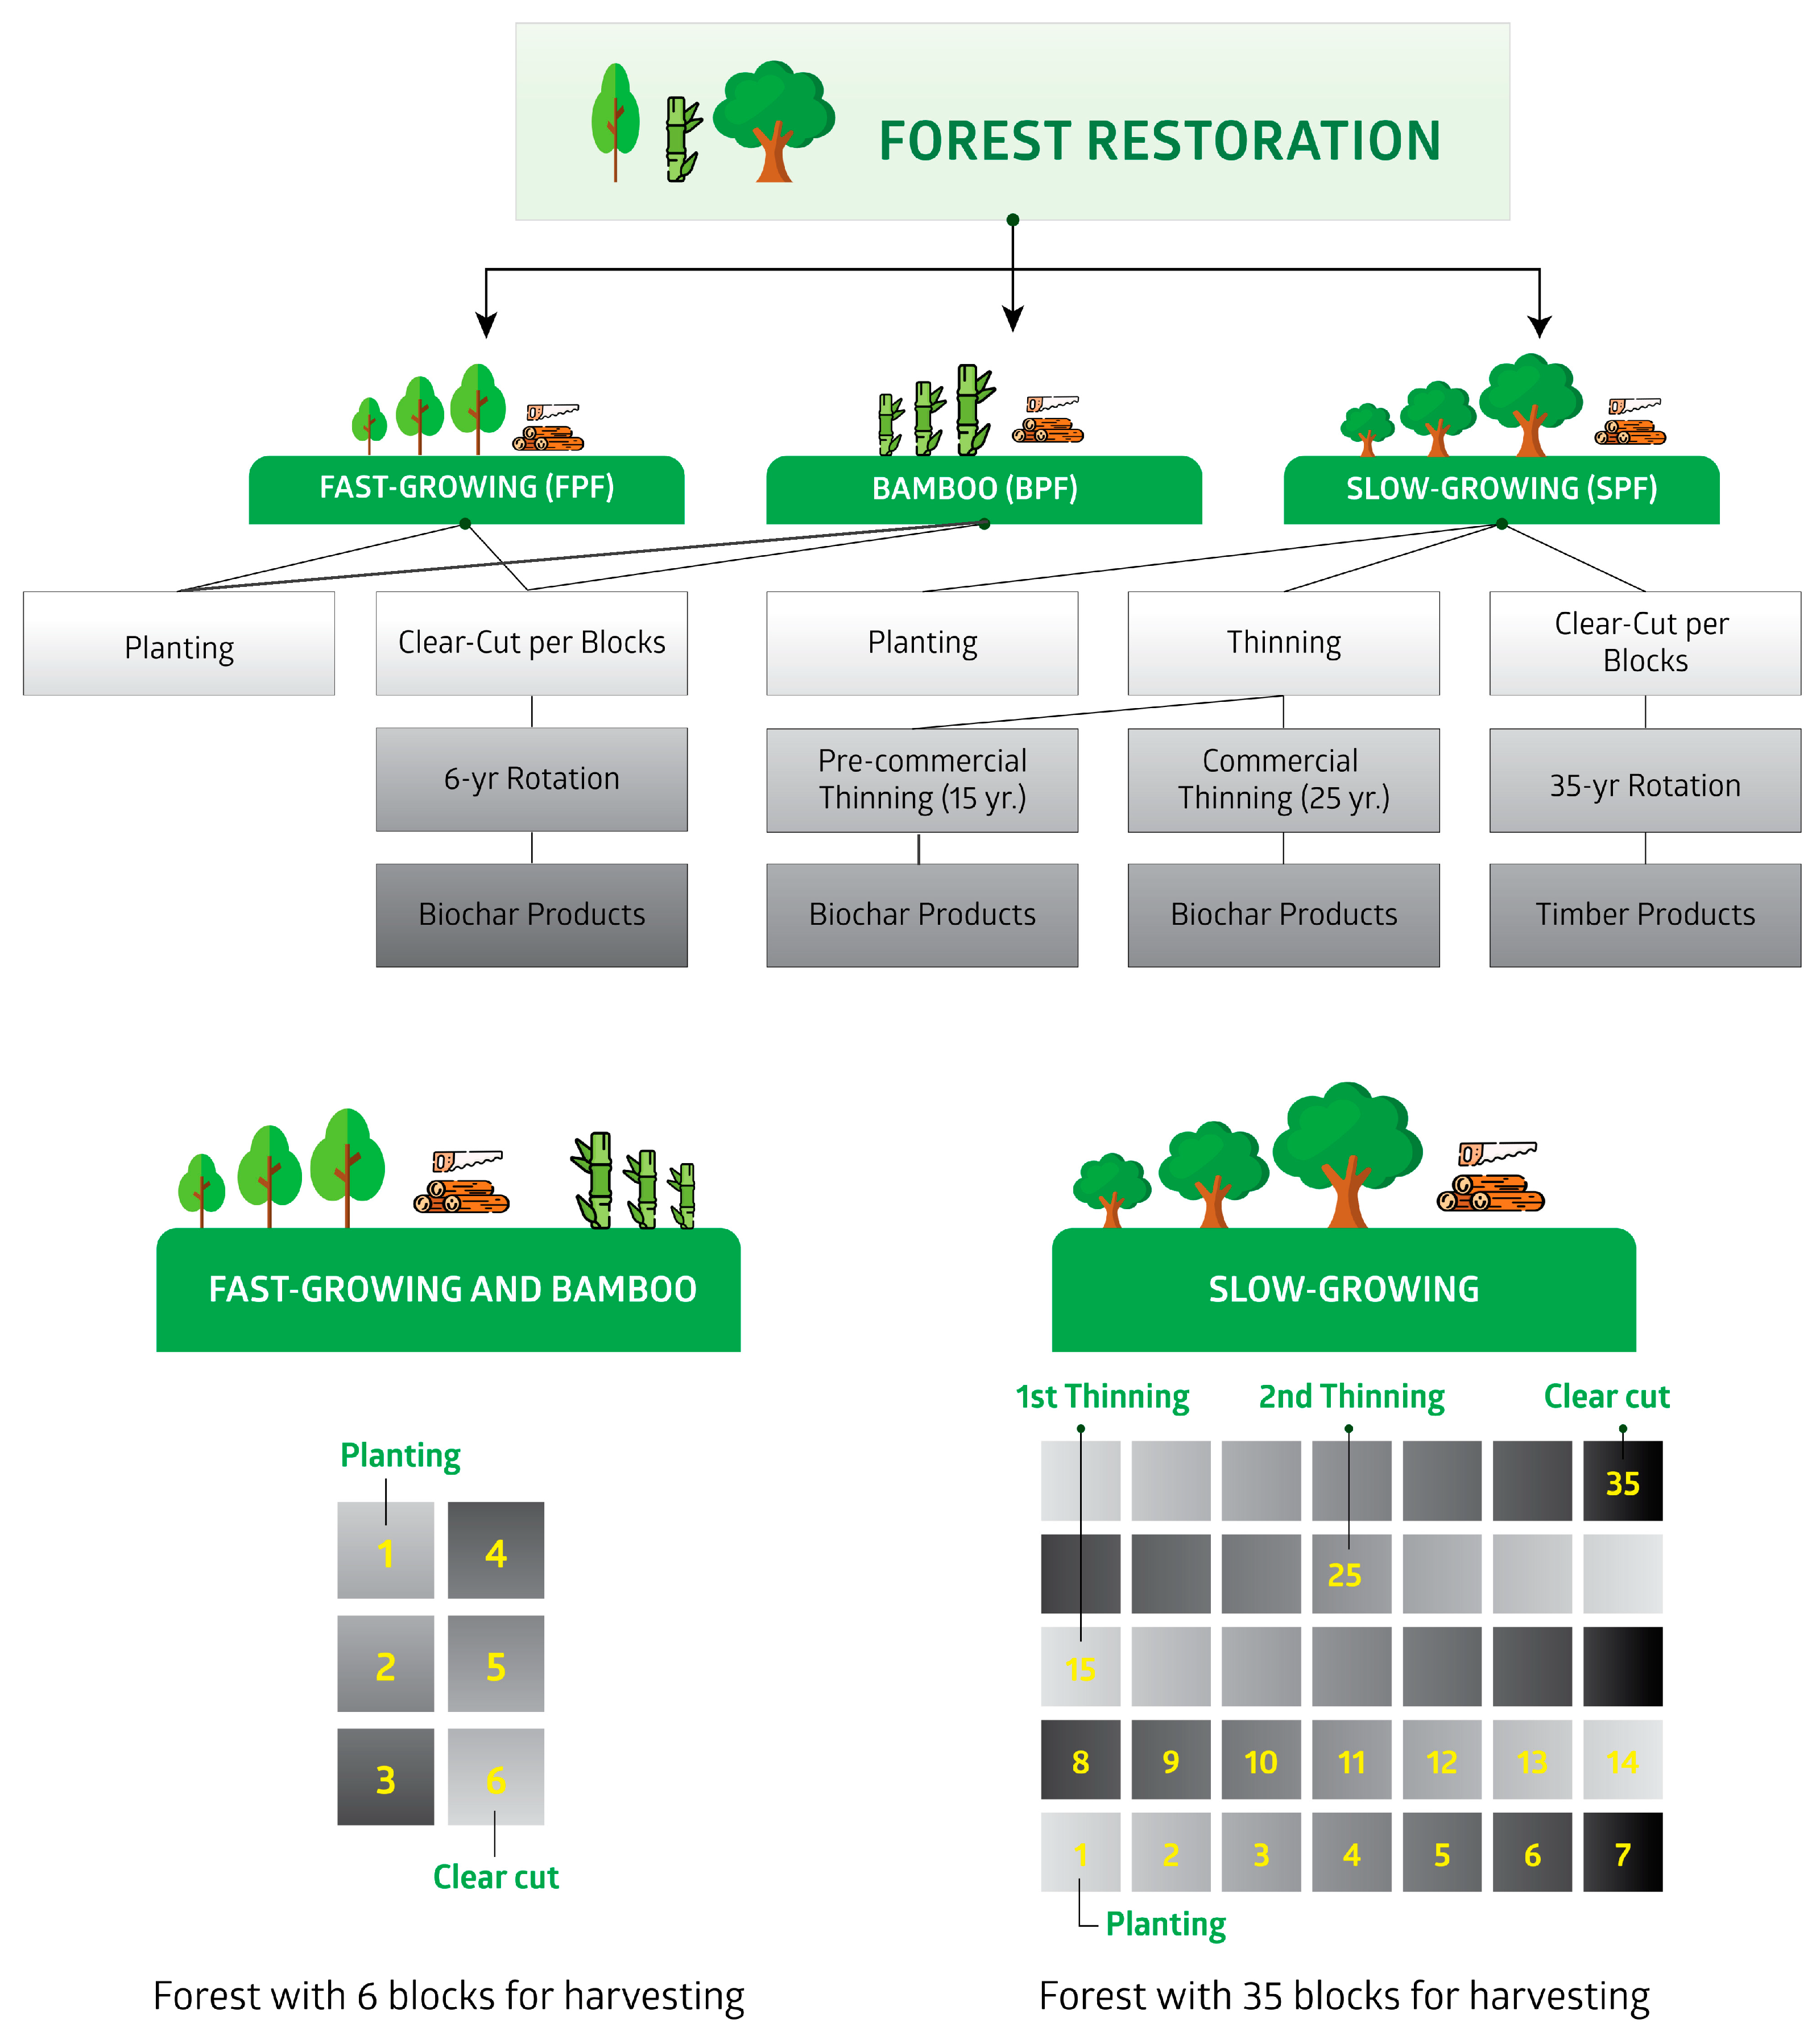
2.3.2. Forest Restoration: Fast-Growing Species, Bamboo Species, and Slow-Growing Species

Forest restoration practices typically involve the use of fast-growing species (FPFs) and slow growing species (SPFs). The FPF usually comprises non-native tree species like Acacia spp., Eucalyptus spp., and Pinus spp., which are cultivated primarily to quickly satisfy the escalating demand for pulpwood and firewood, a consequence of population growth [34]. Conversely, the SPF incorporates native tree species such as teak (Tectona grandis), rubber (Hevea brasiliensis), Dipterocarpus spp., Shorea spp., and other indigenous species. In Southeast Asia, the proportion of land planted with FPFs and SPFs stands at 40.7% and 59.3%, respectively [35]. In this study, the following three restoration scenarios were considered for a 30-hectare area on the AIT campus: one involving FPFs (Acacia spp., Gmelina arborea, and Jatropha curcas), another using bamboo species (Bambusa spp.), and a third employing SPFs (Tectona grandis and Swietenia spp.). Bamboo species are also categorized as fast-growing species, and, with their rapid growth, carbon sequestration, ecosystem benefits, and utilization for products, they are included in the study alongside both fast- and slow-growing species.
The frequency of cutting rotations, which is crucial for sustainable forest management, varies depending on the species and the management objectives. For instance, FPFs and bamboo species (BPFs), typically managed under a clear-cutting system, are generally harvested between 5 and 15 years after planting [36]. Meanwhile, SPFs like teak traditionally undergo a cutting rotation spanning 50 to 60 years [37], though a reduced rotation period of 35 years has been proposed recently [38]. For the purposes of this study, it was assumed that the cutting rotation period for FPFs, including bamboo species, is 6 years, while, for SPFs, it extends to 35 years.
For management purposes, each restoration scenario on the AIT campus is organized into 35 blocks, tailored to accommodate the specific growth and harvesting cycles of the different species. Each block aligns with a 6-year cutting rotation for FPFs and bamboo species (BPFs), and a 35-year cutting rotation for slow-growing species. In this structured approach, trees within each block are harvested and replanted annually to ensure consistent forest regeneration.
Given the extended lifespan of SPFs, the following two critical thinning processes are incorporated into the management plan: pre-commercial thinning in the 15th year and commercial thinning in the 25th year (Figure 2). These thinning stages are strategically timed to enhance the forest health and productivity by reducing competition for resources among trees, thereby improving the overall growth and yield of the forest. This methodical management strategy facilitates a perpetual cycle of growth, harvest, and replanting, which is fundamental to achieving sustainable forest management. This ensures that the forest continues to thrive and deliver ecological, economic, and social benefits over the long term.
The following diagram illustrates the management strategy for forest restoration used in this study. For fast-growing and bamboo species, the management approach involves cutting one block entirely (100%) and replanting it annually, adhering to a 6-year cutting rotation. For slow-growing species, the process is similar, with one block being fully cut (100%) and replanted each year, but following a longer, 35-year cutting rotation. This systematic rotation ensures the continuous regeneration and sustainable management of the forest resources.
In each forest restoration scenario, assumptions were made regarding the mean annual increment (MAI) of carbon sequestration for each type of forest. The MAI was estimated at 7.9 MgC ha−1 year−1 for fast-growing species, 4.6 MgC ha−1 year−1 for bamboo species, and 4.48 MgC ha−1 year−1 for slow-growing species. These estimates are based on the average values calculated at a 95% confidence interval for each species category, as documented in the existing literature (Table 4).
Furthermore, the maximum carbon sequestration potential for each forest type was also considered. It was hypothesized that the forest restoration efforts would continuously augment the carbon stocks until they reached their peak capacities of 90.4 MgC ha−1 for FPF, 106.5 MgCha−1 for BPF, and 132.8 MgC ha−1 for SPF. These peak values are derived from the upper limits of a 95% confidence interval for aboveground carbon, supported by data collated from various species and locations as per the restoration scenarios outlined in the study by [39].
To accurately convert the mean annual increment from cubic meters per hectare per year (m3 ha−1 year−1) to megagram of carbon per hectare per year (MgC ha−1 year−1), the following equation is used:
CS FR = CD × BEF × WD × Vol
where CS FR is the mean annual increment of each forest restoration scenario (MgC ha−1 year−1); CD is the carbon fraction in the dry wood, which is 0.47, as adopted by the IPCC [40]; WD is the average wood density of tropical tree species, which is 0.57 [33]; BEF is the biomass expansion factor used to include the biomass in branches and top logs, which is 1.47 [30]; Vol is mean annual increment (m3 ha−1 year−1).
Table 4. Observed mean annual increment by species of forest restoration in the tropics.
SpeciesMAI Range
(m3 ha−1 year−1)
LocationReferences
MinMax
Acacia mangium19.024.0S. and S.E. Asia[41]
Gmelina aborea10.015.0Africa and Asia[42]
Average14.519.5
The assumption for FPFs for this study: 17.0 m3 ha−1 year−1
Dendrocalamus latiflorus Munro9.87Taiwan[43]
The assumption for bamboo for this study: 9.8 m3 ha−1 year−1
Tectona grandis4.017.3S. and S.E. Asia[41]
Swietenia macrophylla7.010Africa and Asia[42]
Average5.513.7
The assumption for SPFs for this study: 9.6 m3 ha−1 year−1
Note for Table 4: MAI is the mean annual increment for each type of forest (m3 ha−1 year−1).

2.3.3. Models for Predicting Carbon Stocks and Removals

With established initial and projected maximum carbon stocks for each intervention, we can predict the future carbon stocks and removals using the models described below:
CSI e t = CSI MAXe   ×   CSI e t 0   ×   e r e ×   t CSI MAXe + CSI e t 0   ×   e r e × t - 1
r e = CSI MAXe FGA / CSI MAXe
CSeq e t =   FA e t ×   CSI e t   ×   44 12
where CSI e t is carbon stocks of intervention e with an increasing area (MgC ha−1), CSI e t 0 is initial carbon stocks of intervention e with an increasing area (MgC ha−1), CSI MAXe is the maximum carbon stocks of intervention e with an increasing area (MgC ha−1), r is the growth rate of intervention e with an increasing trend, FGA is the age at which the stand stops growing (year), CSeq e t is the total carbon sequestration for intervention e at time t (MgCO2) ,   FA e t is the forest area (ha) for intervention e at time t (Table 3), and 44/12 is the ratio of the molecular weight of carbon dioxide to that of carbon. Parameters and justifications for Equations (13)–(15) are provided in Table 5.

2.3.4. Soil Carbon Biochar

Research into the effectiveness of soil carbon sequestration using biochar, specifically from sugarcane residues in Brazil, has shown promising results. The study by [7] demonstrated that biochar application could enhance soil carbon stocks by an average of 2.35 ± 0.4 MgC ha⁻1 year⁻1 in sugarcane fields, using an application rate of 4.2 Mg biochar ha⁻1 year⁻1. Building on this, we anticipate that soil carbon levels could increase from 2.35 MgC ha⁻1 year⁻1 to as much as 20 MgC ha⁻1 by the year 2050 [54].
For the AIT campus, biochar is applied at a rate of 4.2 Mg ha–1, which is expected to facilitate the removal of approximately 8.6 Mg of CO2 ha⁻1 (8.6 = 2.35 MgC ha⁻1 year⁻1 * 44/12, where 44/12 is molar mass conversion factor from carbon to CO2). With 70 ha available for this treatment, our strategy involves applying biochar to 10 hectares of this land annually. This application cycle will continue each year until biochar has been applied to the entire 70 hectares. As a result, each year, for the 10 hectares treated, 42 Mg of biochar is required. This quantity of biochar is projected to achieve carbon removals totaling 23.5 MgC annually.
In the process of making biochar from wood, the yields of biochar, bio-oil, and syngas can vary depending on several factors, including the type of biomass, the pyrolysis process parameters (like the temperature, heating rate, and residence time), and the pyrolysis technology used. Generally, slow pyrolysis is optimized for biochar production. It typically operates at lower temperatures (about 500 °C) and longer residence times (hours to days), resulting in a higher yield of biochar but less bio-oil and syngas through open and closed systems [55]. This process is suitable for our study because we focus on biochar products. Biomass carbonization using simple stoves or kilns was categorized as open carbonization, whereas carbonization in enclosed pyrolytic plants was classified as closed carbonization.
Biochar production requires energy inputs, with variations depending on the system used. Open carbonization typically relies on direct biomass combustion, leading to lower efficiency, while closed pyrolysis systems often incorporate syngas recycling, reducing external energy demands. However, since this manuscript specifically focuses on emissions, the emissions generated during biochar production were also included in the analysis. Based on multiple studies cited in [56], the overall emissions during biochar production range from 0.07 to 0.60 MgCO2e/Mg-biochar, depending on the system used. These EFs came from the potential process-based emissions in biochar production with the most possible combinations of parameters that include transportation, plant construction, pre-treatment, carbonization, and without surplus energy. Based on this range, the estimated emissions from biochar production in this study were 0.34 MgCO2e/Mg-biochar, representing the midpoint of the reported values.

2.3.5. Biochar and Timber Production

Biomass used for biochar production on the AIT campus is sourced from the following two main areas: improved forest management and forest restoration. In the case of improved forest management, biomass is derived from the annual shed of leaves from deciduous trees, and from the scheduled cutting of dead and mature Acacia and Eucalyptus trees, which have a diameter at breast height (DBH) greater than 60 cm. Our forest inventory shows that deciduous trees make up approximately 10.7% of the campus’s total tree population. Specifically, there are 260 Acacia mangium trees and 124 Eucalyptus camaldulensis trees with a DBH greater than 60 cm. Plans are in place to sustainably harvest 10 Acacia trees and 5 Eucalyptus trees annually up to the year 2050.
Research on the wood density and phytomass of various trees harvested from a tropical rainforest in Africa indicates that the foliage accounts for about 4% of the total aboveground biomass [57]. Additionally, studies have shown that the biochar yield from this biomass is approximately 33%, based on research from multiple sources [58,59,60,61].
Using these metrics, we can calculate the potential biochar production from the biomass obtained through improved forest management as follows:
Total biomass from annual fallen leaves from deciduous trees at time t ( AGB FL   ( t ) ):
AGB FL   ( t )   = 0.107   ×   AGC E F   ( t ) ÷   0.47   ×   0.04
Biochar products from annual fallen leaves from deciduous trees at time t ( BP FL   ( t ) ):
BP FL   ( t ) = AGB FL   ( t )   ×   0.33
Biomass from thinned wood of Acacia   ( AGB TWA   ( t ) ) and Eucalyptus ( AGB TW E   ( t ) ) at time t:
AGB TWA   ( t ) =   AGC EFA   ( t )   per   tree ÷ 0.47   ×   TW
AGB TWE   ( t )   =   AGC EFE   ( t )   per   tree ÷ 0.47   ×   TW
Total biomass from thinned wood of Acacia and Eucalyptus at time t  ( AGB TW   ( t ) )
AGB TW   ( t ) =   AGB TWA   ( t ) +   AGB TWE   ( t )
Biochar products from thinned wood of Acacia and Eucalyptus at time t ( BP TW   ( t ) ):
BP TW   ( t )   = AGB TW   ( t )   ×   0.33
Total biochar products from deciduous fallen leaves and thinned Acacia and Eucalyptus at time t (TBP (t)):
TBP ( t ) = BP FL   ( t ) + BP TW   ( t )
where   AGC E F   ( t ) can be obtained from Equation (2), as described earlier. AGB TWA   ( t ) and AGB TWE   ( t ) represent the biomass of thinned wood from Acacia and Eucalyptus, respectively.   AGC EFA   ( t ) and   AGC EFE   ( t ) represent the carbon stocks per tree of thinned wood from Acacia and Eucalyptus, respectively. TW is number of trees thinned annually for Acacia or Eucalyptus.
For restoration, biomass for biochar production is sourced from each restoration scenario according to specific cycles and methods. For fast-growing species and bamboo, biomass is harvested on a 6-year rotational basis per block. For slow-growing species, additional biomass is collected during the thinning processes, which occur in the 15th and 25th years of growth. The calculation of biochar products from each restoration scenario is conducted based on these periodic biomass collection activities.
Total biochar products from restoration species e at time t ( BP FRe   ( t ) ):
BP FRe   ( t ) = CS FRe   ( t ) ÷ 0.47 × 0.33
where CS FRe   ( t )   from restoration species e at time t can be obtained from the calculation as illustrated in figure and formula as follows (Figure 3).
According to [62,63], 50% of the final felling is used for timber production. Therefore, the timber products from SPFs can be calculated as follows:
Total timber products from final cut per block from SPF at time t ( TP SPF   ( t ) ):
TP SPF   ( t )   = Vol SPF   ( t )   ×   0.5
Total volume of harvested wood from final cut per block from SPF at time t ( Vol SPF   ( t ) ):
  Vol SPF   ( t ) = ( CS SPF   ( t ) ÷ 0.47 ) ÷ ( WD SPF ×   BEF SPF )
where TP SPF   ( t ) is the total timber products from the final cut per block from SPFs at time t (m3) and Vol SPF   ( t ) is the total volume of harvested wood from the final cut per block from SPFs at time t (m3).

2.4. Carbon Balance

The carbon balance was analyzed using both projected and constant baseline emissions. To determine the effectiveness of various management strategies on the overall carbon sequestration capabilities of the campus, the following three scenarios were proposed:
Scenario 1: This scenario accounts for the total carbon removals achieved through improved urban forest management, restoration using fast-growing species, and the application of biochar.
Scenario 2: Similar to Scenario 1 in terms of the management practices involved, this scenario focuses on carbon removals resulting from improved urban forest management, restoration with bamboo species, and biochar application.
Scenario 3: This scenario includes total carbon removals from improved urban forest management, restoration with slow-growing species, and biochar application.
The methodology for calculating the carbon balance for each scenario incorporates these diverse approaches to managing and restoring the campus’s green spaces, assessing their impact on the overall carbon footprint.
The carbon balance from each scenario can be calculated as follows:
  CB e   ( t )   = EMS   ( t )   -   ( REM IUFM   ( t ) +   REM FRe ( t ) +   REM biochar ( t ) )
where CB e   ( t ) is the net emissions of scenario e at time t (MgCO2), EMS   ( t ) denotes all emissions at time t (MgCO2e) (including biochar production emissions), and REM is the carbon removals (MgCO2).

3. Results and Discussion

3.1. Baseline Emission Levels at the AIT Campus

Carbon emissions at the AIT campus were calculated to be 8367 MgCO2e, as outlined by the GHG Protocol Corporate Standard [25] and detailed in Table 6. This equates to approximately 2.63 MgCO2e per person, aligning closely with findings by [13]. Their research indicated that the average carbon footprint for academic institutions across North America, Africa, Europe, Asia, and South America, based on the three scopes, ranged from 0.14 to 7.50 MgCO2e per person.
The analysis of the emission scopes revealed that Scope 2 emissions were the most significant, accounting for 61% of the total emissions, primarily due to electricity usage. Scope 3 followed, contributing 34% to the total, with Scope 1 emissions being the least at only 5%. These findings are consistent with those observed by [64] at Universitas Pertamina in Jakarta, Indonesia, where electricity was also identified as the principal source of CO2 emissions, accounting for 92.3% of the university’s total emissions.
The primary sources of greenhouse gas emissions at the AIT campus included electricity usage, transportation, and waste generation. The campus’s international diversity, with students hailing from over 40 countries, results in considerable air travel, which significantly contributes to these emissions. It is also crucial to consider that the data from 2022 were collected during the pandemic period, which could have influenced typical behaviors related to travel and resource use, potentially skewing the usual emission patterns.
Using the retrospective approach outlined by [8], the carbon emissions were calculated by multiplying the per capita emissions by the number of people present on the campus annually from 2013 to 2022. This calculation formed the baseline for estimating future emissions. The predicted emissions were projected to be 8879 MgCO2e per year, with a range from 8766 to 8991, over a span of 28 years from 2023 to 2050.
The fluctuation in student numbers emerged as the most significant variable impacting carbon emissions. This variability arises because the emission calculations incorporate data from the changing numbers of new and continuing students, alongside the more stable counts of faculty and staff. Consequently, the total emissions reflect these annual variations in the campus population.

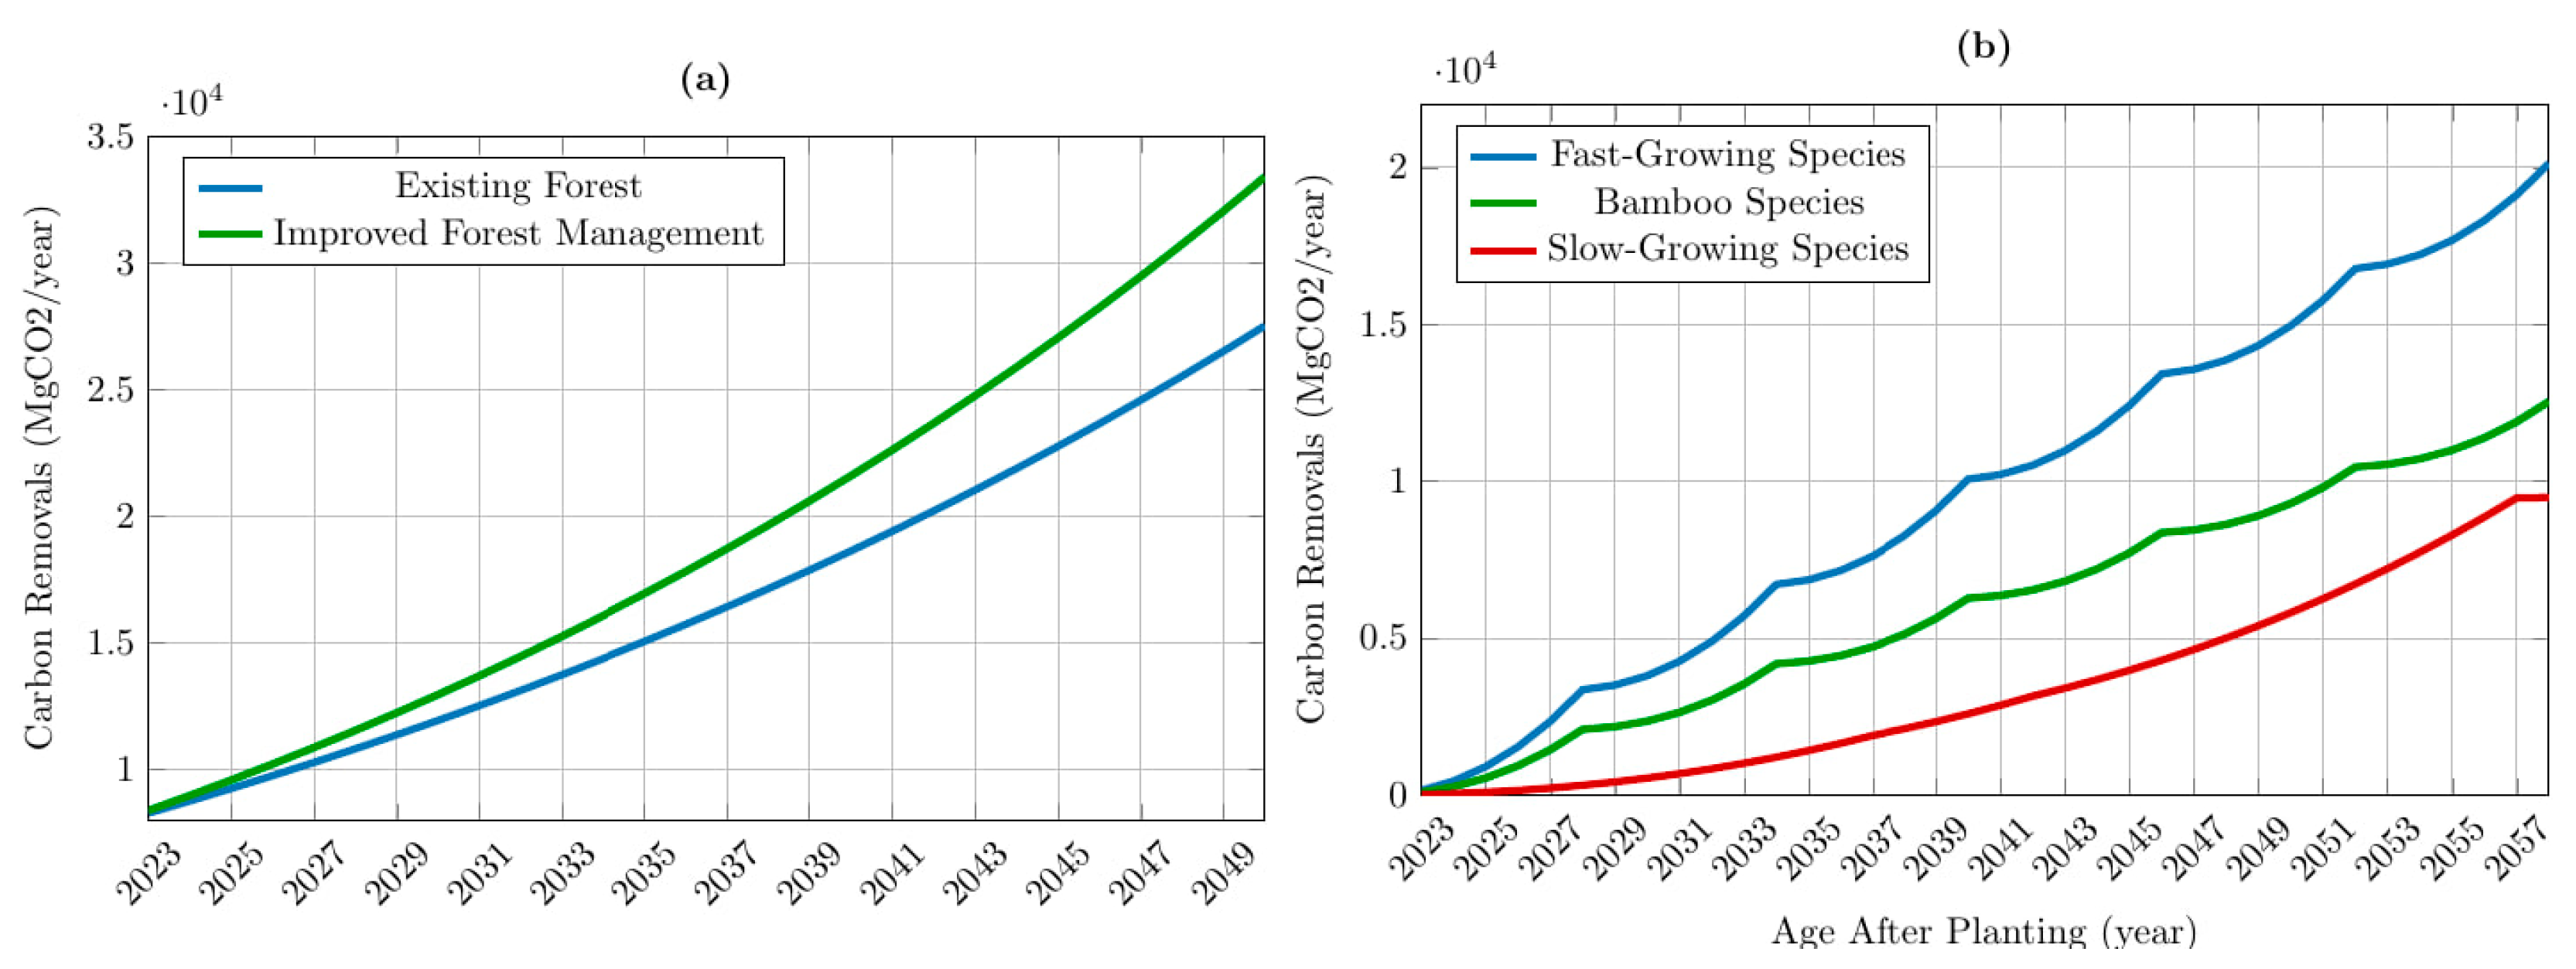
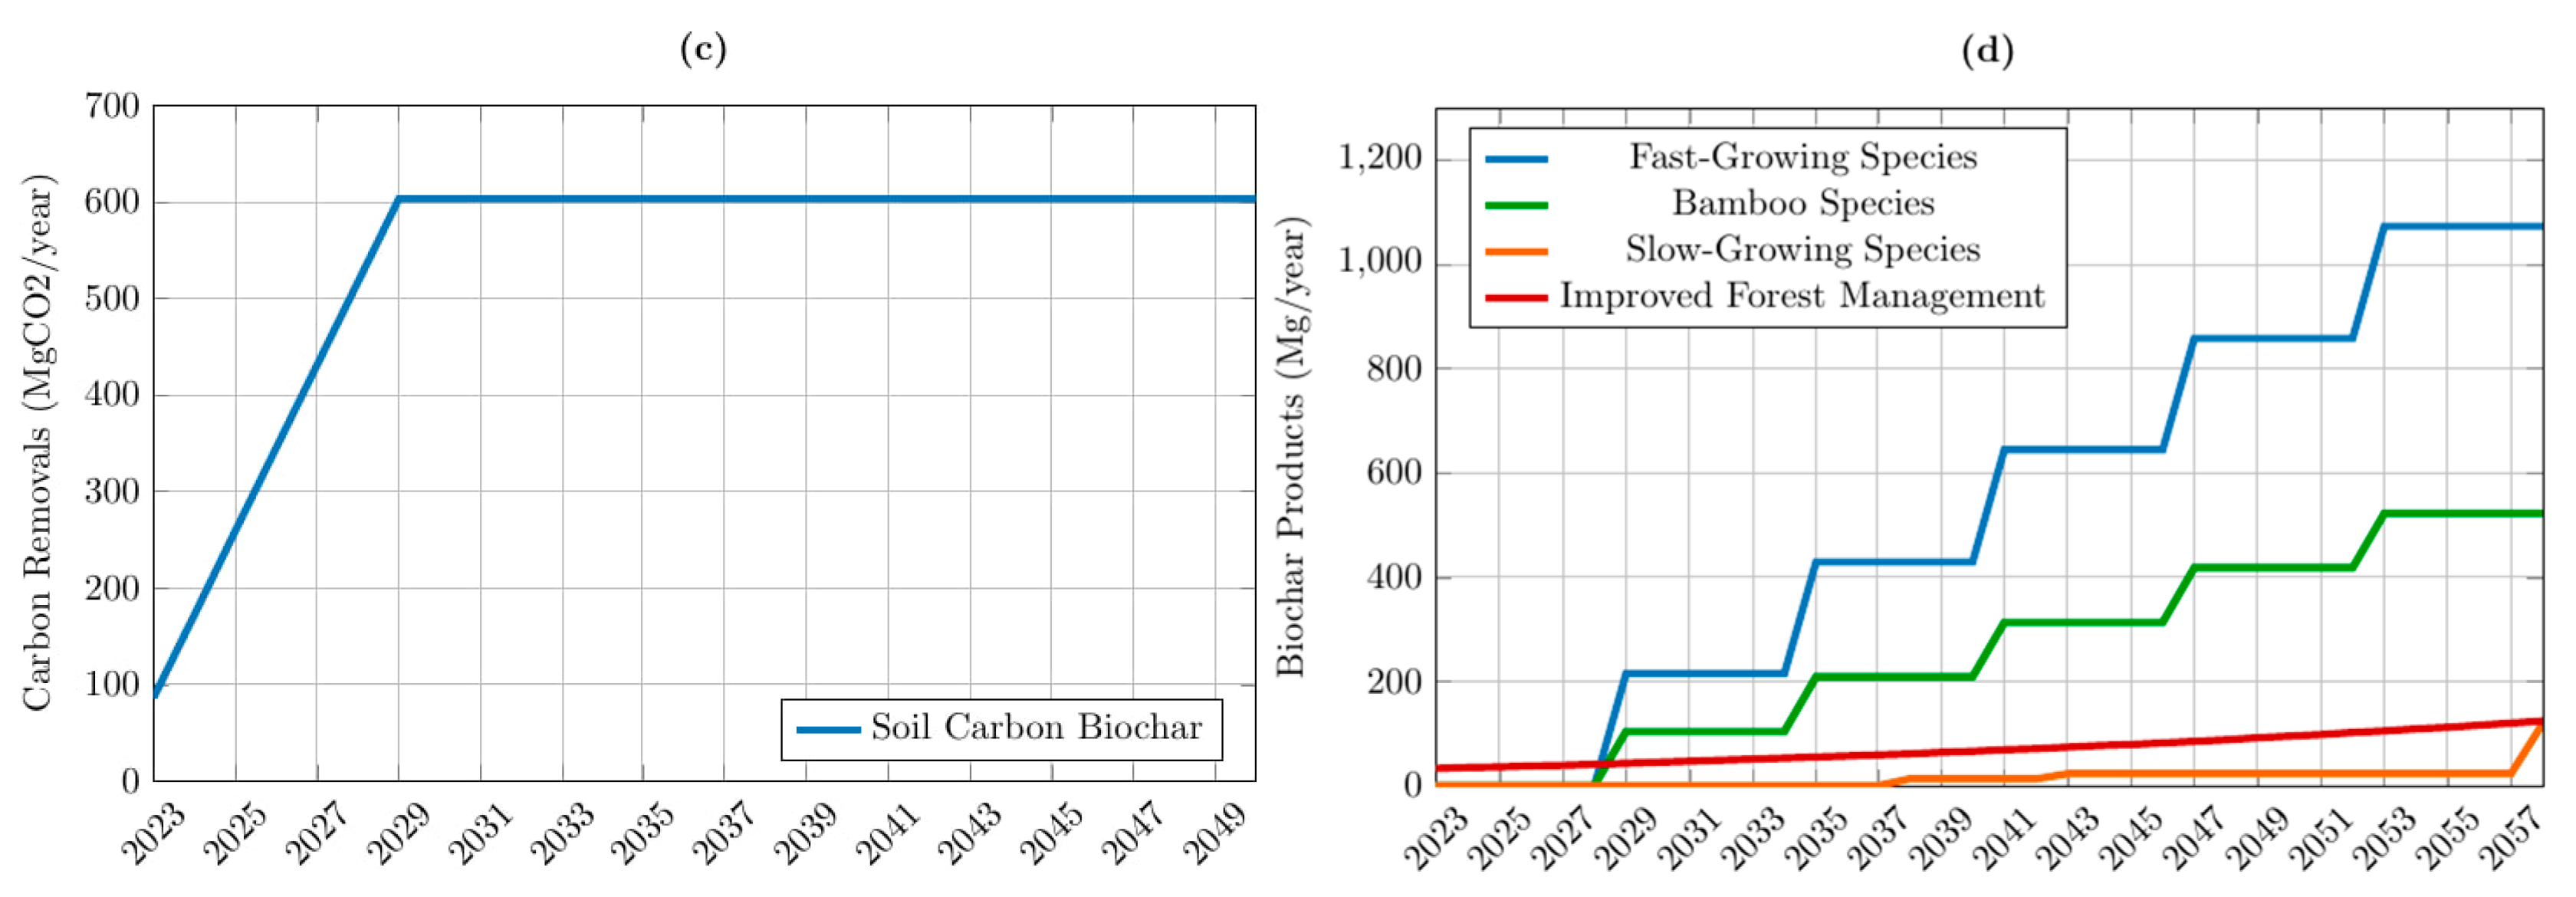
3.2. Carbon Stocks and Removals from Improved Urban Forest Management, Forest Restoration, and Soil Carbon Biochar

From 2023 to 2050, the carbon stocks on the AIT campus, including existing forests, botanical gardens, golf courses, and both developed and undeveloped areas, are projected to average about 113 MgC ha−1 or 414 MgCO2 ha−1, totaling approximately 32,778.5 MgCO2. This estimation is substantially higher than the carbon stock range of 14.3–93.0 MgC ha−1 reported by [65] for 25 major public parks across Bangkok. These parks feature a variety of forest types, including hill/dry evergreen forest, rainforest, deciduous dipterocarp/mixed deciduous forest, mangrove forest, bamboo, and beach forest. In contrast, our results are lower than the 161.3 MgC ha−1 recorded for Universitas Indonesia’s urban forest by [66]. However, the carbon stock figures for the AIT are on par with those reported by [45], which amounted to 120.3 MgC ha−1 in diverse settings such as botanical gardens, golf courses, monasteries, and coffee farms in Pyin Oo Lwin, a secondary city in Myanmar.
The existing forest on the AIT campus will continue to grow naturally, and, under current conditions, it may not qualify for carbon credits unless it is deemed to be under significant threat. However, implementing improved urban forest management practices, such as pruning, thinning, appropriate water and fertilizer applications, and the removal of aging or potentially hazardous trees, can significantly boost carbon stocks. Our analysis indicates that annual carbon removals resulting from improved urban forest management activities are estimated at 2476 MgCO2 (Figure 4). This increase in carbon stocks, known as additionality, meets the criteria for eligibility for carbon credits. This finding aligns with previous research by [28], which suggests that managed forests often exhibit higher carbon stocks compared to unmanaged or naturally occurring forests. By actively managing the campus forest, the AIT can not only enhance its carbon sequestration capacity but also contribute positively to climate change mitigation efforts, while potentially generating revenue through carbon credit trading.
Annual carbon removals for each forest restoration scenario on the AIT campus were estimated as follows: 7586 MgCO2 (95%CI: 5803 to 9,370,586 MgCO2) from fast-growing species, 4711 MgCO2 (95%CI: 3600 to 5,822,586 MgCO2) from bamboo species, and 2131 MgCO2 (95%CI: 1428 to 2,834,586 MgCO2) from slow-growing species. Fast-growing species, including bamboo, tend to achieve significant carbon removals in the short term due to their rapid growth rates, as indicated by their MAI, which is detailed in Table 4. In contrast, slow-growing species accumulate higher carbon removals over a longer period, benefiting from their extended longevity and consistent growth.
In terms of the overall carbon sequestration effectiveness, fast-growing and bamboo species are notably superior, primarily due to their quick growth cycles and the larger tracts of land dedicated to their cultivation. Specifically, fast-growing and bamboo species are cultivated on five hectares of land per block annually, adhering to a 6-year cutting rotation. On the other hand, slow-growing species are given only 0.86 hectares per block, with a much longer 35-year cutting rotation. This strategic allocation of land and rotation schedule maximizes the carbon sequestration potential of fast-growing and bamboo species within shorter time frames.
Regarding the use of biochar for soil improvement, our model projected that the total cumulative carbon sequestration via soil biochar would reach 603.17 MgCO2 per hectare (95%CI: 482.76 to 594.32 MgCO2) from 2023 to 2050. Similarly, [67] assessed the long-term carbon sequestration capabilities of biochar in soil using a biogeochemical field model and found that the cumulative carbon stock potential increased from 59.78 Mg CO2 ha−1 over 5 years to 76.96 Mg CO2 ha−1 over 50 years (soil organic carbon + additional carbon assimilation by plants under biochar influence), corresponding to a biochar application rate of 56.14 Mg CO2 ha⁻1. In the initial year, 33 Mg of biochar is expected to be collected from the biomass resulting from improved forest management. To meet the requirements for application, an additional 20% of biochar will need to be sourced externally. However, from the sixth year onward, the biochar necessary for soil application will be sufficiently supplied by the biomass from forest restoration efforts, particularly from fast-growing or bamboo species. Additionally, the timber products obtained from slow-growing species (SPFs) were estimated to total 160.32 m3.

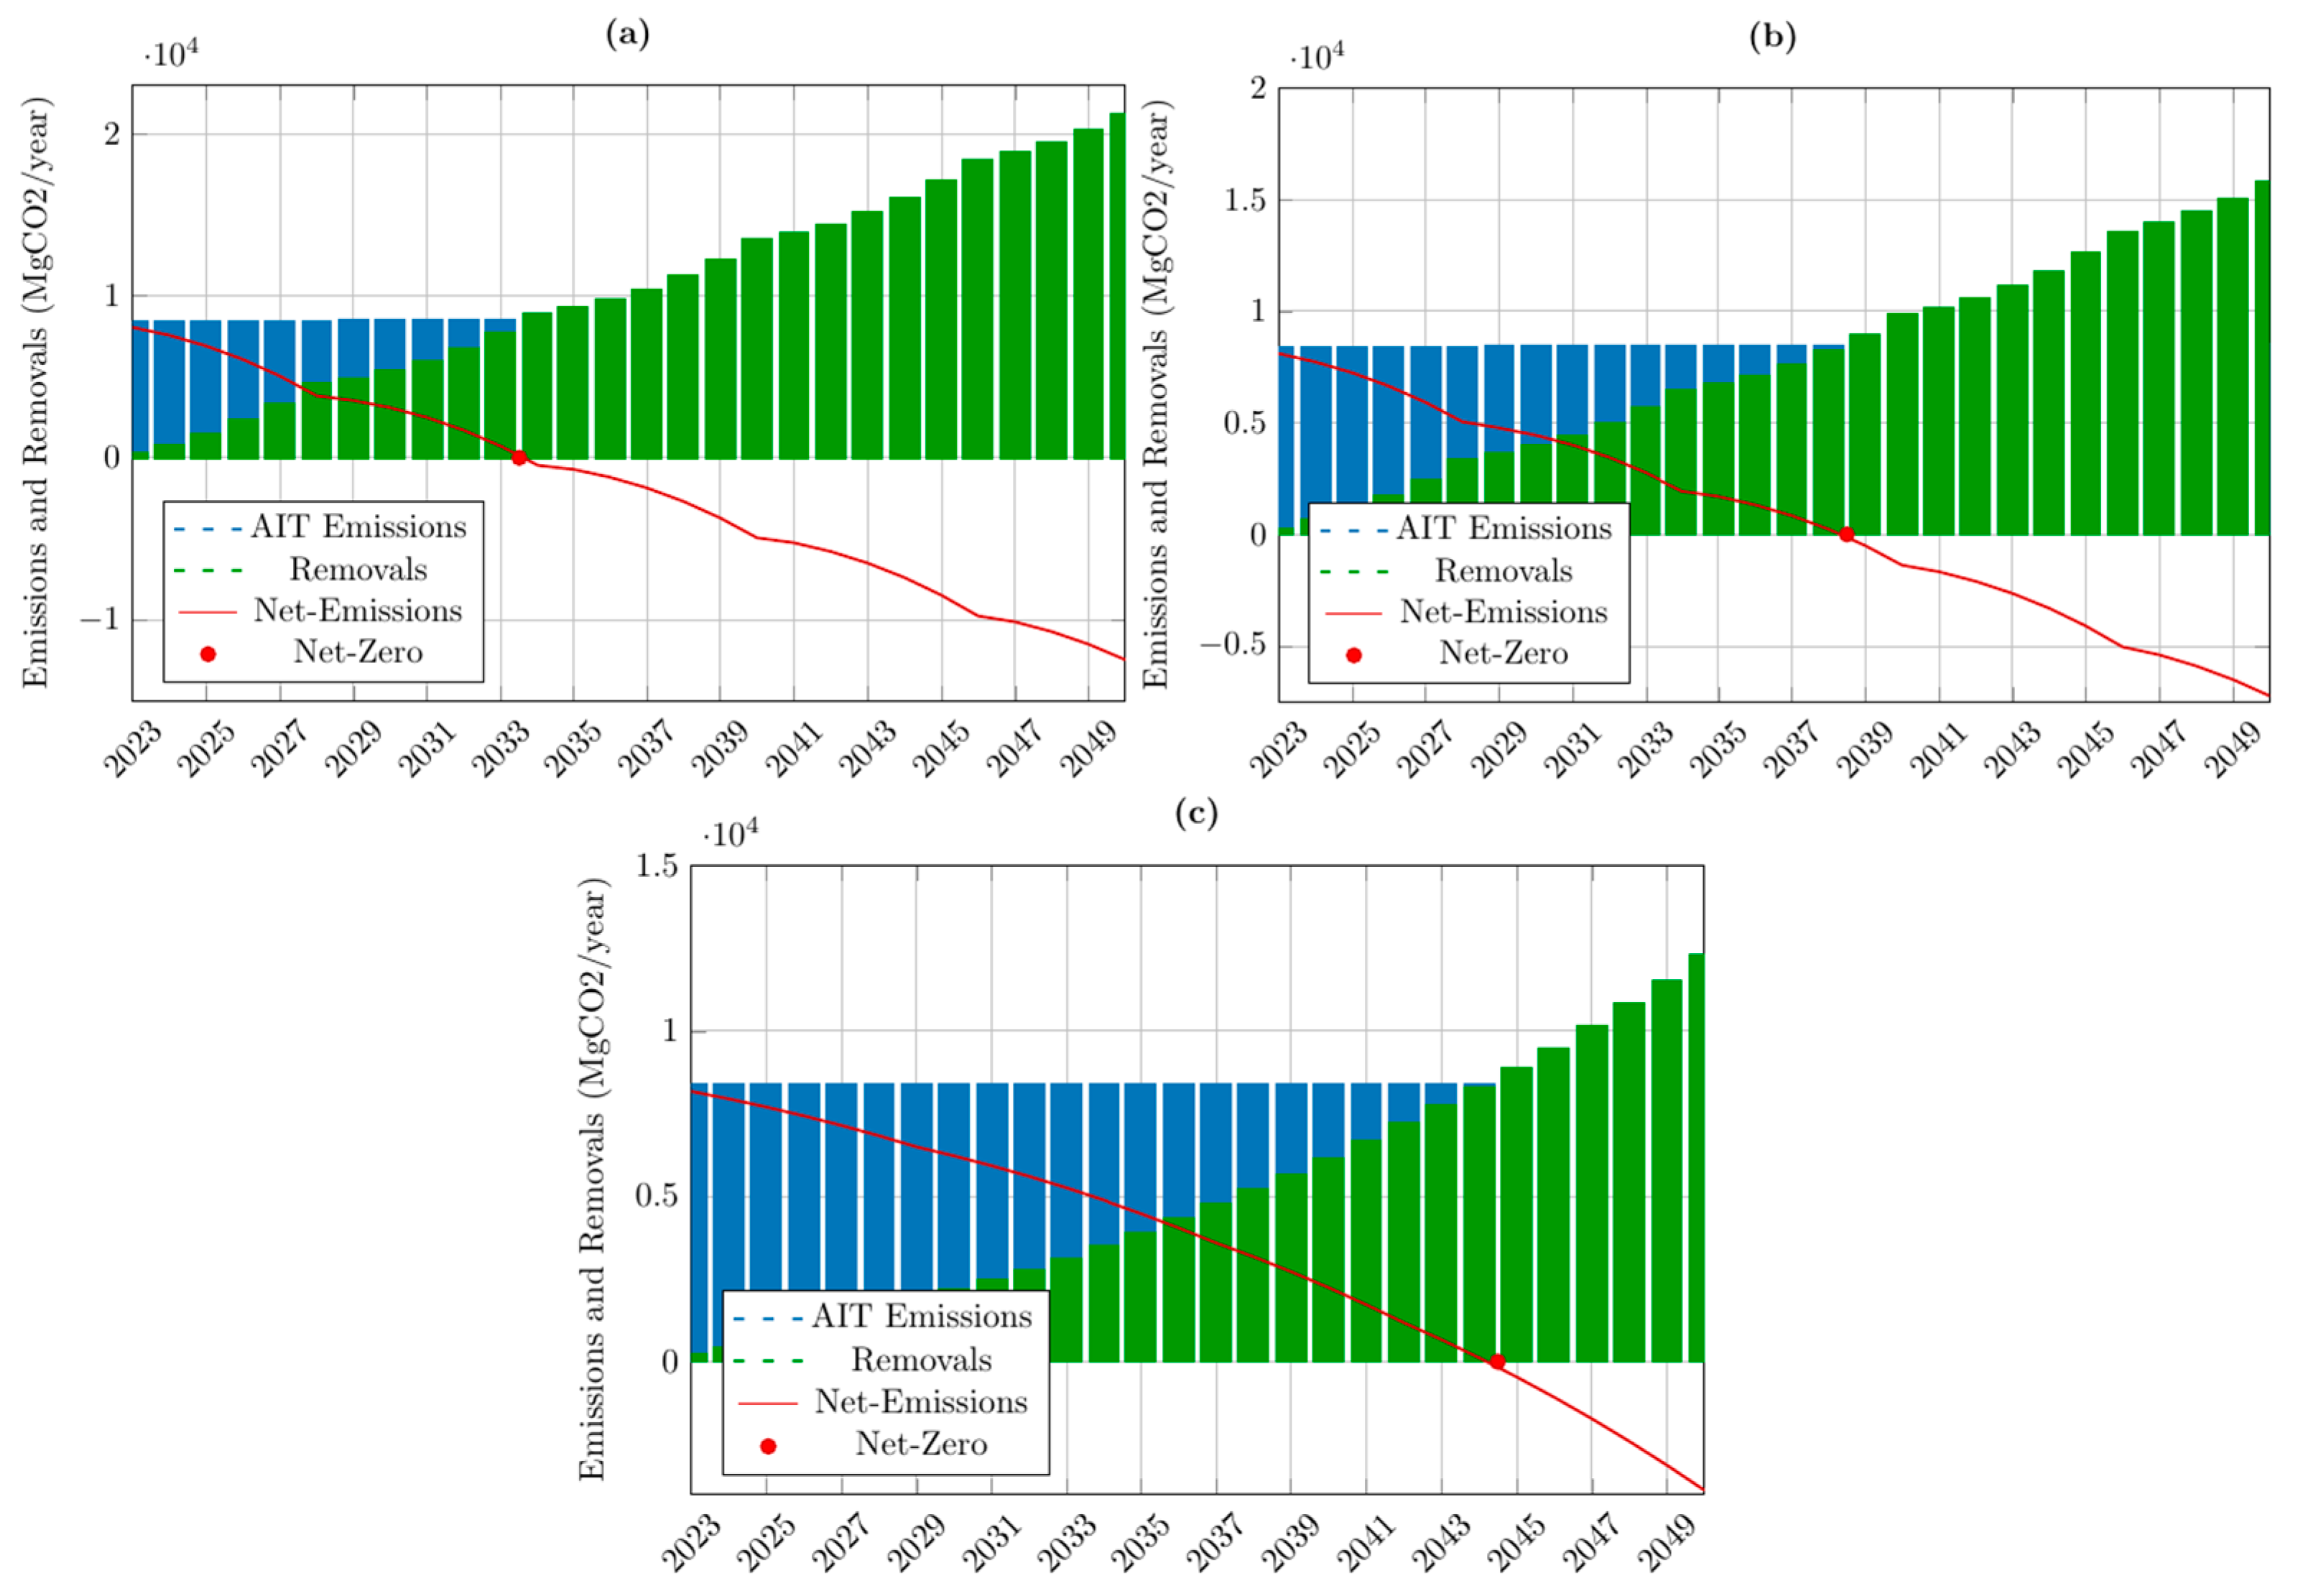
3.3. Net-Zero: Carbon Emissions, Removals, and Net Emissions

The achievement of net-zero emissions by 2030 varies depending on the emission baseline used. With a retrospective baseline, none of the NbS approaches can meet net-zero emissions by 2030. However, net-zero can be achieved shortly after 2030. Similarly, using a stable baseline, none of the NbS approaches can reach net-zero emissions by 2030, but all scenarios achieve it shortly thereafter. It is notable that net-zero emissions can be achieved more quickly with a stable baseline compared to a retrospective baseline. For instance, Scenario 1 can reach net-zero emissions by 2033.5 with a stable baseline (Figure 5) and by 2034 with a retrospective baseline (Figure 6).
Scenario 1, which involves improved urban forest management, restoration with fast-growing species, and biochar application, is the fastest approach to reach net-zero emissions, followed by scenarios involving bamboo species. This is due to the management strategy where fast-growing species are allocated 5 hectares per block annually for cutting and replanting with a 6-year rotation cycle, whereas slow-growing species are allocated only 0.86 hectares with a 35-year cutting rotation. Additionally, the MAIs are higher for fast-growing and bamboo species. These factors lead to larger carbon removals from fast-growing and bamboo species compared to slow-growing species, facilitating quicker progress towards net-zero emissions.
Although none of the NbS approaches can achieve net-zero emissions by 2030 under either a retrospective or stable baseline—a target period aligning with the initial implementation phase of the Paris Agreement and the deadline to meet the Sustainable Development Goals [2]—net-zero emissions are expected to be reached shortly after 2030 and before 2050. This progress is significant at both national and global levels. Nationally, it aligns with Thailand’s targets to achieve carbon neutrality and net-zero emissions by 2050 and 2065, respectively [19]. On a global scale, it supports the aim of achieving net-zero emissions by 2050 [2], underscoring the contribution of NbSs in meeting critical climate milestones.
Our findings indicate that the AIT can achieve its net-zero emission target earlier than Thailand as a whole, which aims for carbon neutrality by 2050 and net-zero emissions by 2065. This contrast underscores the potential effectiveness of tailored NbS strategies at the institutional level, highlighting the role of small-scale urban initiatives in contributing to broader national and global sustainability goals.

4. Policy Implications

4.1. Strategic Implications for Net-Zero Goals

While net-zero emissions may not be achieved by 2030 under the retrospective and stable baselines of the three scenarios, projections suggest it will be realized shortly thereafter. Fast-growing species have demonstrated significant potential for rapid carbon sequestration, strategically positioning Scenario 1 as the most effective approach, followed by bamboo (Scenario 2) and slow-growing species (Scenario 3), respectively. However, when considering the ambition of achieving net-zero more quickly, fast-growing species serve as the cornerstone for the Asian Institute of Technology in reaching its ambitious net-zero emissions target by 2033.5 under a stable baseline. This scenario’s success hinges on the development of comprehensive, well-articulated action plans that not only focus on maximizing carbon removal efficiencies but also integrate holistic environmental management practices. Engaging stakeholders through participatory processes in the selection of suitable tree species and effective management strategies is critical. These plans should also prioritize the integration of multipurpose land use that balances ecological health with educational and community activities, enriching the campus life and fostering a deeper connection between students and their environment. Furthermore, promoting active participation in tree-planting and other sustainability-oriented events can enhance community involvement and raise environmental awareness, turning the campus into a living lab for sustainability and ecological studies. These initiatives are not just beneficial for carbon sequestration but also serve as vital educational tools that prepare students to become future leaders in sustainability [5,68].

4.2. Financial Feasibility and Policy Support

The costs associated with implementing NbSs, primarily those related to plant procurement and maintenance, can be effectively managed through the utilization of existing campus resources and the strategic engagement of the university community. The potential revenues generated from carbon credits offer a significant opportunity to offset initial expenditures, enhancing the financial viability of these projects. Aligning these NbS initiatives with Thailand’s Nationally Determined Contributions (NDCs) and global environmental frameworks, such as the COP26 resolutions, not only underscores their strategic importance but also positions the AIT as a leader in sustainable campus management and climate action. This alignment is critical, as it leverages policy support to foster institutional commitments to sustainability, ensuring that the initiatives receive the necessary backing and recognition at both the national and international levels. Adding to this, the Baku Finance Goal and the financial commitments made at COP29 provide a significant opportunity. These international climate finance commitments, such as the agreement to mobilize USD 300 billion annually by 2035 for climate action in developing countries, can be leveraged to support the implementation of NbSs on the AIT campus.
To maintain the momentum and effectiveness of these strategies, ongoing adaptation driven by the latest research and policy developments is essential. Such continuous refinement will ensure that the university’s sustainability efforts remain aligned with evolving global climate goals and continue to set benchmarks for environmental responsibility in higher education [69,70].

4.3. Environmental Education Aspect

Incorporating nature-based solutions into the campus’s net-zero emission strategy provides a unique opportunity for environmental education. The AIT’s commitment to improving urban forest management, forest restoration, and utilizing biochar applications aligns with the university’s sustainability goals and offers real-world, hands-on learning opportunities for students. By transforming the campus into a living laboratory, the AIT can actively engage students in practical sustainability practices, including tree planting, biodiversity monitoring, and environmental stewardship. For example, the study’s findings on the carbon sequestration potential of improved urban forest management, different species—such as fast-growing species, bamboo, and slow-growing species, and soil carbon biochar—can be used as case studies to deepen students’ understanding of how ecological restoration and sustainable land management contribute to climate change mitigation. Actively involving students in monitoring and evaluating the progress of NbS initiatives, as shown in this study, will strengthen their awareness and commitment to addressing climate change. These actions provide students with valuable learning experiences that will equip them to become future leaders in climate action and sustainability, while supporting the AIT’s long-term net-zero emissions target.

5. Conclusions

This study provides valuable insights into achieving net-zero emissions through tailored nature-based solutions (NbSs) at the Asian Institute of Technology (AIT) campus. Our findings highlight the crucial roles of NbS and circular economy practices, such as enhanced urban forest management, strategic species selection, and biochar application, in achieving net-zero emissions while enhancing biodiversity and ecosystem resilience. By integrating these strategies, the AIT can contribute to carbon neutrality ahead of Thailand’s national target of 2065, showcasing the potential of targeted NbS interventions at the institutional level. Beyond this local case study, these strategies are adaptable and replicable in diverse urban contexts, including educational institutions and community green spaces, globally. Their scalability depends on strategic policy integration, stakeholder engagement, and capacity building, aligning localized actions with broader sustainability goals. Collectively, institutional-level net-zero initiatives can significantly contribute to achieving the UN’s Sustainable Development Goals (SDGs) and the Paris Agreement targets. Additionally, this study demonstrates how circular economy practices, such as nutrient recycling through biochar and the strategic selection of fast-growing and bamboo species, maximize carbon sequestration while enhancing ecosystem health and productivity, exemplifying the circular flow of resources.
Despite challenges such as resource constraints, policy barriers, and the need for continuous monitoring, this study underscores the transformative potential of NbSs in urban sustainability transitions. Addressing these challenges requires innovative approaches, cross-sector collaboration, and supportive policy frameworks. Public–private partnerships and digital tools, such as remote sensing and IoT-based monitoring, can enhance transparency and accountability, ensuring the effective implementation and verification of carbon sequestration. Moreover, successful upscaling depends on customizing NbS strategies to local contexts, considering cultural, ecological, and socio-economic factors. This calls for adaptive governance models that promote stakeholder participation and the co-creation of solutions, ensuring social acceptance and environmental sustainability. Educational institutions play a crucial role in fostering environmental stewardship and climate literacy, serving as living laboratories for sustainability innovations. By presenting a replicable model that aligns with circular economy principles, this study advances urban carbon management and contributes to sustainable campus operations. Future research should explore long-term impacts, cost-effectiveness, and stakeholder perceptions to enhance NbS scalability and effectiveness. Comparative studies across different geographic regions would provide valuable insights into contextual factors influencing the success of NbSs, accelerating the transition to net-zero emissions and reinforcing the role of small institutions in achieving global sustainability targets.

Author Contributions

Conceptualization, R.P. and N.S.; methodology, R.P. and N.S.; software, R.P.; validation, R.P. and N.S.; formal analysis, R.P.; investigation, N.S.; resources, R.P.; data curation, R.P.; writing—original draft preparation, R.P.; writing—review and editing, R.P. and N.S.; visualization, R.P.; supervision, N.S., T.W.T., I.A. and E.W. All authors have read and agreed to the published version of the manuscript.

Funding

This research received no external funding.

Data Availability Statement

Data is available upon request.

Conflicts of Interest

The authors declare no conflicts of interest.

Abbreviations

The following abbreviations are used in this manuscript:
IUFMImproved Urban Forest Management
FPFsFast-Growing Species
BPFsBamboo Species
SPFsSlow-Growing Species
MgMegagram: 1 Mg is equivalent to 1 ton (t)
AITThe Asian Institute of Technology

References

  1. Intergovernmental Panel on Climate Change (IPCC) (Ed.) Climate Change 2022—Mitigation of Climate Change: Working Group III Contribution to the Sixth Assessment Report of the Intergovernmental Panel on Climate Change; Cambridge University Press: Cambridge, UK, 2023; pp. 149–150. [Google Scholar] [CrossRef]
  2. United Nations Environment Programme. Emissions Gap Report 2023: Broken Record—Temperatures Hit New Highs, Yet World Fails to Cut Emissions (Again); UNEP: Nairobi, Kenya, 2023. [Google Scholar] [CrossRef]
  3. United Nations. The United Nations Decade on Ecosystem Restoration; United Nations: New York, NY, USA, 2021; Available online: https://wedocs.unep.org/bitstream/handle/20.500.11822/31813/ERDStrat.pdf?sequence=1&isAllowed=y (accessed on 15 May 2024).
  4. United Nations. The Sustainable Development Goals Report 2023: Special Edition; United Nations: New York, NY, USA, 2023; Available online: https://unstats.un.org/sdgs/report/2023/ (accessed on 15 May 2024).
  5. DGB Group N.V. Carbon Removal: Nature-Based Solutions for Companies; DGB Group N.V.: Lelystad, The Netherlands, 2023; Available online: https://www.green.earth/blog/carbon-removal-nature-based-solutions-for-companies (accessed on 6 February 2023).
  6. Sasaki, N.; Myint, Y.Y.; Abe, I.; Venkatappa, M. Predicting carbon emissions, emissions reductions, and carbon removal due to deforestation and plantation forests in Southeast Asia. J. Clean. Prod. 2021, 312, 127728. [Google Scholar] [CrossRef]
  7. Lefebvre, D.; Williams, A.; Meersmans, J.; Kirk, G.J.; Sohi, S.; Goglio, P.; Smith, P. Modelling the potential for soil carbon sequestration using biochar from sugarcane residues in Brazil. Sci. Rep. 2020, 10, 19479. [Google Scholar] [CrossRef] [PubMed]
  8. Geissdoerfer, M.; Savaget, P.; Bocken, N.M.P.; Hultink, E.J. The Circular Economy—A new sustainability paradigm? J. Clean. Prod. 2017, 143, 757–768. [Google Scholar] [CrossRef]
  9. Kirchherr, J.; Reike, D.; Hekkert, M. Conceptualizing the circular economy: An analysis of 114 definitions. Resour. Conserv. Recycl. 2018, 127, 221–232. [Google Scholar] [CrossRef]
  10. Stahel, W.R. The Circular Economy: A User’s Guide; Routledge: London, UK, 2019. [Google Scholar]
  11. Sasaki, N. Timber production and carbon emission reductions through improved forest management and substitution of fossil fuels with wood biomass. Resour. Conserv. Recycl. 2021, 173, 105737. [Google Scholar] [CrossRef]
  12. Kiehle, J.; Kopsakangas-Savolainen, M.; Hilli, M.; Pongrácz, E. Carbon footprint at institutions of higher education: The case of the University of Oulu. J. Environ. Manag. 2023, 329, 117056. [Google Scholar] [CrossRef] [PubMed]
  13. Valls-Val, K.; Bovea, M.D. Carbon footprint in higher education institutions: A literature review and prospects for future research. Clean Technol. Environ. Policy 2021, 23, 2523–2542. [Google Scholar] [CrossRef]
  14. Li, D.; Mu, H.; Gao, Y.; Lu, M.; Liu, C. A GIS-based analysis of the carbon-oxygen balance of urban forests in the southern mountainous area of Jinan, China. Sustainability 2022, 14, 16135. [Google Scholar] [CrossRef]
  15. Sommeechai, M.; Wachrinrat, C.; Dell, B.; Thangtam, N.; Srichaichana, J. Ecological structure of a tropical urban forest in the Bang Kachao Peninsula, Bangkok. Forests 2018, 9, 36. [Google Scholar] [CrossRef]
  16. O’Flynn, C.; Seymour, V.; Crawshaw, J.; Parrott, T.; Reeby, C.; Silva, S.R.P. The road to net zero: A case study of innovative technologies and policy changes used at a medium-sized university to achieve zero by 2030. Sustainability 2021, 13, 9954. [Google Scholar] [CrossRef]
  17. Wang, L.; Yan, X.; Fang, M.; Song, H.; Hu, J. A systematic design framework for zero carbon campuses: Investigating the Shanghai Jiao Tong University Fahua Campus case. Sustainability 2023, 15, 7975. [Google Scholar] [CrossRef]
  18. RtZ Campaign Team; RtZ Partners. Race to Zero 2023 Progress Report; UN Climate Change High-Level Champions; United Nations Framework Convention on Climate Change: Bonn, Germany, 2023; Available online: https://climatechampions.unfccc.int/system/race-to-zero/ (accessed on 15 May 2024).
  19. Office of Natural Resources and Environmental Policy and Planning, Ministry of Natural Resources and Environment. Long-Term Low Greenhouse Gas Emission Development Strategy (Revised Version); Office of Natural Resources and Environmental Policy and Planning: Bangkok, Thailand, 2022. [Google Scholar]
  20. Lozano, R.; Ceulemans, K.; Seatter, C.S. Teaching sustainability in European higher education institutions: Assessing the connections between competences and pedagogical approaches. Sustainability 2020, 11, 1602. [Google Scholar] [CrossRef]
  21. Leal Filho, W.; Shiel, C.; Paço, A. Integrative approaches to environmental education: An overview of university initiatives in sustainability. J. Clean. Prod. 2021, 312, 127382. [Google Scholar] [CrossRef]
  22. Barth, M.; Rieckmann, M. Developing key competencies in sustainability through environmental education. Int. J. Sustain. High. Educ. 2016, 17, 487–505. [Google Scholar] [CrossRef]
  23. Song, Y.; Aryal, J.; Tan, L.; Jin, L.; Gao, Z.; Wang, Y. Comparison of changes in vegetation and land cover types between Shenzhen and Bangkok. Land Degrad. Dev. 2020, 32, 1192–1204. [Google Scholar] [CrossRef]
  24. World Resources Institute (WRI); World Business Council for Sustainable Development (WBCSD). Technical Guidance for Calculating Scope 3 Emissions: Supplement to the Corporate Value Chain (Scope 3) Accounting & Reporting Standard; WRI: Washington, DC, USA; WBCSD: Geneva, Switzerland, 2013. [Google Scholar]
  25. World Resources Institute (WRI); World Business Council for Sustainable Development (WBCSD). The Greenhouse Gas Protocol: A Corporate Accounting and Reporting Standard; WRI: Washington, DC, USA; WBCSD: Geneva, Switzerland, 2004. [Google Scholar]
  26. Thailand Greenhouse Gas Management Organization. Emission Factor; Thailand Greenhouse Gas Management Organization: Bangkok, Thailand, 2022; Available online: https://bit.ly/4aF5ut0 (accessed on 6 February 2023).
  27. myclimate. Calculation Principles—Flight Emissions Calculator; myclimate: Zürich, Switzerland, 2023; Available online: https://www.myclimate.org/en/information/about-myclimate/downloads/flight-emission-calculator/ (accessed on 17 February 2023).
  28. Klein, D.; Höllerl, S.; Blaschke, M.; Schulz, C. The contribution of managed and unmanaged forests to climate change mitigation—A model approach at stand level for the main tree species in Bavaria. Forests 2013, 4, 43–69. [Google Scholar] [CrossRef]
  29. Lewis, S.L.; Lopez-Gonzalez, G.; Sonké, B.; Affum-Baffoe, K.; Baker, T.R.; Ojo, L.O.; Wöll, H. Increasing carbon storage in intact African tropical forests. Nature 2009, 457, 1003–1006. [Google Scholar] [CrossRef]
  30. Brown, S. Estimating Biomass and Biomass Change of Tropical Forests: A Primer; FAO Forestry Paper 134; Food and Agriculture Organization: Rome, Italy, 1997. [Google Scholar]
  31. Chave, J.; Andalo, C.; Brown, S.; Cairns, M.A.; Chambers, J.Q.; Eamus, D.; Yamakura, T. Tree allometry and improved estimation of carbon stocks and balance in tropical forests. Oecologia 2005, 145, 87–99. [Google Scholar] [CrossRef]
  32. Huy, B.; Poudel, K.P.; Kralicek, K.; Hung, N.D.; Khoa, P.V.; Phuong, V.T.; Temesgen, H. Allometric equations for estimating tree aboveground biomass in tropical dipterocarp forests of Vietnam. Forests 2016, 7, 180. [Google Scholar] [CrossRef]
  33. Reyes, G.; Brown, S.; Chapman, J.; Lugo, A.E. Wood Densities of Tropical Tree Species: General Technical Report SO-88; Forest Service Southern Forest Station, United States Department of Agriculture: New Orleans, LA, USA, 1992. [Google Scholar]
  34. Sands, R. Forestry in a Global Context; CABI: Wallingford, UK, 2013. [Google Scholar] [CrossRef]
  35. Kim Phat, N.; Knorr, W.; Kim, S. Appropriate measures for conservation of terrestrial carbon stocks—Analysis of trends of forest management in Southeast Asia. For. Ecol. Manag. 2004, 191, 283–299. [Google Scholar] [CrossRef]
  36. Christian, C.; Pye-Smith, C. Fast-Wood Forestry: Myths and Realities; CIFOR: Bogor Barat, Indonesia, 2003. [Google Scholar]
  37. Pandey, D.; Brown, C. Teak: A global overview. UNASYLVA-FAO 2000, 3, 3–13. [Google Scholar] [CrossRef]
  38. Chayaporn, P.; Sasaki, N.; Venkatappa, M.; Abe, I. Assessment of the overall carbon storage in a teak plantation in Kanchanaburi Province, Thailand—Implications for carbon-based incentives. Clean Environ. Syst. 2021, 2, 100023. [Google Scholar] [CrossRef]
  39. Khun, V.; Sasaki, N. Re-assessment of forest carbon balance in Southeast Asia: Policy implications for REDD+. Low Carbon Econ. 2014, 5, 153. [Google Scholar] [CrossRef]
  40. IPCC. IPCC Guidelines for National Greenhouse Gas Inventories; Eggleston, H.S., Ed.; National Greenhouse Gas Inventories Programme, IGES: Hayama, Japan, 2006. [Google Scholar]
  41. FAO. Global Planted Forest Thematic Study: Results and Analysis; Del Lungo, A., Ball, J., Carle, L., Eds.; Planted Forests and Trees Working Paper 38; FAO: Rome, Italy, 2006. [Google Scholar]
  42. FAO. Planted Forest Database: Analysis of Annual Planting Trends and Silvicultural Parameters for Commonly Planted Species; Del Lungo, A., Ed.; Planted Forests and Trees Working Papers, Working Paper 26; Forest Resources Development Service, Forest Resources Division, FAO: Rome, Italy, 2003. [Google Scholar]
  43. Yen, T.M.; Sun, P.K.; Li, L.E. Predicting aboveground biomass and carbon storage for Ma bamboo (Dendrocalamus latiflorus Munro) plantations. Forests 2023, 14, 854. [Google Scholar] [CrossRef]
  44. Banuwa, I.S.; Utomo, M.; Yusnaini, S.; Riniarti, M.; Sanjaya, P.; Suroso, E.; Hidayat, W. Estimation of the above- and below-ground carbon stocks in University of Lampung, Indonesia. Biodiversitas J. Biol. Divers. 2019, 20, 676–681. [Google Scholar] [CrossRef]
  45. Helen, J.M.; Gasparatos, A. Land use change, carbon stocks, and tree species diversity in green spaces of a secondary city in Myanmar, Pyin Oo Lwin. PLoS ONE 2019, 14, e0225331. [Google Scholar] [CrossRef]
  46. Narang, V. Managing University Campus Forest for Climate Change Mitigation: A Case Study of the AIT Campus. Master’s Thesis, Asian Institute of Technology (AIT), Pathum Thani, Thailand, 2017. [Google Scholar]
  47. Liu, Y.H.; Yen, T.M. Assessing aboveground carbon storage capacity in bamboo plantations with various species related to its affecting factors across Taiwan. For. Ecol. Manag. 2021, 481, 118745. [Google Scholar] [CrossRef]
  48. Amoah, M.; Assan, F.; Dadzie, P.K. Aboveground biomass, carbon storage, and fuel values of Bambusa vulgaris, Oxynanteria abyssinica, and Bambusa vulgaris var. vitata plantations in the Bobiri Forest Reserve of Ghana. J. Sustain. For. 2020, 39, 113–136. [Google Scholar] [CrossRef]
  49. Devi, A.S.; Singh, K.S. Carbon storage and sequestration potential in aboveground biomass of bamboos in Northeast India. Sci. Rep. 2021, 11, 837. [Google Scholar] [CrossRef]
  50. Sohel, M.S.I.; Alamgir, M.; Akhter, S.; Rahman, M. Carbon storage in a bamboo (Bambusa vulgaris) plantation in the degraded tropical forests: Implications for policy development. Land Use Policy 2015, 49, 142–151. [Google Scholar] [CrossRef]
  51. Zheng, X.; Lin, S.; Fu, H.; Wan, Y.; Ding, Y. The bamboo flowering cycle sheds light on flowering diversity. Front. Plant Sci. 2020, 11, 381. [Google Scholar] [CrossRef] [PubMed]
  52. Kaosa-ard, A. Overview of Problems in Teak Plantation Establishment; RAP Publication (FAO): Bangkok, Thailand, 1998; Available online: https://www.fao.org/3/ac773e/ac773e08.htm#TopOfPage (accessed on 5 February 2023).
  53. Gourlay, I.D. Growth ring characteristics of some African Acacia species. J. Trop. Ecol. 1995, 11, 121–140. [Google Scholar] [CrossRef]
  54. Lugato, E.; Bampa, F.; Panagos, P.; Montanarella, L.; Jones, A. Potential carbon sequestration of European arable soils estimated by modelling a comprehensive set of management practices. Glob. Change Biol. 2014, 20, 3557–3567. [Google Scholar] [CrossRef] [PubMed]
  55. Kavindi, G.A.G.; Tang, L.; Sasaki, Y. Assessing GHG emission reduction in biomass-derived biochar production via slow pyrolysis: A cradle-to-gate LCA approach. Resour. Conserv. Recycl. 2025, 212, 107900. [Google Scholar] [CrossRef]
  56. Hornung, A.; Stenzel, F.; Grunwald, J. Biochar—Just a black matter is not enough. Biomass Convers. Biorefin. 2024, 14, 5889–5900. [Google Scholar] [CrossRef]
  57. Henry, M.; Besnard, A.; Asante, W.A.; Eshun, J.; Adu-Bredu, S.; Valentini, R.; Saint-André, L. Wood density, phytomass variations within and among trees, and allometric equations in a tropical rainforest of Africa. For. Ecol. Manag. 2010, 260, 1375–1388. [Google Scholar] [CrossRef]
  58. Kim, J.E.; Bhatia, S.K.; Song, H.J.; Yoo, E.; Jeon, H.J.; Yoon, J.Y.; Choi, Y.K. Adsorptive removal of tetracycline from aqueous solution by maple leaf-derived biochar. Bioresour. Technol. 2020, 306, 123092. [Google Scholar] [CrossRef] [PubMed]
  59. Ahmed, A.; Bakar, M.S.A.; Azad, A.K.; Sukri, R.S.; Phusunti, N. Intermediate pyrolysis of Acacia cincinnata and Acacia holosericea species for bio-oil and biochar production. Energy Convers. Manag. 2018, 176, 393–408. [Google Scholar] [CrossRef]
  60. Gupta, G.K.; Mondal, M.K. Bio-energy generation from Sagwan sawdust via pyrolysis: Product distributions, characterizations, and optimization using response surface methodology. Energy 2019, 170, 423–437. [Google Scholar] [CrossRef]
  61. Sahoo, S.S.; Vijay, V.K.; Chandra, R.; Kumar, H. Production and characterization of biochar produced from slow pyrolysis of pigeon pea stalk and bamboo. Clean. Eng. Technol. 2021, 3, 100101. [Google Scholar] [CrossRef]
  62. Aina, O. Wood waste utilization for energy generation. In Proceedings of the International Conference on Renewable Energy for Developing Countries, Forestry, Bangkok, Thailand, 21–23 November 2006. [Google Scholar]
  63. Etoh, H.; Sasaki, N.; Chay, S.; Ninomiya, H. Carbon emission reduction potentials through thinned wood in Japan. Iforest-Biogeosciences For. 2011, 4, 107. [Google Scholar] [CrossRef]
  64. Ridhosari, B.; Rahman, A. Carbon footprint assessment at Universitas Pertamina from the scope of electricity, transportation, and waste generation: Toward a green campus and promotion of environmental sustainability. J. Clean. Prod. 2020, 246, 119172. [Google Scholar] [CrossRef]
  65. Singkran, N. Carbon sink capacity of public parks and carbon sequestration efficiency improvements in a dense urban landscape. Environ. Monit. Assess. 2022, 194, 750. [Google Scholar] [CrossRef] [PubMed]
  66. Febiriyanti, A.; Pradana, D.H.; Putrika, A. Estimation of carbon stocks from tree stands vegetation in Universitas Indonesia’s urban forest, Depok. J. Phys. Conf. Ser. 2021, 1725, 012043. [Google Scholar] [CrossRef]
  67. Yin, J.; Zhao, L.; Xu, X.; Li, D.; Qiu, H.; Cao, X. Evaluation of long-term carbon sequestration of biochar in soil with biogeochemical field model. Sci. Total Environ. 2022, 822, 153576. [Google Scholar] [CrossRef]
  68. Xiao, L.; Feng, L.; Yuan, G.; Wei, J. Low-cost field production of biochars and their properties. Environ. Geochem. Health 2020, 42, 1569–1578. [Google Scholar] [CrossRef]
  69. Carbon Credits. Carbon Prices Today; Carbon Credits: Broadway, NY, USA, 2024; Available online: https://carboncredits.com/carbon-prices-today/ (accessed on 10 May 2024).
  70. Ecosystem Marketplace. New State of the Voluntary Carbon Markets 2023 Finds VCM Demand Concentrating Around Pricier High Integrity Credits; Ecosystem Marketplace: Washington, DC, USA, 2023; Available online: https://www.ecosystemmarketplace.com/articles/new-state-of-the-voluntary-carbon-markets-2023-finds-vcm-demand-concentrating-around-pricier-high-integrity-credits/ (accessed on 10 May 2024).
Figure 1. Map of study site at the Asian Institute of Technology in Pathumthani province, Thailand. Source: Map created by the authors from 870 drone-captured images.
Environments 12 00090 g001
Figure 2. Schematic diagram of forest restoration management.
Environments 12 00090 g002
Figure 3. Illustration of the total growing stock calculations per restoration scenarios. Note for Figure 3: Per the restoration scenarios, the carbon stocks (CSs) at time t are equal to the accumulated MAI at time t multiplied by the area of the forest. The accumulated MAI from time t 0 to t 1 is equal to the difference in MAI between time t 1 and t 0 , divided by the difference in time between t 1 and t 0 . For FPFs and BPFs, the CS in a thinned wood for every 6-year rotation is equal to the CS at time t 6 minus the CS at time t 0 . While the CS in a thinned wood for every 35-year rotation SPF is equal to the CS at time t 35 minus the CS at time t 0 . Given the extended lifespan of SPFs, the following two critical thinning processes are incorporated into the management plan: pre-commercial thinning in the 15th year and commercial thinning in the 25th year (Figure 2). The CS in a thinned wood at time t 15 is equal to 30% of the CS in an SPF at time t 15 and the CS in a thinned wood at time t 25 is equal to 20% of the CS in an SPF at time t 25 .
Environments 12 00090 g003
Figure 4. Carbon sequestration overview: additionality from improved urban forest management (a), carbon removal by species type—fast-growing, bamboo, and slow-growing (b), soil carbon biochar removals (c), and biochar yield from harvested wood in various forest management and restoration scenarios (d).
Environments 12 00090 g004aEnvironments 12 00090 g004b
Figure 5. Pathways to net-zero: carbon emissions, removals, and net emissions under the stable baseline for Scenario 1 (including improved urban forest management, restoration with fast-growing species, and biochar application) (a), Scenario 2 (including improved urban forest management, restoration with bamboo species, and biochar application) (b), and Scenario 3 (including improved urban forest management, restoration with slow-growing species, and biochar application) (c).
Environments 12 00090 g005
Figure 6. Pathways to net-zero: carbon emissions, removals, and net emissions under the retrospective baseline for Scenario 1 (including improved urban forest management, restoration with fast-growing species, and biochar application) (a), Scenario 2 (including improved urban forest management, restoration with bamboo species, and biochar application) (b), and Scenario 3 (including improved urban forest management, restoration with slow-growing species, and biochar application) (c).
Environments 12 00090 g006
Table 1. Activity data and emission factors by scopes at the AIT campus in 2022.
Description2022 QuantityEmission FactorEmission Reference
Scope 1
Gasohol/AIT vehicles17,680.85 (Ltr)2.7406 (kgCO2e/Ltr)[26]
Diesel186.6 (kg)1760 (kgCO2e/kg)
R-22/Air conditioners a40.8 (kg)1300 (kgCO2e/kg)
R-134a/Chiller a695 (Ltr)1.7306 (kgCO2e/Ltr)
LPG residence14,234.08 (Ltr)2.1894 (kgCO2e/Ltr)
Scope 2
Electricity/campus consumption10,184,128 kWh0.4999 (kgCO2e/kWh)
Scope 3
Wet wastes65,474 (kg)2.53 (kgCO2e/kg)
Dry wastes/landfill266,687 (kg)0.30 (kgCO2e/kg)
Wastewater155,887 (m3)0.09 (kgCO2e/m3)
Paper317,400 (kg)2.93 (kgCO2e/kg)
PWA water b45,329 (m3)0.54 (kgCO2e/m3)
Official air travel c728,285.66 (km)
Official road travel to other provinces d35,973.95 (km)
Community commuting e
Procurement f
Source: Data reported by the AIT—Office of Facilities and Asset Management (OFAM), 2023. Note for Table 1: a R-22 (Chlorodifluoromethane), a common refrigerant, is widely used in various refrigeration and air-conditioning applications. R-134a (1,1,1,2-Tetrafluoroethane) is commonly used as a refrigerant in automotive air conditioning systems and domestic refrigeration. b PWA water refers to water purchased from the Provincial Waterworks Authority (PWA) for campus use. c The calculation method and emission factor for the data are based on guidelines from [27]. d Emissions from official road travel to other provinces are calculated by multiplying the traveled distance by the fuel consumption rate and the emission factor [(km × L/km × kgCO2e/L)/1000 = MgCO2e]. The emission factor is sourced from TGO Thailand. e Emissions from community commuting are derived from the travel of faculty, staff, and students using diesel and gasoline vehicles. The total emissions are calculated as the sum of emissions from each vehicle type, involving the multiplication of the traveled distance, fuel consumption rate, and emission factor [(km × L/km × kgCO2e/L)/1000 = MgCO2e] for each vehicle category. f The emissions from procurement are calculated from a variety of items: software, raw materials, plastic, rubber, paper, stationary, electronics, service fees, furniture, sanitation and repair maintenance, cosmetics, feed and food, medicine, and petroleum by-products (paints and engine oil). The total emissions are calculated by multiplying the quantity of each item by its respective emission factor, with references to the relevant literature.
Table 2. Population data over the past fifteen years at the AIT campus (new and continuing students, faculty, and staff) from 2008 to 2022.
YearNew and Continuing StudentsFacultyResearch and Support StaffTotal
200822891235862998
200923641235863073
201022391815863006
201121481735862907
201220711495862806
201317971715862554
201422393065863131
201522162745863076
201621921665862944
201720991475862832
201819141505862650
201917351305862451
202020631225862771
202129391275863652
202224731275863186
Source: AIT—Annual Reports, 2008–2022. Note for Table 2: Due to the unavailability of specific staff data for each year in the past, we have used a constant figure of 586 (2022 data) for all years for simplicity.
Table 3. Description of specific assumptions behind each intervention for carbon removals in this study.
InterventionDescriptionLand Availability
Improved Urban Forest
Management
Maintains the campus forest to increase carbon stocks, involving activities like watering, fertilization, pest control, pruning, replanting, and the removal of potential danger from aging trees [28].20 ha
Forest RestorationRestores the campus landscape by planting new trees, considering the following three scenarios: fast-growing species, bamboo species, and slow-growing species, aiming to gain more carbon stocks [6].30 ha
Biochar ApplicationApplies biochar made from wood residues to soil to capture carbon and improve the soil fertility, aiming to increase soil carbon biochar [7].70 ha
Source: Land availability for each intervention was measured using Google Earth Pro by the authors.
Table 5. Initial values, parameters, and variables for Equations (13)–(15).
SymbolsDescription
CSI   t 0   of   EX Initial carbon stocks (112.9 MgC ha− 1) of the existing forest (aboveground only) (author’s own calculation using the DBH and height from the forest inventory of 1231 trees).
CSI   t 0   of   IUFM Initial carbon stocks (1.5 MgC ha−1 yr−1) of the improved urban forest management (aboveground only) [29].
CSI   t 0   of   FPF Initial carbon stocks (7.9 MgC ha−1 yr−1) of restoration with fast-growing species (aboveground only) [(7.9 = 17 m3 × 0.57 Mg m−3 × 0.47 MgC Mg−1 × 1.74), where 17 m3 is average MAI of Acacia mangium and Gmelina aborea [41,42], 0.57 is the average wood density tropical tree species [26], 0.47 is the carbon fraction in the dry wood adopted for use by the IPCC [40], and 1.74 is the biomass expansion factor to include the biomass in branches and top logs [30].]
CSI   t 0   of   BPF Initial carbon stocks (4.6 MgC ha−1 yr−1) of the restoration with bamboo species (aboveground only) [(4.6 = 9.877 m3 × 0.57 Mg m−3 × 0.47 MgC Mg−1 × 1.74), where 9.877 m3 is MAI of 1-year-old Ma bamboo Dendrocalamus latiflorus Munro [43].]
CSI   t 0   of   SPF Initial carbon stocks (4.48 MgC ha−1 yr−1) of the restoration with slow-growing species (aboveground only) [(4.48 = 9.6 m3 × 0.57 Mg m−3 × 0.47 MgC Mg−1 × 1.74), where 7.5 m3 is average MAI of Tectona grandis and Swietenia macrophylla [41,42].]
CSI MAX   of   EF Maximum carbon stocks (140.78 MgC ha−1) of the existing forest based on 3 studies in the urban forest area [44,45,46].
CSI MAX   of   IUFM Maximum carbon stocks (3.69 MgC ha−1 yr−1) of the improved urban forest management (aboveground only) based on 3 species in [28].
CSI MAX   of   FPF Maximum carbon stocks (90.4 MgC ha−1 yr−1) of fast-growing species (aboveground only) based on 3 species of forest plantations (8 studies) in [39].
CSI MAX   of   BPF Maximum carbon stocks (106.5 MgC ha−1 yr−1) of bamboo species (aboveground only) based on many species (5 studies) of forest plantations (8 studies) [47,48,49,50].
CSI MAX   of   SPF Maximum carbon stocks (132.8 MgC ha−1 yr−1) of slow-growing species (aboveground only) based on 3 species of forest plantations (8 studies) in [39].
r e Growth rate of intervention e with an increasing trend ( r e can be calculated using Equation (14), where the ages at which the stands stop growing, used in this study, are as follows: 35, 20, and 80 for fast-growing, bamboo, and slow-growing species, respectively, based on [51,52,53]).
Table 6. Carbon emissions by scopes at the AIT campus (2022).
Emission Scope/CategoryEmissions (CO2e)Share (%)
Scope 1462.35.0
Gasohol/AIT vehicles31.2
Diesel48.5
R-22/Air conditioners328.4
R-134a/Chiller53.0
LPG residence1.2
Scope 25091.161.0
Electricity/campus consumption5091.1
Scope 32813.934.0
Wet wastes165.6
Dry wastes/landfill80.0
Wastewater14.0
Paper60.3
PWA water24.5
Official air travel940.0
Official road travel to other provinces13.5
Community commuting1165.52
Procurement95.7
Source: Activity data were provided by AIT-OFAM. TGO’s emission factors (EFs) for all scopes above.
Disclaimer/Publisher’s Note: The statements, opinions and data contained in all publications are solely those of the individual author(s) and contributor(s) and not of MDPI and/or the editor(s). MDPI and/or the editor(s) disclaim responsibility for any injury to people or property resulting from any ideas, methods, instructions or products referred to in the content.

