Article

Forced Degradation Study of Atazanavir, Emtricitabine, Nirmatrelvir, Oseltamivir, Ribavirin and Sofosbuvir

1
Faculty of Chemical Engineering and Technology, University of Zagreb, Trg Marka Marulića 19, 10000 Zagreb, Croatia
2
Comprehensive Water Technology d.o.o., Trg Marka Marulića 19, 10000 Zagreb, Croatia
*
Author to whom correspondence should be addressed.
Environments 2025, 12(11), 417; https://doi.org/10.3390/environments12110417
Submission received: 22 September 2025 / Revised: 31 October 2025 / Accepted: 1 November 2025 / Published: 4 November 2025
(This article belongs to the Special Issue Environmental Risk Assessment of Aquatic Environments)

Abstract

Antivirals are considered emerging environmental contaminants. Unfortunately, for many of these substances, there is limited information on their occurrence, fate, and behavior in the environment, which is essential for proper risk assessment. In this study, forced degradation tests were conducted on six widely used antivirals to assess their environmental fate. These antivirals were atazanavir, emtricitabine, nirmatrelvir, oseltamivir, ribavirin, and sofosbuvir. The tests included exposure of the antivirals to (artificial) sunlight, different temperatures, water, an acidic solution (1 M HCl), an alkaline solution (1 M NaOH) and a solution containing 30% H2O2 as a strong oxidizing agent. Liquid chromatography with UV detection (LC-UV) was used to analyze antivirals. To monitor the conversion, an LC-UV method was developed and validated for each antiviral. According to the results of the forced degradation tests, atazanavir and emtricitabine are probably the most unstable in the aquatic environment. Oseltamivir and sofosbuvir begin to lose stability even at slightly elevated temperatures, such as 40 °C. The stability of the tested antivirals depends strongly on the medium’s pH value and the presence of an oxidizing agent. Thus, all six antivirals showed some degree of degradation under the applied alkaline and oxidative conditions, while only emtricitabine, oseltamivir, and ribavirin remained stable under the applied acidic conditions.

1. Introduction

The high quality of modern life is largely due to the existence of numerous antimicrobial drugs. To date, the most intensive development of antimicrobials has occurred in the field of antibiotics, while the development of other antimicrobial drugs, such as antifungals, antiparasitics, and antivirals, has been significantly less intensive [1,2,3,4]. In the case of antivirals, the search for new active substances is particularly complex [3]. Viruses do not have the standard characteristics of living organisms [5]. They lack metabolism, so there are not many proteins and enzymes that active substances can target. In addition, although viruses cannot self-replicate (infected cells produce new copies of the virus), they have a high replication rate, which leads to rapid mutations and the emergence of resistance to existing antivirals [4]. So far, more or less effective antivirals have been developed against HIV, herpes, hepatitis, Ebola, and some other dangerous viruses [6], and recently, pharmaceutical companies have focused on finding adequate antiviral drugs for the treatment of patients with severe acute respiratory syndrome coronavirus 2 (SARS-CoV-2).
The primary goal of antivirals is to benefit human health. However, their use raises additional questions, including their occurrence, fate, and behavior in the environment. There are already reports of the presence of antivirals in the environment [7,8], and the sources from which they have entered the environment may be diverse. For example, antiviral substances can enter the environment as part of the wastewater from pharmaceutical factories that manufacture such drugs or via hospital effluents and improperly disposed medicines. Unfortunately, conventional wastewater treatment plants are usually unable to completely remove pharmaceuticals from wastewater [9,10]. The consumption of the medicines themselves can also lead to increased concentrations of these substances in the environment. This is because the human body metabolizes around 60–70% of the active pharmaceutical ingredient, while the rest is excreted and ends up in wastewater [11].
Every drug is extensively studied before it is approved for marketing. Nowadays, these studies also include an assessment of the environmental risk. However, much of this data is not publicly available because of proprietary rights [12], so the fate and behavior of such drugs in the environment remains unknown to the public. In this study, we aimed to reveal the environmental fate of six antiviral substances: atazanavir, emtricitabine, nirmatrelvir, oseltamivir, ribavirin and sofosbuvir. The chemical structures of these antiviral agents, their molecular formula and molar mass are shown in Figure 1.
Ribavirin was first developed in 1971 and has been used clinically since 1986 to treat hepatitis C and respiratory syncytial virus (RSV) [13]. However, this pyrimidine nucleoside is a broad-spectrum agent that exhibits antiviral activity against both DNA and RNA viruses. Several mechanisms of action have been proposed for this antiviral, but it most likely acts differently in different viruses [14,15]. Ribavirin was followed chronologically by oseltamivir, better known by the trade name Tamiflu. This neuraminidase inhibitor has been used since 1999 [16] to treat patients with influenza A or influenza B [17]. Atazanavir and emtricitabine were approved for use in 2003 [18]. These two antiretrovirals were originally used to treat HIV/AIDS in combination with some other antiretrovirals [19,20]. Atazanavir is a peptidomimetic protease inhibitor [21], and emtricitabine is a nucleoside reverse transcriptase inhibitor [22]. A polymerase inhibitor sofosbuvir was developed in 2010 [23] and approved for the treatment of hepatitis C in 2013 [24]. Nirmatrelvir was developed for the treatment of COVID-19 patients. It is a protease inhibitor that has been approved for clinical use in combination with a cytochrome P450 inhibitor called ritonavir; this medication has been on the market since 2022 under the brand name Paxlovid [25,26].
In this study, we decided to analyze the environmental fate of the 6 antiviral agents mentioned above. The corresponding ecotoxicological analysis was performed in one of our previous studies [27], while in this study we analyzed their environmental stability through forced degradation tests as an accelerated simulation of environmental conditions.

2. Materials and Methods

2.1. Reagents and Solutions

The standards used were atazanavir sulfate (CAS No. 229975-97-7), emtricitabine (CAS No. 143491-57-0), oseltamivir phosphate (CAS No. 204255-11-8), ribavirin (CAS No. 36791-04-5), nirmatrelvir (CAS No. 2628280-40-8) and sofosbuvir (CAS No. 1190307-88-0), all in solid form. The first four standards were obtained from Supelco (Bellefonte, PA, USA) and the remaining two from Biosynth (Staad, Switzerland).
To conduct forced degradation tests, stock solutions of individual antiviral drugs were prepared at a concentration of 0.1 mM, except for atazanavir, whose stock solution was prepared at 0.003 mM due to the low solubility of the solid standard in water.
KH2PO4 salt (≥99.5%; Alkaloid, Skopje, North Macedonia), methanol (HPLC grade; J.T. Baker, Phillipsburg, NJ, USA), formic acid (98%; Lach-Ner, Neratovice, Czech Republic) and acetonitrile (HPLC grade; Fischer Chemica Zurich, Switzerland) were used for the preparation of the mobile phases in chromatographic analyzes.
Hydrochloric acid (37%, VWR International, Radnor, PA, USA), solid NaOH (99.3%; Lach-Ner, Neratovice, Czech Republic) and hydrogen peroxide solution (30%; Gram-mol, Zagreb, Croatia) were used to prepare the stressor solutions required for the forced degradation tests.
Ultrapure water (Millipore; Merck, Rahway, NJ, USA) was used for all experiments.

2.2. Conducting Forced Degradation Tests

Various organizations have issued guidelines for conducting forced degradation tests [28], but most are based on the Q1A [29] and Q1B [30] guidelines of the International Council for Harmonization of Technical Requirements for Pharmaceuticals for Human Use (ICH). We have therefore also adhered to the ICH guidelines. Studies were carried out on thermal and photodegradation, hydrolysis in neutral, alkaline and acidic media and oxidation with hydrogen peroxide. Stock solutions with the concentrations listed in Section 2.1 were used for the degradability tests.
The SUNTEST CPS+ device (Atlas Material Testing Technology, Mount Prospect, IL, USA), containing a xenon lamp, was used to perform photolytic degradation of the antiviral agents. Each antiviral working solution was placed in a quartz container and irradiated with light at a wavelength of 300–800 nm for 6 h at room temperature. The light intensity was 600 W m−2. Samples for monitoring the degradation of the antiviral agents were taken after 0, 0.5, 1, 2, 3, 4, 5 and 6 h. To determine the actual photolytic effect, blank samples were used for comparison. Each blank sample contained a working solution of the corresponding antiviral agent, but was placed in a quartz container coated with aluminum foil to prevent photolytic degradation.
The remaining forced degradation tests were carried out in dark flasks to exclude the possibility of photolytic degradation.
For the thermal degradation tests, it was decided to carry them out at slightly elevated temperatures of 30 and 40 °C, as would be expected in the environment in summer. The tests were carried out for 7 days and the conversion of the antiviral agents was monitored after 0, 24, 48, 72, 96 and 168 h.
For the hydrolysis experiments in neutral media, the antiviral working solutions were stored at 25 °C, and the exposure time and monitoring intervals were the same as for thermal degradation: 0, 24, 48, 72, 96, and 168 h. Therefore, we also used these experiments as a reference to evaluate the effects of thermal degradation.
The experiments on hydrolytic degradation in acidic and alkaline media, as well as the experiments on oxidative degradation, were conducted at 25 °C. The ICH guidelines do not specify exact stressor conditions, but Nagasamy Venkatesh and Shanmuga Kumar [31] suggested that HCl or H2SO4 at concentrations of 0.1–1 M are suitable for acid hydrolysis, NaOH or KOH at concentrations of 0.1–1 M are suitable for base hydrolysis, and H2O2 at concentrations up to 30% is suitable for oxidation tests. We assumed that for a treatment duration of 4 h, higher stressor concentrations would be appropriate. Therefore, the stressor solutions used in this study were 1 M HCl, 1 M NaOH, and 30% H2O2. The intervals at which the conversion of the antivirals was monitored were 0, 0.5, 1, 1.5, 2, 3, and 4 h for all three tests.
For the hydrolytic degradation experiments in acidic media, the reaction mixtures were prepared by mixing 25 mL of an antiviral stock solution with 25 mL of a stressor solution.
For the hydrolytic degradation experiments in alkaline media, 40 mL of an antiviral stock solution was mixed with 10 mL of a stressor solution. Due to the low concentration of atazanavir in the stock solution, an exception was made for hydrolytic degradation experiments of atazanavir in alkaline media. In these experiments, the reaction mixture was prepared by combining 49 mL of the atazanavir stock solution with 1 mL of the stressor solution.
For the oxidative degradation experiments, 40 mL of an antiviral stock solution was combined with 10 mL of a stressor solution. Due to the low concentration of atazanavir in the stock solution, an exception was made for the atazanavir oxidative experiments, in which 45 mL of the atazanavir stock solution was mixed with 5 mL of the stressor solution.

2.3. Monitoring the Conversion of Antivirals in Forced Degradation Tests

The conversion of the antivirals during forced degradation was monitored using an LC-20ADXR liquid chromatograph with an SPD-20AV UV/Vis detector (Shimadzu, Kyoto, Japan). For this purpose, chromatographic methods providing quantitatively acceptable antiviral peaks were developed on an XBridge C18 chromatographic column, 3.5 μm, 4.6 × 150 mm (Waters, Milford, MA, USA). All developed methods had an isocratic elution. The detailed characteristics of the developed methods are listed in Table 1. The wavelengths for detection were taken from the literature [32,33,34,35,36,37]. All methods developed were validated to confirm the reliability of the results obtained.

3. Results and Discussion

This study is part of a large scientific project examining the environmental aspects of 13 antiviral drugs, listed alphabetically: atazanavir, daclatasvir, darunavir, emtricitabine, favipiravir, lopinavir, nirmatrelvir, remdesivir, ribavirin, ritonavir, oseltamivir, sofosbuvir, and umifenovir. However, this paper presents the results of forced degradation for only six of these antivirals. Due to the timing of doctoral dissertations conducted within the project, the results for the remaining seven antivirals will be presented in a future paper.

3.1. Validation of Developed LC-UV Methods

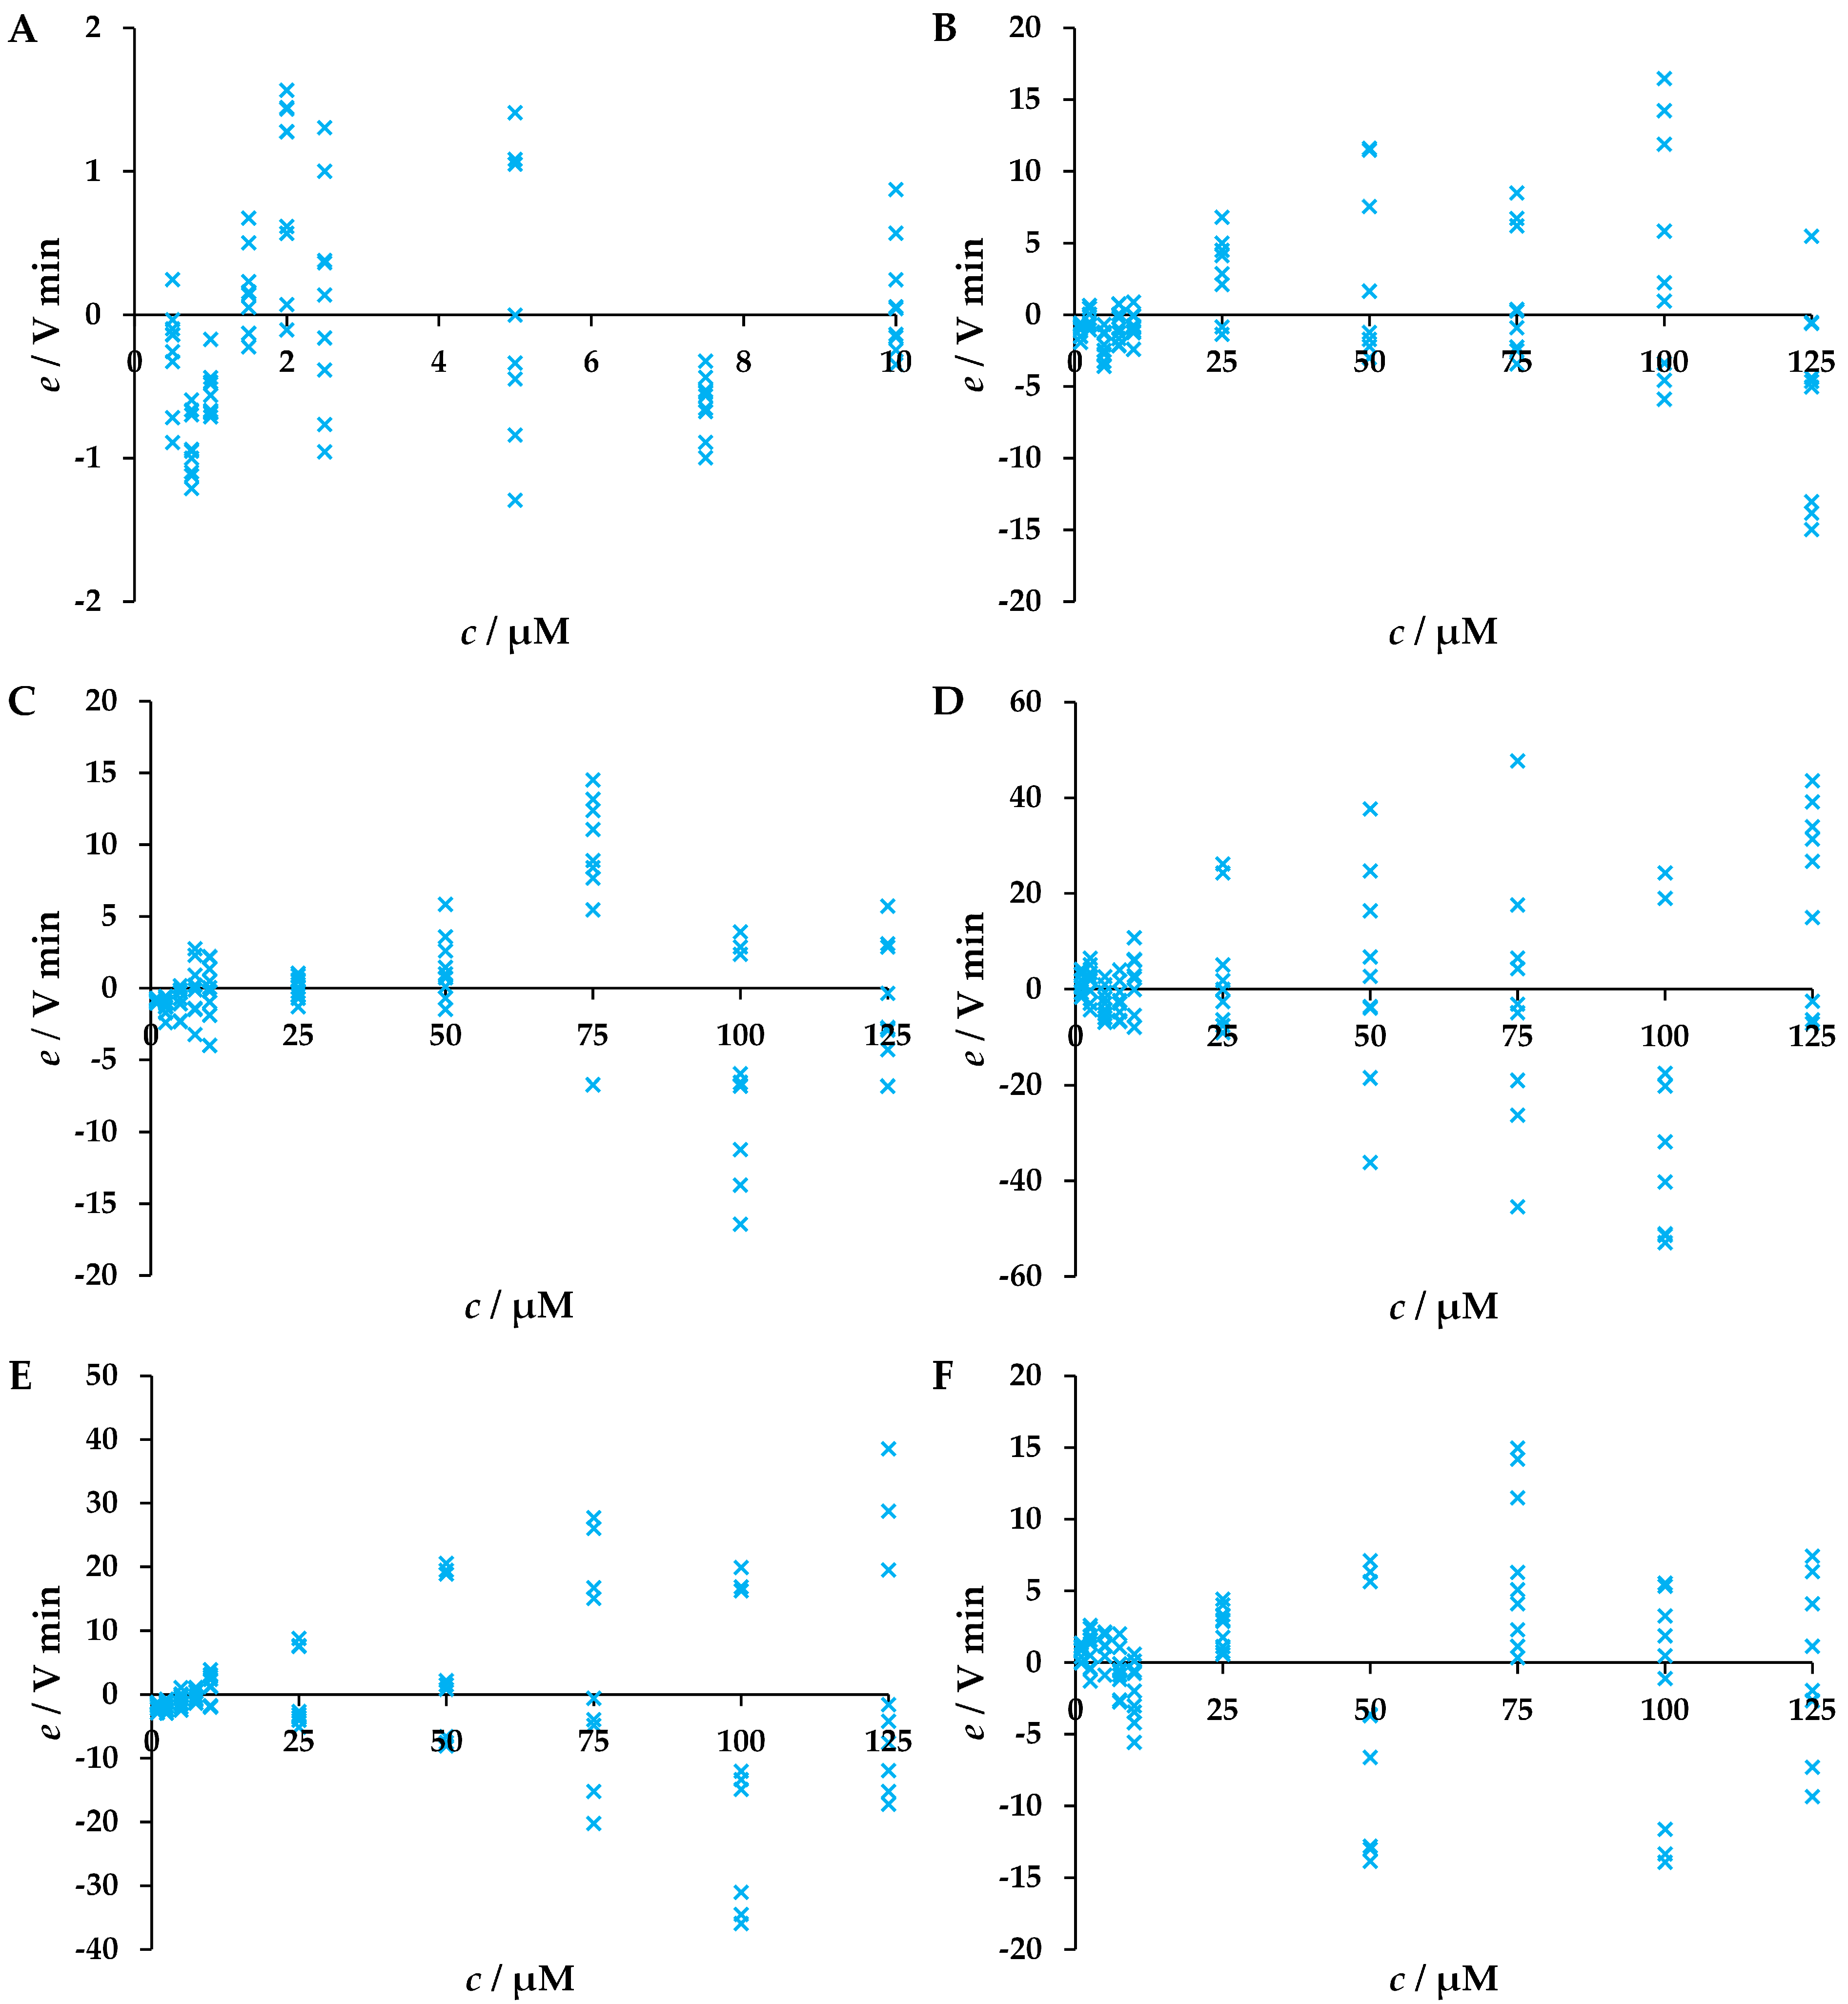
To monitor the concentration of the antivirals during the forced degradation tests, liquid chromatography with UV detection (LC-UV) was used. An LC-UV method, including a calibration line, had to be developed and validated for each antiviral. For each concentration level used to create a calibration diagram, three solutions were prepared and each of the solutions was measured three times. Originally, we had decided to perform the calibration in the concentration range of 0.0005 to 0.0100 mM for atazanavir and in the range of 0.0010 to 0.1250 mM for the other antivirals tested. However, our attempt to develop a single calibration line for each range resulted in an uneven distribution of residuals. For all antivirals tested, the residuals at lower concentrations were much closer to the line than at the higher concentrations (Figure 2). A case of atazanavir (Figure 2A) could be highlighted as it does not appear at first glance that the range of residuals is dependent on analyte concentration. However, in the case of atazanavir, the residuals at lower concentrations generally also show a smaller range of values, although this is not as pronounced as for the residual plots of the other antiviral agents tested.
In accordance with the observed discrepancy in the range of residuals at lower and higher analyte concentrations, we decided to divide each calibration range into two ranges and accordingly use two calibration lines for each antiviral drug, one line for the lower concentration range and one for the upper concentration range. Calibration lines used in the analysis of antivirals are shown in Figures S1–S6 in the Supplementary Materials, while the parameters of the developed calibration lines and the corresponding coefficients of determination (R2 values) are presented in Table 2. High R2 values were obtained for all calibration lines, indicating a strong linear correlation between the concentration of the antivirals and the response of the analytical method used.
The analysis of the accuracy of the developed LC-UV methods was evaluated by comparing the concentration values of the prepared antiviral solutions with the concentrations of the same solutions estimated from the calibration lines. A linear regression analysis was performed and the results are listed in Table 3. It can be seen that the 95% confidence interval for the intercept includes the value 0 in all cases, which means that we can say with 95% confidence that the intercept is not significantly different from 0 and none of the developed methods contains an absolute systematic error. The 95% confidence interval for the slope includes the value 1 in all cases. This means that we can say with 95% confidence that the slope does not differ significantly from 1 and that the developed methods do not contain a proportional systematic error.
The precision of the developed LC-UV methods was observed for both calibration ranges: the range of higher and the range of lower concentrations of the tested antiviral agents. It was based on the analysis of the repeatability of the measurements. The precision of the analysis of atazanavir was determined at a concentration of 0.0050 mM for the concentration range of 0.0020 to 0.0100 mM and at a concentration of 0.0010 mM for the concentration range of 0.0005 to 0.0020 mM. The precision of the analysis of the remaining five antivirals was determined at a concentration of 0.0750 mM for the concentration range from 0.0100 to 0.1250 mM and at a concentration of 0.0050 mM for the concentration range from 0.0010 to 0.0100 mM. The precision was expressed as relative standard deviation (RSD) using RSD < 5% as the acceptance criterion. It can be seen (Table 4) that all the methods developed fulfill the stated criterion.
The limit of detection (LoD) and limit of quantification (LoQ) values were determined mathematically using Equation (1) and Equation (2), respectively, where SD is the standard deviation of the nine measurements (i.e., responses) of the most dilute solution used to create the calibration line with slope a.
L o D = 3.3 S D a
L o Q = 10 S D a
We have calculated the LoD and LoQ values for the lower calibration ranges. The calculated values are listed in Table 5. It can be seen that the LoD and LoQ values are generally below the applied calibration ranges, with the exception of oseltamivir, where the calculated LoQ value was equal to the lower limit of the calibration range.

3.2. The Results of the Forced Degradation

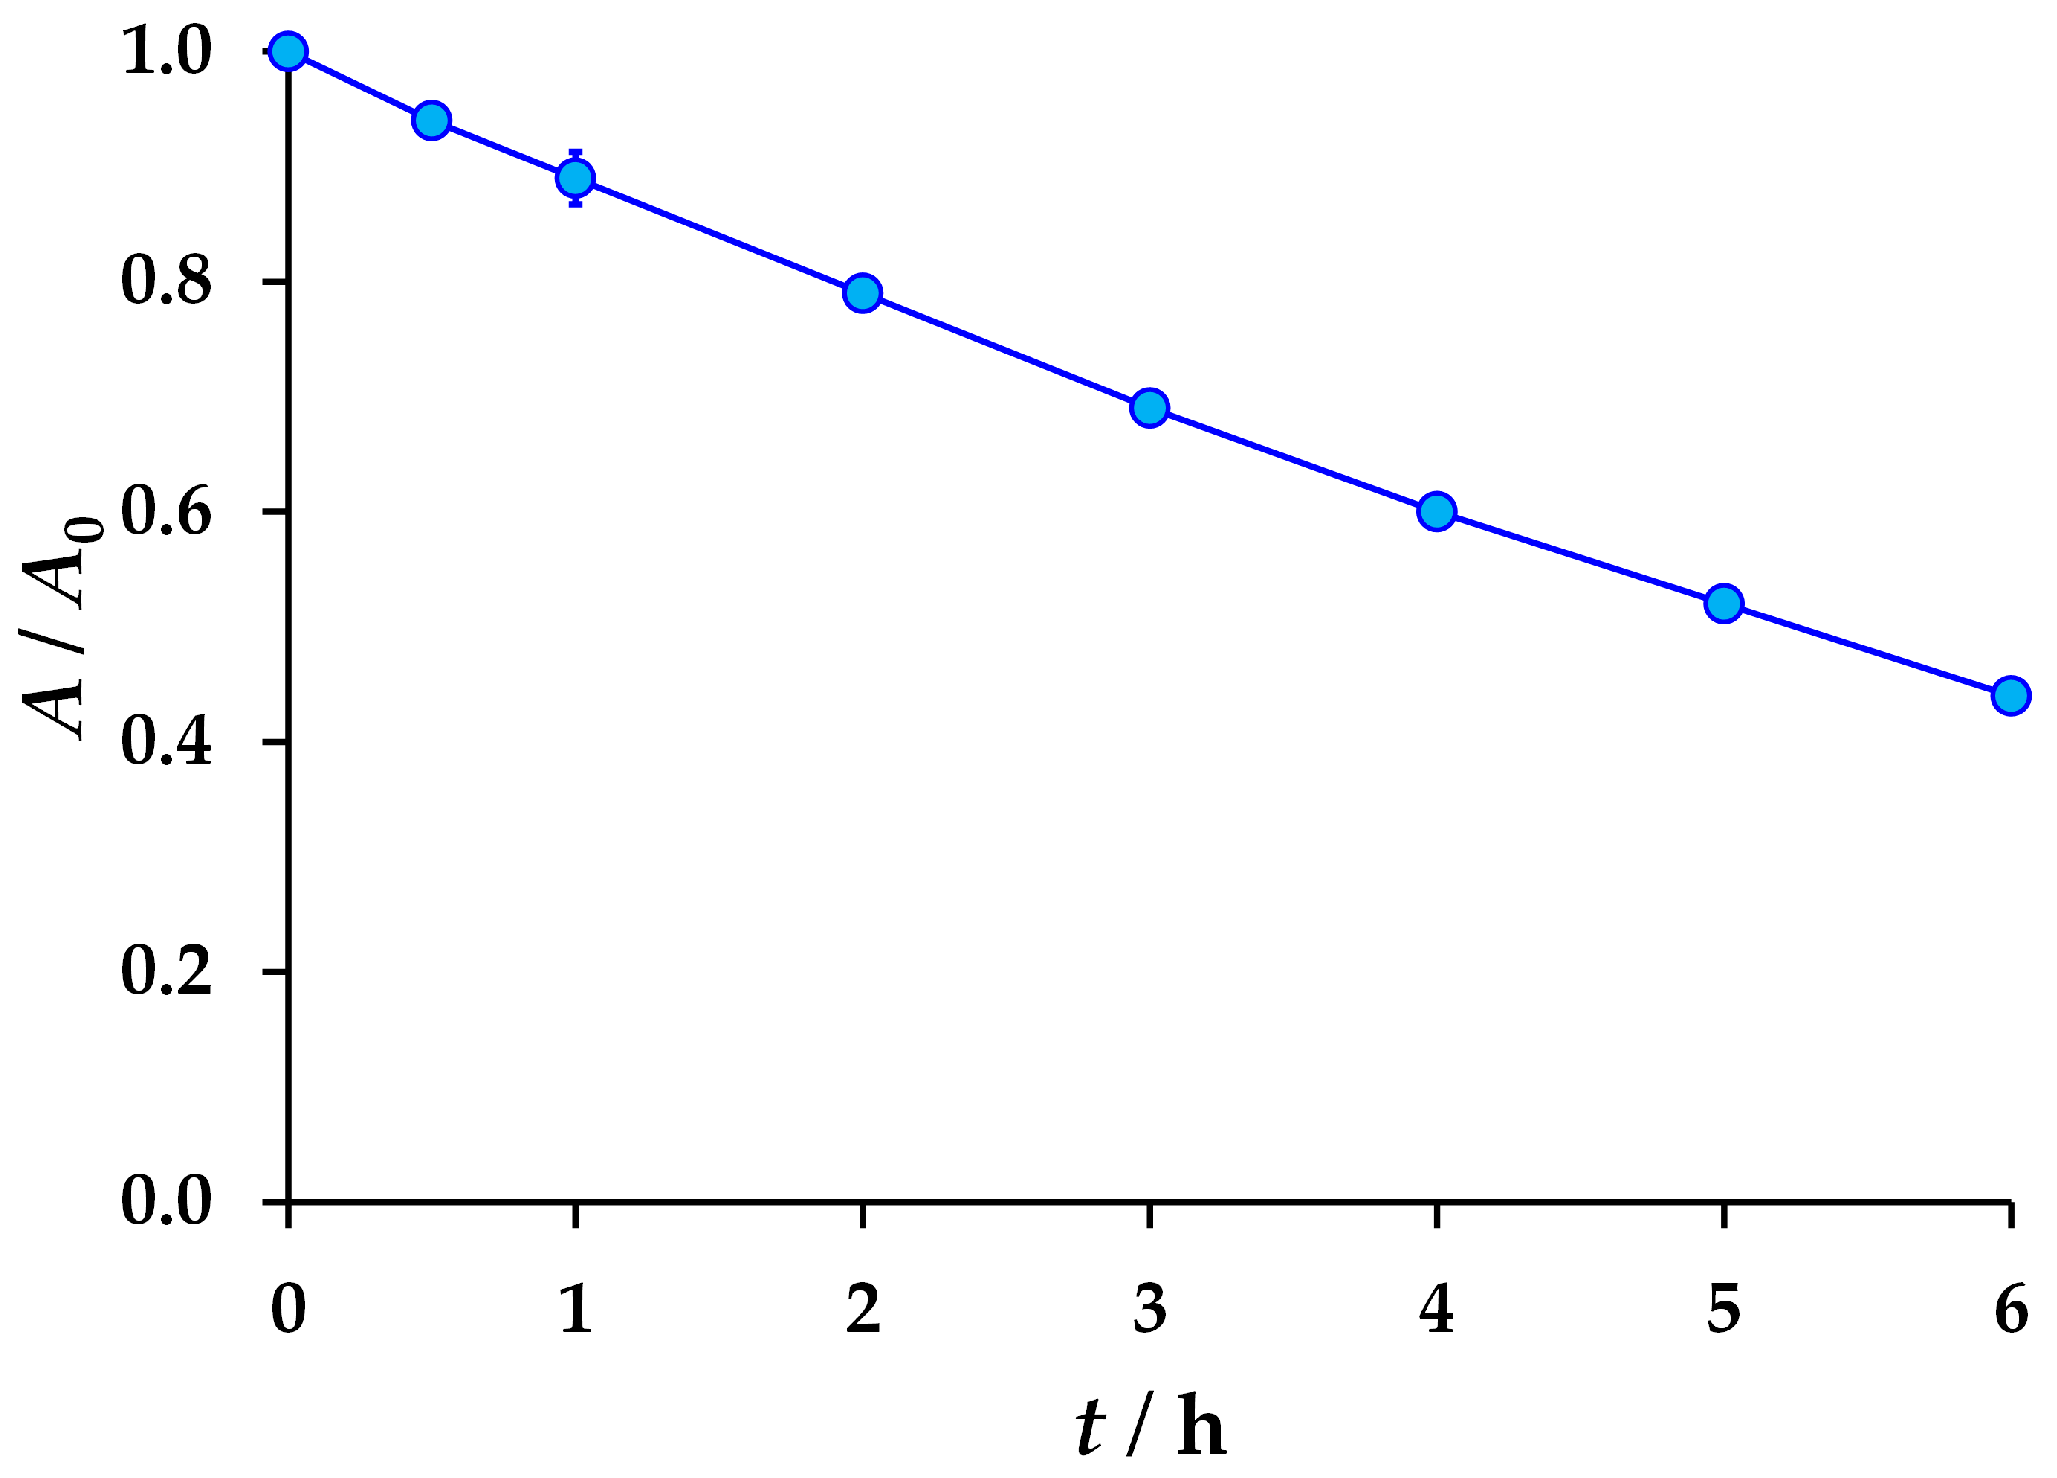
Monitoring of the conversion of the antivirals during the photolytic degradation tests showed that only emtricitabine was susceptible to degradation and was 56% degraded during 6 h of light exposure (Figure 3).
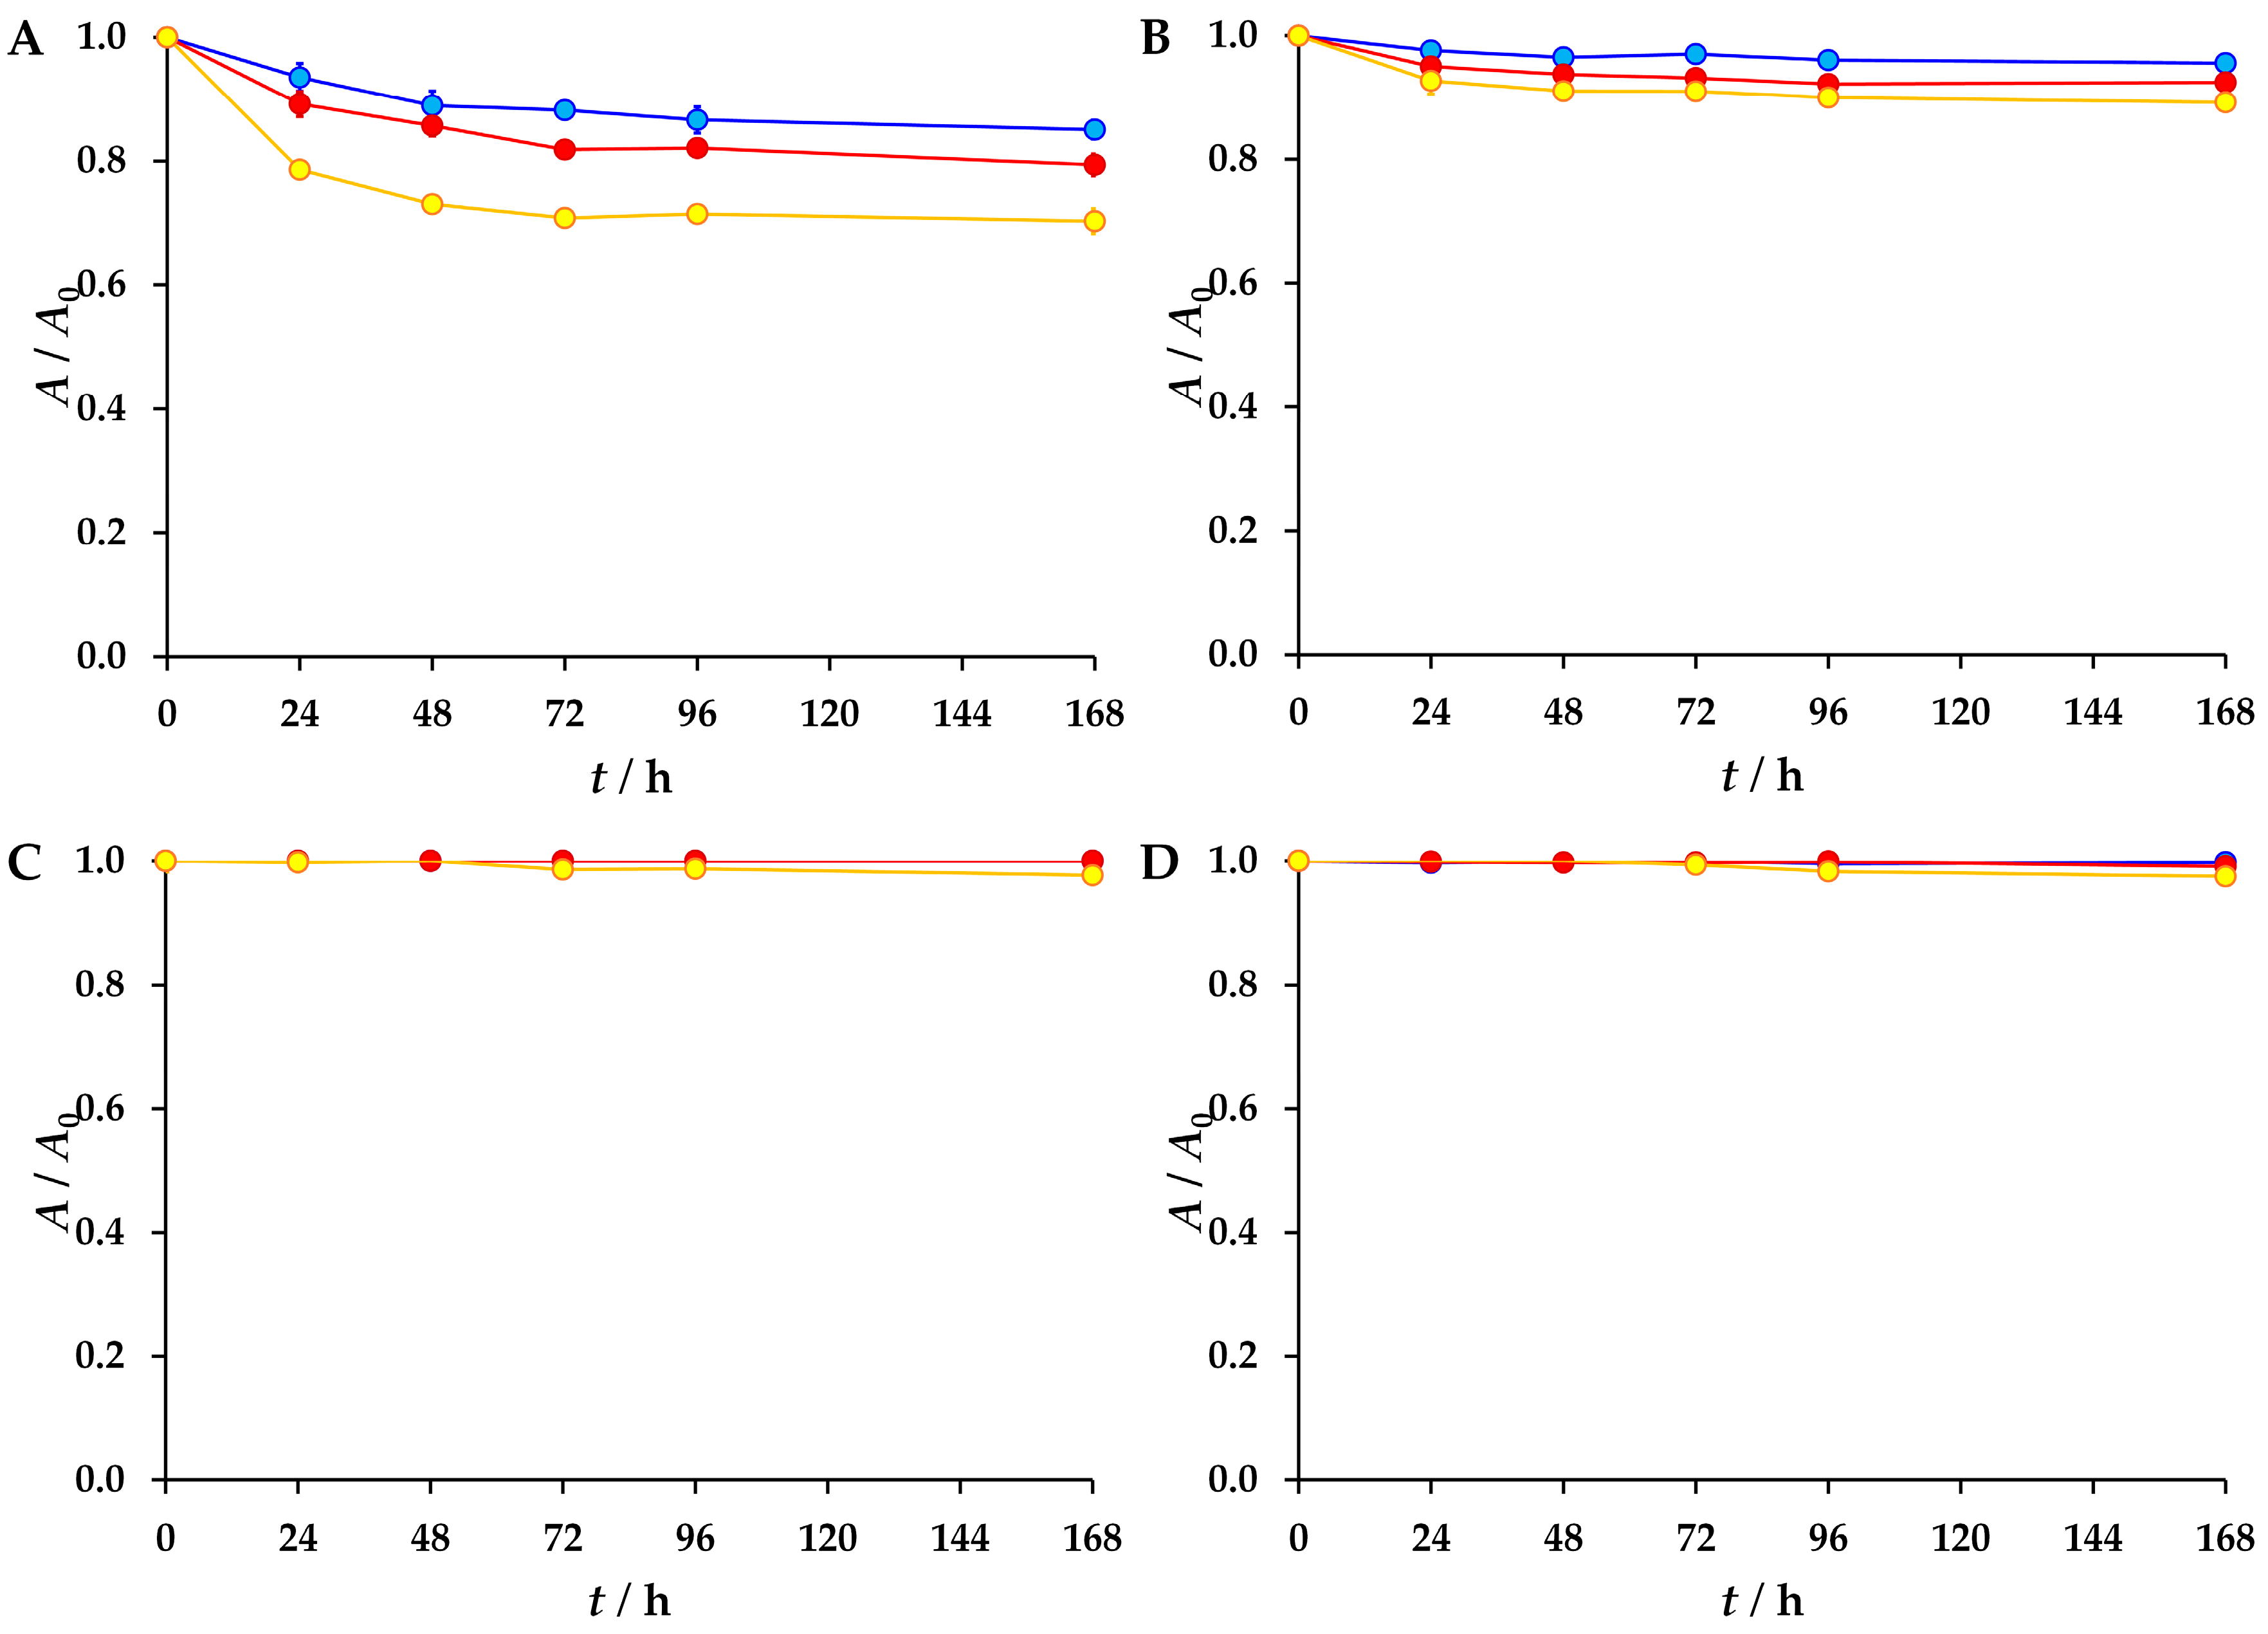
The results of the hydrolysis tests at neutral pH for temperatures of 25 °C, 30 °C and 40 °C are shown in Figure 4. In the case of emtricitabine and ribavirin, no degradation was observed at any of the temperatures tested, which is why they are not shown in Figure 4. The degradation of oseltamivir and sofosbuvir at 25 °C was not observed, but a slight decrease in the concentration of these antivirals was observed at elevated temperature (Figure 4C,D: 2% degradation after 168 h at 40 °C). However, the observed decrease should be treated with caution, as such a low value is within or very close to the precision range of the methods used. For the two remaining antivirals, atazanavir and nirmatrelvir, greater degradation was achieved (Figure 4A,B). At 25 °C, the degradation of atazanavir and nirmatrelvir after 168 h was 15% and 4%, respectively. For these two antiviral agents, a trend of increasing degradation with increasing temperature can be observed. By increasing the temperature, more energy is supplied to the system, which obviously helps to overcome the activation barrier of the hydrolysis reaction [38]. Accordingly, the maximum degradation was achieved at a temperature of 40 °C: 30% of degradation for atazanavir (Figure 4A) and 11% for nirmatrelvir (Figure 4B).
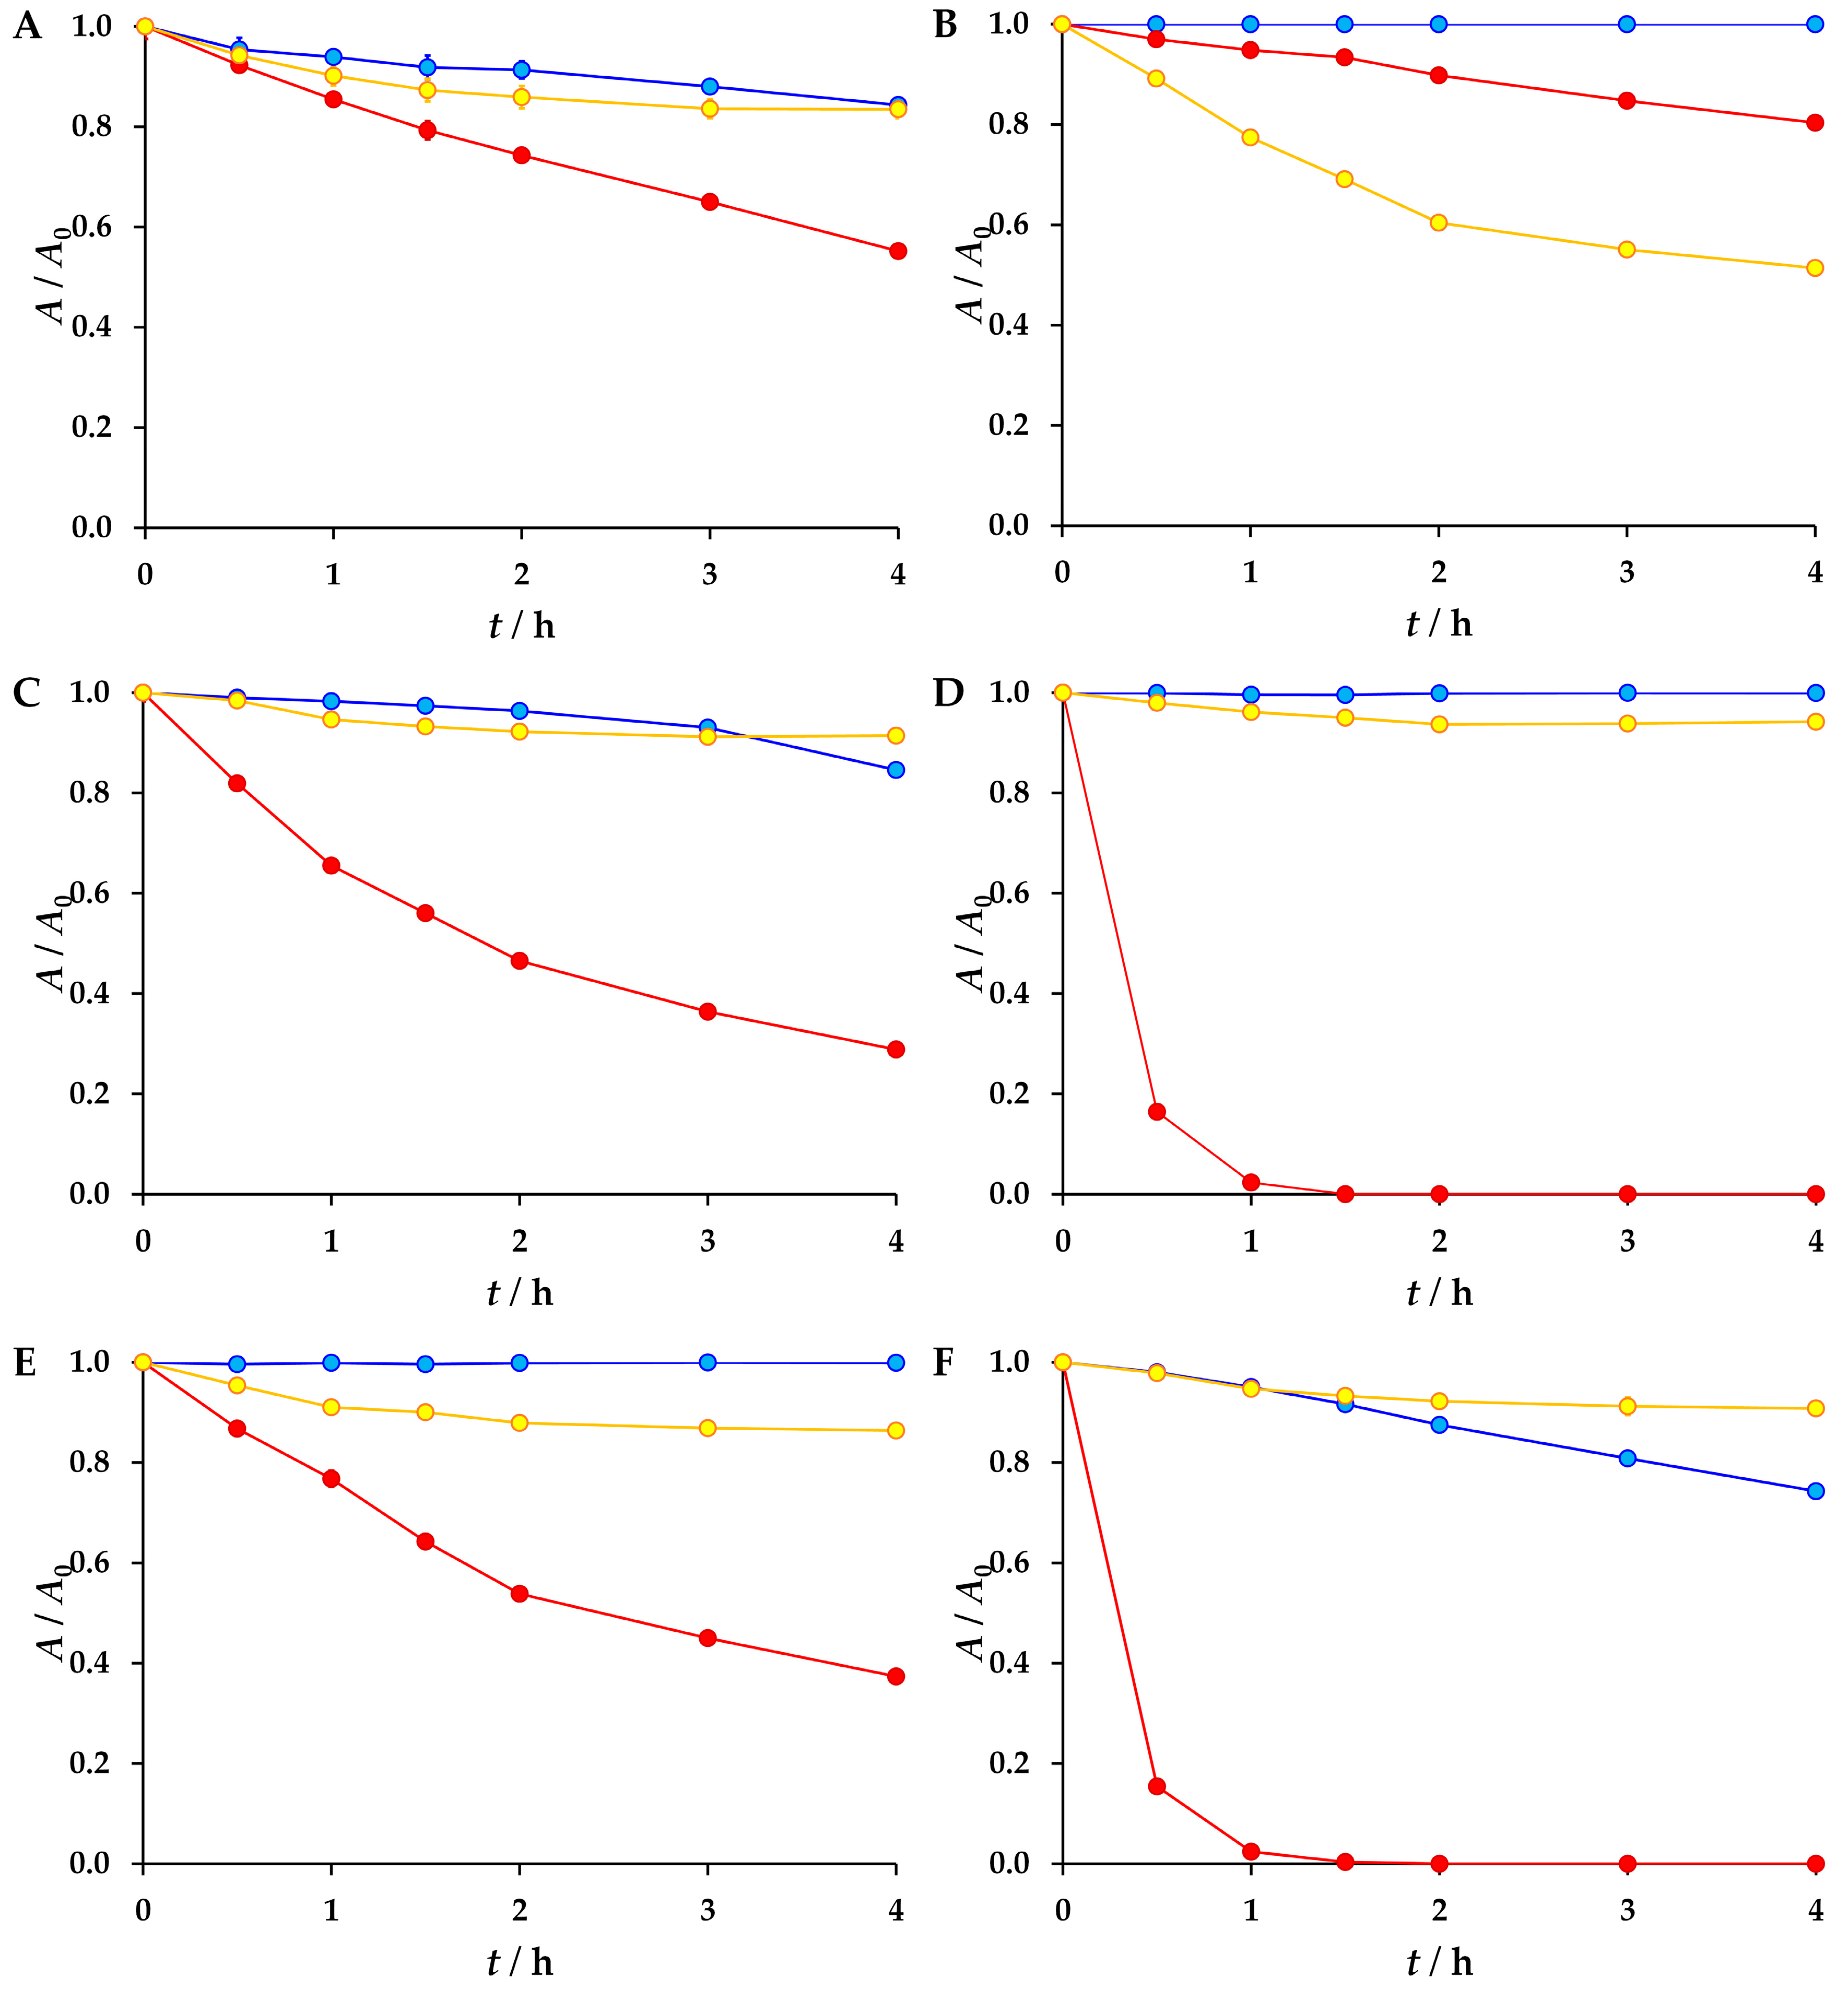
In addition to the hydrolysis of the antivirals at neutral pH, hydrolysis under acidic and basic conditions was also investigated. The presence of acids or bases can significantly accelerate the hydrolysis process as they provide ions that facilitate the cleavage of bonds [38]. Therefore, hydrolysis under acidic and basic conditions was tested over a much shorter period of time (up to 4 h). Hydrolysis under acidic conditions (Figure 5, blue circles) was strongest in the case of sofosbuvir, with 26% of the substance degraded during the test (Figure 5F). Sofosbuvir was followed by atazanavir with 16% degradation (Figure 5A) and nirmatrelvir with 15% degradation (Figure 5C). Emtricitabine, oseltamivir and ribavirin (Figure 5B, Figure 5D and Figure 5E, respectively) proved to be stable during the test. Hydrolysis under alkaline conditions (Figure 5, red circles) was significantly more intense than hydrolysis under acidic conditions, although some degree of degradation was observed for all tested antivirals. Oseltamivir (Figure 5D) and sofosbuvir (Figure 5F) were the most sensitive to alkaline conditions, with complete disappearance of the antivirals in the reaction mixture observed after 1.5 h. A high percentage of degradation of 72% and 63% was observed for nirmatrelvir (Figure 5C) and ribavirin (Figure 5E), respectively, while atazanavir with 45% degradation (Figure 5A) and emtricitabine with 20% degradation (Figure 5B) were the most resistant to alkaline conditions. A look at the structure of the antivirals (Figure 1) shows that emtricitabine is the only one of the tested antivirals that does not have an ester group, which could be the reason for its higher hydrolytic resistance. It is known that the hydrolysis of an ester bond is strongly dependent on the pH of a solution. There are also reports that hydrolysis is many times faster in an alkaline solution than in an acidic and especially in a neutral solution [39].
Exposure of selected antivirals to a strong oxidizing agent such as H2O2 led to partial degradation of all six antivirals (Figure 5, yellow circles). For five antivirals, the observed degradation was relatively low (atazanavir 17%, nirmatrelvir 9%, oseltamivir 6%, ribavirin 14% and sofosbuvir 6%), while for emtricitabine a much higher degradation (49%) was observed.
The results of the forced degradation tests are summarized in Table 6 to provide a comprehensive insight into the effects of the study.

4. Conclusions

Forced degradation tests were conducted to determine what happens to six widely used antivirals once they are released into the environment. These antivirals were atazanavir, emtricitabine, nirmatrelvir, oseltamivir, ribavirin and sofosbuvir.
The results showed that only emtricitabine was susceptible to degradation by sunlight within the applied time interval of 6 h.
With regard to hydrolytic degradation in aquatic media with neutral pH and within the applied temperature interval of 25–40 °C, emtricitabine and ribavirin showed no degradation during the 168 h exposure. Very little degradation of oseltamivir was observed at temperatures of 30 and 40 °C. The same was true for sofosbuvir at 40 °C. However, atazanavir and nirmatrelvir showed slightly higher hydrolytic activity in a neutral pH environment, and this activity increased as the temperature rose.
During the 4 h exposure, no hydrolytic activity was observed for emtricitabine, oseltamivir, or ribavirin in acidic medium (1 M HCl), while atazanavir, nirmatrelvir, and sofosbuvir were somewhat susceptible to degradation in this environment.
In contrast to hydrolysis in an acidic medium, hydrolysis in an alkaline medium (1 M NaOH) proved to be significantly more intense, and an appreciable degree of degradation was achieved for all six antiviral agents tested, with oseltamivir and sofosbuvir proving to be the most susceptible to degradation (Table 6).
A 4 h exposure to a highly oxidizing reagent, in this case a 30% H2O2 solution, resulted in some degree of degradation for all 6 antivirals tested, with emtricitabine being the most susceptible to oxidative degradation and nirmatrelvir, oseltamivir and sofosbuvir being the least susceptible.
Although in this study we only tested the environmental persistence of the selected antivirals, it should be noted that the actual effects of these substances on the environment may not only be direct effects, i.e., if the original molecules have some adverse effects. Complex pharmaceutical molecules such as antivirals often also have indirect effects on the environment, as their degradation (by-)products often pose an even greater hazard than the original antiviral molecules.
Forced degradation studies have several implications, including determining substance stability, developing stability-indicating methods, and analyzing degradation (by-)products to define degradation pathways. For the six antivirals tested in this study, most available literature focuses on the development and validation of stability-indicating methods. Only a few studies address the detection of related degradation (by-)products, and their results are mostly inconsistent. Therefore, future studies should focus on identifying these degradation (by-)products and analyzing their harmful potential for the environment.

Supplementary Materials

The following supporting information can be downloaded at: https://www.mdpi.com/article/10.3390/environments12110417/s1, Figure S1: Two calibration diagrams for determining atazanavir concentration are shown. The cases represent the concentration ranges: (A) 0.0005–0.0020 mM and (B) 0.0020–0.0100 mM. The calibration curve parameters and R2 values are listed in Table 2 of the manuscript. Figure S2: Two calibration diagrams for determining emtricitabine concentration are shown. The cases represent the concentration ranges: (A) 0.0010–0.0100 mM and (B) 0.0100–0.1250 mM. The calibration curve parameters and R2 values are listed in Table 2 of the manuscript. Figure S3: Two calibration diagrams for determining nirmatrelvir concentration are shown. The cases represent the concentration ranges: (A) 0.0010–0.0100 mM and (B) 0.0100–0.1250 mM. The calibration curve parameters and R2 values are listed in Table 2 of the manuscript. Figure S4: Two calibration diagrams for determining oseltamivir concentration are shown. The cases represent the concentration ranges: (A) 0.0010–0.0100 mM and (B) 0.0100–0.1250 mM. The calibration curve parameters and R2 values are listed in Table 2 of the manuscript. Figure S5: Two calibration diagrams for determining ribavirin concentration are shown. The cases represent the concentration ranges: (A) 0.0010–0.0100 mM and (B) 0.0100–0.1250 mM. The calibration curve parameters and R2 values are listed in Table 2 of the manuscript. Figure S6: Two calibration diagrams for determining sofosbuvir concentration are shown. The cases represent the concentration ranges: (A) 0.0010–0.0100 mM and (B) 0.0100–0.1250 mM. The calibration curve parameters and R2 values are listed in Table 2 of the manuscript.

Author Contributions

Conceptualization, D.A., Š.U. and T.B.; methodology, M.C. and V.M.; validation, F.T., L.V., R.H. and V.M.; formal analysis, B.B.V., F.T., L.V., R.H. and V.M.; investigation, D.L. and V.M.; writing—original draft preparation, F.T., L.V. and R.H.; writing—review and editing, D.K.G. and Š.U.; visualization, Š.U. All authors have read and agreed to the published version of the manuscript.

Funding

The authors would like to acknowledge the financial support of the Croatian Science Foundation through the project Environmental Aspects of SARS-CoV-2 Antiviral Substances (EnA-SARS; IP-2022-10-2822).

Data Availability Statement

Data are contained within the article.

Conflicts of Interest

Author Dajana Kučić Grgić is affiliated to the company Comprehensive Water Technology d.o.o. The remaining authors declare that the research was conducted in the absence of any commercial or financial relationships that could be construed as a potential conflict of interest.

References

  1. Roemer, T.; Krysan, D.J. Antifungal Drug Development: Challenges, Unmet Clinical Needs, and New Approaches. Cold Spring Harb. Perspect. Med. 2014, 4, a019703. [Google Scholar] [CrossRef]
  2. Woods, D.J.; Williams, T.M. The challenges of developing novel antiparasitic drugs. Invert. Neurosci. 2007, 7, 245–250. [Google Scholar] [CrossRef] [PubMed]
  3. Bryan-Marrugo, O.L.; Ramos-Jiménez, J.; Barrera-Saldaña, H.; Rojas-Martínez, A.; Vidaltamayo, R.; Rivas-Estilla, A.M. History and progress of antiviral drugs: From acyclovir to direct-acting antiviral agents (DAAs) for Hepatitis C. Med. Univ. 2015, 17, 165–174. [Google Scholar] [CrossRef]
  4. Howes, L. Why are antivirals so hard to develop? Chem. Eng. News 2021, 99. Available online: https://cen.acs.org/pharmaceuticals/drug-discovery/antiviral-drug-development-covid-19/99/i19 (accessed on 12 October 2025).
  5. Chow, D. Why are Viruses Hard to Kill? Virologists Explain Why These Tiny Parasites are so Tough to Treat. NBC News. Available online: https://www.nbcnews.com/science/science-news/why-are-viruses-hard-kill-virologists-explain-why-these-tiny-n1202046 (accessed on 12 October 2025).
  6. Race, M.; Ferraro, A.; Galdiero, E.; Guida, M.; Núñez-Delgado, A.; Pirozzi, F.; Siciliano, A.; Fabbricino, M. Current emerging SARS-CoV-2 pandemic: Potential direct/indirect negative impacts of virus persistence and related therapeutic drugs on the aquatic compartments. Environ. Res. 2020, 188, 109808. [Google Scholar] [CrossRef]
  7. Domínguez-García, P.; Rodríguez, R.R.; Barata, C.; Gómez-Canela, C. Presence and toxicity of drugs used to treat SARS-CoV-2 in Llobregat River, Catalonia. Spain. Environ. Sci. Pollut. Res. 2023, 30, 49487–49497. [Google Scholar] [CrossRef]
  8. Maremane, S.R.; Belle, G.N.; Oberholster, P.J.; Omotola, E.O. Occurrence of selected Covid-19 drugs in surface water resources: A review of their sources, pathways, receptors, fate, ecotoxicity, and possible interactions with heavy metals in aquatic ecosystems. Environ. Geochem. Health 2025, 47, 3. [Google Scholar] [CrossRef]
  9. Gros, M.; Petrović, M.; Ginebreda, A.; Barceló, D. Removal of pharmaceuticals during wastewater treatment and environmental risk assessment using hazard indexes. Environ. Int. 2010, 36, 15–26. [Google Scholar] [CrossRef]
  10. Giouni, E.A.; Kyriazi, M.; Malamis, D.; Loizidou, M. Design of an innovative system for the detoxification of pharmaceutical wastewater. Tech. Ann. 2023, 1, 14 pages. [Google Scholar] [CrossRef]
  11. Moratalla, A.; Cotillas, S.; Lacasa, E.; Cañizares, P.; Rodrigo, M.A.; Sáez, C. Electrochemical technologies to decrease the chemical risk of hospital wastewater and urine. Molecules 2021, 26, 6813. [Google Scholar] [CrossRef]
  12. Schwarz, S.; Gildemeister, D.; Hein, A.; Schröder, P.; Bachmann, J. Environmental fate and effects assessment of human pharmaceuticals: Lessons learnt from regulatory data. Environ. Sci. Eur. 2021, 33, 68. [Google Scholar] [CrossRef]
  13. Alidehi-Ravandi, R.; Abdullah, H.O. Topological Indices of Drug Molecular Structures: An Application with the Treatment and Prevention of COVID-19. J. Discrete Math. Appl. 2023, 8, 83–103. [Google Scholar]
  14. Ramírez-Olivencia, G.; Estébanez, M.; Membrillo, F.J.; del Carmen Ybarra, M. Use of ribavirin in viruses other than hepatitis C. A review of the evidence. Enferm. Infecc. Microbiol. Clin. 2019, 37, 602–608. [Google Scholar] [CrossRef]
  15. Thomas, E.; Ghany, M.G.; Liang, T.J. The application and mechanism of action of ribavirin in therapy of hepatitis C. Antivir. Chem. Chemother. 2012, 23, 1–12. [Google Scholar] [CrossRef]
  16. Gupta, Y.K.; Meenu, M.; Mohan, P. The Tamiflu fiasco and lessons learnt. Indian J. Pharmacol. 2015, 47, 11–16. [Google Scholar] [CrossRef]
  17. Sur, M.; Lopez, M.J.; Patel, P.; Baker, M.B. Oseltamivir. In StatPearls, Internet ed.; StatPearls Publishing: Treasure Island, FL, USA. Available online: https://www.ncbi.nlm.nih.gov/books/NBK539909/ (accessed on 3 April 2025).
  18. Hussar, D.A. New Drugs of 2003. J. Am. Pharm. Assoc. 2004, 44, 168–210. [Google Scholar] [CrossRef]
  19. Choi, J.; Horner, K.A.; Carnevale, K. Atazanavir. In StatPearls, Internet ed.; StatPearls Publishing: Treasure Island, FL, USA. Available online: https://www.ncbi.nlm.nih.gov/books/NBK551608/ (accessed on 3 April 2025).
  20. Muller, J.T.; Al Khalili, Y. Emtricitabine. In StatPearls, Internet ed.; StatPearls Publishing: Treasure Island, FL, USA. Available online: https://www.ncbi.nlm.nih.gov/books/NBK539853/ (accessed on 3 April 2025).
  21. Yoosefian, M.; Moghani, M.Z.; Juan, A. In silico evaluation of atazanavir as a potential HIV main protease inhibitor and its comparison with new designed analogs. Comput. Biol. Med. 2022, 145, 105523. [Google Scholar] [CrossRef]
  22. Mattino, A.; Ferrari, D.; Nozza, S.; Muccini, C.; Ripa, M.; Spagnuolo, V.; Castagna, A.; Locatelli, M.; Sabetta, E. Development, validation and clinical implementation of a HPLC-MS/MS method for the simultaneous quantification of bictegravir, emtricitabine, doravirine, cabotegravir, lenacapavir, fostemsavir, tenofovir alafenamide and the corresponding metabolites temsavir and tenofovir, in human plasma. J. Chromatogr. B 2025, 1267, 124803. [Google Scholar] [CrossRef]
  23. Gentile, I.; Maraolo, A.E.; Buonomo, A.R.; Zappulo, E.; Borgia, G. The discovery of sofosbuvir: A revolution for therapy of chronic hepatitis C. Expert Opin. Drug Discov. 2015, 10, 1363–1377. [Google Scholar] [CrossRef]
  24. Barenie, R.E.; Avorn, J.; Tessema, F.A.; Kesselheim, A.S. Public funding for transformative drugs: The case of sofosbuvir. Drug Discov. Today 2021, 26, 273–281. [Google Scholar] [CrossRef]
  25. Lam, C.; Patel, P. Nirmatrelvir-Ritonavir. In StatPearls, Internet ed.; StatPearls Publishing: Treasure Island, FL, USA. Available online: https://www.ncbi.nlm.nih.gov/books/NBK585126/ (accessed on 3 April 2025).
  26. Hashemian, S.M.R.; Sheida, A.; Taghizadieh, M.; Memar, M.Y.; Hamblin, M.R.; Baghi, H.B.; Nahand, J.S.; Asemi, Z.; Mirzaei, H. Paxlovid (Nirmatrelvir/Ritonavir): A new approach to Covid-19 therapy? Biomed. Pharmacother. 2023, 162, 114367. [Google Scholar] [CrossRef]
  27. Martinjak, V.; Miloloža, M.; Markić, M.; Furač, L.; Cvetnić, M.; Bolanča, T.; Kučić Grgić, D.; Ukić, Š. Revealing the Adverse Potential of Six SARS-CoV-2 Antivirals by Aliivibrio fischeri Assay: Toxicity Analysis of Single Agent Solutions and Binary Mixtures. Water 2024, 16, 3607. [Google Scholar] [CrossRef]
  28. Durgule, S.M.; Patil, P.M.; Kore, A.P.; Singh, M.T.; Kadam, S.D. An introduction to forced degradation studies for drug substance and drug products. J. Emerg. Technol. Innov. Res. 2021, 8, 260–269. [Google Scholar]
  29. Stability Testing of New Drug Substances and Products Q1A(R2). ICH Harmonised Tripartite Guideline, Step 4 Version, 6 February 2003, International Conference on Harmonisation of Technical Requirements for Registration of Pharmaceuticals for Human Use. Available online: https://database.ich.org/sites/default/files/Q1A%28R2%29%20Guideline.pdf (accessed on 13 March 2025).
  30. Stability Testing: Photostability Testing of New Drug Substances and Products Q1B. ICH Harmonised Tripartite Guideline, Step 4 Version, 6 November 1996, International Conference on Harmonisation of Technical Requirements for Registration of Pharmaceuticals for Human Use. Available online: https://database.ich.org/sites/default/files/Q1B%20Guideline.pdf (accessed on 13 March 2025).
  31. Nagasamy Venkatesh, D.; Shanmuga Kumar, S.D. Forced Degradation—A Review. Biomed. J. Sci. Tech. Res. 2022, 47, 38381–38394. [Google Scholar] [CrossRef]
  32. Keil, K.; Hochreitter, J.; DiFrancesco, R.; Zingman, B.S.; Reichman, R.C.; Fischl, M.A.; Gripshover, B.; Morse, G.D. Integration of atazanavir into an existing liquid chromatography UV method for protease inhibitors: Validation and application. Ther. Drug Monit. 2007, 29, 103–109. [Google Scholar] [CrossRef] [PubMed]
  33. Rathod, S.; Chopade, J.; Mahaparale, S.; Jadhao, Y.P. Analytical Method Development and Validation for Estimation of Emtricitabine in Tablet Dosage Form by Reverse Phase High Performance Liquid Chromatography. Indian J. Pharm. Sci. 2024, 86, 294–301. [Google Scholar] [CrossRef]
  34. Imam, M.S.; Batubara, A.S.; Gamal, M.; Abdelazim, A.H.; Almrasy, A.A.; Remzy, S. Adjusted green HPLC determination of nirmatrelvir and ritonavir in the new FDA approved co-packaged pharmaceutical dosage using supported computational calculations. Sci. Rep. 2023, 13, 137. [Google Scholar] [CrossRef]
  35. Gungor, S.; Bulduk, I.; Aydın, B.S.; Sagkan, R.I. A comparative study of HPLC and UV spectrophotometric methods for oseltamivir quantification in pharmaceutical formulations. Acta Chromatogr. 2022, 34, 258–266. [Google Scholar] [CrossRef]
  36. Belal, F.; Sharaf El-Din, M.K.; Eid, M.I.; El-Gamal, R.M. Validated stability-indicating liquid chromatographic method for the determination of ribavirin in the presence of its degradation products: Application to degradation kinetics. J. Chromatogr. Sci. 2015, 53, 603–611. [Google Scholar] [CrossRef]
  37. Srawanthi, P.; Sireesha, D.; Kiran, G.; Akiful Haque, M.; Bakshi, V. Method Development and Validation for Simultaneous Estimation of Sofosbuvir and Velpatasvir by UV-Visible Spectrophotometry. Int. J. Pharm. Sci. Res. 2021, 21, 3969–3974. [Google Scholar] [CrossRef]
  38. Antonetti, M. Fundamentals of Chemical Hydrolysis and its Application. J. Thermodyn. Catal. 2025, 1, 445. [Google Scholar]
  39. Chiu, P.-H.; Yang, Y.-L.; Tsao, H.-K.; Sheng, Y.-J. Deep learning for predictions of hy-drolysis rates and conditional molecular design of esters. J. Taiwan Inst. Chem. Eng. 2021, 126, 1–13. [Google Scholar] [CrossRef]
Figure 1. Chemical structures and some basic information about: (I) atazanavir, (II) emtricitabine, (III) nirmatrelvir, (IV) oseltamivir, (V) ribavirin and (VI) sofosbuvir.
Environments 12 00417 g001
Figure 2. The plots show the residuals (e/V min) versus the antiviral concentration (c/µM) of the solutions used for calibration. Residuals were calculated as the difference between the expected value of the method response (calculated from the calibration line) and the experimentally obtained response. The plots were obtained when a single calibration line was developed over the entire concentration range. The cases are: atazanavir (A), emtricitabine (B), nirmatrelvir (C), oseltamivir (D), ribavirin (E) and sofosbuvir (F).
Environments 12 00417 g002
Figure 3. The plot shows the results of the photolytic degradation of emtricitabine over treatment time t in hours (h). The level of photolytic degradation is expressed as the ratio of the peak area of the antiviral agent (A) measured at treatment time t to the peak area of the antiviral agent measured at the start of the experiment (A0). The plot includes error bars showing the range of determined values; however, because these error values were generally small, the bars were mostly hidden by the marker used.
Environments 12 00417 g003
Figure 4. The results of hydrolytic degradation at neutral pH for temperatures of 25 °C, 30 °C and 40 °C (blue, red and yellow circles, respectively). The ratio between the peak area of the antiviral agent determined at time t (A) and the peak area of the antiviral agent determined at the beginning of the experiment (A0) was used to indicate the degree of degradation. The cases shown are: (A) atazanavir, (B) nirmatrelvir, (C) oseltamivir and (D) sofosbuvir. The plots include error bars showing the range of determined values; however, because these error values were generally small, the bars were mostly hidden by the marker used.
Environments 12 00417 g004
Figure 5. The degree of hydrolytic degradation at acid (blue circles) and alkali conditions (red circles), and the degree of oxidative degradation (yellow circles). The ratio between the peak area of the antiviral agent determined at time t (A) and the peak area of the antiviral agent determined at the beginning of the experiment (A0) was used to indicate the degree of degradation. The cases shown are: atazanavir (A), emtricitabine (B), nirmatrelvir (C), oseltamivir (D), ribavirin (E) and sofosbuvir (F). The plots include error bars showing the range of determined values; however, because these error values were generally small, the bars were mostly hidden by the marker used.
Environments 12 00417 g005
Table 1. The characteristics of chromatographic methods developed to monitor the conversion of antivirals during forced degradation.
ConditionsAtazanavirEmtricitabineNirmatrelvirOseltamivirRibavirinSofosbuvir
Mobile phase
composition
40% CH3OH & 60% HCOOH5% CH3OH & 95% 20 mM KH2PO438% ACN 1 & 62% 20 mM KH2PO455% CH3OH & 45% 20 mM KH2PO4100% 20 mM KH2PO447% CH3OH & 53% 20 mM KH2PO4
Mobile phase flow1 mL min−11 mL min−11 mL min−11 mL min−11 mL min−11 mL min−1
Injection volume20 µL30 µL10 µL30 µL30 µL30 µL
Owen temperature40 °C30 °C40 °C30 °C30 °C30 °C
Detection wavelength248 nm280 nm217 nm215 nm207 nm261 nm
Retention time15.09 min13.48 min10.42 min10.39 min3.55 min8.89 min
1 ACN—acetonitrile.
Table 2. Characteristics of the calibration lines used in analysis of antivirals.
AntiviralCalibration Range/mMInterceptSlopeR2
Atazanavir0.0005–0.0020−2.3 × 1031.8 × 1070.9976
0.0020–0.0100−4.2 × 1021.7 × 1070.9998
Emtricitabine0.0010–0.01009.2 × 1021.5 × 1070.9995
0.0100–0.12504.8 × 1031.5 × 1070.9999
Nirmatrelvir0.0010–0.0100−3.9 × 1024.8 × 1060.9934
0.0100–0.12502.6 × 1034.7 × 1060.9990
Oseltamivir0.0010–0.0100−5.6 × 1021.9 × 1070.9952
0.0100–0.1250−3.8 × 1021.9 × 1070.9990
Ribavirin0.0010–0.0100812.1 × 1070.9997
0.0100–0.12504.6 × 1032.1 × 1070.9997
Sofosbuvir0.0010–0.01002.3 × 1031.7 × 1070.9993
0.0100–0.12504.8 × 1021.7 × 1070.9999
Table 3. Analysis of the accuracy of the developed LC-UV methods. The data represent the results of a linear regression between true antiviral concentrations (i.e., concentrations prepared for the development of the calibration line) and concentration values determined by the developed calibration line.
AntiviralCalibration
Range/mM
InterceptSlopeR2Recovery
± SD 1
ValueLower 95%Upper 95%ValueLower 95%Upper 95%
Atazanavir0.0005–0.00204.3 × 10−19−1.91 × 10−51.91 × 10−51.00000.98501.01500.9976100.34 ± 3.25
0.0020–0.01001.7 × 10−18−2.70 × 10−52.70 × 10−51.00000.99561.00440.999899.93 ± 0.51
Emtricitabine0.0010–0.01008.7 × 10−19−4.07 × 10−54.07 × 10−51.00000.99341.00660.9995100.14 ± 1.32
0.0100–0.12505.8 × 10−13−2.05 × 10−42.05 × 10−41.00000.99731.00270.9999100.13 ± 0.20
Nirmatrelvir0.0010–0.01001.7 × 10−18−0.2 × 10−40.2 × 10−41.00000.97501.02500.9934100.70 ± 3.34
0.0100–0.1250−2.8 × 10⁻¹⁷−6.59 × 10−46.59 × 10−41.00000.99131.00870.9990100.02 ± 1.25
Oseltamivir0.0010–0.01008.7 × 10−19−1.32 × 10−41.32 × 10−41.00000.97861.02140.9952101.09 ± 3.48
0.0100–0.1250−1.4 × 10⁻¹⁷−6.57 × 10−46.57 × 10−41.00000.99131.00870.9990100.28 ± 0.94
Ribavirin0.0010–0.0100−1.0 × 10⁻¹²−3.38 × 10−53.38 × 10−51.00000.99451.00550.9997100.12 ± 0.52
0.0100–0.12504.2 × 10−17−3.88 × 10−43.88 × 10−41.00000.99491.00510.9997100.03 ± 0.32
Sofosbuvir0.0010–0.01001.6 × 10−12−4.86 × 10−54.86 × 10−51.00000.99211.00790.999399.48 ± 1.82
0.0100–0.1250−5.5 × 10⁻¹⁷−2.00 × 10−42.00 × 10−41.00000.99741.00260.9999100.02 ± 0.42
1 SD—standard deviation.
Table 4. Analysis of the precision of developed LC-UV methods 1.
AntiviralCalibration Range/mMConcentration Level/mMSD/mMRSD/%
Atazanavir0.0005–0.00200.00100.00000.00
0.0020–0.01000.00500.00011.66
Emtricitabine0.0010–0.01000.00500.00011.59
0.0100–0.12500.07500.00030.40
Nirmatrelvir0.0010–0.01000.00500.00023.93
0.0100–0.12500.07500.00141.77
Oseltamivir0.0010–0.01000.00500.00023.73
0.0100–0.12500.07500.00141.88
Ribavirin0.0010–0.01000.00500.00011.20
0.0100–0.12500.07500.00081.12
Sofosbuvir0.0010–0.01000.00500.00011.40
0.0100–0.12500.07500.00030.44
SD—standard deviation; RSD—relative standard deviation.
Table 5. The values of the limit of detection and the limit of quantification for developed LC-UV methods.
AntiviralLimit of Detection/mMLimit of Quantification/mM
Atazanavir6.3 × 10−51.9 × 10⁻⁴
Emtricitabine9.9 × 10−53.0 × 10⁻⁴
Nirmatrelvir8.9 × 10−52.7 × 10⁻⁴
Oseltamivir3.4 × 10−41.0 × 10⁻³
Ribavirin8.3 × 10−52.5 × 10⁻⁴
Sofosbuvir9.6 × 10−52.9 × 10⁻⁴
Table 6. Susceptibility of antivirals to degradation under various stressors. Shaded cells indicate cases where the antiviral substance was susceptible to the stressor, with the number in the cell representing the maximum degradation observed during treatment. White cells indicate cases where no degradation of the antiviral substance was observed during exposure to a stressor. Values in brackets indicate the exposure time.
Forced Degradation Treatment
AntiviralSunlight
(6 h)
Water (168 h)1 M HCl
(4 h)
1 M NaOH
(4 h)
30% H2O2
(4 h)
25 °C30 °C40 °C
Atazanavir 15%21%30%16%45%17%
Emtricitabine56% 20%49%
Nirmatrelvir 4%8%11%15%72%9%
Oseltamivir 2% 100%6%
Ribavirin 63%14%
Sofosbuvir 1%2%26%100%6%
Disclaimer/Publisher’s Note: The statements, opinions and data contained in all publications are solely those of the individual author(s) and contributor(s) and not of MDPI and/or the editor(s). MDPI and/or the editor(s) disclaim responsibility for any injury to people or property resulting from any ideas, methods, instructions or products referred to in the content.