Article

Phytoplankton Dynamics in a Large Lagoon: Nutrient Load Reductions, Climate Change, and Cold- and Heatwaves

1
Coastal Sea Geography Group, Leibniz-Institute for Baltic Sea Research, Seestrasse 15, D-18119 Rostock-Warnemünde, Germany
2
Marine Research Institute, Klaipeda University, Universiteto Ave. 17, LT-92294 Klaipeda, Lithuania
3
Biogeochemical Modelling Group, Leibniz-Institute for Baltic Sea Research, Seestrasse 15, D-18119 Rostock-Warnemünde, Germany
4
Landesamt für Umwelt, Naturschutz und Geologie, Goldberger Straße 12b, D-18273 Güstrow, Germany
*
Author to whom correspondence should be addressed.
Environments 2025, 12(10), 370; https://doi.org/10.3390/environments12100370
Submission received: 9 September 2025 / Revised: 2 October 2025 / Accepted: 7 October 2025 / Published: 9 October 2025

Abstract

The coastal Oder/Szczecin Lagoon is subject to multiple external changes, particularly the reduction in external nutrient loads and the impacts of climate change, including rising temperatures and more frequent heatwaves. By combining monitoring data covering the past 40 years with 3D ecosystem modelling, we assess changes in phytoplankton abundance and diversity across different temporal scales, ranging from long-term trends to the short-term effects. Despite strong reductions in external nutrient loads, neither the average annual phytoplankton biomass nor the long-term species composition changed significantly, although extreme summer blooms appear to have decreased. In summer, cyanobacteria, usually dominated by Microcystis, can reach a relative biovolume of up to 90%. Bacillariophyceae (diatoms) contribute up to 72% of the annual relative biovolume and dominate in spring. Both interannual and short-term variability in phytoplankton biomass and composition are pronounced. Heat- and coldwaves show no consistent immediate effects; however, results suggest that cyanobacteria, particularly Microcystis, benefit from hot summers. In contrast, diatoms appear less responsive to temperature, although they tend to contribute more in colder years, with distinct shifts in species composition observed between hot and cold springs. Model simulations indicate that a 1.5 °C increase in air temperature would, via elevated water temperatures, raise average monthly phytoplankton biomass by 4% in July and by 9% in August, further promoting cyanobacteria growth.

1. Introduction

Surface air temperatures in the Baltic Sea region have increased over the past century, with a clear trend visible across all seasons. At the same time, the number, duration, and intensity of extreme high- and low-temperature events have also increased [1,2]. Rising air temperature directly affects sea surface temperature [3,4], which in the Baltic Sea has increased by more than 0.5 °C per decade over the past 30 years [5,6]. Globally, marginal seas have warmed more rapidly than the open oceans, and the Baltic Sea is currently the fastest-warming marine region [7,8].
Model projections suggest that by the end of the 21st century, sea surface temperatures in the Baltic Sea will rise by 1.1–3.2 °C compared to the 1976–2005 baseline [9]. The frequency of heatwaves is also expected to increase, particularly in the southern Baltic Sea [10]. Consequently, the Baltic Sea is considered a climate change hotspot, and ecological as well as management challenges related to rising temperatures are expected to intensify in the future.
Increased water temperature can have multiple ecological effects. For the Baltic Sea, Viitasalo & Bonsdorff [11] highlight several consequences, including enhanced bacterial growth, complex effects on microbial food webs and zooplankton, and the establishment of non-indigenous species. The most critical consequences concern phytoplankton, which form the base of marine food webs, drive nutrient cycling, and fuel the biological carbon pump [12,13]. Climate warming has multiple effects on phytoplankton, for example, it alters phytoplankton community composition by favoring harmful taxa, stimulates cyanobacterial blooms and toxin production, prolongs bloom duration, thereby increasing ecological and public health risks, and it causes temporal shifts in blooms (e.g., [14,15,16]). Coastal zones, and lagoons in particular, are considered especially sensitive to these climate change impacts [17].
Heatwaves, defined as temperature events exceeding either the difference between the 90th percentile and the climatological mean for several days [18] or a seasonally defined temperature threshold [19], are assumed to exacerbate climate change impacts [20]. They can have both short- and long-term ecological consequences in aquatic systems [21,22], such as altering physical structure and chemical properties, shifting species composition, and threatening biodiversity [11]. In Baltic coastal waters, observed impacts include increased oxygen deficiency [23] and higher emissions of carbon dioxide and methane [24]. Phytoplankton can respond rapidly to heatwaves through accelerated growth, shifts in community composition, and often an increased dominance of toxic, buoyant cyanobacteria, especially in lakes [25,26,27]. Recent in situ mesocosm experiments in a Mediterranean lagoon suggest similar effects [28].
In Baltic Sea research, climate change and heatwaves have become major focal points, largely due to advances in 3D hydrodynamic and ecosystem modelling, with much emphasis placed on physical processes [8,9]. However, as Chen et al. [29] note, such models are rarely applied to lakes and are usually unavailable for coastal lagoons, leaving comparative analyses scarce. Despite progress, Rutgersson et al. [30] conclude that significant knowledge gaps remain regarding the occurrence and effects of marine heatwaves. Moreover, existing biogeochemical monitoring programs are generally unsuitable for capturing short-term events like heatwaves [31,32]. For example, the German coastal monitoring program of the federal state of Mecklenburg-Vorpommern [33] collects data only every four weeks, at a depth of one meter and one meter above the sediment. While this provides a valuable 40-year dataset, its temporal and spatial resolution is inadequate for analyzing heatwaves and their ecological impacts. Additionally, temperature-driven changes in lakes and lagoons are often masked by other factors, such as external nutrient inputs [34].
To address these gaps, we implemented the 3D ecosystem model ERGOM in the Oder Lagoon and conducted simulations covering the past 40 years. These simulations were combined with long-term monitoring data to investigate the following questions: How have phytoplankton abundance and composition changed over the past four decades? What are the patterns of seasonal development and variability? What role do extreme weather events, particularly heatwaves, play? What are the implications for environmental monitoring and policy frameworks (e.g., the Water Framework Directive, Habitat Directive, and Baltic Sea Action Plan)? And finally, what lessons can be drawn for assessing and managing ecosystems under a warming climate?

2. Materials and Methods

2.1. The Oder River and the Oder/Szczecin Lagoon

The Oder Lagoon (German: Oderhaff; Polish: Zalew Szczeciński) is one of the largest coastal lagoons in Europe, located on the German–Polish border in the southern Baltic Sea (53°48′ N, 14°08′ E). It covers an area of 687 km2, with an average depth of 3.8 m and a natural maximum depth of 8.5 m [35]. Around 40% of the lagoon, known as the Kleines Haff, lies within Germany, while the remaining 60%, called the Wielki Zalew, is located in Poland (Figure 1).
The lagoon’s hydrology is strongly influenced by the Oder River (Odra in Polish), which has a catchment area of roughly 120,000 km2 and an average discharge of 518 m3/s. The lagoon connects to the Baltic Sea via three outlets: the Dziwna, the Peenestrom, and the Świna. The Świna is an artificially deepened and maintained shipping channel. Already in 1939, the channel had a depth of 9.6 m and was deepened to 10.5 m across the entire lagoon in 1984. From 2022, the maximum depth was increased to 12.5 m. The Świna accounts for around 70% of the lagoon’s outflow. These connections allow occasional saltwater intrusions from the Baltic Sea, maintaining lagoon salinity between 1 and 3 PSU [35].
The Oder River is also the main source of nutrients, delivering more than 95% of the lagoon’s nitrogen and phosphorus load—equivalent to 46,266 tons of total nitrogen (TN) and 1635 tons of total phosphorus (TP) annually [36]. As a result, the river is the primary driver of the lagoon’s poor ecological condition. The OECD classifies the lagoon as hypertrophic, and the most recent HELCOM assessment [37] rated its eutrophication status as “bad.” Under the European Water Framework Directive (WFD), which assesses ecological quality based on several biological elements, including benthic flora and fauna, the lagoon is currently classified as having “insufficient” ecological status [38].

2.2. The Long-Term Monitoring Data and Calculations

The official monitoring of water quality is a legal obligation under the Water Framework Directive (WFD) [39]. For the Oder/Szczecin Lagoon, the German–Polish Border Waters Commission coordinates a joint monitoring program. This program includes comparative measurements between German and Polish laboratories every 2–3 years to ensure the consistency and quality of results. At present, three stations are sampled monthly in both the German and Polish parts of the lagoon. Samples are taken 1 m below the water surface and 1 m above the bottom (in the German part, this applies only at station M). Nutrients such as nitrogen and phosphorus, as well as oxygen and other water quality parameters [33], are determined according to various DIN EN ISO standards. All laboratories analyzing border waters operate under an established quality system certified according to ISO 17025 and use reference or equivalent methods [40].
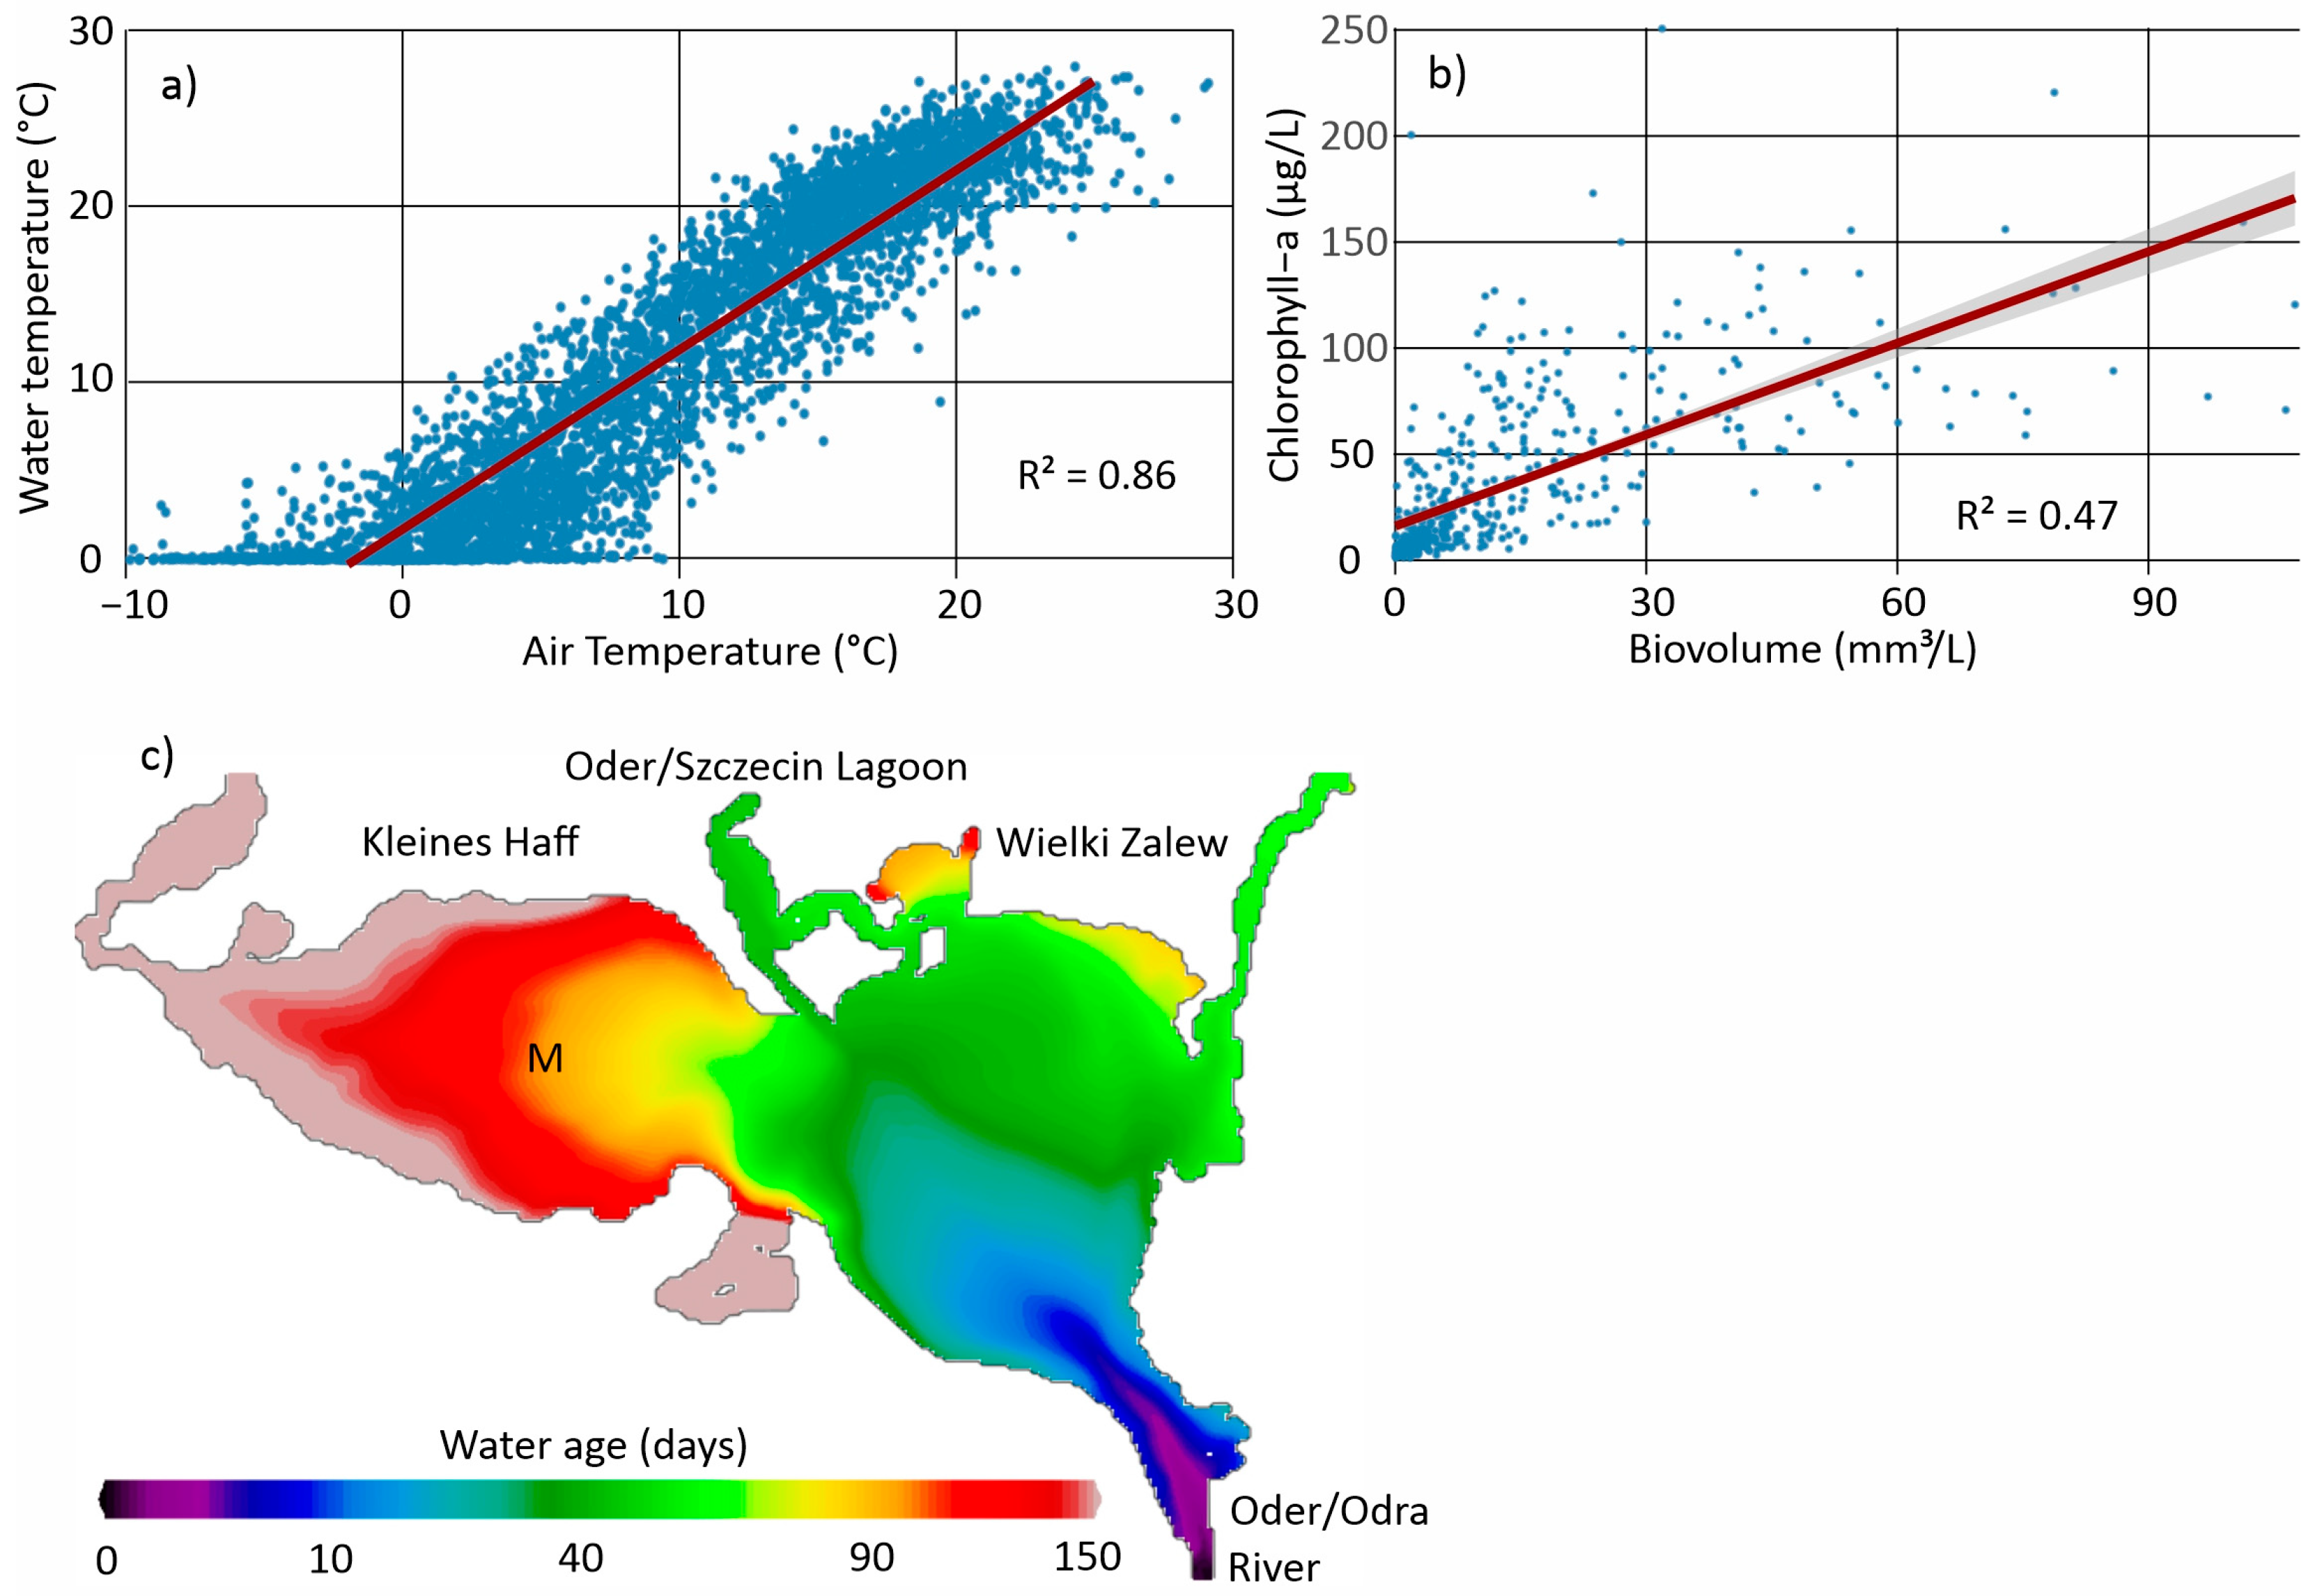
Phytoplankton and chlorophyll-a are determined according to HELCOM Guidelines 21/23 and DIN standard 16695 (since 2016). The number of algal cells counted is multiplied by a species-specific cell volume to calculate biovolume. Until the year 2009, the cell counting focused on dominant species and their biovolume. Other species were only grouped. From 2009, the counting became more detailed and included the abundance and biovolume of all species. Sampling takes place in winter, as well, but phytoplankton analyses are only carried out if chlorophyll concentrations exceed a threshold. In fact, phytoplankton data between December and February are lacking. For the years 2014, 2016 and 2018, data were missing. The full phytoplankton data is documented and attached as Supplementary Material (Table S1). Chlorophyll-a is measured using a photometric method. Because these methods differ fundamentally, the correlation between algal biovolume and chlorophyll-a is generally weak (Figure 2b).
For this study, only data from station M in the German part of the lagoon (Kleines Haff) were used. This station provides the most complete dataset, especially for phytoplankton. Additionally, station M is not directly influenced by the Oder River discharge. Our model simulations show that, on average, it takes river water about 100 days to reach this location (Figure 2c). Consequently, short-term changes in river discharge can be neglected when analyzing temperature-driven effects on timescales of days to months. By contrast, stations in the eastern lagoon (Wielki Zalew) are strongly influenced by the river.
Air temperature data were obtained from the Norwegian Meteorological Institute (MET Norway). The model-based data are provided on a spatial grid, with one grid point located close to station M. Near-surface water temperatures were derived from the ERGOM model. For analyses of hot and cold years, as well as heatwaves, we used air temperature data. Apart from temperatures below 4 °C, air and surface water temperatures are strongly correlated (Figure 2a), and air temperatures allow better comparability with climate model projections.
For each decade, monthly, seasonal, and annual mean air temperatures (measured at 2 m height above the water surface) were calculated, along with their standard deviations. Years (or months) with mean temperatures above the decadal mean + 1 SD were classified as warm, those below the decadal mean—1 SD as cold, and all others as normal. This classification was applied separately to monthly, seasonal, and annual values. Seasons were defined as follows: spring (March–May), summer (June–August), autumn (September–November), and winter (December–February). Extremes are compared to the mean value of all considered years, called “moderate years”.
Heat- and coldwaves were identified using the 90th and 10th percentiles based on daily temperatures, respectively. Events lasting at least five consecutive days above (heatwave) or below (coldwave) these thresholds were considered. Only events between May and September were included, as these are most relevant for ecological analysis. The selected heatwave periods, focused mainly on August, were 8–28 August 1997, 28 July–1 August 2002, 2–11 July 2006, 14–18 August 2015, and 23 August–1 September 2019. Cold periods were identified in May: 7–22 May 1995, 5–9 May 2001, 2–11 May 2010, 14–18 May 2015, and 1–11 May 2017.

2.3. The Ecosystem Model Approach (ERGOM)

We applied the 3D biogeochemical model ERGOM (Ecological ReGional Ocean Model) developed by Neumann et al. [41]. The model was recently evaluated by the European Commission [42] and is recognized as one of the leading marine biogeochemical models in Europe. Its circulation component is based on the Modular Ocean Model (MOM5.1), while the biogeochemical module employs ERGOM version 1.2. The model was specifically adapted for the Oder Lagoon, using a high horizontal grid resolution of 150 m. Vertically, the water column was divided into 28 layers, with thicknesses ranging from 0.25 m near the surface to 0.5 cm near the bottom. Open boundary conditions from a 2 km resolution Baltic Sea model were applied at the lagoon’s three outlets to the Baltic Sea.
The full Baltic Sea model, including its biogeochemical cycles, processes, and state variables, is described in Neumann [43]. The original model includes three functional phytoplankton groups: small algae (usually r-strategists, mainly diatoms), large algae (usually K-strategists, e.g., some flagellates), and N-fixing algae (mainly cyanobacteria). For the lagoon application, an additional freshwater phytoplankton group was introduced, which grows under very low salinity and has higher light sensitivity. Together, these four groups realistically reproduced the seasonal development and biomass of phytoplankton in the lagoon [36]. In the model, 2.5 g C/m3 corresponds to approximately 100 µg/L chlorophyll-a.
The model accounts for temperature- and oxygen-dependent mineralization processes, which release dissolved inorganic nitrogen and phosphorus from organic matter in both the water column and sediments. In oxygen-rich conditions, phosphate binds with iron oxides to form particles that settle in the sediments. These can be resuspended by erosion and redistributed by currents. Under anoxic conditions, iron oxides are reduced, releasing dissolved phosphate back into the water. Oxygen is produced through primary production and consumed by respiration and mineralization. Furthermore, extracellular excretion by phytoplankton leads to non-Redfield carbon uptake. Model validation and application to the lagoon are described in Neumann et al. [36].
Meteorological forcing data were obtained from the coastDat-3 dataset [44] and the Norwegian Meteorological Institute. Wind data are provided as hourly averages at 10 m height with a 12.5 km spatial resolution. Discharge and nutrient load data for the Oder, Uecker, and Zarow Rivers were supplied by the Instytut Meteorologii i Gospodarki Wodnej, the Landesamt für Umwelt, Naturschutz und Geologie Mecklenburg-Vorpommern, and Friedland et al. [45]. The climate change model experiment covered six years, used the same input data, but assumed air temperatures to be 1.5 °C higher.

3. Results

3.1. Long-Term Developments and the Role of Changing External Loads

Annual, seasonal and short-term weather effects in a lagoon are usually superimposed by changes in external nutrient loads. Consequently, the analysis of weather-related effects requires knowledge about changes in nutrient loads on different temporal scales. This is especially the case in the Oder Lagoon, where the large Oder River contributes large amounts of water and nutrients to the lagoon.
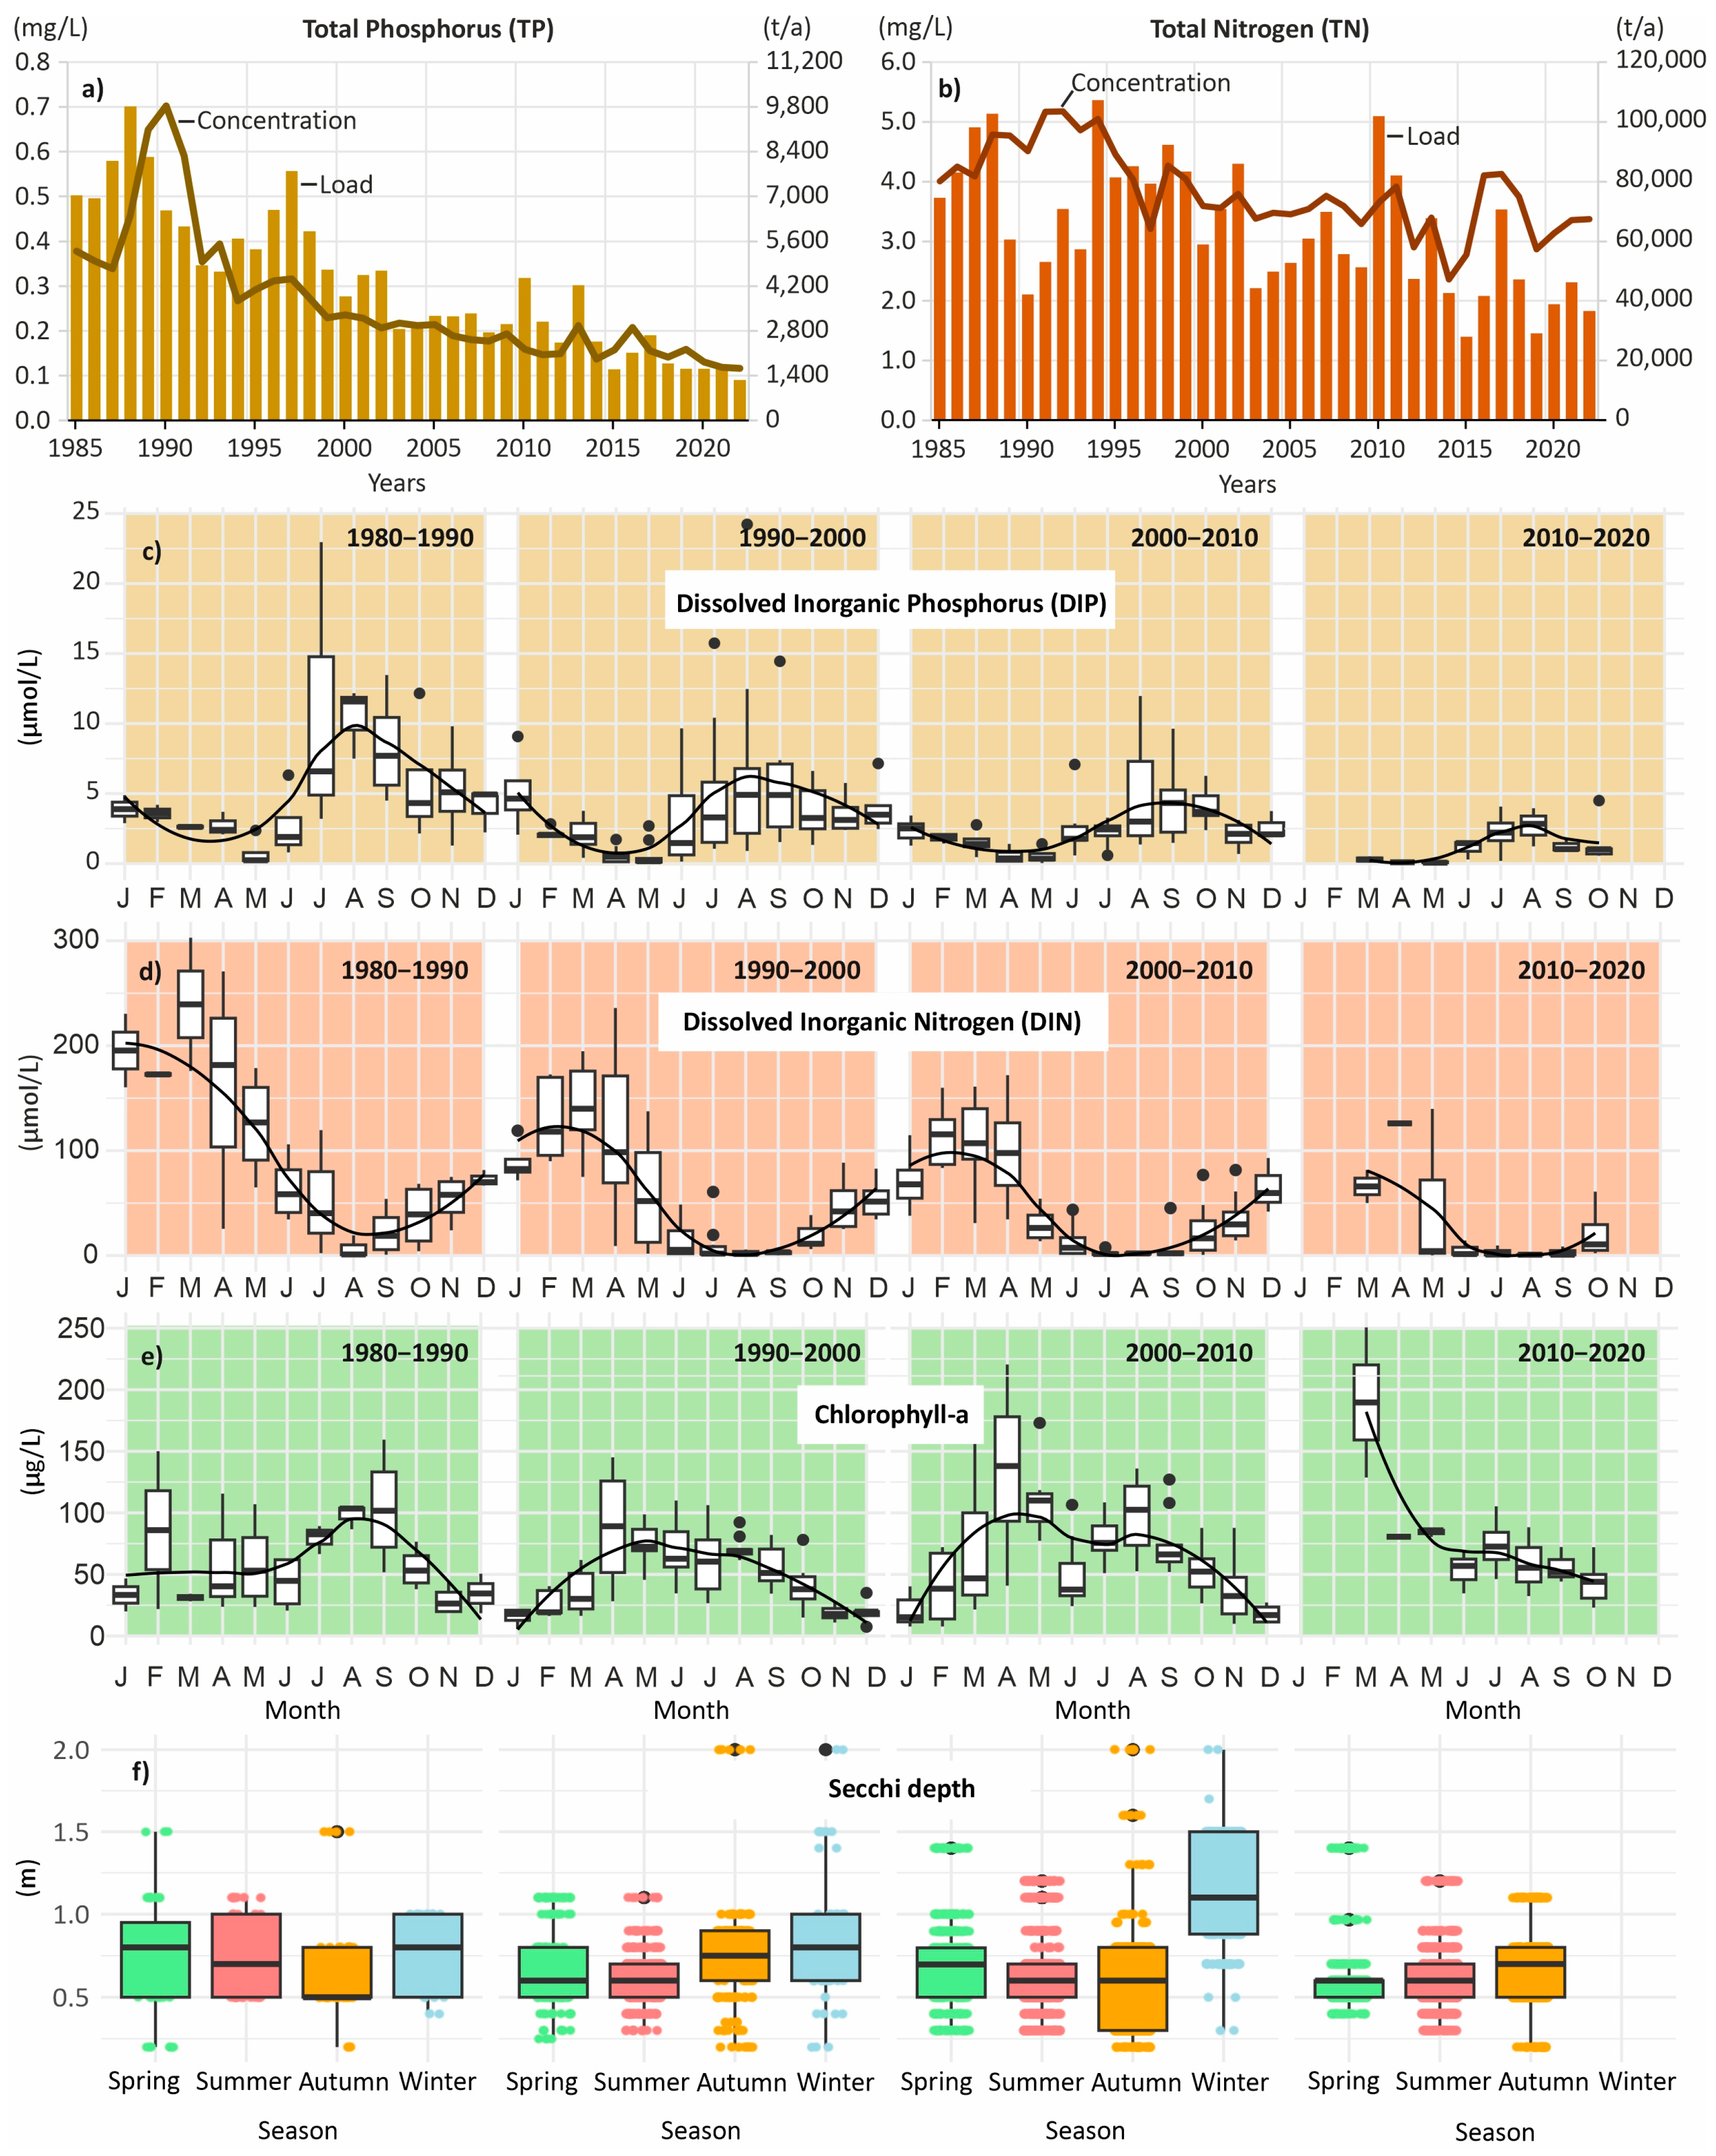
Between 1985 and 2002, nutrient concentrations in the Oder River, and consequently the loads to the Oder Lagoon, declined (Figure 3a,b). Total phosphorus (TP) loads peaked in the late 1980s at about 9800 t TP/a. Due to improved urban and industrial wastewater treatment and economic restructuring, these loads decreased to about 1600 t TP/a by the late 2010s, with even lower values in dry years. Total nitrogen (TN) loads reached maxima above 100,000 t TN/a but have since fallen below 40,000 t TN/a, and in some dry years even below 30,000 t TN/a. The reductions in nitrogen and phosphorus loads differed in magnitude, resulting in a shift in the N/P ratio. While the N/P ratio was around 10 until the early 1990s, it has risen to above 25 in recent years. Consequently, the relative availability of nitrogen in external loads has increased over the past 40 years.
The long-term reduction in riverine nutrient loads has led to lower nutrient concentrations in the surface waters of the entire lagoon. Station M, located in the central western bay (Kleines Haff), more than 40 km from the Oder River, illustrates these changes. Over the past 40 years, concentrations of dissolved inorganic phosphorus (DIP) have decreased in all seasons, and phosphorus has consistently become a limiting nutrient at Station M during March and April (Figure 3c). Dissolved inorganic nitrogen (DIN) concentrations show a similar decline, and nitrogen shortages now occur in July and August. Despite these reductions, chlorophyll-a (chl-a), an indicator of total algal biomass, has still not shown a significant decline over the past 40 years (Figure 3e). Similarly, nutrient load reductions have not led to an increase in water transparency (Figure 3f). This indicates that productivity in the Kleines Haff remains unaffected by nutrient limitation, and Station M remains well-suited for analyzing the effects of weather-related phenomena.

3.2. Long-Term Phytoplankton Concentration

The monitoring data are limited by their temporal resolution, as sampling is conducted only once per month. To address this limitation, we applied a 3D ecosystem model to complement the monitoring data and capture short-term dynamics.
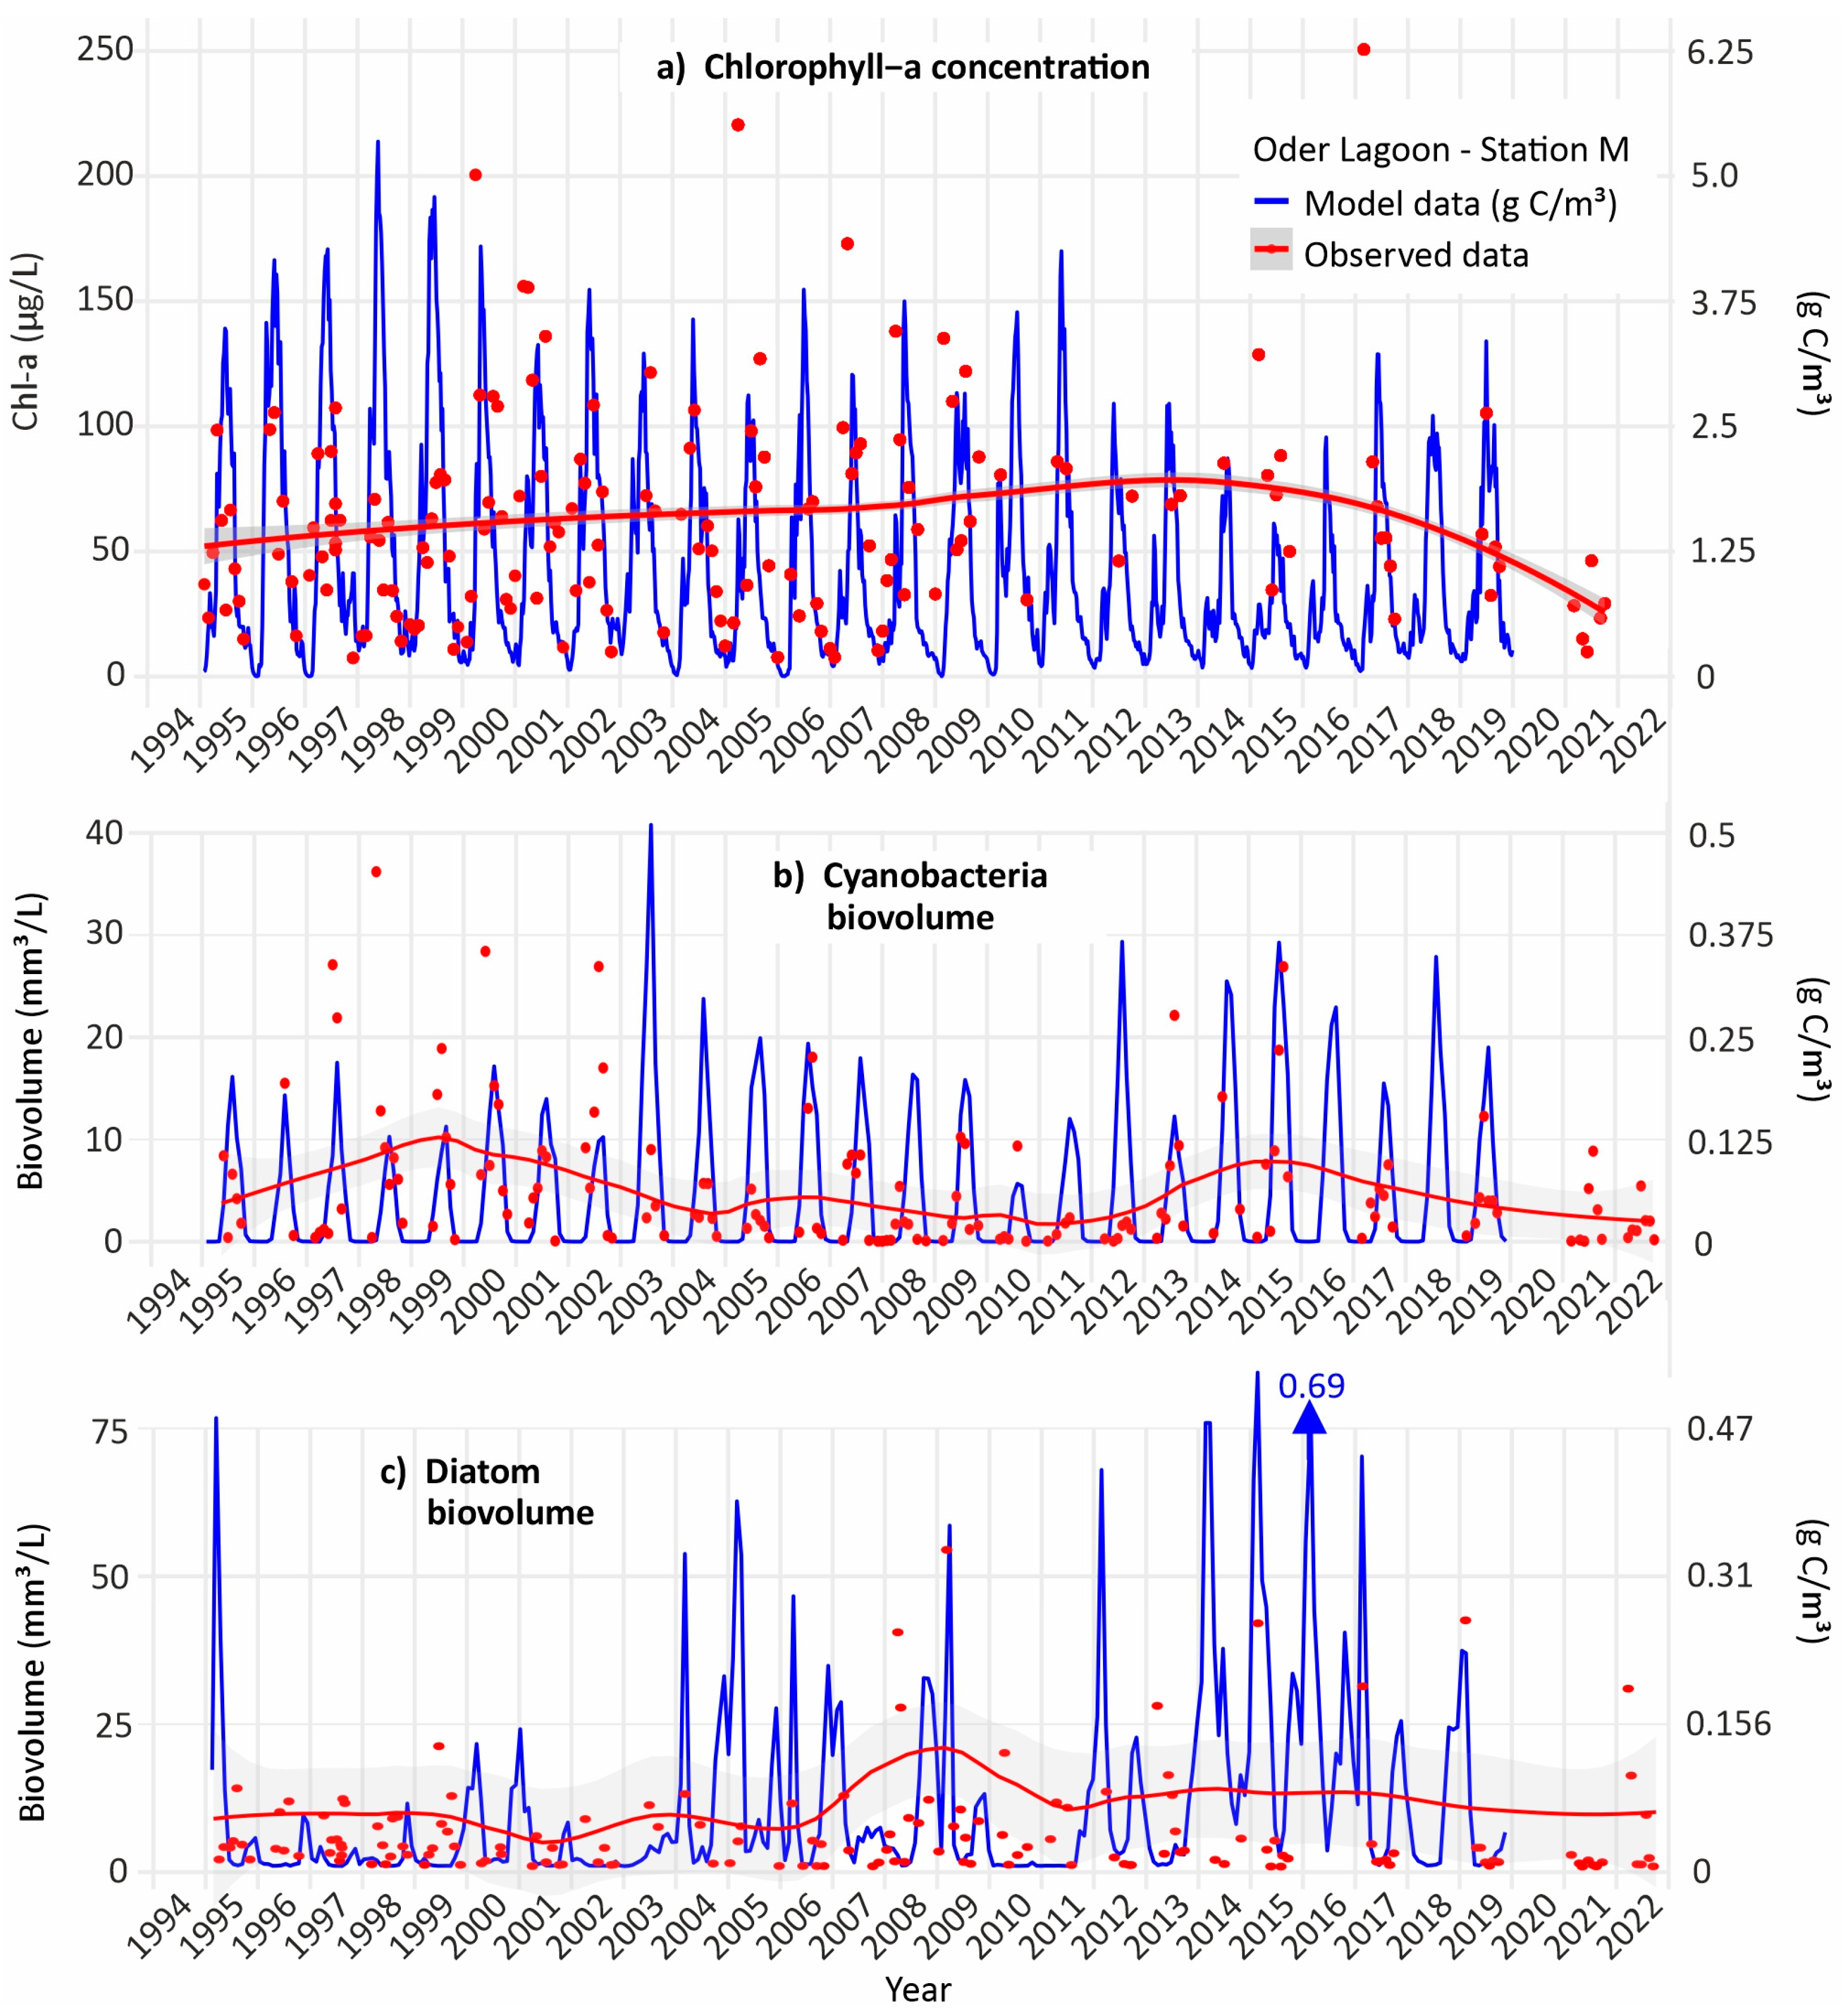
The model reproduces both the quantity and seasonal patterns of chlorophyll-a reasonably well compared to observations (Figure 4a). It indicates a decreasing trend in chlorophyll-a concentrations over the last 25 years at 1 m depth at Station M, consistent with reduced nutrient loads. However, this trend is overlain by strong interannual variability. In contrast, the monitoring data, due to spatial patchiness and limited temporal resolution, do not show a reliable long-term trend. Still, both the model and observations suggest that the magnitude of extreme blooms has decreased in the last decade, with strong blooms no longer occurring in recent years.
Two phytoplankton groups are of particular interest in this context: cyanobacteria and diatoms. Both are represented as functional groups in the model. Cyanobacteria are quantitatively important (Figure 4b) and have the potential to form harmful algal blooms. Monitoring data suggest a decline in extreme summer cyanobacteria biovolume peaks over the last 25 years. In the 1990s the model underestimates these extreme peaks. During the last 15 years, the model data tends towards increased cyanobacteria peaks that are in agreement or even higher than the data. Higher recent cyanobacteria peaks in the model data may be explained by declining nitrogen concentrations in summer surface waters, which, in the model, favor a higher biovolume of N-fixing cyanobacteria. Nonetheless, both data and model results show high interannual variability in cyanobacterial peaks.
Comparing observations and model results for diatoms suggests that the model underestimates the data in the 1990s and overestimates biovolumes after 2003 (Figure 4c). The model indicates an increase over the decades, whereas the observed data show no clear trend. However, Figure 3 indicates an increase in chlorophyll-a concentrations in spring during the last decades and a shift in the spring maximum from April to March. The spring bloom is largely formed by diatoms.
Comparison between the data and the model is challenging because the model frequently predicts diatom blooms in winter, while data collection typically begins in March. The role of ice-cover has not been assessed. Therefore, the available data do not allow for reliable model validation for diatoms. Nonetheless, diatom biovolumes exhibit strong interannual variability.

3.3. Long-Term Phytoplankton Class Composition

Did the substantial reductions in nutrient loads affect the long-term species composition in the western lagoon (Kleines Haff, station M)?
Diatoms (Bacillariophyceae and Fragilariophyceae) consistently represent high relative biovolumes in the Oder Lagoon, reaching up to 72% in certain years (Figure 5a). Bacillariophyceae, together with Fragilariophyceae (pennate diatoms), which gained quantitative importance after 2005, form the characteristic spring bloom. Fragilariophyceae are today again considered as part of the Bacillariophyceae class.
The raw data (Table S1) shows that in seven years, maximum diatom biovolumes during spring blooms in March and April exceeded 20 mm3/L, corresponding to up to 8 million individual cells per liter. This spring bloom is usually dominated by Diatoma tenuis, a Fragilariophyceae species. Biovolumes above 4 mm3/L during spring blooms are common.
Outside of spring, high species-specific diatom biovolume concentrations have also been observed in other seasons. For example, in September 1987 (74 mm3/L) and June 1999 (20 mm3/L), the large Bacillariophyceae Actinocyclus normanii, which frequently occurs in summer and autumn, formed blooms. In October 1978, Skeletonema subsalsum, which occurs in all seasons, reached a biovolume concentration of 20 mm3/L.
The classes Chlorophyceae and, less important, Trebouxiophyceae (green algae) had a high annual share until the mid-1990s, reaching up to 34% in some years (Figure 5a). They were particularly abundant in late spring and early summer, but their quantitative importance has declined in recent decades. The genus dominating in terms of biovolume is Scenedesmus, which reached biovolumes above 20 mm3/L in certain years, such as June 1992 and September 1987. Another species observed in higher quantities in a few years is Planctonema lauterbornii, presently called Binuclearia lauterbornii.
Cryptophyceae, usually Rhodomonas lacustris (Plagioselmis lacustris), exhibit high variability in occurrence and were observed mainly in spring and winter (Figure 5b). Since winter data are incomplete, their relevance may be underestimated. The same applies to Dinophyceae (dinoflagellates), a class that includes species capable of forming harmful algal blooms. The raw data (Table S1) shows that several species occur in the Oder Lagoon (e.g., Peridiniales spp., Amphidinium spp., and Gonyaulax spinifera), with biovolumes occasionally exceeding 2 mm3/L, particularly in spring.
In some years after 2015, between May and July, Prymnesiophyceae (golden algae) were observed (Figure 5b). Typically, biovolumes were well below 1 mm3/L but reached nearly 2 mm3/L in May 2015. These algae gained public attention after causing a large-scale organism kill (mussels, fish) in the Oder River in summer 2022, suggesting that significant amounts may have subsequently entered the lagoon.
Cyanophyceae (cyanobacteria) are often the quantitatively dominant phytoplankton class in the Oder Lagoon, accounting for up to 69% of the annual relative biovolume. They dominate in summer and autumn and can comprise up to 90% of the phytoplankton biovolume during these seasons, as observed in summer 2014 (Figure 5). Cyanobacteria in the Oder Lagoon frequently reach biovolumes above 5 mm3/L and cell numbers exceeding 200 million per liter during summer blooms (Figure 3b).
The most important cyanobacteria species in the lagoon include Microcystis spp. (e.g., Microcystis flos-aquae, Microcystis aeruginosa), but other species such as Aphanothece spp., Aphanizomenon flos-aquae, Limnothrix redekei, Planktothrix agardhii, Woronichinia spp., and Synechococcus also occasionally reach high concentrations. Of the 50 samples with cyanobacteria biovolumes above 10 mg/L, only two were dominated by species other than Microcystis: Planktothrix agardhii in late August 2000 and Aphanizomenon flos-aquae in late August 2002. In summer 1979, Microcystis biovolumes exceeded 50 mm3/L on two occasions.
All three dominant species can potentially produce cyanotoxins. Many Microcystis strains, in particular, produce toxic microcystins and are frequently associated with harmful algal blooms. Biovolumes above 30 mm3/L were observed exclusively before 1990.
Overall, the substantial reduction in nutrient loads over the past 25 years did not result in strong changes in phytoplankton composition at station M in the western lagoon, taking into account that the determination method was modified after 2008. However, within the diatoms, a shift took place with an increase in Fragilariophyceae after 2005 and a decrease in Bacillariophyceae.

3.4. Phytoplankton in Hot and Cold Years

In addition to eutrophication levels and external nutrient loads, parameters such as salinity, basin morphometry, and hydrodynamics influence phytoplankton abundance and composition. These factors are largely lagoon-specific and are particularly relevant when comparing different lagoons. An important parameter affecting phytoplankton within a lagoon across temporal scales is temperature.
During the 1980s, the mean air temperature above the water surface at station M was 8.2 °C. Between 2010 and 2019, the mean temperature rose to 9.44 °C, an increase of more than 1.2 °C over 30 years. Long-term changes in temperature and nutrient loads overlap, making it difficult to isolate temperature effects from the sparse monitoring data. Nevertheless, species composition exhibits strong interannual and seasonal variability (Figure 6), and differences in weather conditions between seasons and years likely play a major role.
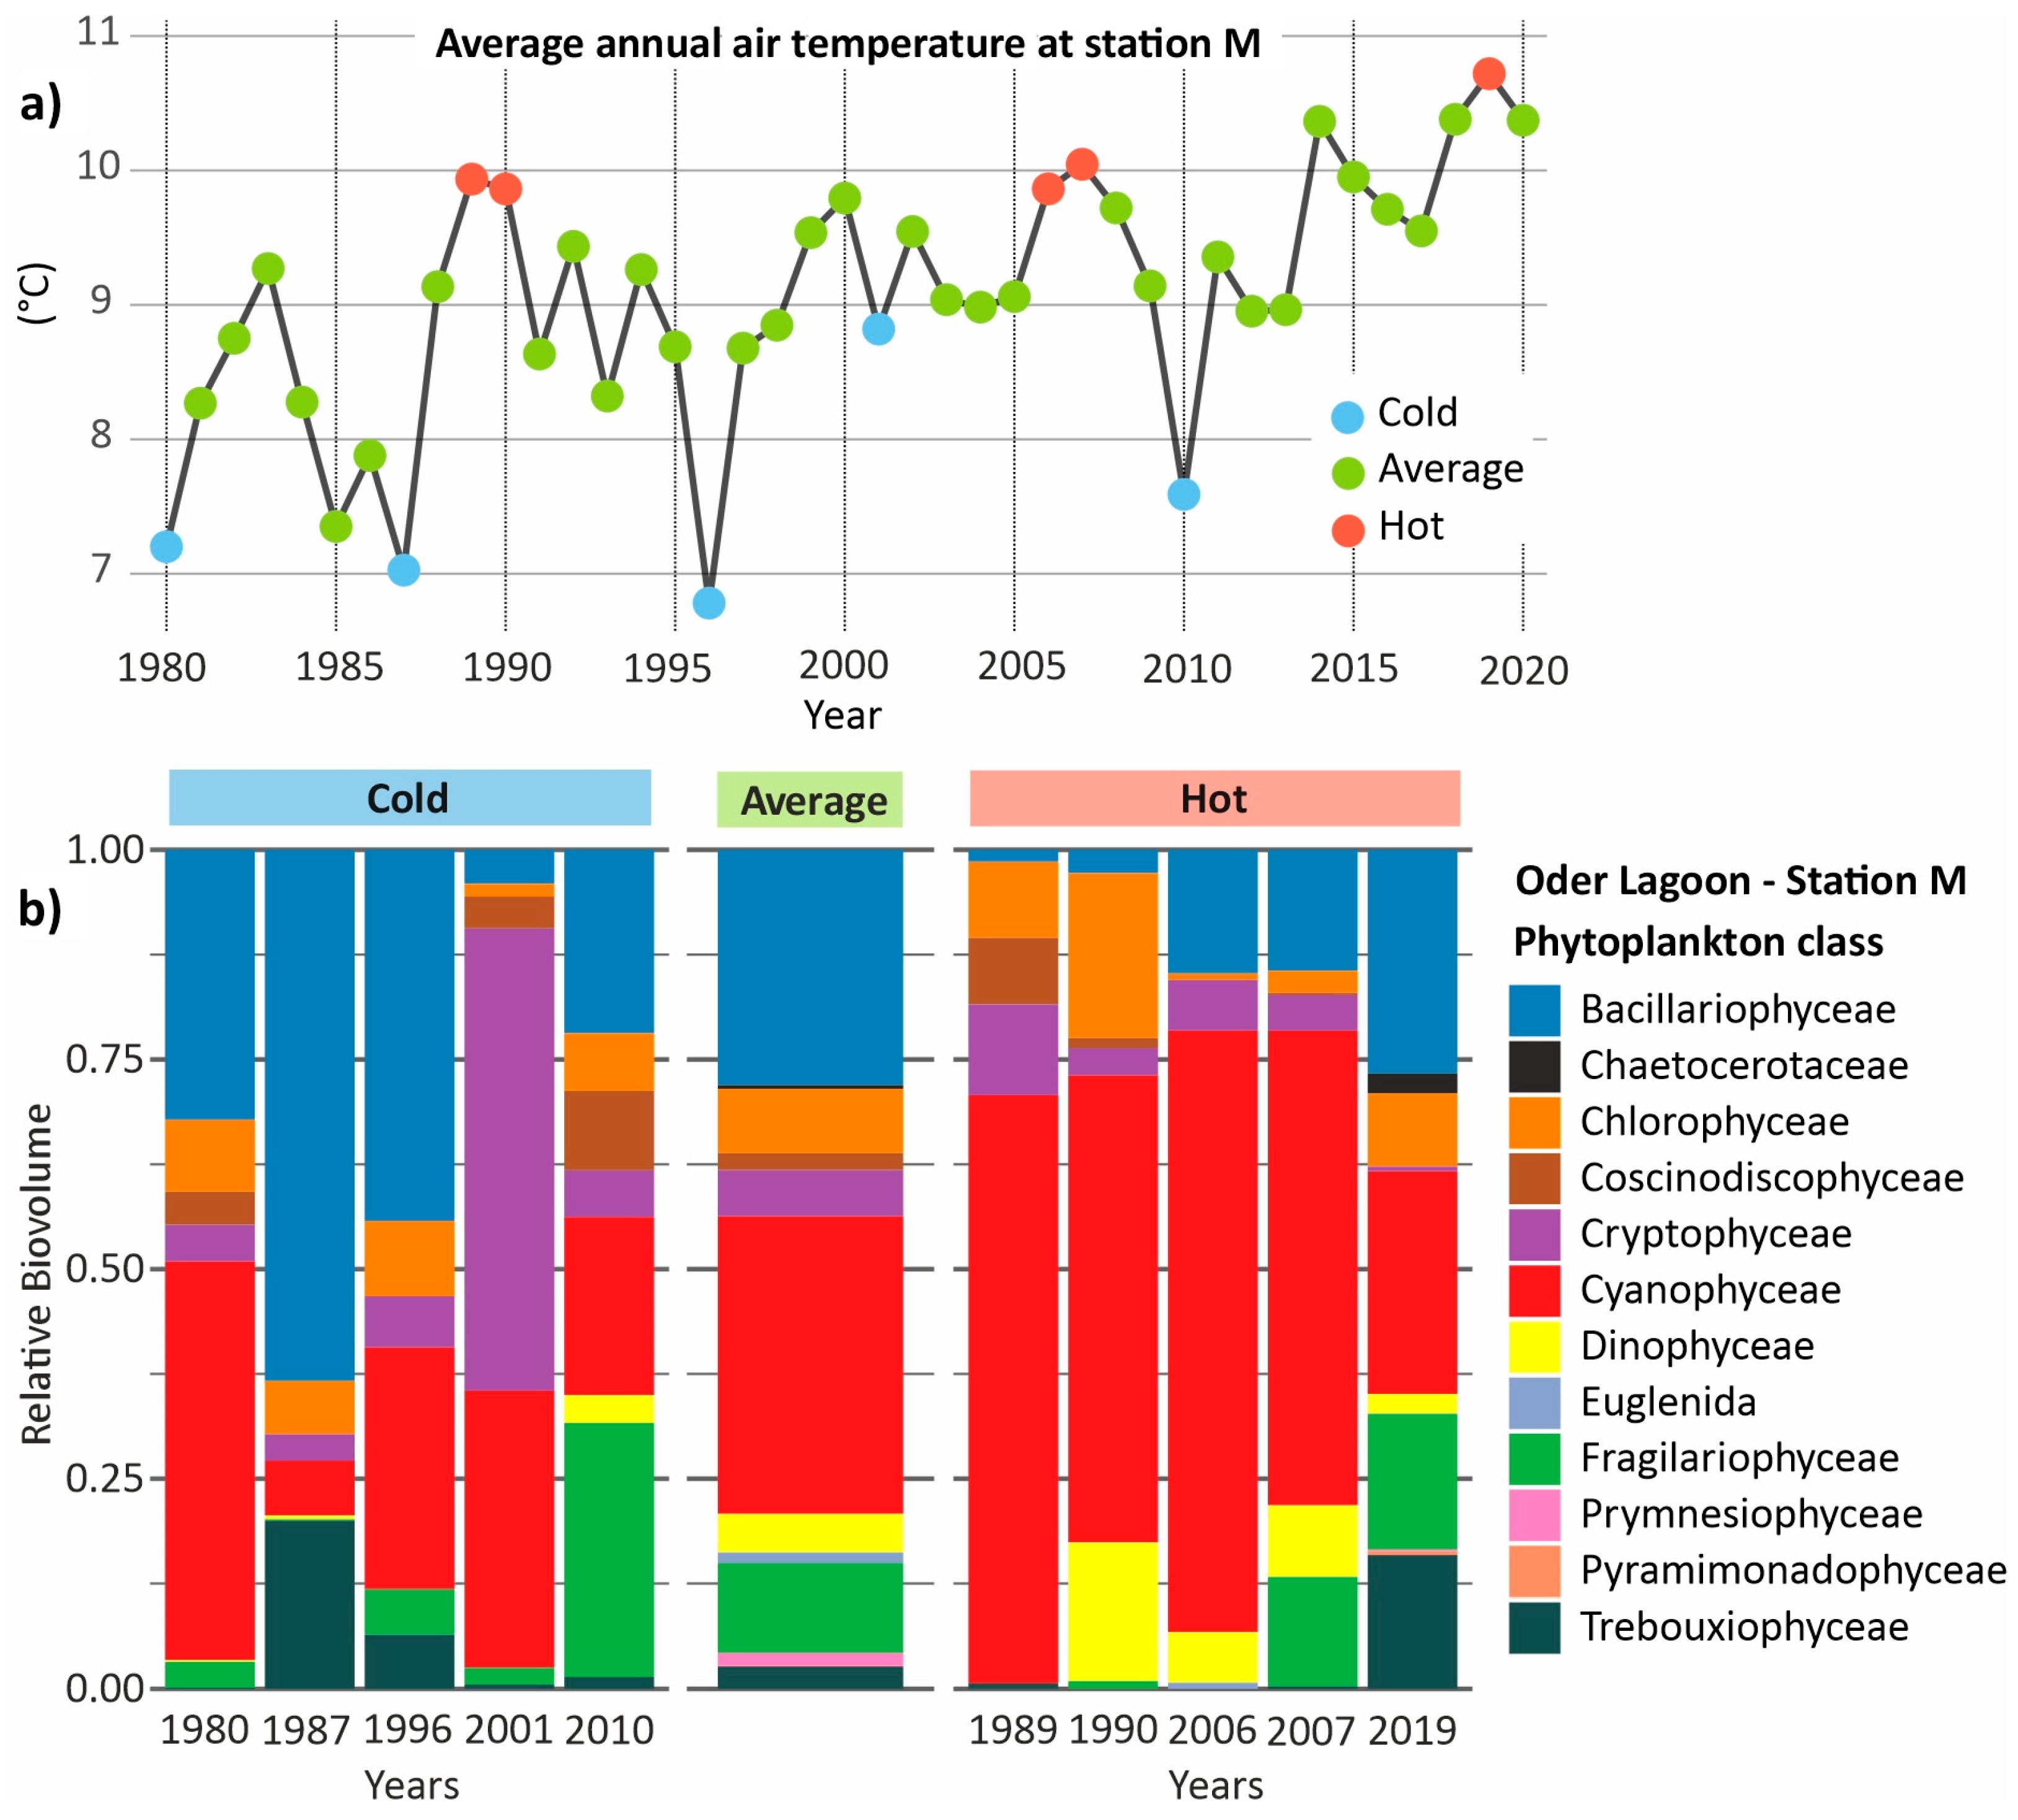
To analyze temperature effects on phytoplankton composition, hot and cold years were selected based on average annual temperatures. The five coldest years had an average annual temperature of 7.5 °C, while the five hottest years averaged 10.1 °C (Figure 5a). The years are distributed across the decades to minimize trend effects. One key question is what insights hot years can provide for the future under ongoing climate change and rising temperatures.
During average and cold years, diatom biovolumes (Bacillariophyceae together with Fragilariophyceae) account for approximately 40% of the total phytoplankton. In contrast, during hot years, diatoms represent only about 18% of the total.
Cyanobacteria are known to benefit from high summer temperatures, strong irradiance, and calm weather conditions that reduce vertical mixing in the surface water layer. This pattern is also evident in our data. Both Dinophyceae and Cyanophyceae appear to benefit from higher temperatures. Cyanophyceae contribute roughly 60% of the relative biovolume during hot years, 35% during moderate years, and about 30% during cold years.
Dinophyceae account for approximately 7% in hot years, 5% in moderate years, and 1% in cold years. However, these patterns are not consistent across all hot and cold years, and in some years, other phytoplankton classes dominate. For example, Cryptophyceae reached a relative share above 50% only in the slightly cooler year 2001.
In summary, the data suggest that cyanobacteria could become increasingly dominant under warmer climatic conditions, whereas diatoms may decline in relative abundance.

3.5. Phytoplankton in Hot and Cold Seasons

Comparisons between hot and cold years have limitations because average annual temperatures do not reflect seasonal temperature fluctuations. A single very hot or cold season can strongly influence the annual average, while hot and cold seasons may partially offset each other. Considering this and the pronounced annual succession of phytoplankton, a more detailed analysis of hot, cold, and average seasons is warranted.
Figure 5b indicates that phytoplankton composition in autumn is comparable to that in summer. For winter, the available data are insufficient for reliable analysis. Consequently, this study focuses on spring and summer. Figure 7 provides a comparison of phytoplankton composition between years with hot and cold springs and summers.
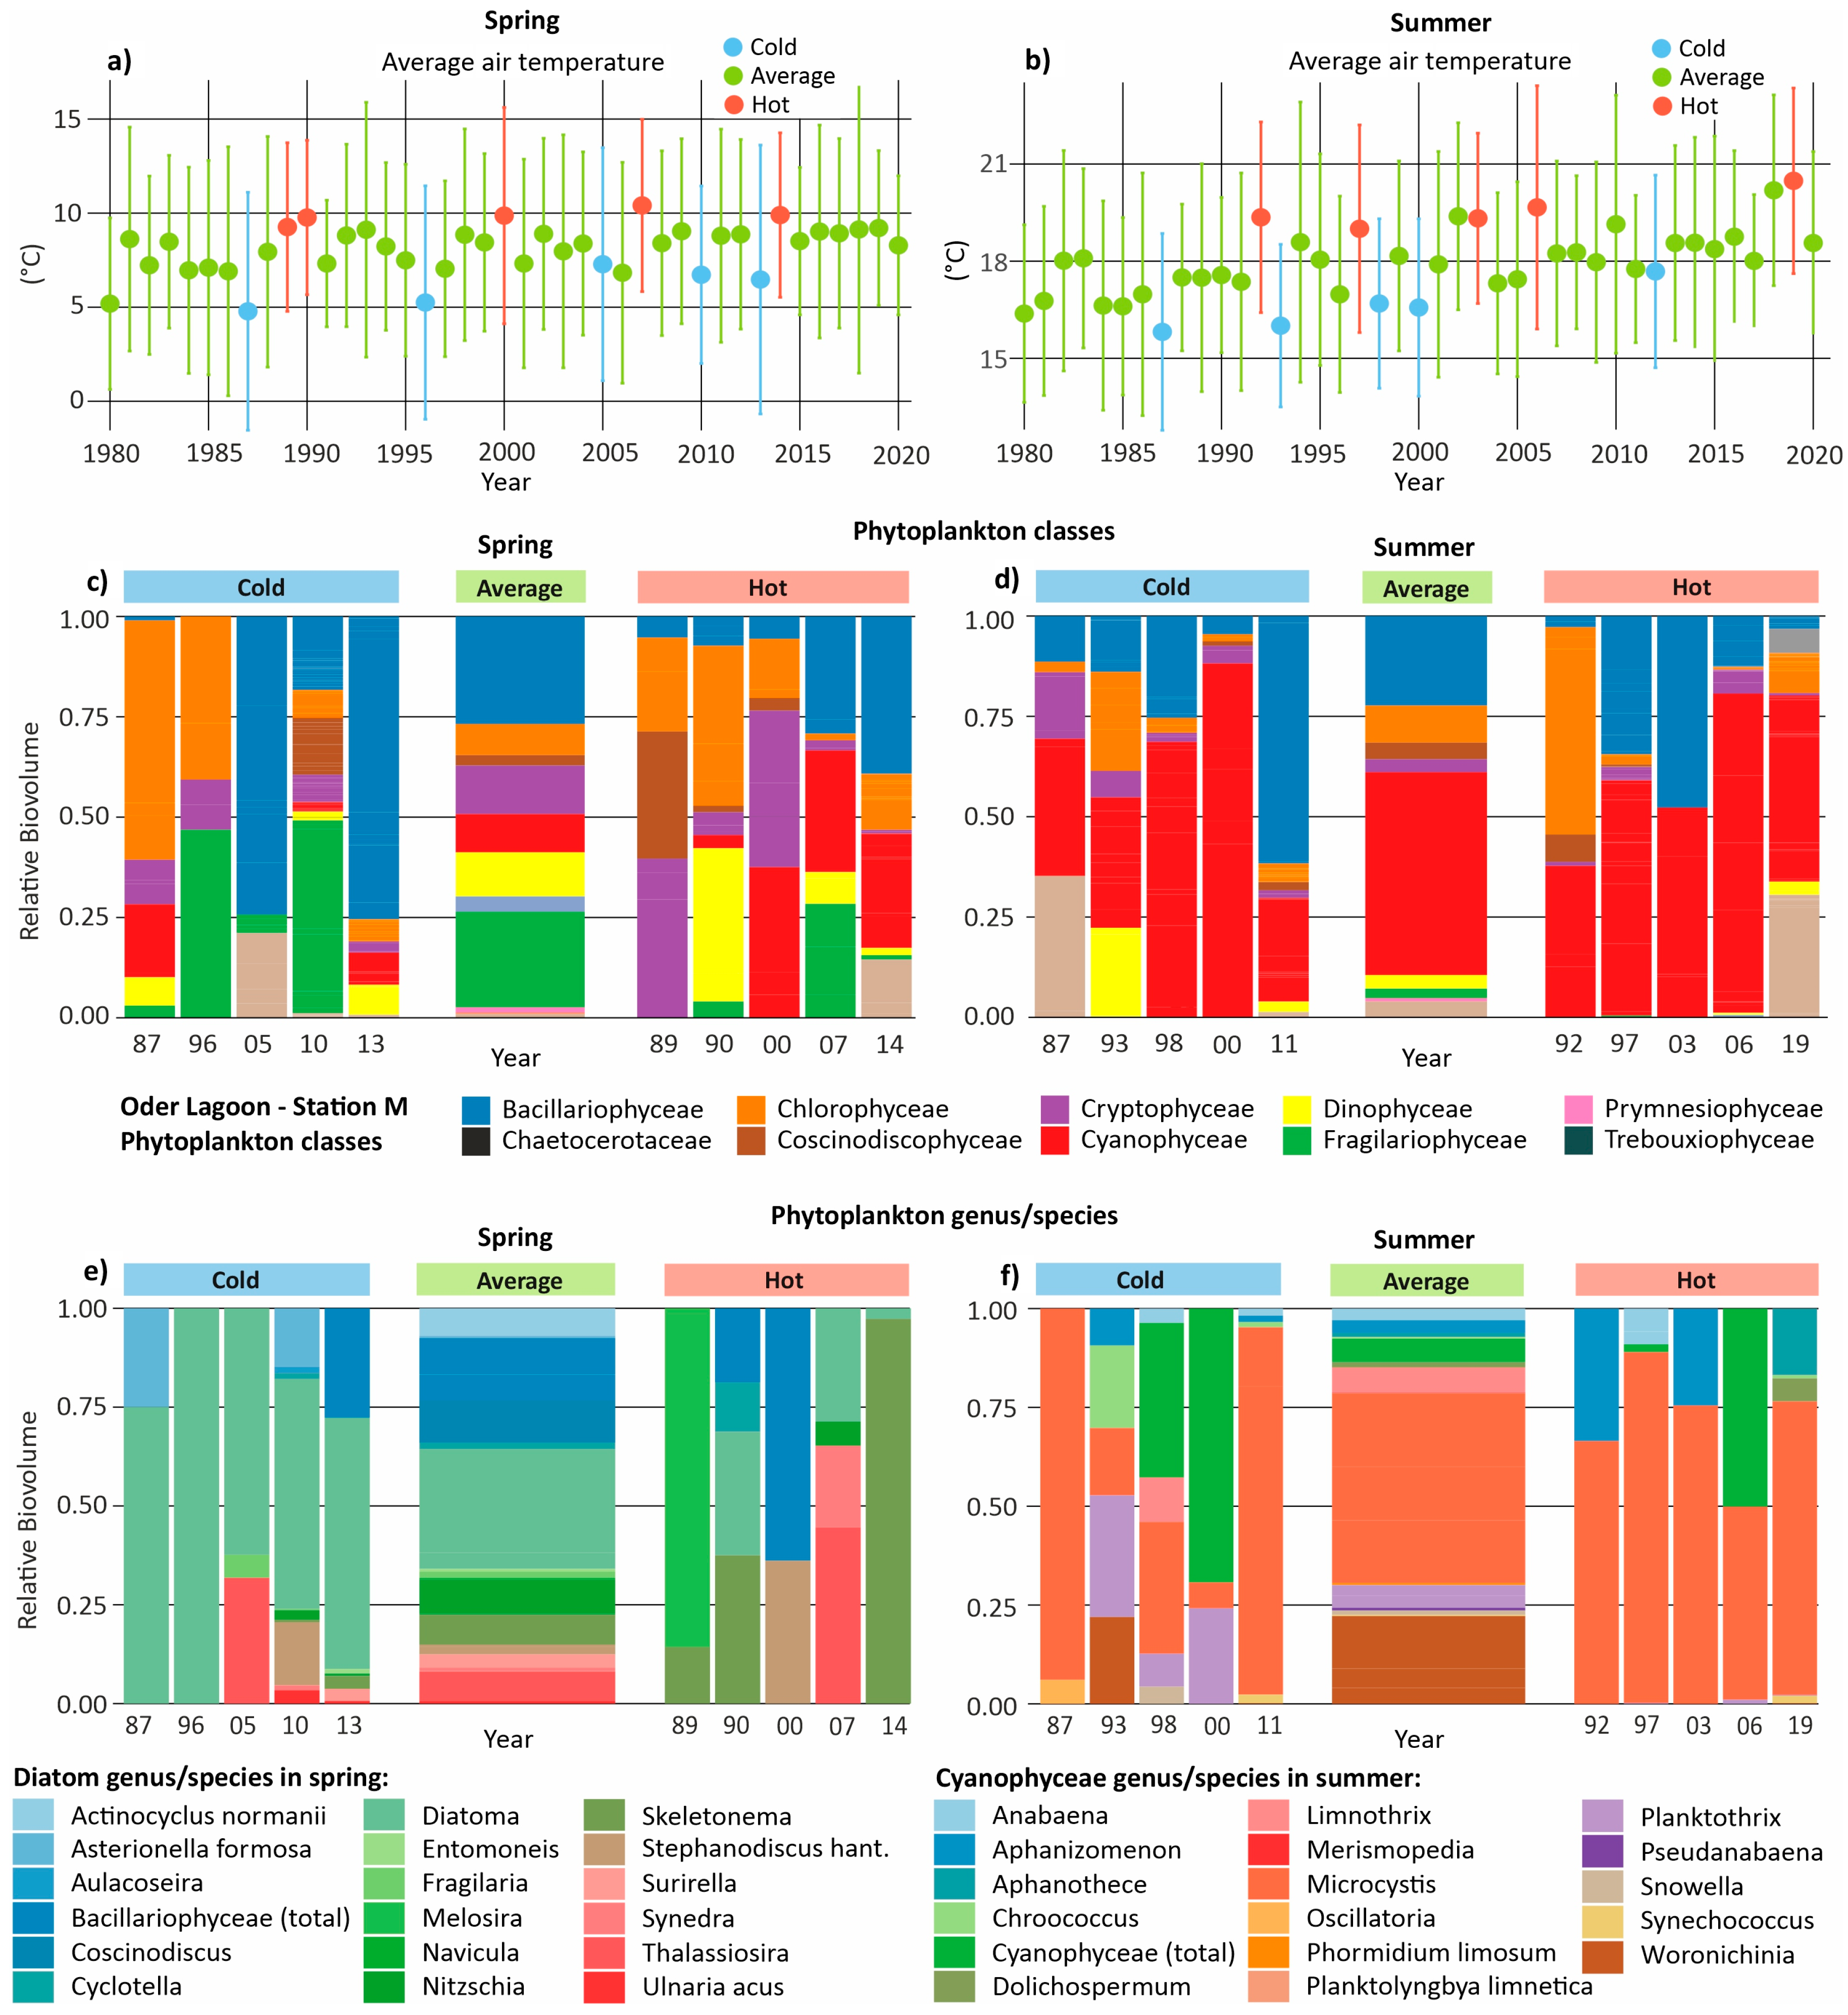
At the Oder Lagoon, the trend of rising air temperatures is evident in every month, but most pronounced during summer (July and August), when average temperatures increased from 15.6 °C to 17.5 °C—an increase of more than 1.9 °C over the 30-year period. In years classified as having a cold summer, average air temperatures were about 16.5 °C, whereas hot summers averaged 19.7 °C (Figure 7b). For spring, cold years showed average air temperatures of about 6 °C, while hot years reached nearly 10 °C (Figure 7a). The temperature differences between hot and cold seasons are substantial. Despite this, no systematic differences at the phytoplankton class level (Figure 7c,d) are apparent between hot and cold seasons. Strong interannual variability and limited data availability prevent the detection of reliable trends.
The annual phytoplankton succession in spring is typically dominated by diatoms, while cyanobacteria dominate in summer. Therefore, Figure 7e,f focuses on the species and genera of these two major groups. At the species level, differences between hot and cold springs are visible. In cold springs, species of the genus Diatoma (family Fragilariaceae) account for about 75% of all diatoms, whereas in hot springs they occur only sporadically and at much lower proportions. In contrast, hot springs are often characterized by the presence of Skeletonema, a cylindrical diatom with a silica frustule, as well as Melosira, which can become dominant.
For Cyanophyceae, Microcystis occasionally dominates during cold summers but becomes consistently dominant during hot summers, suggesting that high temperatures favor its growth. In cold summers, species of the diverse genus Planktothrix occur in several years, but they are absent in hot years. Conversely, species of the genus Aphanizomenon reach relative biovolume shares above 0.25 only in hot summers, in two observed years. Overall, species diversity appears higher in cold summers, whereas hot summers are strongly dominated by Microcystis.

3.6. Cyanobacteria and Diatoms During Hot and Cold Months

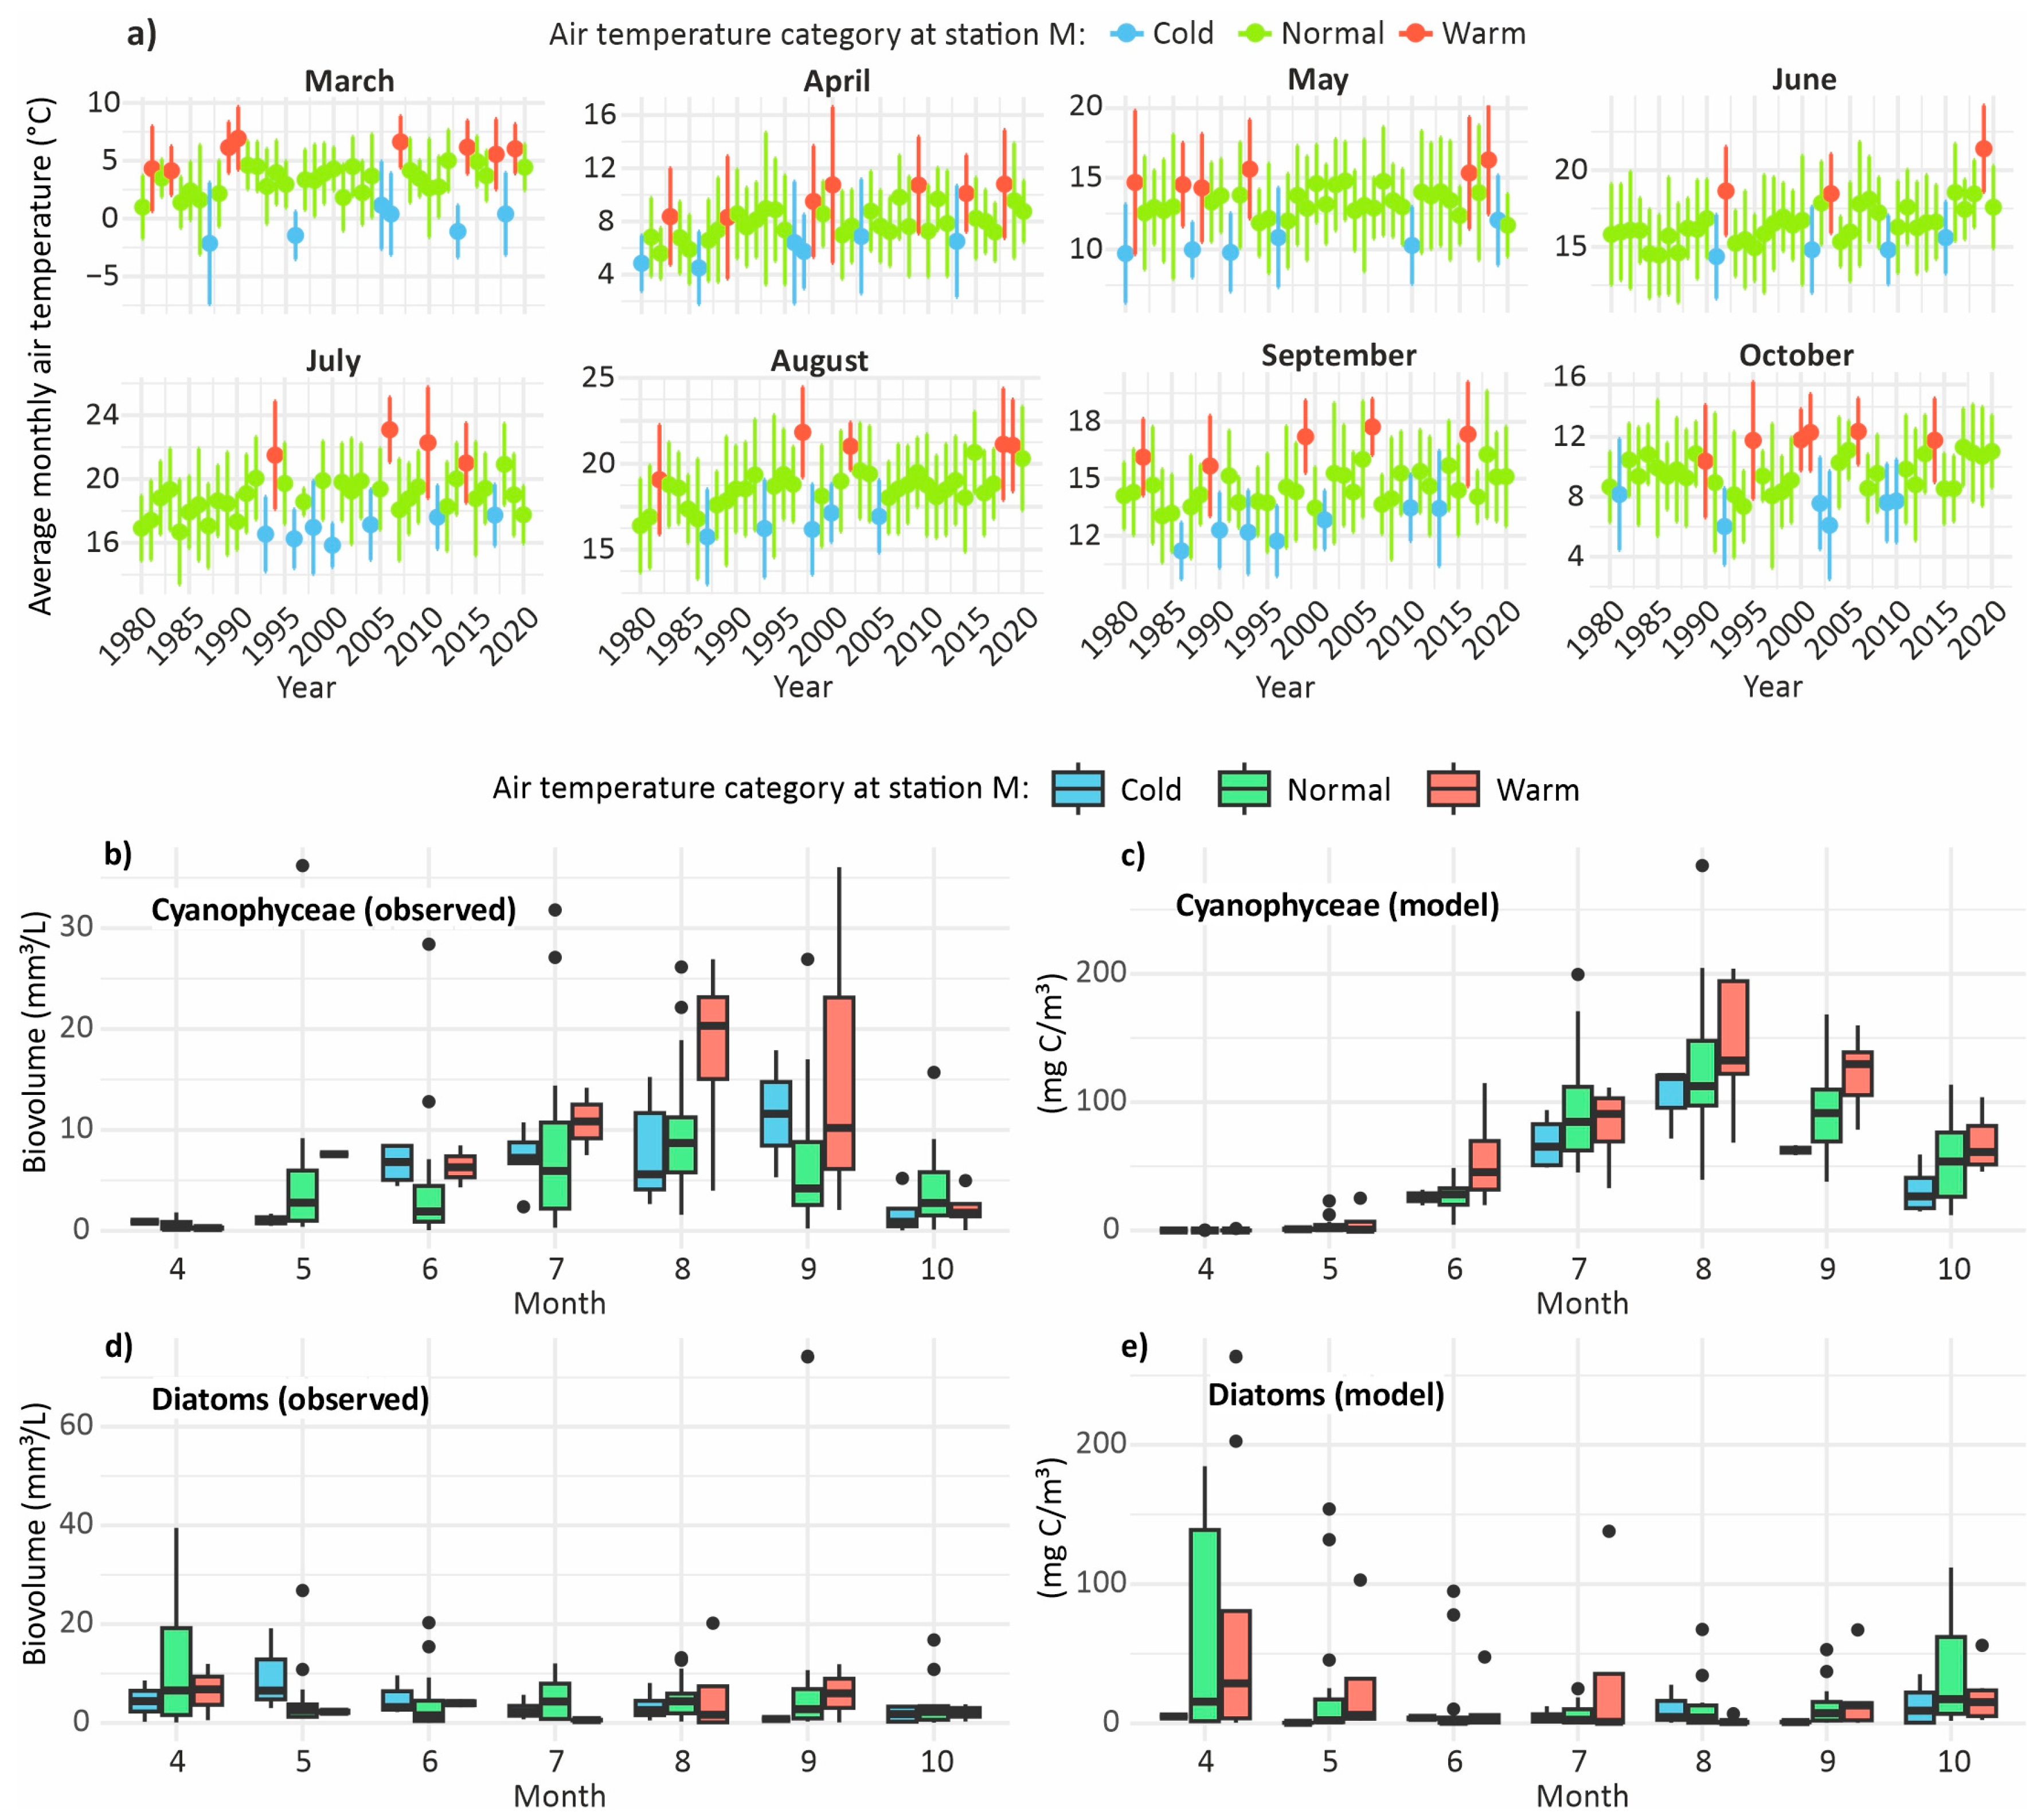
Because phytoplankton can rapidly adapt to changing environmental conditions, we compared hot and cold months between March and October (Figure 8a), focusing on cyanobacteria biomass (Figure 8b), diatom biomass (Figure 8d), and corresponding model results (Figure 8c,e). The model suggests that cyanobacteria benefit from hot months between June and October, developing higher biomasses than in normal or cold months, particularly in late summer and autumn. The average biomass difference between hot and cold months is around 10–20%. Observed biovolume data (Figure 8b) show a similar trend, but high variability and limited sample size reduce consistency. Nevertheless, the results indicate that between May and October, cyanobacteria benefit from higher temperatures, with maximum biomasses occurring in August and September.
For diatoms, the effects of hot months are less clear. While the model predicts higher diatom biomasses in hot spring months (April and May), this is not supported by the observational data. During summer, differences between hot and cold months are not well defined. It appears that diatoms may benefit from higher temperatures in spring, but temperature is not a major factor for their biomass in summer and autumn.

3.7. Phytoplankton During Heat and Cold Waves

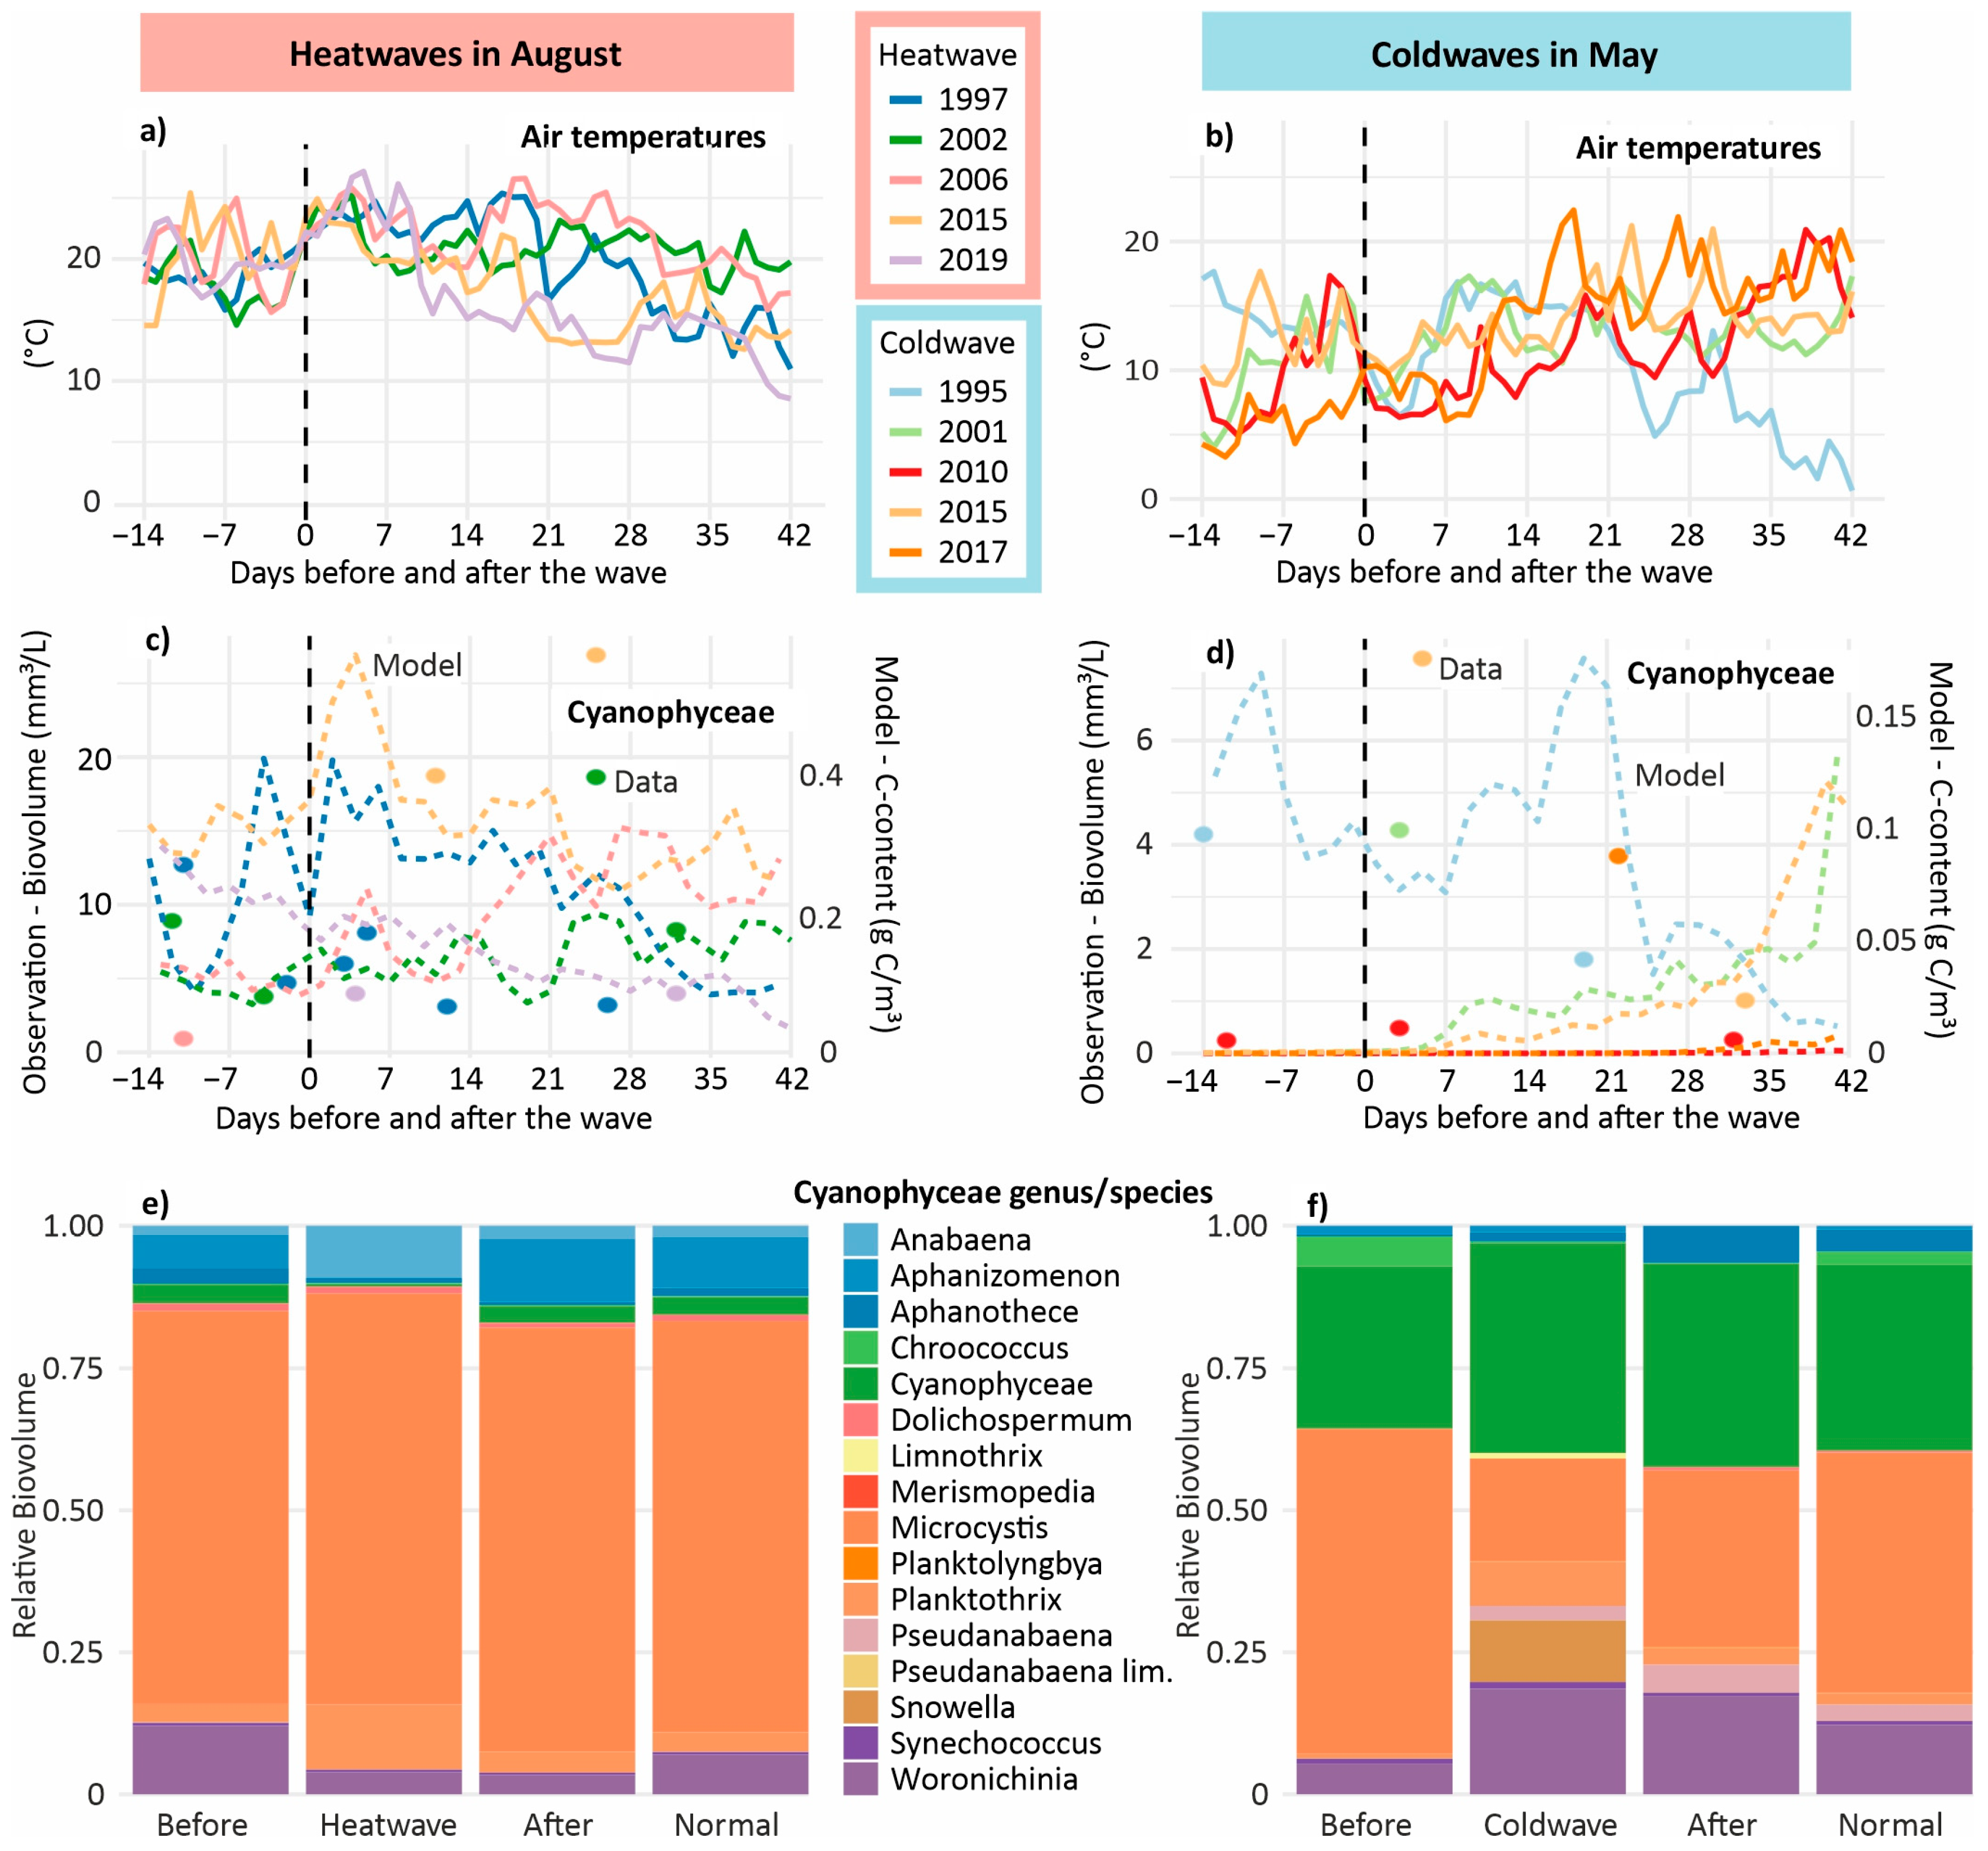
We go further into detail and assess the effects of heatwaves and coldwaves, lasting several days to weeks, on cyanobacteria and diatoms. Five years with heatwaves in August (with exception of July 2006) and five years with coldwaves in May were selected (Figure 9a,b).
The model suggests that in most years after a heatwave in August, the cyanobacteria biomass increases, but usually decreases the week after again. Usually, coldwaves in May do not have an effect on cyanobacteria, because their biomass is very low at that time. Only in 1995, the model suggests a decline (Figure 9c,d). The available monitoring data is indicated, but not suitable for this analysis.
The cyanobacteria species composition before, during and after heatwaves in August does not show significant differences and is similar to the normal situation in August, with a strong dominance of Microcystis.
With respect to diatoms, the model suggests neither during heatwaves in August nor during coldwaves in May immediate and significant changes in biomass (Figure 10a,b). During the coldwave in May 2015 and 2017 declines in diatom biomass, but since it starts already before the coldwaves, it remains uncertain if this results from temperature changes.
The species composition before, during and after the heat and coldwaves are is not very different from the normal situation (Figure 10c,d). During heatwaves in August, the diatom species Actinocyclus normanii is dominant and contributes over 95% of the biovolume, but this might be an artefact resulting from the few available data.

3.8. Phytoplankton Model Simulations—Effects of Increased Temperature

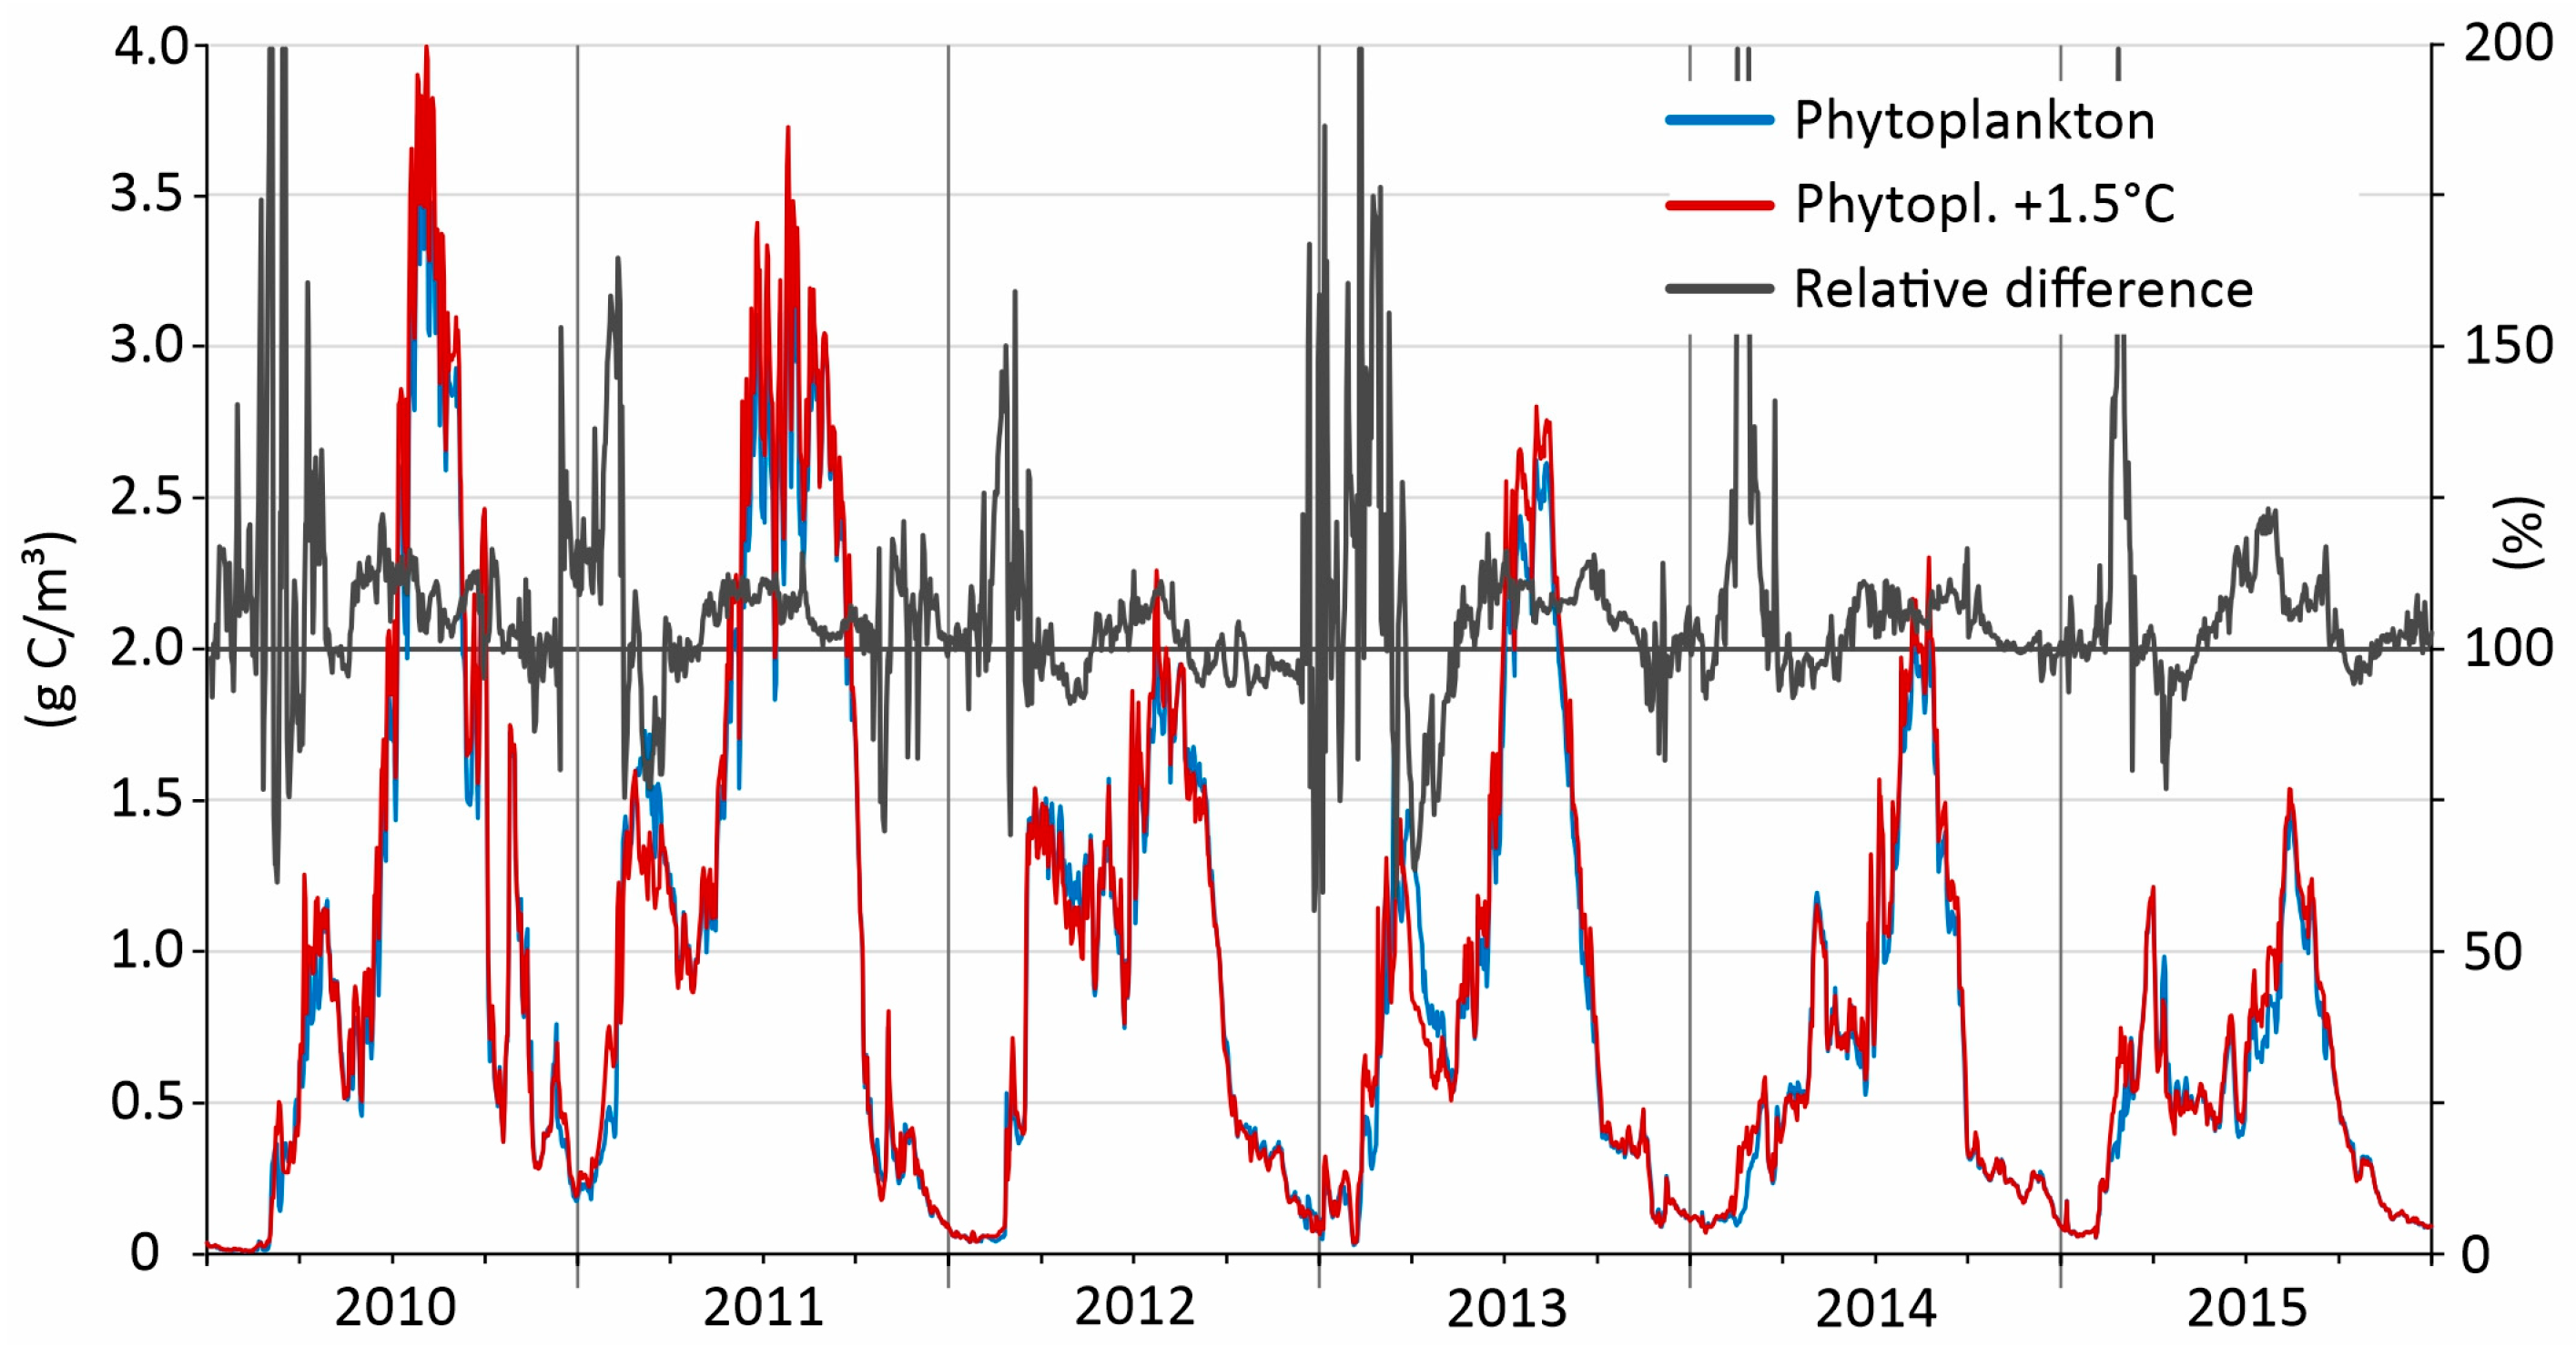
To obtain a better insight into the role of temperature on phytoplankton biomass, especially in different seasons of the year, we carried out an additional model simulation study for the years 2010–2015, where the air temperatures were increased by 1.5 °C (Figure 11). The relative difference between the model run representing the present situation for the water surface layer compared to the run with increased temperatures shows that, on average, the monthly near-surface phytoplankton biomass over the 6 years is increased by 4% when the temperature is increased by 1.5 °C. However, the interannual variability is high, and the increase differs between the months of the year, from −3% in May to +32% in February. In June, August and Sept the increase is about 5–6% and in July 9%.
Having a look at the absolute phytoplankton biomass increases, the average increase is highest in July and August (110 mg C/m3), while the model suggests an absolute increase of 5 mg C/m3 in February and 60 mg C/m3 in March.

4. Discussion

4.1. Long-Term Development of the Western Oder Lagoon

Strong reductions in external nutrient loads over recent decades have led to a decline in nitrogen and phosphorus availability in the western lagoon. In recent years, dissolved inorganic phosphorus has shown very low concentrations in March and April, while dissolved inorganic nitrogen has been depleted in July and August. Despite these changes, the lagoon remains in a highly eutrophic state, with major indicators such as chlorophyll-a and water transparency (Secchi depth) showing no clear improvements. Nutrient limitation seems not pronounced, as rapid nutrient remobilization processes in this shallow, well-mixed system ensures sufficient supply. This is also supported by model simulations. Water transparency in spring and summer averages 0.5–0.7 m, indicating that light availability remains a key factor controlling primary production.
Results from other Baltic lagoons demonstrate that external nutrient inputs maintain eutrophic or hypertrophic conditions, leading to elevated average Chl-a concentrations and shifts in community composition toward summer cyanobacteria dominance [46,47,48]. Once a system becomes highly eutrophic, as in the Oder Lagoon, weak or delayed phytoplankton responses to nutrient load reductions are common [49], particularly in systems with long water residence times [50], where internal recycling and sediment–water exchange sustain nutrient availability [46].

4.2. Phytoplankton in the Oder Lagoon—A Comparison

Although detailed studies on phytoplankton succession in the Oder/Szczecin Lagoon are lacking, the observed annual succession resembles patterns in other shallow, eutrophic Baltic lagoons (Curonian, Vistula, and Darss-Zingst) [47,48,51]. Similarly to the Oder Lagoon, these systems show light-limited diatoms and cryptophytes with low biomass in winter, a diatom- and green algae-dominated spring bloom, cyanobacteria dominance in summer and autumn, and dinoflagellates and cryptophytes toward winter. Data from station M indicate a recent increase in the average annual contribution of diatoms, particularly in spring, along with a shift toward greater representation of Fragilariophyceae. The underlying causes remain unclear.
Phytoplankton composition in the Oder Lagoon shows strong interannual variability, a feature also reported for other coastal lagoons [51,52,53]. This variability is usually linked to environmental drivers such as hydrology, nutrient availability, temperature, and salinity [54,55]. In the Oder Lagoon, high interannual variability masks long-term trends resulting from nutrient reductions. The ~40 km distance between station M (central western bay) and the Oder River (the main nutrient source), together with the long average water residence time of ~100 days, reduces the impact of short-term changes in riverine nutrient loads. Moreover, the lagoon’s shallowness and frequent mixing minimize the role of stratification, making temperature a likely key factor driving phytoplankton variability.
In the Oder Lagoon, warmer years are typically associated with higher cyanobacteria abundance and reduced diatom proportions, a trend also observed in other eutrophic Baltic lagoons, where hot summers extend the growing season and enhance cyanobacteria dominance [56,57].
However, nutrient load reductions in the Oder Lagoon have generally diminished the intensity of summer blooms and reduced the frequency of extreme events. In recent years, intense blooms have not been observed. Thus, although cyanobacteria may increase in relative importance under warmer conditions, their absolute biomass has declined due to reduced external nutrient inputs.
At station M, phosphorus availability in spring and early summer and nitrogen availability in summer have declined over recent decades, indicating an ongoing trend toward nutrient limitation. Many studies show that summer depletion of dissolved inorganic nitrogen promotes diazotrophic, N-fixing filamentous cyanobacteria (e.g., Aphanizomenon, Dolichospermum, Nodularia), leading to substantial N2 fixation [57,58], which can partly compensate for reduced external nitrogen loads. This is well documented in the Baltic Sea [59] and has also been suggested for shallow coastal lagoons such as the Curonian Lagoon [60]. In the Oder Lagoon, Microcystis, a non-nitrogen-fixing cyanobacterium that relies on other available nitrogen sources, is still dominating. This is another hint that there is no lasting N-limitation. The model, too, suggests only a very minor N-fixation in the lagoon.
Uncertainty remains regarding how changes in cyanobacteria abundance, diversity, and regulation affect toxin production and potential health risks. Only strains carrying toxin biosynthesis genes (e.g., mcy for microcystins) produce toxins, and toxin presence is not directly linked to biomass. For example, blooms in the Curonian Lagoon often include Microcystis, Planktothrix agardhii, Dolichospermum, and Anabaena carrying mcyE genes, while abundant Aphanizomenon flos-aquae lacks them [56]. Nutrient stress may upregulate microcystin production [61], and both light intensity [62] and temperature [63] also contribute.
Temperature strongly influences lagoon phytoplankton dynamics. Larger diatom-dominated spring blooms often follow cold winters due to reduced grazing, while mild winters may weaken blooms and favor smaller taxa [51,56]. Rapid warming over days to weeks frequently initiates blooms in shallow lagoons because phytoplankton respond faster than grazers. Short warm spells can also shift community composition toward faster-growing taxa, including cyanobacteria [64].
Our results indicate that annual diatom biovolumes (Bacillariophyceae and Fragilariophyceae) account for about 40% of phytoplankton in cold years compared to only 18% in hot years. In cold springs, Diatoma constitutes about 75% of all diatoms, whereas hot springs show a shift toward other genera, such as Skeletonema and Melosira. Similar trends are documented in the Baltic Sea and lakes [65,66]. We are lacking sufficient phytoplankton data from winter, and shifts in species composition are not fully captured. The increased chlorophyll-concentrations in spring during the last decades and the shift in the spring maximum from April to March indicate a recently stronger dominance of diatoms, possibly resulting from increasing temperatures and the lack of ice cover. Model results, however, suggest that a 1.5 °C temperature increase alone does not substantially increase spring diatom biomass. Neither chlorophyll data nor the model indicate strong shifts in bloom timing toward January or February, supporting the view that in temperate lakes, bloom onset is determined by light availability, while temperature primarily controls growth rates [67,68].

4.3. Limitations of the Phytoplankton Data

Long-term phytoplankton datasets at the species level with monthly resolution over more than 40 years are rare, available only for a few lagoons such as the Darss-Zingst Bodden [51] and, to some extent, the Curonian Lagoon [54]. The dataset from station M (central Kleines Haff, 1 m depth) enables analyses of long-term and seasonal changes. However, the coarse sampling frequency and high variability limit reliable assessments on shorter timescales, such as individual months or extreme events (cold- and heatwaves). Our approach of aggregating data into hot and cold periods only partly compensates for this weakness.
The dataset captures interannual variability, but its spatial representativeness remains uncertain. Phytoplankton often exhibit vertical gradients, which can change daily. For example, cyanobacteria (Microcystis, Planktothrix) regulate buoyancy and migrate vertically on diel cycles [69,70], and similar behavior occurs in motile phytoflagellates and dinoflagellates [71]. Furthermore, single-site data may not capture spatial heterogeneity caused by wind, currents, mixing, and surface convergence [72], or biological interactions such as grazing [73]. Additional uncertainty arises from methodological aspects, including counting protocols, subsampling bias [74], reliance on taxonomic expertise, and phytoplankton taxonomy has undergone substantial revisions during this period, with many nomenclatural changes [75]. Methodological changes after 2008 further limit comparability between our earlier and later data.

4.4. The Model Approach—Opportunities and Weaknesses

Our model ERGOM distinguishes four phytoplankton functional groups, which broadly reproduce annual biomass dynamics. These groups capture key traits—morphological, physiological, or behavioral characteristics influencing fitness and ecosystem function [76,77]. However, the groups cannot be directly equated to taxonomic groups used in monitoring, as taxonomic categories often include diverse species with different seasonalities, behaviors, and ecological roles [76,78]. However, our results provide an opportunity for further development of the model.
Two model groups—diatoms and cyanobacteria—are reasonably comparable to taxonomic groups and can be used as proxies. A key advantage of complementing field data with model simulations is that the model provides a full three-dimensional, high-resolution spatio-temporal picture of the lagoon, enabling analyses where field data are lacking, revealing spatial gradients, and allowing critical evaluation of extreme field values.
A general challenge is the use of different biomass metrics, such as biovolume and chlorophyll-a. The relationship between these metrics is weak, as taxonomic groups (e.g., chlorophytes, diatoms, dinoflagellates, cyanobacteria) differ systematically in pigment content per unit volume or carbon, meaning identical biovolumes can yield very different Chl-a concentrations [79]. Surface scums of buoyant Microcystis colonies are also reflected differently in Chl-a versus biovolume [80].
ERGOM adds another measure, expressing biomass as carbon content. However, conversion between carbon, Chl-a, and biovolume depends on environmental conditions, season, and species [81]. Commonly used constant conversion factors oversimplify these relationships. To avoid misrepresentation, we refrained from recalculating and instead displayed two independent axes (Figure 4). However, the implied conversion factor from g C/m3 to μg/L Chlorophyll-a is 40 and well in agreement with literature [81].

4.5. Towards an Improved Monitoring of Phytoplankton

The European Water Framework Directive (2000/60/EC) requires all EU surface waters, including transitional and coastal waters, to achieve “good ecological status”. Phytoplankton is a key biological quality element, requiring monitoring of biomass (Chl-a), abundance, and community composition (species or functional groups). The challenge lies in addressing high temporal and spatial variability without excessive costs. Beyond taxonomic identification, trait-based classification would add value.
A more flexible sampling design is also desirable. During extreme events (heatwaves, floods, droughts), temporarily increasing sampling frequency and coverage (both horizontal and vertical) could provide valuable insights.
Ideally, daily data with 1 m vertical resolution and <1 km horizontal resolution would capture spatio-temporal phytoplankton dynamics in shallow systems like the Oder Lagoon. Since horizontal distribution is strongly driven by physical conditions, 3D models can reveal spatial patterns and help assess how representative single-station data are.
Remote sensing can complement in situ data. Multispectral satellite imagery with spectral indices and pigment-specific algorithms, supplemented by airborne hyperspectral or UAV-based imaging, could map surface phytoplankton patterns.
Moored profiling systems at station M, equipped with optical sensors (fluorometers, backscatter, conductivity, temperature, depth (CTD), photosynthetically active radiation), or more affordable multi-depth sensor strings, could provide high-frequency temporal resolution. Additional instruments for imaging or cytometric analysis of individual phytoplankton cells, onboard classification algorithms, and molecular sensors for species and toxin detection would further enhance monitoring.
Current phytoplankton identification relies on traditional light microscopy. New molecular methods, such as DNA metabarcoding, would provide more robust and accurate taxonomic characterization of algal communities [82,83].
Since Baltic lagoons share similar phytoplankton dynamics, insights from one lagoon can largely be transferred to others.

Supplementary Materials

The following supporting information can be downloaded at: https://www.mdpi.com/article/10.3390/environments12100370/s1, Table S1 contains the full phytoplankton species data for station M/KHM in the central German part of the Oder/Szczecin Lagoon (53.825° N, 14.100° E) covering the years 1972 until 2022.

Author Contributions

Conceptualization, G.S. and M.S.; methodology and software, G.S., M.S. and T.N.; formal analysis and investigation, G.S., M.S. and T.N.; data curation, M.v.W.; writing—original draft preparation, G.S.; writing—review and editing, M.S., T.N. and M.v.W.; supervision and funding acquisition, G.S. All authors have read and agreed to the published version of the manuscript.

Funding

This work was financially supported by the German Federal Ministry of Research, Technology and Space (BMFBR), projects “DAM Schutz und Nutzen: Coastal Futures II” (grant number 03F0980B), “DAM Extrem: Prime Prevention” (grant number 03F0953D) and UBA-MoSea (FKZ 3723252040).

Data Availability Statement

The original phytoplankton dataset presented in this study is included in the Supplementary Material (Table S1). The most recent field data can be obtained from Landesamt für Umwelt, Naturschutz und Geologie, Güstrow, Germany. The bio-chemical data of station M can additionally be downloaded from the UBA-MUDAB (https://geoportal.bafg.de/MUDABAnwendung/). The full model documentation is available under: https://doi.org/10.5281/zenodo.7252134. The model simulation output represents an intermediate state, and improvements are still taking place. Consequently, this data is not permanently available yet.

Acknowledgments

We thank Sarah Piehl and Rene Friedland for technical support.

Conflicts of Interest

The authors declare no conflicts of interest.

References

  1. Meier, H.E.M.; Kniebusch, M.; Dieterich, C.; Gröger, M.; Zorita, E.; Elmgren, R.; Myrberg, K.; Ahola, M.P.; Bartosova, A.; Bonsdorff, E.; et al. Climate change in the Baltic Sea region: A summary. Earth Syst. Dyn. 2022, 13, 457–593. [Google Scholar] [CrossRef]
  2. Rutgersson, A.; Jaagus, J.; Schenk, F.; Stendel, M. Observed changes and variability of atmospheric parameters in the Baltic Sea region during the last 200 years. Clim. Res. 2014, 61, 177–190. [Google Scholar] [CrossRef]
  3. Kniebusch, M.; Meier, H.E.M.; Neumann, T.; Börgel, F. Temperature variability of the Baltic Sea since 1850 and attribution to atmospheric forcing variables. J. Geophys. Res. Oceans 2019, 124, 4168–4187. [Google Scholar] [CrossRef]
  4. Dutheil, C.; Meier, H.E.M.; Gröger, M.; Börgel, F. Understanding past and future sea surface temperature trends in the Baltic Sea. Clim. Dyn. 2021, 58, 3021–3039. [Google Scholar] [CrossRef]
  5. Siegel, H.; Gerth, M. Sea Surface Temperature in the Baltic Sea 2018. HELCOM Baltic Sea Environment Fact Sheets 2019; 7p. Available online: https://helcom.fi/wp-content/uploads/2020/07/BSEFS-Sea-Surface-Temperature-in-the-Baltic-Sea-2018.pdf (accessed on 17 February 2022).
  6. Stramska, M.; Białogrodzka, J. Spatial and temporal variability of sea surface temperature in the Baltic Sea based on 32 years (1982–2013) of satellite data. Oceanologia 2015, 57, 223–235. [Google Scholar] [CrossRef]
  7. Belkin, I.M. Rapid warming of large marine ecosystems. Prog. Oceanogr. 2009, 81, 207–213. [Google Scholar] [CrossRef]
  8. Meier, H.E.M.; Dieterich, C.; Gröger, M.; Dutheil, C.; Börgel, F.; Safonova, K.; Christensen, O.B.; Kjellström, E. Oceanographic regional climate projections for the Baltic Sea until 2100. Earth Syst. Dyn. 2022, 13, 159–199. [Google Scholar] [CrossRef]
  9. Gröger, M.; Arneborg, L.; Dieterich, C.; Höglund, A.; Meier, H.E.M. Summer hydrographic changes in the Baltic Sea, Kattegat and Skagerrak projected in an ensemble of climate scenarios downscaled with a coupled regional ocean–sea ice–atmosphere model. Clim. Dyn. 2019, 53, 5945–5966. [Google Scholar] [CrossRef]
  10. Gröger, M.; Dieterich, C.; Meier, H.E.M. Is interactive air–sea coupling relevant for simulating the future climate of Europe? Clim. Dyn. 2021, 56, 491–514. [Google Scholar] [CrossRef]
  11. Viitasalo, M.; Bonsdorff, E. Global climate change and the Baltic Sea ecosystem: Direct and indirect effects on species, communities and ecosystem function. Earth Syst. Dyn. 2022, 13, 711. [Google Scholar] [CrossRef]
  12. Naselli-Flores, L.; Padisák, J. Ecosystem services provided by marine and freshwater phytoplankton. Hydrobiologia 2023, 850, 2691–2706. [Google Scholar] [CrossRef]
  13. Hochfeld, I.; Hinners, J. Phytoplankton adaptation to steady or changing environments affects marine ecosystem functioning. Biogeosciences 2024, 21, 5591–5611. [Google Scholar] [CrossRef]
  14. Hayes, N.M.; Haig, H.A.; Simpson, G.L.; Leavitt, P.R. Effects of lake warming on the seasonal risk of toxic cyanobacteria exposure. Limnol. Oceanogr. Lett. 2020, 5, 10164. [Google Scholar] [CrossRef]
  15. Richardson, R.; Feuchtmayr, H.; Miller, C.; Hunter, P.D.; Maberly, S.C.; Carvalho, L. Response of cyanobacteria and phytoplankton abundance to warming, extreme rainfall events and nutrient enrichment. Glob. Change Biol. 2020, 26, e14701. [Google Scholar] [CrossRef] [PubMed]
  16. Chatterjee, S.; More, M. Cyanobacterial harmful algal bloom toxin microcystin and increased Vibrio occurrence as climate-change-induced biological co-stressors: Exposure and disease outcomes via their interaction with gut–liver–brain axis. Toxins 2023, 15, 289. [Google Scholar] [CrossRef] [PubMed]
  17. Brito, A.C.; Newton, A.; Tett, P.; Fernandes, T.F. How will shallow coastal lagoons respond to climate change? A modelling investigation. Estuar. Coast. Shelf Sci. 2011, 95, 98–104. [Google Scholar] [CrossRef]
  18. Hobday, A.J.; Alexander, L.V.; Perkins, S.E.; Smale, D.A.; Straub, S.C.; Oliver, E.C.J.; Benthuysen, J.A.; Burrows, M.T.; Donat, M.G.; Feng, M.; et al. Categorizing and naming marine heatwaves. Oceanography 2018, 31, 162–173. [Google Scholar] [CrossRef]
  19. Galli, G.; Solidoro, C.; Lovato, T. Marine heat waves hazard 3D maps and the risk for low motility organisms in a warming Mediterranean Sea. Front. Mar. Sci. 2017, 4, 136. [Google Scholar] [CrossRef]
  20. Woolway, R.I.; Jennings, E.; Shatwell, T.; Golub, M.; Pierson, D.C.; Maberly, S.C. Lake heatwaves under climate change. Nature 2021, 589, 402–407. [Google Scholar] [CrossRef]
  21. Benthuysen, J.A.; Oliver, E.C.J.; Chen, K.; Wernberg, T. Editorial: Advances in Understanding Marine Heatwaves. Front. Mar. Sci. 2020, 7, 147. [Google Scholar] [CrossRef]
  22. Oliver, E.C.J.; Burrows, M.T.; Donat, M.G.; Sen Gupta, A.; Alexander, L.V.; Perkins-Kirkpatrick, S.E.; Benthuysen, J.A.; Hobday, A.J.; Holbrook, N.J.; Moore, P.J.; et al. Marine heatwaves. Annu. Rev. Mar. Sci. 2021, 13, 313–342. [Google Scholar] [CrossRef] [PubMed]
  23. Safonova, K.; Meier, H.E.M.; Gröger, M. Summer heatwaves on the Baltic Sea seabed contribute to oxygen deficiency in shallow areas. Commun. Earth Environ. 2024, 5, 106. [Google Scholar] [CrossRef]
  24. Humborg, C.; Geibel, M.C.; Sun, X.; McCrackin, M.; Mörth, C.-M.; Stranne, C.; Jakobsson, M.; Gustafsson, B.; Sokolov, A.; Norkko, A.; et al. High emissions of carbon dioxide and methane from the coastal Baltic Sea at the end of a summer heat wave. Front. Mar. Sci. 2019, 6, 493. [Google Scholar] [CrossRef]
  25. Bergkemper, V.; Weisse, T. Phytoplankton response to the summer 2015 heat wave—A case study from pre-alpine Lake Mondsee, Austria. Inland Waters 2017, 7, 88–99. [Google Scholar] [CrossRef]
  26. Li, N.; Zhang, Y.; Zhang, Y.; Shi, K.; Qian, H.; Yang, H.; Niu, Y.; Qin, B.; Zhu, G.; Woolway, R.I.; et al. The unprecedented 2022 extreme summer heatwaves increased harmful cyanobacteria blooms. Sci. Total Environ. 2023, 896, 165312. [Google Scholar] [CrossRef]
  27. Jeppesen, E.; Pierson, D.; Jennings, E. Effect of extreme climate events on lake ecosystems. Water 2021, 13, 282. [Google Scholar] [CrossRef]
  28. Soulié, T.; Vidussi, F.; Mas, S.; Mostajir, B. Functional and structural responses of plankton communities toward consecutive experimental heatwaves in Mediterranean coastal waters. Sci. Rep. 2023, 13, 8050. [Google Scholar] [CrossRef]
  29. Chen, W.; Nielsen, A.; Andersen, T.K.; Hu, F.; Chou, Q.; Søndergaard, M.; Jeppesen, E.; Trolle, D. Modeling the ecological response of a temporarily summer-stratified lake to extreme heatwaves. Water 2020, 12, 94. [Google Scholar] [CrossRef]
  30. Rutgersson, A.; Kjellström, E.; Haapala, J.; Stendel, M.; Danilovich, I.; Drews, M.; Jylhä, K.; Kujala, P.; Larsén, X.G.; Halsnæs, K.; et al. Natural hazards and extreme events in the Baltic Sea region. Earth Syst. Dyn. 2022, 13, 251. [Google Scholar] [CrossRef]
  31. Aoki, L.R.; Brisbin, M.M.; Hounshell, A.G.; Kincaid, D.W.; Larson, E.I.; Sansom, B.J.; Shogren, A.J.; Smith, R.S.; Sullivan-Stack, J. Preparing aquatic research for an extreme future: Call for improved definitions and responsive, multidisciplinary approaches. BioScience 2022, 72, 508–520. [Google Scholar] [CrossRef]
  32. Diamond, D.; Relyea, R.A.; McCaul, M. Understanding and mitigating global change with aquatic autonomous sensors: A fifty-year perspective. Front. Sens. 2023, 4, 1284043. [Google Scholar] [CrossRef]
  33. LUNG. Monitoringprogramm zur Überwachung der Oberflächengewässer und des Grundwassers in Mecklenburg-Vorpommern im Zeitraum 2022–2027; Landesamt für Umwelt, Naturschutz und Geologie Mecklenburg-Vorpommern: Güstrow, Germany, 2024; Available online: https://www.lung.mv-regierung.de/static/LUNG/dateien/fachinformationen/wasser/Gewaesserueberwachung/monitoringprogramm_2022-2027.pdf (accessed on 15 April 2025).
  34. Filiz, N.; Işkın, U.; Beklioğlu, M.; Öğlü, B.; Cao, Y.; Davidson, T.A.; Søndergaard, M.; Lauridsen, T.L.; Jeppesen, E. Phytoplankton community response to nutrients, temperatures, and a heat wave in shallow lakes: An experimental approach. Water 2020, 12, 3394. [Google Scholar] [CrossRef]
  35. Radziejewska, T.; Schernewski, G. The Szczecin (Oder-) Lagoon. In Ecology of Baltic Coastal Waters; Schiewer, U., Ed.; Springer: Berlin/Heidelberg, Germany, 2008; pp. 115–129. [Google Scholar] [CrossRef]
  36. Neumann, T.; Schernewski, G.; Friedland, R. Transformation Processes in the Oder Lagoon as Seen from a Model Perspective. EGUsphere 2025. [Google Scholar] [CrossRef]
  37. HELCOM. State of the Baltic Sea. Third HELCOM Holistic Assessment 2016–2021; Baltic Sea Environment Proceedings No. 194; HELCOM: Helsinki, Finland, 2023; Available online: https://helcom.fi/wp-content/uploads/2023/10/State-of-the-Baltic-Sea-2023.pdf (accessed on 15 April 2025).
  38. IKSO. Zweite Aktualisierung des Bewirtschaftungsplans für die Internationale Flussgebietseinheit; IKSO: Wrocław, Poland, 2022; Available online: http://www.mkoo.pl/download.php?fid=6996&lang=DE (accessed on 15 April 2025).
  39. Bundesregierung. Verordnung zum Schutz der Oberflächengewässer (Oberflächengewässerverordnung—OGewV); Federal Ministry of Justice and Consumer Protection: Berlin, Germany, 2016. Available online: https://www.gesetze-im-internet.de/ogewv_2016/OGewV.pdf (accessed on 15 April 2025).
  40. Grenzgewässerkommission. Bericht über die Beschaffenheit der Deutsch–Polnischen Grenzgewässer 2022; Wasser Blick: Loddin, Germany, 2024; Available online: https://www.wasserblick.net/servlet/is/1/ (accessed on 15 April 2025).
  41. Neumann, T.; Radtke, H.; Cahill, B.; Schmidt, M.; Rehder, G. Non-Redfieldian Carbon Model for the Baltic Sea (ERGOM Version 1.2)—Implementation and Budget Estimates. Geosci. Model Dev. 2022, 15, 8473–8540. [Google Scholar] [CrossRef]
  42. European Commission. Marine Biodiversity Modelling Study; Publications Office of the European Union: Luxembourg, 2022; Available online: https://data.europa.eu/doi/10.2777/213731 (accessed on 15 April 2025).
  43. Neumann, T. Model Code and Boundary Data for “Non-Redfield Carbon Model for the Baltic Sea (ERGOM Version 1.2)—Implementation and Budget Estimates” [Code]; Zenodo: Geneva, Switzerland, 2022. [Google Scholar] [CrossRef]
  44. Geyer, B.; Rockel, B. coastDat-2 COSMO-CLM Atmospheric Reconstruction [Data Set]; World Data Center for Climate (WDCC): Hamburg, Germany, 2013. [Google Scholar] [CrossRef]
  45. Friedland, R.; Schernewski, G.; Gräwe, U.; Greipsland, I.; Palazzo, D.; Pastuszak, M. Managing Eutrophication in the Szczecin (Oder) Lagoon—Development, Present State and Future Perspectives. Front. Mar. Sci. 2019, 5, 521. [Google Scholar] [CrossRef]
  46. Bartoli, M.; Žilius, M.; Ruginis, T.; Vybernaite-Lubiene, I.; Petkuvienė, J.; Daunys, D. Seasonal Nitrogen Cycling Fuels Cyanobacteria Blooms in a Hypertrophic Lagoon. Front. Environ. Sci. 2024, 12, 1384114. [Google Scholar] [CrossRef]
  47. Pilkaitytė, R.; Razinkovas, A. Seasonal Changes in Phytoplankton Composition and Nutrient Limitation in a Shallow Baltic Lagoon. Boreal Environ. Res. 2007, 12, 551–559. [Google Scholar]
  48. Kownacka, J.; Krzymińska, J.; Jasser, I.; Grabowska, M.; Hutorowicz, A. Phytoplankton Structure in the Vistula Lagoon (Southern Baltic Sea) and the Turning Point in Its Development. Oceanologia 2020, 62, 313–324. [Google Scholar] [CrossRef]
  49. Saraiva, S.; Markus Meier, H.E.; Andersson, H.; Höglund, A.; Dieterich, C.; Gröger, M.; Hordoir, R.; Eilola, K. Baltic Sea ecosystem response to various nutrient load scenarios in present and future climates. Clim. Dyn. 2019, 52, 3369–3387. [Google Scholar] [CrossRef]
  50. Cloern, J.E.; Foster, S.Q.; Kleckner, A.E. Phytoplankton Primary Production in the World’s Estuarine–Coastal Ecosystems. Biogeosciences 2014, 11, 2477–2501. [Google Scholar] [CrossRef]
  51. Schumann, R.; Schiewer, U.; Schubert, H. Phytoplankton Composition and Production during the Winter–Spring Transition in the Darss–Zingst Bodden Chain, Southern Baltic Sea. Estuar. Coast. Shelf Sci. 2005, 62, 169–181. [Google Scholar] [CrossRef]
  52. Schiewer, U. Darß-Zingst Boddens, Northern Rügener Boddens and Schlei. In Ecology of Baltic Coastal Waters; Schiewer, U., Ed.; Springer: Berlin/Heidelberg, Germany, 2008; pp. 35–86. [Google Scholar] [CrossRef]
  53. Poppeschi, C.; Charria, G.; Daniel, A.; Verney, R.; Rimmelin-Maury, P.; Retho, M.; Goberville, E.; Grossteffan, E.; Plus, M. Interannual variability of the initiation of the phytoplankton growing period in two French coastal ecosystems. Biogeosciences 2022, 19, 5667–5687. [Google Scholar] [CrossRef]
  54. Gasiūnaitė, Z.R.; Daunys, D.; Olenin, S.; Razinkovas, A. The Curonian Lagoon. In Ecology of Baltic Coastal Waters; Schiewer, U., Ed.; Springer: Berlin/Heidelberg, Germany, 2008; pp. 197–216. [Google Scholar] [CrossRef]
  55. Wasmund, N.; Tuimala, J.; Suikkanen, S.; Vandepitte, L.; Kraberg, A. Long-term trends in phytoplankton composition in the western and central Baltic Sea. J. Mar. Syst. 2011, 87, 145–159. [Google Scholar] [CrossRef]
  56. Overlingė, D.; Toruńska-Sitarz, A.; Cegłowska, M.; Błaszczyk, A.; Szubert, K.; Pilkaitytė, R.; Mazur-Marzec, H. Phytoplankton of the Curonian Lagoon as a New Interesting Source for Bioactive Natural Products—Special Impact on Cyanobacterial Metabolites. Biomolecules 2021, 11, 1139. [Google Scholar] [CrossRef]
  57. Vahtera, E.; Conley, D.J.; Gustafsson, B.G.; Kuosa, H.; Pitkänen, H.; Savchuk, O.P.; Tamminen, T.; Viitasalo, M.; Voss, M.; Wasmund, N.; et al. Internal Ecosystem Feedbacks Enhance Nitrogen-Fixing Cyanobacteria Blooms and Complicate Management in the Baltic Sea. AMBIO 2007, 36, 186–194. [Google Scholar] [CrossRef]
  58. Karlson, A.M.L.; Duberg, J.; Motwani, N.H.; Hogfors, H.; Klawonn, I.; Ploug, H.; Svedén, J.B.; Garbaras, A.; Sundelin, B.; Hajdu, S.; et al. Nitrogen Fixation by Cyanobacteria Stimulates Production in Baltic Food Webs. AMBIO 2015, 44, 413–426. [Google Scholar] [CrossRef]
  59. Olofsson, M.; Klawonn, I.; Karlson, B. Nitrogen Fixation Estimates for the Baltic Sea Indicate High Rates for the Previously Overlooked Bothnian Sea. AMBIO 2021, 50, 203–214. [Google Scholar] [CrossRef]
  60. Žilius, M.; Vybernaite-Lubiene, I.; Vaiciute, D.; Overlingė, D.; Grinienė, E.; Zaiko, A.; Bonaglia, S.; Liskow, I.; Voss, M.; Andersson, A.; et al. Spatiotemporal Patterns of N2 Fixation in Coastal Waters Derived from Rate Measurements and Remote Sensing. Biogeosciences 2021, 18, 1857–1871. [Google Scholar] [CrossRef]
  61. Pimentel, J.S.M.; Giani, A. Microcystin Production and Regulation under Nutrient Stress in Cyanobacteria. Appl. Environ. Microbiol. 2014, 80, 5836–5843. [Google Scholar] [CrossRef]
  62. Tonk, L.; Visser, P.M.; Christiansen, G.; Dittmann, E.; Snelder, E.O.; Wiedner, C.; Mur, L.R.; Huisman, J. The Microcystin Composition of Planktothrix agardhii Changes with Light Intensity. Appl. Environ. Microbiol. 2005, 71, 553–560. [Google Scholar] [CrossRef]
  63. Silveira, S.B.; Odebrecht, C. Effects of Salinity and Temperature on Growth and Nodularin Production in Nodularia spumigena. Front. Mar. Sci. 2019, 6, 339. [Google Scholar] [CrossRef]
  64. Trombetta, T.; Vidussi, F.; Mas, S.; Parin, D.; Simier, M.; Mostajir, B. Water Temperature Drives Phytoplankton Blooms in Coastal Waters. PLoS ONE 2019, 14, e0214933. [Google Scholar] [CrossRef]
  65. Spilling, K.; Olli, K.; Lehtoranta, J.; Kremp, A.; Tamelander, T.; HELCOM Phytoplankton Group. Shifting Diatom–Dinoflagellate Dominance During Spring Bloom in the Baltic Sea. Front. Mar. Sci. 2018, 5, 327. [Google Scholar] [CrossRef]
  66. Almén, A.K.; Tiselius, P.; Rydberg, L. Temperature-Related Timing of the Spring Bloom: Contrasts between Cold and Warm Years. J. Sea Res. 2020, 160, 101887. [Google Scholar] [CrossRef]
  67. Reynolds, C.S. The Ecology of Phytoplankton; Ecological Studies 535; Springer: Dordrecht, The Netherlands, 2006. [Google Scholar] [CrossRef]
  68. Sommer, U.; Gliwicz, Z.M.; Lampert, W.; Duncan, A. The PEG-Model of Seasonal Succession of Planktonic Events in Fresh Waters. Arch. Hydrobiol. 1986, 106, 433–471. [Google Scholar] [CrossRef]
  69. Hašler, P.; Poulíčková, A. Diurnal Changes in Vertical Distribution and Morphology of a Natural Population of Planktothrix agardhii (Gom.) Anagnostidis et Komárek (Cyanobacteria). Hydrobiologia 2003, 506, 195–201. [Google Scholar] [CrossRef]
  70. Ibelings, B.W.; Mur, L.R.; Walsby, A.E. Diurnal Changes in Buoyancy and Vertical Distribution in Populations of Microcystis in Two Shallow Lakes. J. Plankton Res. 1991, 13, 419–436. [Google Scholar] [CrossRef]
  71. Hall, N.S.; Whipple, A.C.; Paerl, H.W. Vertical Spatio-Temporal Patterns of Phytoplankton Due to Migration Behaviors in Two Shallow, Microtidal Estuaries: Influence on Phytoplankton Function and Structure. Estuar. Coast. Shelf Sci. 2015, 162, 7–21. [Google Scholar] [CrossRef]
  72. Cloern, J.E. Phytoplankton Bloom Dynamics in Coastal Ecosystems: A Review with Some General Lessons from Sustained Investigation of San Francisco Bay. Rev. Geophys. 1996, 34, 127–168. [Google Scholar] [CrossRef]
  73. Borics, G.; Abonyi, A.; Krasznai, E.; Várbíró, G.; Grigorszky, I.; Szabó, S.; Deák, C.; Tóthmérész, B. Small-Scale Patchiness of the Phytoplankton in a Lentic Oxbow. J. Plankton Res. 2011, 33, 973–981. [Google Scholar] [CrossRef]
  74. Jacobs, P.; Serre-Fredj, L.; Koeman, R.; van den Oever, A.; Peck, M.A.; Philippart, C.J.M. Impacts of Counting Protocols for Light Microscopy on Estimates of Biodiversity and Algal Density of Phytoplankton. Limnol. Oceanogr. Methods 2024, 22, 930–949. [Google Scholar] [CrossRef]
  75. Cozzoli, F.; Stanca, E.; Selmeczy, G.B.; Francé, J.; Varkitzi, I.; Basset, A. Sensitivity of Phytoplankton Metrics to Sample-Size: A Case Study on a Large Transitional Water Dataset (WISER). Ecol. Indic. 2017, 82, 558–573. [Google Scholar] [CrossRef]
  76. Litchman, E.; Klausmeier, C.A. Trait-Based Community Ecology of Phytoplankton. Annu. Rev. Ecol. Evol. Syst. 2008, 39, 615–639. [Google Scholar] [CrossRef]
  77. Weithoff, G.; Beisner, B.E.; von Elert, E.; Reynolds, C.S.; Spaak, P. Measures and Approaches in Trait-Based Phytoplankton Community Ecology—From Freshwater to Marine Ecosystems. Front. Mar. Sci. 2019, 6, 40. [Google Scholar] [CrossRef]
  78. Kruk, C.; Huszar, V.L.M.; Peeters, E.T.H.M.; Bonilla, S.; Costa, L.; Lürling, M.; Reynolds, C.S.; Scheffer, M. A Morphological Classification Capturing Functional Variation in Phytoplankton. Freshw. Biol. 2010, 55, 614–627. [Google Scholar] [CrossRef]
  79. Felip, M.; Catalan, J. The Relationship Between Phytoplankton Biovolume and Chlorophyll in a Deep Oligotrophic Lake: Decoupling in Their Spatial and Temporal Maxima. J. Plankton Res. 2000, 22, 91–105. [Google Scholar] [CrossRef]
  80. Gilabert, J.; Socorro, A.; Ferriol, C.; Sanpera, C.; Abad, M. Short-Term Variability of the Planktonic Size Structure in a Mediterranean Hypersaline Coastal Lagoon (Mar Menor). J. Plankton Res. 2001, 23, 219–226. [Google Scholar] [CrossRef]
  81. Gui, J. Phytoplankton Carbon to Chlorophyll a Model Development: A Review and Perspective. Front. Mar. Sci. 2024, 11, 1466072. [Google Scholar] [CrossRef]
  82. Baylón, M.; Ramirez, J.L. A Comparison of eDNA Metabarcoding and Microscopy Techniques to Analyze Algal Diversity in Lake Titicaca, Peru. Diversity 2025, 17, 560. [Google Scholar] [CrossRef]
  83. Wang, R.; Dong, Z.; Lin, K.; Lv, S.; Liu, Y.; Lu, W.; Liu, L. Comparative Analysis of Light Microscopy and High-Throughput Sequencing for Phytoplankton Detection in Rivers Flowing into the Sea. Water 2025, 17, 1559. [Google Scholar] [CrossRef]
Figure 1. (a) The Baltic Sea region and location of the lagoon; (b) the Oder/Szczecin Lagoon at the German/Polish border with bathymetry and major rivers. M and C indicate major sampling stations; (c) heavy cyanobacteria bloom in July 2008, (d) view over the lagoon near Wolin and (e) accumulated foam after the cyanobacteria bloom in Sept 2009.
Environments 12 00370 g001
Figure 2. (a) Relationship between air temperature and surface water temperature at sampling station M (location indicated) in the Oder Lagoon based on a 30-year dataset. (b) Relationship between chlorophyll and biovolume data at station M based on long-term monitoring data. (c) ERGOM model calculations of the average annual time that entering river water needs to reach different parts in the lagoon, expressed as water age in days.
Environments 12 00370 g002
Figure 3. (a) Total phosphorus concentrations in the Oder/Odra River and loads to the Oder/Szczecin Lagoon and (b) total nitrogen concentrations in the Oder/Odra River and loads to the Oder/Szczecin Lagoon loads to the between 1885 and 2002 (the loads represent the situation north of the city of Szczecin); Decadal changes and annual concentration course of (c) dissolved inorganic phosphorus, (d) dissolved inorganic nitrogen and (e) chlorophyll-a as well as (f) decadal changes and seasonal course of water transparency (Secchi-depth) at station M in the central Kleines Haff.
Environments 12 00370 g003
Figure 4. (a) chlorophyll-a concentrations and (b) cyanobacteria and (c) diatom biovolumes (left axes) in the Oder Lagoon (station M in 1 m water depth) between 1995 and 2022 based on observations and model simulations (monthly averaged). The model data is always expressed in mg C/m3 (right axes). The red line indicates the floating average of the data.
Environments 12 00370 g004
Figure 5. (a) Annual shares of relative biovolumes and (b) seasonal shares of relative biovolumes of 12 phytoplankton classes in the Oder Lagoon (station M, Kleines Haff, taken at 1 m water depth) over the years 1985 to 2019. Shaded grey areas indicate data based on the more detailed phytoplankton determination method.
Environments 12 00370 g005
Figure 6. (a) Annual average air temperatures at station M and the five years that were selected to represent hot and cold years in every decade. All remaining years are used to calculate the ‘normal’ year. (b) Composition of phytoplankton classes in hot, cold and normal years (station M, 1 m water depth).
Environments 12 00370 g006
Figure 7. Average seasonal air temperatures in (a) spring and (b) summer at station M between 1980 and 2020. Hot and cold seasons are indicated. Relative biovolume of phytoplankton classes for selected years with a hot and a cold (c) spring and (d) summer. Relative biovolume of (e) diatom species and genus in spring and (f) cyanophyceae species in summer for the same selected years with hot and cold spring and summer seasons at Oder Lagoon station M.
Environments 12 00370 g007
Figure 8. (a) Average monthly air temperature above the water surface at station M in the Oder Lagoon for the months March until October and the years between 2080 and 2020. The selected hot and cold months of the years are indicated by red resp. blue colors. Observed (b) and modeled (c) cyanobacteria biomass for the selected hot, normal/moderate and cold years. (d,e) show the same for diatoms. The box-and-whisker plots display the median, quartiles, and outliers (extremes) for every month.
Environments 12 00370 g008
Figure 9. Air temperature above the water surface at station M in the Oder Lagoon, the weeks before, during and after the heatwaves in August (a) and coldwaves in May (b). Cyanophyceae biomass at station M in the Oder Lagoon the weeks before, during and after the heatwaves in August (c) and coldwaves in May (d). The data is indicated as dots and expressed as biovolume, and the model results are indicated as a dotted line and expressed in mg C/m3. Cyanophyceae genus and species composition before, during and after the heatwave compared to the common “normal” situation during heatwaves in August (e) and coldwaves in May (f).
Environments 12 00370 g009
Figure 10. Diatom biomass at station M in the Oder Lagoon the weeks before, during and after the heatwaves in August (a) and coldwaves in May (b). The data is indicated as dots and expressed as biovolume, and the model results are indicated as a dotted line and expressed in mg C/m3. Diatom genus and species composition before, during and after the heatwave compared to the common “normal” situation during heatwaves in August (c) and coldwaves in May (d).
Environments 12 00370 g010
Figure 11. Daily model simulation results for the water surface layer at station M between the years 2010 and 2015. The blue line indicates the total phytoplankton concentration in g C/m3. The red line shows similar results but assumes a 1.5 °C increase in air temperature. The black line shows the relative difference (%) between both simulations, where values above 100% indicate higher phytoplankton concentration at higher air temperatures.
Environments 12 00370 g011
Disclaimer/Publisher’s Note: The statements, opinions and data contained in all publications are solely those of the individual author(s) and contributor(s) and not of MDPI and/or the editor(s). MDPI and/or the editor(s) disclaim responsibility for any injury to people or property resulting from any ideas, methods, instructions or products referred to in the content.