Article

Multi-Index Drought Analysis in Choushui River Alluvial Fan, Taiwan

1
Center for Space and Remote Sensing Research, National Central University, Taoyuan 320, Taiwan
2
Department of Resources Engineering, National Cheng Kung University, Tainan 701, Taiwan
*
Author to whom correspondence should be addressed.
Environments 2024, 11(11), 233; https://doi.org/10.3390/environments11110233
Submission received: 18 July 2024 / Revised: 21 October 2024 / Accepted: 21 October 2024 / Published: 24 October 2024

Abstract

In recent years, increasing drought events due to climate change have led to water scarcity issues in Taiwan, severely impacting the economy and ecosystems. Understanding drought is crucial. This study used Landsat 8 satellite imagery, rainfall, and temperature data to calculate four drought indices, including the Temperature Vegetation Dryness Index (TVDI), improved Temperature Vegetation Dryness Index (iTVDI), Normalized Difference Drought Index (NDDI), and Standardized Precipitation Index (SPI), to investigate spatiotemporal drought variations in the Choushui River Alluvial Fan over the past decade. The findings revealed differences between TVDI and iTVDI in mountainous areas, with iTVDI showing higher accuracy based on soil moisture data. Correlation analysis indicated that drought severity increased with decreasing rainfall or vegetation. The study highlights the significant role of vegetation and precipitation in influencing drought conditions, providing valuable insights for water resource management.

1. Introduction

Drought is a complex natural disaster, and its occurrence is closely related to the interactions between multiple environmental factors, including precipitation, ambient temperature, water vapor pressure, and ultraviolet radiation [1,2,3]. The Intergovernmental Panel on Climate Change (IPCC) defines drought as “a period of abnormally dry weather that causes serious hydrological imbalance” [4]. According to data sources, recent intensifying global climate change has altered precipitation patterns, triggering more severe droughts [5,6,7,8]. The adverse impacts of drought not only affect large-scale crop production but also have long-term negative effects on natural ecosystems, which in turn lead to high socio-economic costs [9,10,11,12]. As a result, in recent years, the amount of research on drought has been increasing, and there is a need to study different types of drought [13,14,15].
Drought assessment can be conducted using three different methods, including field measurements, meteorological data, and remote sensing detection [16,17]. Although field measurements are considered the most accurate method, they are costly and time-consuming, especially in mountainous and remote areas [18,19]. Meteorological data, while useful, are unevenly distributed and cannot detect water shortages and droughts in real time, making it difficult to obtain reliable information for assessing drought changes over time and space, particularly in high-altitude regions [20]. These shortcomings can be mitigated through the use of drought-monitoring indices based on remote sensing detection [21]. The application of remote sensing technology enables drought monitoring with relatively lower costs and time requirements while achieving higher spatiotemporal resolution [10,14,22]. Remote sensing technology is commonly used to monitor drought on a large scale. Previous studies have suggested many ways to find and keep track of droughts [23,24,25]. Common drought monitoring indices include the Temperature-Vegetation Dryness Index (TVDI) [26], the Normalized Difference Drought Index (NDDI) [27], and the Standardized Precipitation Index (SPI) [28]. Therefore, this study selected the aforementioned common drought indices to estimate the spatiotemporal variations of drought in the Choushui River Alluvial Fan.
Due to the spatiotemporal variations in the occurrence and severity of drought, as well as differences in the application of drought indices, it is necessary to compare multiple drought indices to analyze drought distribution more realistically. Considering the complex definition of drought, vegetation indices, such as the Normalized Difference Vegetation Index (NDVI), the NDDI, and the TVDI, provide more appropriate estimates of drought occurrence and intensity. Firstly, Sandholt et al. [26] proposed the TVDI, a straightforward remote sensing method. TVDI utilizes the NDVI-LST (Land Surface Temperature) space to measure drought and has been widely used in studies to monitor drought conditions [29,30,31]. The triangular model suggested by Sandholt et al. [26] shows a significant negative relationship between NDVI and LST [2,32,33]. When the NDVI is less than 0.1, there is no correlation between LST and NDVI [34]. The main variation in TVDI stems from soil moisture, without considering air temperature, which may increase the uncertainty of TVDI due to surface heterogeneity in larger areas and higher NDVI values. Therefore, TVDI is best applied in areas with relatively flat topography, and the DEM (Digital Elevation Model) and temperature can be used for calibration to correct for topography effects [18]. Gu et al. [27] proposed the NDDI method, which combines multiple indices to analyze differences in vegetation reflectance, thereby identifying vegetation conditions. These changes reflect the effects of drought on vegetation [35].
In Taiwan, annual rainfall is quite abundant due to monsoons, plum rains, and typhoons, amounting to about 2.6 times the global average. However, the rainfall distribution is uneven throughout the year, leading to significant differences between wet and dry years. Additionally, the complex topography results in uneven spatial and temporal distribution of precipitation [36]. Droughts in Taiwan primarily occur during the dry season. If summer rainfall is insufficient, reservoir water levels are typically very low by the winter and spring seasons. This period coincides with the peak demand for agricultural water usage. The Choushui River Alluvial Fan, an important agricultural production area in Taiwan, was selected for this study. If drought occurs, water restrictions can lead to reduced agricultural yields and impact socio-economic conditions. Therefore, estimating the drought situation in the Choushui River Alluvial Fan is crucial. The main goal of this study is to use Landsat 8 satellite imagery to calculate drought indices and investigate how droughts have changed in the Choushui River Alluvial Fan from 2013 to 2022. Additionally, this study verifies the suitability of these drought indices using soil moisture and land use data in the region. The significance of this research lies in analyzing the spatiotemporal variations of drought, comparing multiple indices to assess drought conditions, and providing a scientific basis for future drought monitoring and response measures. Moreover, using remote sensing technology helps us to better understand the spatial and temporal distribution of drought, which can lead to more effective strategies for managing water resources.

2. Materials and Methods

2.1. Study Area and Data

The Choushui River Alluvial Fan is located in the central part of Taiwan, covering an area of about 2079 km2, with a gentle topography and an elevation ranging from about 0 to 100 m above sea level, and its geographic location is shown in Figure 1. The average annual rainfall is about 2459 mm and the average annual flow is about 6095 million m3. The main rainfall occurs from May to October, while from November to the following April, there is less rainfall, and the spatiotemporal distribution of rainfall is obviously uneven [36]. Choushui River is one of the most important water resources in central Taiwan. When surface water is scarce, there will be a shortfall in water supply. The first to bear the brunt is agricultural water, which accounts for more than 80% of the total water consumption in central Taiwan, and as the Changhua and Yunlin area are important agricultural production regions in Taiwan, restrictions on agricultural water due to drought will lead to a decrease in agricultural output [37]. Understanding the hydrological conditions, especially soil moisture, in the Choushui River Alluvial Fan is crucial. Fluctuations in food prices can occur as a result, underscoring the importance of having a comprehensive understanding of the situation.

2.2. Data

2.2.1. Landsat 8 Satellite Imagery

Landsat 8 is equipped with two effective payloads, the Operational Land Imager and the Thermal Infrared Sensor, encompassing a total of 11 spectral bands and a revisit period of 16 days [29,38]. Landsat 8 satellite imagery consists of 11 spectral bands, featuring a spatial resolution of 15 m along a 185 km swath and a multispectral resolution of 30 m [39], while the TIRS has a spatial resolution of 100 m [40]. Additionally, the satellite orbits the Earth along a near-polar, sun-synchronous path at an altitude of 705 km. It completes one revolution every 99 min, with a cycle of 16 days [41]. Due to these characteristics, Landsat 8 satellite imagery was selected as the source of data for the study. In this study, data from both OLI and TIRS instruments were used to analyze the spatiotemporal variability in drought in the study area over the past decade. The selected Landsat 8 satellite imagery data are presented in Table 1.

2.2.2. TCCIP Meteorological Data

The Taiwan Climate Change Projection and Information Platform (TCCIP) is a climate research project and the primary provider of climate data in Taiwan. It also serves as a key resource for national policymakers on adaptation strategies [42]. They have compiled station data from various units across Taiwan and enhanced the spatial resolution of the data by combining them with historical data from gridded observations using mathematical and statistical methods. The spatial resolution has been improved from several hundred kilometers to 5 km to accommodate the complex and varied topography of Taiwan. Many studies use TCCIP 5 km resolution grid data [43,44,45,46]. This study used monthly temperature and rainfall data from the central region of the 5 km grid between 2013 and 2022 to analyze the spatiotemporal variability of drought in the study area over the past decade.

2.2.3. Land Use/Land Cover (LULC)

Land Use/Land Cover (LULC) types are often associated with soil moisture and drought conditions [47]. Understanding the spatiotemporal variability of different land use types is important for assessing drought conditions [14,48]. This study used annual LULC satellite data from Sentinel-2 with a resolution of 10 m. We assessed the trends in Land Use/Land Cover (LULC) categories and created LULC maps from 2017 to 2022, which were then used to evaluate drought trends. The results of the analysis show that there are eight major land use change types in the study area, including water, trees, flooded vegetation, crops, building, bare ground, rangeland and clouds, as shown in Figure 2.

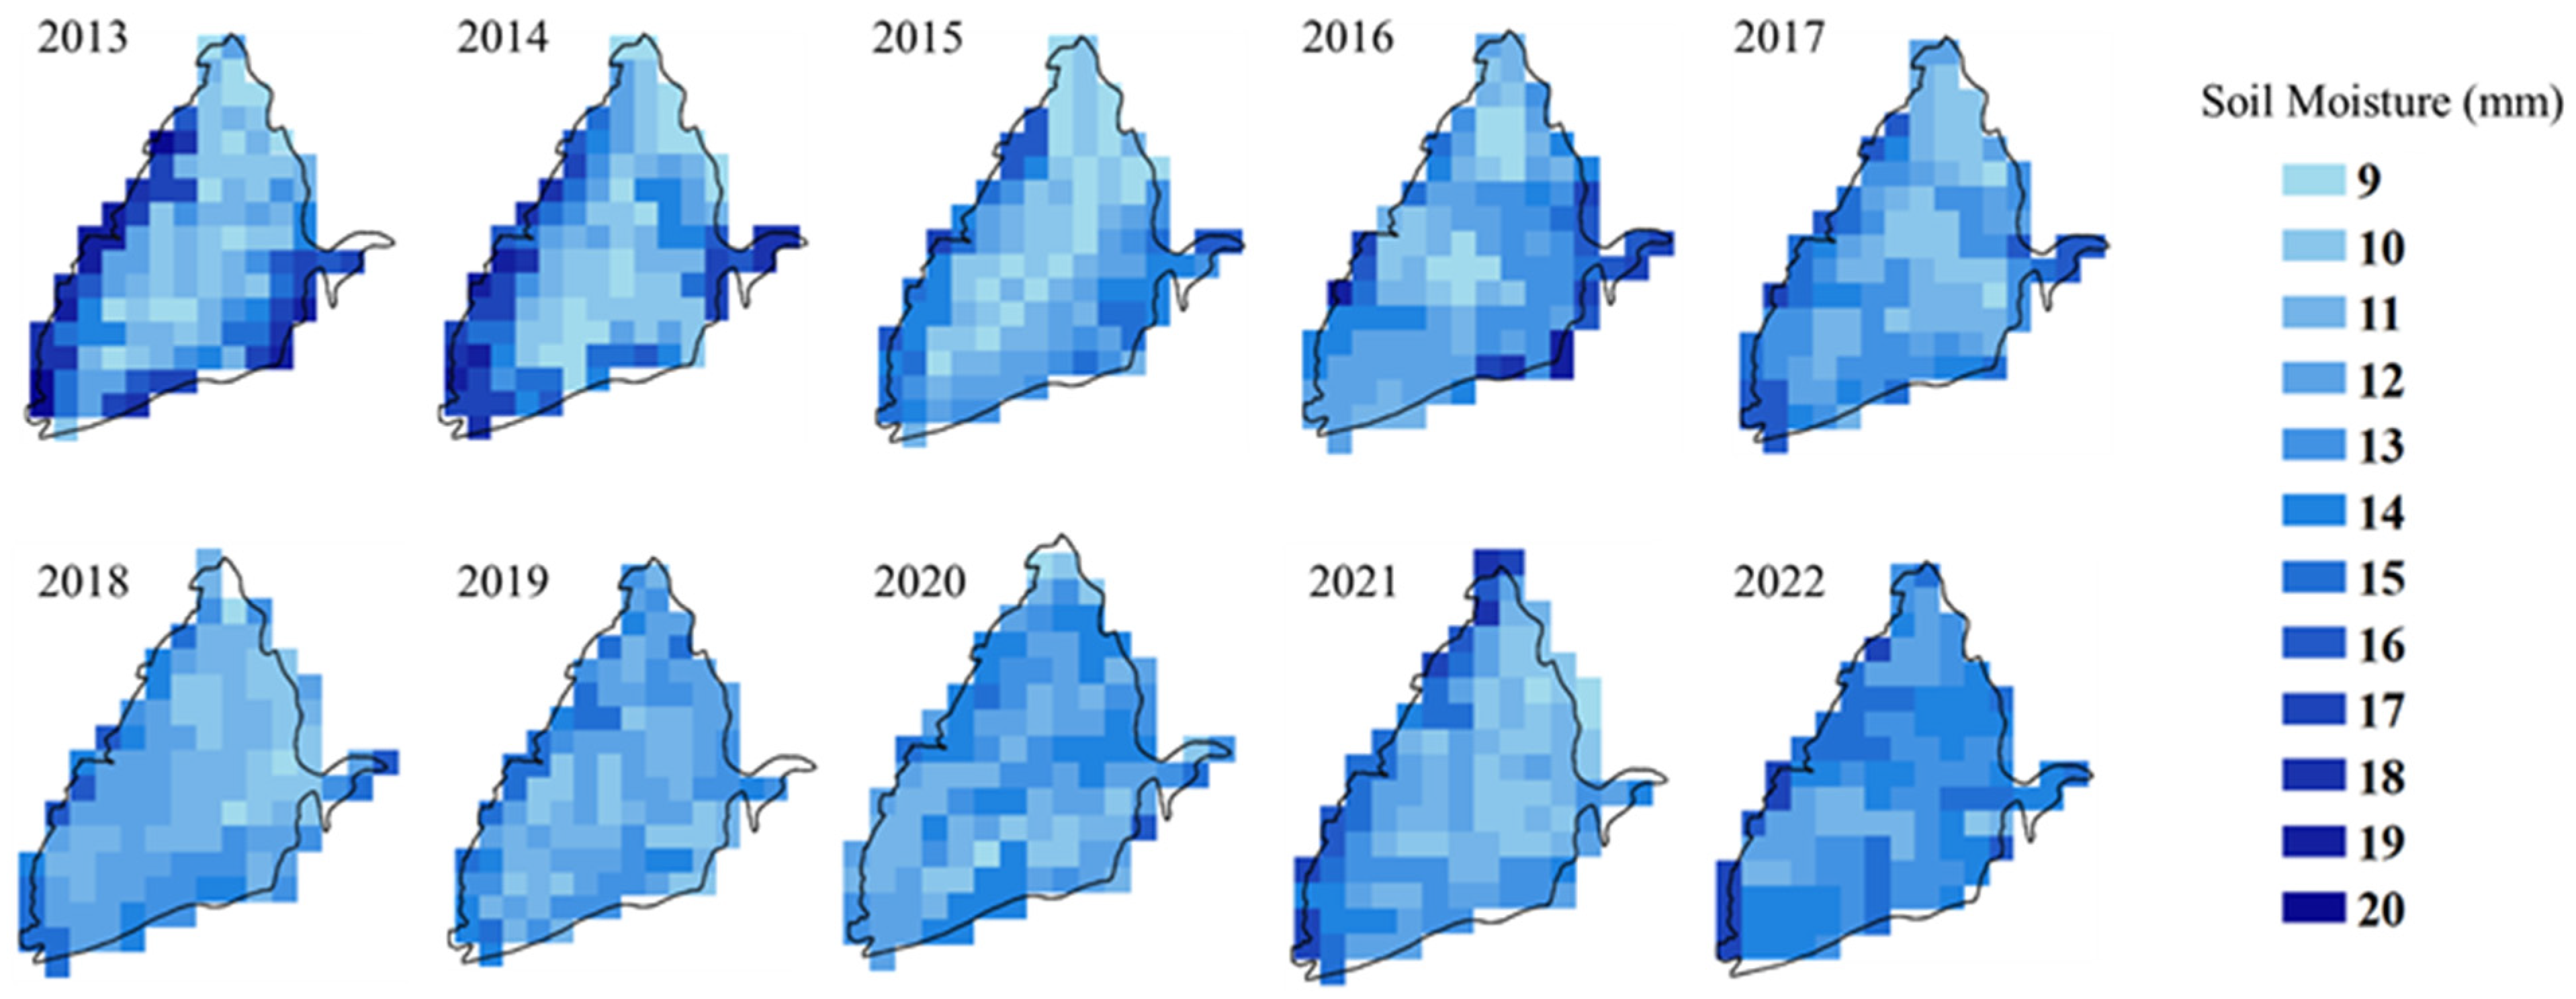
2.2.4. Soil Moisture (SM)

Soil moisture is the amount of water contained in the soil, and data were obtained from the TerraClimate Global Hydrologic Database. TerraClimate is a database that integrates satellite and climate data and is known for its high accuracy, wide coverage, and high spatiotemporal resolution [49]. The database provides monthly data for various climate variables such as solar radiation, maximum and minimum temperatures, precipitation, vapor pressure, and wind speed. It also includes calculated variables like runoff, soil moisture content, actual evapotranspiration, and the Palmer Drought Severity Index. The soil moisture data provided by TerraClimate have previously been used for monitoring soil drought [50]. TerraClimate is used as an indicator to assess the soil moisture status; therefore, in this study, grid imagery was collected and used as the actual value of soil moisture, as shown in Figure 3.

2.3. Methodology

This study used Landsat 8 satellite imagery to estimate the spatiotemporal variations of drought in the Choushui River Alluvial Fan from 2013 to 2022. Using remote sensing technology, four drought indices were calculated, namely the Temperature Vegetation Drying Index (TVDI), the Improved Temperature Vegetation Drying Index (iTVDI), the Normalized Difference Drought Index (NDDI), and the Standardized Precipitation Index (SPI) derived from rainfall data. The following sections explain the calculation procedures for each of these four indices. The parameters required for each method are shown in Figure 4.

2.3.1. Temperature Vegetation Dryness Index (TVDI)

The Temperature Vegetation Dryness Index (TVDI) is a measure that is used to assess how dry or wet the surface soil is in a particular area. It was introduced by Sandholt et al. [26] and combines the Normalized Difference Vegetation Index (NDVI) with Land Surface Temperature (LST) [26]. The TVDI principle relies on the triangular spatial relationship between LST and NDVI to gather information on changes in relative soil moisture. This index, based on the energy balance perspective, takes into account the variation in LST and the evapotranspiration process of moisture in the soil, providing an indirect estimation of the surface soil’s wetness or dryness. The TVDI values range from 0 to 1.0 and can be categorized into five classes, namely very wet, wet, normal, dry and very dry [51]. A TVDI value closer to 0 indicates a wetter surface, while a value closer to 1.0 indicates a drier surface. This is how the TVDI is used to evaluate the amount of moisture in the surface soil. The calculation method for TVDI is as shown in Equation (1):
TVDI = ( LST LST min ) ( LST max LST min )
where LST is the surface temperature; LSTmin is the LST on the wet edge in the NDVI grid; and LSTmax is the LST on the dry edge in the NDVI grid.
To calculate the TVDI, the surface temperatures LSTmax and LSTmin at the dry edge and wet edge are required. Therefore, the locations of the dry edge and wet edge must be defined first, and these two lines are usually represented by straight-line equations. The drying and wetting boundaries are straight-line equations obtained by applying the least squares regression method [46], which were calculated as shown in Equation (2):
LST max = a 1 + b 1   ×   NDVI LST min = a 2 + b 2   ×   NDVI
where a1 and a2 are the constant terms of the dry/wet edges equation; b1 and b2 are the slopes of the dry/wet edges equation.
In the NDVI-LST space, intercepts a1 and a2 represent LST under moisture sufficiency and deprivation, respectively, while slopes b1 and b2 vary due to factors like evapotranspiration and soil moisture [52,53,54]. The slope of the wet edge is 0, indicating no relation to vegetation cover [55], as data on the wet edge reflect saturated soil moisture, maintaining LST at the ambient temperature.
Dry/wet edges are affected by NDVI, and LST. In order to effectively amend the dry/wet edges to ensure they are closer to the theoretical value, the statistical method and boxplot proposed by Du et al. [34] were used to calculate the outliers of the wet points [34]. Subsequently, appropriate measures were taken to eliminate these outliers, reducing interference with the simulation of the wet edge. At the same time, to optimize the dry edges, this study adopted the optimization method proposed by Du et al. [34], which removes data points within the range of NDVI 0.0 to 0.1. This method effectively enhanced the accuracy of the dry/wet edges.

2.3.2. Improved Temperature Vegetation Dryness Index (iTVDI)

The TVDI model is based on the LST-NDVI space. Therefore, accurate simulation of the dry/wet edges is crucial for the accuracy of TVDI when it is used to monitor and assess regional drought conditions. Although the NDVI-LST triangular space can be used to monitor soil moisture, the performance of TVDI is affected by the size of the space and the method of determining the dry/wet edges. Temperature is not considered in the TVDI model, which may increase the uncertainty of TVDI for larger areas and higher NDVI values [26]. The effect of elevation also increases the uncertainty of soil moisture estimation by TVDI. Therefore, TVDI should ideally be used only in areas with less variation in topography. Past studies have proposed correcting for the effects of topography and incorporating air temperature into the TVDI equation to improve its performance and address the problem of inconsistencies in evapotranspiration [56,57]. In this study, the method of Rahimzadeh-Bajgiran et al. [18] was used to combine the air temperature and enhance the determination of the dry/wet edges [18]. The calculation method is as shown in Equation (3):
iTVDI = ( Δ LST o b s Δ LST min ) ( Δ LST max   Δ LST min )
where ∆LSTmin is the Observed LST minus air temperature (Ta) and Ta is the air temperature corrected using the DEM.

2.3.3. Normalized Difference Drought Index (NDDI)

The Normalized Difference Drought Index (NDDI) combines the Normalized Difference Vegetation Index (NDVI) and the Normalized Difference Water Index (NDWI). Its primary goal is to develop a tool that is capable of calculating drought behavior and intensity. The NDDI ranges between −1.0 and 1.0, where negative values indicate clouds or the presence of water and positive values near 1.0 indicate more severe drought conditions. Referring to Paniagua et al. [58], drought can be classified into six classes, including no drought/water cover (−1.0 ≤ NDDI < 0.0), abnormal drought (0.0 ≤ NDDI < 0.1), moderate drought (0.1 ≤ NDDI < 0.2), severe drought (0.2 ≤ NDDI < 0.3), extreme drought (0.3 ≤ NDDI < 0.4), and exceptional drought (0.4 ≤ NDDI < 1.0). The calculation method is as shown in Equation (4):
NDDI = ( NDVI NDWI ) ( NDVI   +   NDWI )
where NDVI is the Normalized Difference Vegetation Index and NDWI is the Normalized Difference Water Index.

2.3.4. Standardized Precipitation Index (SPI)

A prolonged lack of rainfall can lead to varying degrees of drought, which can have significant impacts on local water supply, agricultural production, and socio-economic activities. The Standardized Precipitation Index (SPI), proposed by Mckee et al. [28], converts rainfall amounts into standardized values. Its main function is to reflect the probability of rainfall in a specific observation area relative to the long-term climate conditions of that area. It is widely used to assess the intensity of meteorological drought events [59]. Therefore, it can be used to define and compare drought conditions in different regions. The index provides reliable estimates of drought magnitude, severity, and spatial extent, enabling the establishment of early-warning systems for drought [5,60]. When precipitation is higher than the long-term average, SPI is positive; when precipitation is lower than the long-term average, SPI is negative. According to Mckee et al. [28], drought is classified into five categories, including no drought (2.0 ≤ SPI < 0.0), mild drought (−1.0 < SPI ≤ 0.0), moderate drought (−1.5 < SPI ≤ −1.0), severe drought (−2.0 < SPI ≤ −1.5), and extreme drought (SPI ≤ −2.0). The calculation method is as shown in Equation (5):
SPI q = W i , q W i , q ¯ S w , q W i , q = ln ( R i , q )
where W i , q ¯ represents the mean rainfall and SPIq represents the standard deviation of rainfall at time scale of n.

2.4. Evaluating the Optimal Drought Indices

This study used various methods to test if the drought index works well for the Choushui River Alluvial Fan. We compared the drought index with soil moisture and land use data through correlation analysis, index cross-checking, and spatial distribution comparison. These methods helped us evaluate the accuracy and suitability of the drought index, ensuring its reliability and practical value in this area.

3. Results and Discussion

3.1. The Analysis Results of the NDVI-LST Spatial and the Dry/Wet Edges

As TVDI is an index composed of NDVI and LST, we initially examine NDVI-LST spatial and the dry/wet edges. The wet/dry edges vary as a result of multiple factors such as evapotranspiration, canopy conductivity, and soil moisture content, as stated by Carlson et al. [54]. Due to the effects of multiple factors, the pattern of variation in the edge is not clearly defined. In the NDVI-LST space, as the temperature decreases, spatial shrinkage occurs. By observing the spatial properties of NDVI-LST, it can be clearly seen that the maximum surface temperature shows a decreasing trend as the vegetation cover increases, as shown in Figure 5.

3.2. Spatiotemporal Variation of TVDI

This study classifies drought into five classes based on the analysis of TVDI results [61]. The analysis shows that during the dry season, the TVDI of the study area is 0.64 ± 0.17, indicating a drought range, while during the wet season, the TVDI is 0.41 ± 0.11, indicating a normal range. The spatial variation of TVDI in the study area is characterized by significant and regular patterns, as shown in Figure 6. TVDI is lower in the western coastal and eastern mountainous of the study area than in the surrounding area because the coastal areas are humid and most of the available energy is consumed in evapotranspiration of water, with only a small portion being used to heat the surface [62]. In mountainous regions, the presence of vegetation aids in regulating temperature through the process of transpiration, wherein plants release water vapor from their leaf surfaces, thereby dissipating heat and preventing excessive temperature increases. The central part of the study area exhibits low vegetation cover, which may result in lower soil moisture content. This makes this region more susceptible to drought conditions.

3.3. Spatiotemporal Variation of iTVDI

This study references Liu and Yue [61] for the analysis of iTVDI results, which showed that iTVDI was 0.62 ± 0.13 in the dry season, which is in the dry range, and 0.54 ± 0.16 in the wet season, which is in the normal range. Similar spatiotemporal variations can be seen in the TVDI and iTVDI distributions, as shown in Figure 6 and Figure 7. The main difference between TVDI and iTVDI is that TVDI in mountainous areas is wetter than iTVDI, while flat areas show similar index values in TVDI and iTVDI. In 2015, the TVDI was 0.65 ± 0.13 in the dry season and 0.62 ± 0.12 in the wet season; in 2018, the TVDI was 0.66 ± 0.09 in the dry season and 0.60 ± 0.12 in the wet season; and in 2021, it increased to 0.69 ± 0.13 in the dry season and 0.66 ± 0.11 in the wet season, all of which occurred under existing drought conditions. These results are similar to the previous results of TVDI.

3.4. Spatiotemporal Distribution Differences Between TVDI and iTVDI

TVDI (Temperature-Vegetation Dryness Index) and iTVDI (Improved Temperature-Vegetation Dryness Index) differ in their spatiotemporal distribution due to variations in their calculation methods and application contexts. These differences affect their performance and the evaluation of drought conditions. TVDI mainly reflects soil moisture variations without considering temperature, making it more suitable for regions with flat terrain and uniform vegetation cover [26]. However, when applied to larger areas or regions with significant topographical differences, TVDI may introduce uncertainties and errors due to its omission of temperature changes. iTVDI, an improvement over TVDI, incorporates additional environmental parameters such as temperature, precipitation, and other meteorological factors. It adjusts for terrain, seasonal changes, and varying vegetation types, allowing for more accurate drought monitoring results in larger and more complex terrain regions. In summary, iTVDI provides a more detailed and accurate spatiotemporal analysis of drought conditions than TVDI by integrating more factors. This is especially true in areas with complex topography and variable climate conditions. The key distinction between TVDI and iTVDI is most evident in mountainous areas, as shown in Figure 8.

3.5. Spatiotemporal Variation of NDDI

The NDDI is an index estimated by satellite observations, and its main application is to estimate the extent of drought through ground-based observations. The index is a good combination of NDVI and NDWI, and the combined result provides more accurate drought monitoring than NDVI alone [27]. The NDDI ranges from 0 to 1.0, with larger values indicating drought and smaller values indicating no drought or water cover. In this study, we refer to Paniagua et al. [58] by analyzing the NDDI results to classify drought into six classes. The NDDI during the dry season is 0.12 ± 0.11, which is in the moderate drought range, while during the wet season, it is 0.0 ± 0.21, which is in the no drought range. The analysis of the study area showed that the NDDI values of 0.03 ± 0.02 for the western coastal region and 0.14 ± 0.04 for the eastern mountainous were classified as no drought and mild drought ranges. The spatial distribution of drought in the study area shows regular variations, and such data differences reflect the geographical characteristics of drought conditions in the study area. In the coastal areas, which are closer to the sea, the environment tends to be relatively humid, resulting in lower NDDI values, and the values of the rest of the components vary with the wet and dry seasons, and this difference reflects the regional climatic and topographic variability, as shown in Figure 9.

3.6. The SPI Analysis

This study classified drought into five classes by analyzing the SPI results, according to Mckee et al. [28], where a negative value of SPI indicates low rainfall and a positive value of SPI indicates high rainfall. The SPI value during the dry season is −0.77 ± 0.51, indicating that it falls within the mild drought range, while during the wet season, it is 0.18 ± 0.61, falling within the range of no drought to mild drought. Such an assessment provides a concrete quantification of the drought state, which helps us to more fully understand and respond to the potential impacts of climate variability on the study area. Severe drought occurred when the SPI was less than −1.5 at the end of 2014 to the beginning of 2015, the end of 2018 to the beginning of 2019, and the end of 2020 to the beginning of 2021. An extreme drought of less than −2.0 occurred in 2020, as shown in Figure 10. The study area had drought events in 2015, 2018, and in 2021, and this result is consistent with the aforementioned results. Rainfall in Taiwan is concentrated in the plum rain and typhoon seasons, making a clear distinction between the dry/wet seasons. If there is not enough rain during the summer in the study area, and there is increased water demand, it can easily lead to drought. Drought disasters usually occur in the spring, and usually drought events must wait for significant rainfall in the summer before the drought can be lifted, so the formation of a drought has a lot to do with rainfall.

3.7. The Relationship Between TVDI, iTVDI, and Soil Moisture Content

In this study, the correlation between TVDI, iTVDI, NDDI and soil moisture was analyzed to compare which index is more suitable for estimating the soil moisture changes in the study area and to observe the spatiotemporal variations of drought. As mentioned before, TerraClimate can be used as a measure to assess soil moisture. Therefore, we used these data to confirm the relationship between TVDI, iTVDI, NDDI, and soil moisture. Taking the analysis results from 2013 and 2019 as an example, there is a negative correlation between soil moisture and TVDI, iTVDI, and NDDI, as shown in Figure 11. Among them, there is a significant correlation between iTVDI and soil moisture. This is because soil moisture is correlated with the evapotranspiration rate, which in turn is correlated with (LST—Ta) in the iTVDI equation, and neglecting Ta will result in inaccurate estimates. Because the TVDI formula does not take Ta into account, the TVDI is not well suited for reflecting the distribution of soil moisture, especially over a wide area with large elevation variations.

3.8. The Relationship Between iTVDI and Drought Indices

Both rainfall and vegetation levels affect the extent of drought. In this study, the correlation between iTVDI, SPI, and NDDI was analyzed to investigate whether rainfall or vegetation is the most important factor affecting the drought of the study area. Taking the analysis results from 2015 as an example, iTVDI shows a negative correlation with SPI, indicating that as precipitation decreases, iTVDI values increase. On the other hand, there is a positive correlation between iTVDI and NDDI, indicating that as the amount of vegetation increases, the value of iTVDI decreases, as shown in Figure 12. According to the correlation coefficient results, the average correlation coefficient between iTVDI and SPI during the dry season is 0.94, while during the wet season, the average correlation coefficient is 0.93. The correlation coefficient between iTVDI and NDDI during the dry season is 0.79, while during the wet season, the correlation coefficient is 0.82. The results of the analysis indicate that both rainfall and vegetation are significantly related to drought, which are important factors affecting drought in the study area.

4. Conclusions

This study used Landsat 8 imagery and TCCIP data to calculate drought indices and explore spatiotemporal variations of drought in the Choushui River Alluvial Fan. The analysis identified distinct drought years and stable dry/wet areas, showing significant correlations among four drought indices. SM and LULC data validated these indices, improving assessments of soil drought severity. The key conclusions are as follows.
  • The TVDI is commonly used for drought monitoring due to its effectiveness and ease of use. This study applied TVDI to estimate spatiotemporal variations in the Choushui River Alluvial Fan. The results showed that the dry season (November–April) fell within the dry range, while the wet season (May–October) was normal. Coastal and mountainous areas had low TVDI values, indicating higher soil moisture and fewer drought occurrences, whereas the central fan region had high TVDI values, signifying greater drought susceptibility. The distribution maps revealed similar patterns in plains but notable differences in mountains, where TVDI indicated higher moisture levels than iTVDI. This study found that iTVDI was more accurate than TVDI based on SM data.
  • Correlation analysis of iTVDI, SPI, and NDDI indicated that drought formation is influenced by factors such as rainfall and vegetation. This study assessed drought severity in the Choushui River Alluvial Fan using four indices to identify the most effective for understanding local drought patterns, while also analyzing temporal changes in drought severity and investigating factors like vegetation and rainfall.

Author Contributions

Y.-S.C., H.-F.Y. and J.-R.L. carried out the conception of this work. J.-R.L. performed the data visualization and prepared the original draft. Y.-S.C. and H.-F.Y. supervised the writing, reviewing, and editing. All authors have read and agreed to the published version of the manuscript.

Funding

This research was funded by Sinotech Engineering Consultants, grant number RV22765-A.

Data Availability Statement

The data that support the findings of this study are available from the corresponding author, H.-F.Y., upon reasonable request.

Conflicts of Interest

The authors declare no conflicts of interest.

References

  1. Leng, G.; Hall, J. Crop yield sensitivity of global major agricultural countries to droughts and the projected changes in the future. Sci. Total Environ. 2019, 654, 811–821. [Google Scholar] [CrossRef] [PubMed]
  2. Bian, Z.; Roujean, J.; Fan, T.; Dong, Y.; Hu, T.; Cao, B.; Li, H.; Du, Y.; Xiao, Q.; Liu, Q. An angular normalization method for temperature vegetation dryness index (TVDI) in monitoring agricultural drought. Remote Sens. Environ. 2023, 284, 113330. [Google Scholar] [CrossRef]
  3. Yin, G.; Zhang, H. A new integrated index for drought stress monitoring based on decomposed vegetation response factors. J. Hydrol. 2023, 618, 129252. [Google Scholar] [CrossRef]
  4. Stocker, T.F.; Qin, D.; Plattner, G.K.; Tignor, M.M.; Allen, S.K.; Boschung, J.; Nauels, A.; Xia, Y.; Bex, V.; Midgley, P.M. Climate Change 2013: The Physical Science Basis. Contribution of Working Group I to the Fifth Assessment Report of IPCC the Intergovernmental Panel on Climate Change; Cambridge University Press: Cambridge, UK, 2014. [Google Scholar] [CrossRef]
  5. Yeh, H.-F.; Hsu, H.-L. Stochastic Model for Drought Forecasting in the Southern Taiwan Basin. Water 2019, 11, 2041. [Google Scholar] [CrossRef]
  6. Fariesta, A.R.; Shidiq, I.P.; Dimyati, M. Spatial and temporal analysis of drought in rice fields using Normalized Difference Drought Index (NDDI) in Indramayu Regency. In Seventh Geoinformation Science Symposium 2021; SPIE: Yogyakarta, Indonesia, 2021; pp. 82–90. [Google Scholar]
  7. Shi, M.; Yuan, Z.; Shi, X.; Li, M.; Chen, F.; Li, Y. Drought assessment of terrestrial ecosystems in the Yangtze River Basin, China. J. Clean. Prod. 2022, 362, 132234. [Google Scholar] [CrossRef]
  8. Lee, H.; Calvin, K.; Dasgupta, D.; Krinner, G.; Mukherji, A.; Thorne, P.; Trisos, C.; Romero, J.; Aldunce, P.; Barret, K.; et al. IPCC, 2023: Climate Change 2023: Synthesis Report, Summary for Policymakers. Contribution of Working Groups I, II and III to the Sixth Assessment Report of the Intergovernmental Panel on Climate Change; Core Writing Team, Lee, H., Romero, J., Eds.; IPCC: Geneva, Switzerland, 2023. [Google Scholar]
  9. Du, L.; Tian, Q.; Yu, T.; Meng, Q.; Jancso, T.; Udvardy, P.; Huang, Y. A comprehensive drought monitoring method integrating MODIS and TRMM data. Int. J. Appl. Earth Obs. Geoinf. 2013, 23, 245–253. [Google Scholar] [CrossRef]
  10. Ghazaryan, G.; Dubovyk, O.; Graw, V.; Kussul, N.; Schellberg, J. Local-scale agricultural drought monitoring with satellite-based multi-sensor time-series. GISci. Remote Sens. 2020, 57, 704–718. [Google Scholar] [CrossRef]
  11. Zhang, X.; Hao, Z.; Singh, V.P.; Zhang, Y.; Feng, S.; Xu, Y.; Hao, F. Drought propagation under global warming: Characteristics, approaches, processes, and controlling factors. Sci. Total Environ. 2022, 838, 156021. [Google Scholar] [CrossRef]
  12. Guo, W.; Huang, S.; Huang, Q.; She, D.; Shi, H.; Leng, G.; Li, J.; Cheng, L.; Gao, Y.; Peng, J. Precipitation and vegetation transpiration variations dominate the dynamics of agricultural drought characteristics in China. Sci. Total Environ. 2023, 898, 165480. [Google Scholar] [CrossRef]
  13. Yeh, H.-F. Spatiotemporal variation of the meteorological and groundwater droughts in central Taiwan. Front. Water 2021, 3, 636792. [Google Scholar] [CrossRef]
  14. Xu, Y.; Zhu, X.; Cheng, X.; Gun, Z.; Lin, J.; Zhao, J.; Yao, L.; Zhou, C. Drought assessment of China in 2002–2017 based on a comprehensive drought index. Agric. For. Meteorol. 2022, 319, 108922. [Google Scholar] [CrossRef]
  15. Pan, Y.; Zhu, Y.; Lü, H.; Yagci, A.L.; Fu, X.; Liu, E.; Xu, H.; Ding, Z.; Liu, R. Accuracy of agricultural drought indices and analysis of agricultural drought characteristics in China between 2000 and 2019. Agric. Water Manag. 2023, 283, 108305. [Google Scholar] [CrossRef]
  16. Tabatabaeenejad, A.; Burgin, M.; Duan, X.; Moghaddam, M. P-band radar retrieval of subsurface soil moisture profile as a second-order polynomial: First AirMOSS results. IEEE Trans. Geosci. Remote Sens. 2014, 53, 645–658. [Google Scholar] [CrossRef]
  17. Peng, J.; Loew, A. Recent advances in soil moisture estimation from remote sensing. Water 2017, 9, 530. [Google Scholar] [CrossRef]
  18. Rahimzadeh-Bajgiran, P.; Omasa, K.; Shimizu, Y. Comparative evaluation of the Vegetation Dryness Index (VDI), the Temperature Vegetation Dryness Index (TVDI) and the improved TVDI (iTVDI) for water stress detection in semi-arid regions of Iran. ISPRS J. Photogramm. Remote Sens. 2012, 68, 1–12. [Google Scholar] [CrossRef]
  19. Salas-Martínez, F.; Valdés-Rodríguez, O.A.; Palacios-Wassenaar, O.M.; Márquez-Grajales, A.; Rodríguez-Hernández, L.D. Methodological estimation to quantify drought intensity based on the NDDI index with Landsat 8 multispectral images in the central zone of the Gulf of Mexico. Front. Earth Sci. 2023, 11, 1027483. [Google Scholar] [CrossRef]
  20. AghaKouchak, A.; Farahmand, A.; Melton, F.S.; Teixeira, J.; Anderson, M.C.; Wardlow, B.D.; Hain, C.R. Remote sensing of drought: Progress, challenges and opportunities. Rev. Geophys. 2015, 53, 452–480. [Google Scholar] [CrossRef]
  21. Zhang, L.; Guo, X.; Zhao, T.; Gong, S.; Xu, X.; Li, Y.; Luo, L.; Gui, K.; Wang, H.; Zheng, Y.; et al. A modelling study of the terrain effects on haze pollution in the Sichuan Basin. Atmos. Environ. 2018, 196, 77–85. [Google Scholar] [CrossRef]
  22. Le, M.S.; Liou, Y.A. Spatio-temporal assessment of surface moisture and evapotranspiration variability using remote sensing techniques. Remote Sens. 2021, 13, 1667. [Google Scholar] [CrossRef]
  23. Hazaymeh, K.; Hassan, Q.K. A remote sensing-based agricultural drought indicator and its implementation over a semi-arid region, Jordan. J. Arid Land 2017, 9, 319–330. [Google Scholar] [CrossRef]
  24. Shi, S.; Yao, F.; Zhang, J.; Yang, S. Evaluation of temperature vegetation dryness index on drought monitoring over Eurasia. IEEE Access 2020, 8, 30050–30059. [Google Scholar] [CrossRef]
  25. Zhao, X.; Xia, H.; Pan, L.; Song, H.; Niu, W.; Wang, R.; Li, R.; Bian, X.; Guo, Y.; Qin, Y. Drought monitoring over Yellow River basin from 2003–2019 using reconstructed MODIS land surface temperature in Google Earth Engine. Remote Sens. 2021, 13, 3748. [Google Scholar] [CrossRef]
  26. Sandholt, I.; Rasmussen, K.; Andersen, J. A simple interpretation of the surface temperature/vegetation index space for assessment of surface moisture status. Remote Sens. Environ. 2002, 79, 213–224. [Google Scholar] [CrossRef]
  27. Gu, Y.; Brown, J.F.; Verdin, J.P.; Wardlow, B. A five-year analysis of MODIS NDVI and NDWI for grassland drought assessment over the central Great Plains of the United States. Geophys. Res. Lett. 2007, 34. [Google Scholar] [CrossRef]
  28. McKee, T.B.; Doesken, N.J.; Kleist, J. The relationship of drought frequency and duration to time scales. In Proceedings of the 8th Conference on Applied Climatology, Anaheim, CA, USA, 17–22 January 1993; pp. 179–183. [Google Scholar]
  29. Holzman, M.E.; Rivas, R.; Piccolo, M.C. Estimating soil moisture and the relationship with crop yield using surface temperature and vegetation index. Int. J. Appl. Earth Obs. Geoinf. 2014, 28, 181–192. [Google Scholar] [CrossRef]
  30. Bai, J.J.; Yuan, Y.U.; Di, L. Comparison between TVDI and CWSI for drought monitoring in the Guanzhong Plain, China. J. Integr. Agric. 2017, 16, 389–397. [Google Scholar] [CrossRef]
  31. Li, C.; Adu, B.; Wu, J.; Qin, G.; Li, H.; Han, Y. Spatial and temporal variations of drought in Sichuan Province from 2001 to 2020 based on modified temperature vegetation dryness index (TVDI). Ecol. Indic. 2022, 139, 108883. [Google Scholar] [CrossRef]
  32. Wan, W.; Han, Y.; Wu, H.; Liu, F.; Liu, Z. Application of the source–sink landscape method in the evaluation of agricultural non-point source pollution: First estimation of an orchard-dominated area in China. Agric. Water Manag. 2021, 252, 106910. [Google Scholar] [CrossRef]
  33. Herawati, A.; Mujiyo, M.; Nugroho, B.D.; Istiqomah, N.M.; Irmawati, V.; Hasanah, K.; Hardian, T.; Anggita, A. Drought potential index using Normalized Difference Drought Index (NDDI) method based on Geographical Information System (GIS) in Slogohimo, Wonogiri Indonesia. IOP Conf. Ser. :arth Environ. Sci. 2024, 1314, 012040. [Google Scholar] [CrossRef]
  34. Chen, H.Y.; Huang, C.C.; Yeh, H.F. Quantifying the relative contribution of the climate change and human activity on runoff in the choshui River Alluvial Fan, Taiwan. Land 2021, 10, 825. [Google Scholar] [CrossRef]
  35. Wang, F.; Lai, H.; Li, Y.; Feng, K.; Zhang, Z.; Tian, Q.; Zhu, X.; Yang, H. Identifying the status of groundwater drought from a GRACE mascon model perspective across China during 2003–2018. Agric. Water Manag. 2022, 260, 107251. [Google Scholar] [CrossRef]
  36. Landsat MISSIONS. Landsat 8 Data Users Handbook; Landsat MISSIONS: Sioux Falls, SD, USA, 2019.
  37. Liou, Y.A.; Le, M.S.; Chien, H. Normalized difference latent heat index for remote sensing of land surface energy fluxes. IEEE Trans. Geosci. Remote Sens. 2018, 57, 1423–1433. [Google Scholar] [CrossRef]
  38. Zhang, F.; Zhang, L.W.; Jing-Jing, S.H.; Huang, J.F. Soil moisture monitoring based on land surface temperature-vegetation index space derived from MODIS data. Pedosphere 2014, 24, 450–460. [Google Scholar] [CrossRef]
  39. Boonpook, W.; Tan, Y.; Nardkulpat, A.; Torsri, K.; Torteeka, P.; Kamsing, P.; Sawangwit, U.; Pena, J.; Jainaen, M. Deep learning semantic segmentation for land use and land cover types using Landsat 8 imagery. ISPRS Int. J. Geo-Inf. 2023, 12, 14. [Google Scholar] [CrossRef]
  40. Lin, L.Y.; Lin, C.T.; Chen, Y.M.; Cheng, C.T.; Li, H.C.; Chen, W.B. The Taiwan climate change projection information and adaptation knowledge platform: A decade of climate research. Water 2022, 14, 358. [Google Scholar] [CrossRef]
  41. Huang, W.R.; Chang, Y.H.; Cheng, C.T.; Hsu, H.H.; Tu, C.Y.; Kitoh, A. Summer Convective Afternoon Rainfall Simulation and Projection Using WRF Driven by Global Climate Model. Part I: Over Taiwan. Terr. Atmos. Ocean. Sci. 2016, 27, 659–671. [Google Scholar] [CrossRef]
  42. Lee, Y.C.; Wang, C.C.; Weng, S.P.; Chen, C.T.; Cheng, C.T. Future projections of meteorological drought characteristics in Taiwan. Atmos. Sci. 2019, 47, 66–91. [Google Scholar]
  43. Chen, C.J.; Chen, C.C.; Lo, M.H.; Juang, J.Y.; Chang, C.M. Central Taiwan’s hydroclimate in response to land use/cover change. Environ. Res. Lett. 2020, 15, 034015. [Google Scholar] [CrossRef]
  44. Li, P.L.; Lin, L.F.; Chen, C.J. Hydrometeorological assessment of satellite and model precipitation products over Taiwan. J. Hydrometeorol. 2021, 22, 2897–2915. [Google Scholar] [CrossRef]
  45. Zhang, Y.; Feng, X.; Fu, B.; Chen, Y.; Wang, X. Satellite-observed global terrestrial vegetation production in response to water availability. Remote Sens. 2021, 13, 1289. [Google Scholar] [CrossRef]
  46. Talukdar, S.; Singha, P.; Mahato, S.; Pal, S.; Liou, Y.A.; Rahman, A. Land-use land-cover classification by machine learning classifiers for satellite observations—A review. Remote Sens. 2020, 12, 1135. [Google Scholar] [CrossRef]
  47. Abatzoglou, J.T.; Dobrowski, S.Z.; Parks, S.A.; Hegewisch, K.C. TerraClimate, a high-resolution global dataset of monthly climate and climatic water balance from 1958–2015. Sci. Data 2018, 5, 1–12. [Google Scholar] [CrossRef] [PubMed]
  48. Abdi, O. Climate-triggered insect defoliators and forest fires using multitemporal Landsat and TerraClimate data in NE Iran: An application of GEOBIA TreeNet and panel data analysis. Sensors 2019, 19, 3965. [Google Scholar] [CrossRef] [PubMed]
  49. Wang, C.; Qi, S.; Niu, Z.; Wang, J. Evaluating soil moisture status in China using the temperature–vegetation dryness index (TVDI). Can. J. Remote Sens. 2004, 30, 671–679. [Google Scholar] [CrossRef]
  50. Liu, Y.; Yue, H. The temperature vegetation dryness index (TVDI) based on Bi-parabolic NDVI-Ts space and gradient-based structural similarity (GSSIM) for long-term drought assessment across Shaanxi province, China (2000–2016). Remote Sens. 2018, 10, 959. [Google Scholar] [CrossRef]
  51. Hope, A.S.; Petzold, D.E.; Goward, S.N.; Ragan, R.M. Simulated relationships between spectral reflectance, thermal emissions, and evapotranspiration of a soybean canopy. J. Am. Water Resour. Assoc. 1986, 22, 1011–1019. [Google Scholar] [CrossRef]
  52. Nemani, R.R.; Running, S.W. Estimation of regional surface resistance to evapotranspiration from NDVI and thermal-IR AVHRR data. J. Appl. Meteorol. Climatol. 1989, 28, 276–284. [Google Scholar] [CrossRef]
  53. Carlson, T. An overview of the “triangle method” for estimating surface evapotranspiration and soil moisture from satellite imagery. Sensors 2007, 7, 1612–1629. [Google Scholar] [CrossRef]
  54. Xin, J.; Tian, G.; Liu, Q.; Chen, L. Combining vegetation index and remotely sensed temperature for estimation of soil moisture in China. Int. J. Remote Sens. 2006, 27, 2071–2075. [Google Scholar] [CrossRef]
  55. Du, L.; Song, N.; Liu, K.; Hou, J.; Hu, Y.; Zhu, Y.; Wang, X.; Wang, L.; Guo, Y. Comparison of two simulation methods of the temperature vegetation dryness index (TVDI) for drought monitoring in semi-arid regions of China. Remote Sens. 2017, 9, 177. [Google Scholar] [CrossRef]
  56. Idso, S.B.; Jackson, R.D.; Pinter, P.J., Jr.; Reginato, R.J.; Hatfield, J.L. Normalizing the stress-degree-day parameter for environmental variability. J. Agric. Meteorol. 1981, 24, 45–55. [Google Scholar] [CrossRef]
  57. Moran, M.S.; Clarke, T.R.; Inoue, Y.; Vidal, A. Estimating crop water deficit using the relation between surface-air temperature and spectral vegetation index. Remote Sens. Environ. 1994, 49, 246–263. [Google Scholar] [CrossRef]
  58. Paniagua, M.T.; Villalba, J.; Pasten, M. Spatial-temporal distribution of drought in the western region of Paraguay (2005–2017). In Proceedings of the 2020 IEEE Latin American GRSS & ISPRS Remote Sensing Conference (LAGIRS), Santiago, Chile, 22–26 March 2020; pp. 636–639. [Google Scholar]
  59. Yeh, H.-F.; Chang, C.-F. Using standardized groundwater index and standardized precipitation index to assess drought characteristics of the Kaoping River Basin, Taiwan. Water Resour. 2019, 46, 670–678. [Google Scholar]
  60. Yeh, H.F.; Lin, X.Y.; Huang, C.C.; Chen, H.Y. A Meteorological Drought Migration Model for Assessing the Spatiotemporal Paths of Drought in the Choushui River Alluvial Fan, Taiwan. Geosciences 2024, 14, 106. [Google Scholar] [CrossRef]
  61. Liu, Y.; Wu, L.; Yue, H. Biparabolic NDVI-Ts space and soil moisture remote sensing in an arid and semi arid area. Can. J. Remote Sens. 2015, 41, 159–169. [Google Scholar] [CrossRef]
  62. Geiger, R.; Aron, R.H.; Todhunter, P. The Climate near the Ground; Rowman & Littlefield: Lanham, MD, USA, 2009. [Google Scholar]
Figure 1. Geographic location of the Choushui River Alluvial Fan.
Environments 11 00233 g001
Figure 2. The Sentinel-2 satellite images were used to classify and map the land use and cover in the study area.
Environments 11 00233 g002
Figure 3. The satellite images from TerraClimate were used to classify and map the soil moisture in the study area from 2013 to 2022.
Environments 11 00233 g003
Figure 4. The parameters needed for calculating drought indices using remote sensing technology.
Environments 11 00233 g004
Figure 5. The scatter diagram and dry/wet edges of NDVI with LST in the dry/wet seasons.
Environments 11 00233 g005
Figure 6. The TVDI distribution over the Choushui River Alluvial Fan was mapped using Landsat 8 satellite images from 2013 to 2022.
Environments 11 00233 g006
Figure 7. The iTVDI distribution over the Choushui River Alluvial Fan was mapped using Landsat 8 satellite images from 2013 to 2022.
Environments 11 00233 g007
Figure 8. The differences in the distribution of TVDI and iTVDI over the Choushui River Alluvial Fan were mapped using Landsat 8 satellite images from 2013 to 2022.
Environments 11 00233 g008
Figure 9. The NDDI distribution over the Choushui River Alluvial Fan was mapped using Landsat 8 satellite images from 2013 to 2022.
Environments 11 00233 g009
Figure 10. The SPI analysis results from May 2013 to December 2022. SPI less than −1.5 indicates severe drought.
Environments 11 00233 g010
Figure 11. The correlation between TVDI, iTVDI, NDDI, and soil moisture in 2013 and 2019.
Environments 11 00233 g011
Figure 12. The correlation between iTVDI and drought indices in 2015.
Environments 11 00233 g012
Table 1. The Landsat 8 satellite image data selected for this study.
YearSeasonDate
2013Dry11/17, 12/3
Wet5/25, 6/26, 7/28, 10/16
2014Dry1/20, 2/21, 3/25, 4/10, 11/4, 11/20, 12/6, 12/22
Wet5/12, 9/1, 10/3, 10/19
2015Dry1/23, 2/24, 4/29, 11/7, 11/23
Wet7/18, 8/3, 9/20
2016Dry1/26, 3/30, 12/11
Wet7/4, 9/22, 10/24
2017Dry1/28, 2/13, 3/1, 4/2, 11/28, 12/14, 12/30
Wet5/4, 9/25, 10/11, 10/27
2018Dry1/15, 4/5, 11/15, 12/1, 12/17
Wet5/23, 10/14, 10/30
2019Dry1/18, 2/3, 4/8, 11/2
Wet7/13, 7/29, 10/17
2020Dry1/21, 2/6, 2/22, 3/9, 4/10, 11/20, 12/22
Wet8/16, 9/1, 10/3, 10/19
2021Dry3/12, 3/28, 4/13, 11/7, 12/9, 12/17
Wet5/15, 9/20, 10/6
2022Dry1/2, 1/10, 2/27, 3/15, 11/10, 11/18, 12/20, 12/28
Wet5/10, 8/22, 9/15, 9/22, 10/1
Disclaimer/Publisher’s Note: The statements, opinions and data contained in all publications are solely those of the individual author(s) and contributor(s) and not of MDPI and/or the editor(s). MDPI and/or the editor(s) disclaim responsibility for any injury to people or property resulting from any ideas, methods, instructions or products referred to in the content.

