Article

Assessment of Load Losses Caused by Harmonic Currents in Distribution Transformers Using the Transformer Loss Calculator Software

by
Vicente León-Martínez
,
Elisa Peñalvo-López
,
Joaquín Montañana-Romeu
*,
Clara Andrada-Monrós
and
Laura Molina-Cañamero
Electrical Engineering Department, Universitat Politècnica de València, Camino de Vera 14, 46022 Valencia, Spain
*
Author to whom correspondence should be addressed.
Environments 2023, 10(10), 177; https://doi.org/10.3390/environments10100177
Submission received: 28 July 2023 / Revised: 4 September 2023 / Accepted: 5 October 2023 / Published: 7 October 2023
(This article belongs to the Special Issue Deployment of Green Technologies for Sustainable Environment II)

Abstract

:
Transformer load losses cause various adverse effects, such as derating, a decreased lifetime, and greenhouse gas emissions. In this paper, the load losses caused by non-linear loads on distribution transformers are analyzed. For this study, the load loss expressions provided by the IEEE Standard C57.110 and ANSI/UL 1561-1562 were adapted to the usual case where the transformer currents differ in each phase. The novel load loss expressions adapted from the IEEE Standard C57.110 were applied using the software known as the “Transformer Loss Calculator” (TLC), implemented with LabVIEW. For the application of new load loss expressions, carbon dioxide (CO2) emissions were determined by multiplying the load losses by the emission factors of each country. The experimental results are based on the recordings made by a FLUKE 435 Series II analyzer on the second of two 1000 kVA transformers, feeding real residential distribution networks with very differently distorted loads. An analysis of these transformers shows that the annual energy losses and CO2 emissions obtained from the adapted load loss expressions could be more than 5% of those determined by the original IEEE and ANSI Standard expressions. Due to these percentage loss and emission differences, it is advisable to use the TLC software in transformer monitoring instruments.

1. Introduction

The growth of the demand for electrical energy in recent decades means that it is necessary to use increased numbers of transformers in electrical networks [1]. These static electrical machines are used to supply electrical power by adapting high-voltage (HV) supply voltages to the values required by customers’ Low-Voltage (LV) electrical installations.
However, transformers consume power. They suffer load losses [2] due to the circulation of currents through their windings, as well as core losses due to magnetic hysteresis and Eddy current phenomena. The latter losses are little affected by harmonics [3,4]. The losses are seen in the heat energy, resulting in the internal temperature of transformers being raised and leading to two important effects: The first is the deterioration of the transformer and a reduction in its lifetime [1,5,6,7,8,9]. The second effect is the impact of the load losses of the transformer on the environment, measured as carbon dioxide (CO2) emissions into the atmosphere [10,11,12]. These emissions are proportional to the energy consumed, that is, to the losses in the case of transformers, with the proportionality coefficient being the emission factor, provided by the grid managers of each country or region [13,14,15].
The presence of non-sinusoidal currents caused by non-linear loads further increases the load losses of the transformers compared to linear loads. Currently, non-linear loads have a large presence in power grids. Discharge lamps in street lighting and fluorescent lighting, as well as LED lamps, motor drivers, and welding devices, among other load electronic devices, are examples of non-linear loads. Likewise, the integration of renewable energies in the electrical network, as is the case with the implementation of solar energy, even in the domestic sphere, has increased the circulation of non-sinusoidal currents both in the lines and in the distribution transformers of LV networks. Based on the above, it can be inferred that the losses caused by non-sinusoidal currents in transformers are very important.
Furthermore, the losses caused by non-sinusoidal currents do not evolve in the same way as those produced by sinusoidal currents. The latter depend on the Root Mean Square (RMS) value of currents, while the losses caused by non-sinusoidal currents also depend on the frequency of the harmonics of these currents [16,17,18,19,20,21,22,23]. The IEEE Standard C57.110-2018 [24,25] establishes that, in the presence of non-sinusoidal currents, the load losses ( P L L ) of the transformers are the sum of three others:
P L L = P J L + P E C L + P O S L
Each of these losses is due to a different physical phenomenon. The first is the well-known Joule effect, which occurs due to the circulation of currents through the ohmic resistances of the primary and secondary windings. The losses caused by this phenomenon ( P J L ) are known as copper losses (or ohmic losses), and their values are proportional to the squares of the RMS values of the currents flowing through the windings. Winding Eddy Current Losses ( P E C L ) occur due to the skin and proximity phenomena [3] and depend on the squares of the RMS values of the currents and the frequencies of their harmonics. Other Stray Losses ( P O S L ) occur due to the Eddy currents induced by stray magnetic fluxes in the tank and other metallic parts of the transformer [3]. These losses are also dependent on the frequencies of the harmonics, but to a lesser extent than Winding Eddy Current Losses ( P E C L ). In dry-type transformers, as listed in the ANSI/UL Standard 1561-1562 [26,27], Other Stray Losses ( P O S L ) are considered to be negligible [19,26,27]. This consideration has also been extended to oil-immersed transformers in papers [16,17,22,28] and transformer manufacturers [29].
The expressions of the load losses were originally established by the IEEE Standard C57.110 and ANSI/UL 1561 and 1562 based on the assumption that the above phenomena affect the three phases of the transformer equally. All of the references we have consulted also make this assumption, even in applications where the transformer currents do not have the same RMS values and harmonic content in each phase, as determined by the Total Harmonic Distortion ( T H D i z % ) of each phase ( z = A , B , C ):
T H D i z % = h z = 2 h z , m a x I h z 2 h z = 1 h z , m a x I h z 2 · 100
where the order of the harmonic h z = f h z / f 1 is the ratio of the frequency of that harmonic ( f h z ) and the fundamental frequency ( f 1 = 50 60   H z ), h z , m a x is the order of the highest frequency harmonic used in the analysis, and I h z is the RMS value of the harmonic current of order h z and phase z .
However, the last two phenomena (Eddy currents and Other Stray Losses) are very dependent on the frequencies of the currents; therefore, the expressions of the load losses included in the IEEE and ANSI standards do not provide correct values in the usual case where the transformer currents are different in each phase.
To avoid these limitations, in this article, the expressions of load losses for three-phase transformers were developed, which are generally applicable, even when the currents are different in each phase of the transformer. This is the main novelty of this paper. These equations are established in Section 2 of this article (Materials and Methods) via the modification/adaptation of the original expressions included in the IEEE Standard C57.110-2018 [24] and ANSI/UL Standards 1561 and 1562 [26,27].
The Section 2 of this article also describes the operational sequence and source code of the “Transformer Loss Calculator” (TLC) software, which enables the values of transformer load losses to be determined according to the IEEE Standard C57.110, with the separation of the values corresponding to the fundamental (active, reactive, and unbalance) and non-fundamental (distortion) frequency currents, which were obtained by applying the Fourier Series and Fortescue’s theorem [30].
In the Section 3 of this article, we present the RMS values and the T H D i z % of the currents recorded using a FLUKE 435 Series II analyzer in the second of two real 1000 kVA distribution transformers, which feed two Low-Voltage (LV) residential areas, which are very differently distorted loads, located in the Valencian Community (Spain). These results are applied in the Section 4 of this article to obtain the amount of daily and annual losses of each transformer according to the new approach established in this paper and the original method, which is included in the Standard. The separation between the losses at fundamental and non-fundamental frequencies, provided by the TLC software, has allowed for conclusions to be drawn in this section regarding (1) the effects of harmonics, both in terms of the value of losses and CO2 emissions (measured in kg), and (2) the threshold in the value of T H D i z % , above which the use of harmonic filtering is feasible from the point of view of environmental improvement. In addition, the limitations of our novel approach are analyzed in this section.
The Section 5 of this article presents our conclusions.

2. Materials and Methods

This section describes the procedure used to determine the environmental impacts (measured in kg of CO2 emitted into the atmosphere) of the circulation of non-sinusoidal currents in the windings of three-phase distribution transformers.
This study is based on the fact that carbon dioxide emissions are proportional to the internal energy consumption (i.e., losses) of transformers. The proportionality factor is the emission factor (EF) of each region or country. The values of the losses caused by harmonic currents were obtained using the TLC software, which separately determines the values of the losses corresponding to the fundamental and non-fundamental frequency currents according to the IEEE Standard C57.110 [24]. A novelty of the TLC software is that the load loss expressions defined by the IEEE Standard C57.110 have been extended to the case in which the currents have different values and harmonic contents ( T H D i z % ) in each phase of the transformer windings. This is usually the case in distribution networks, so the TLC software is more useful than the direct application of the loss expressions included in the Standard.
The expressions of transformer load losses according to the ANSI standards are not implemented in the TLC software version 1. For this reason, in this section of the manuscript, we also establish the expressions for transformer load losses according to [26,27], adapted to the case in which the winding currents do not have the same RMS values and harmonic contents ( T H D i z % ) in each phase.

2.1. Transformer Load Losses Adapted from IEEE C57.110 and ANSI/UL 1561-1562 Standards

The expressions of the load losses of three-phase transformers are developed in this section by modifying the IEEE Standard C57.110-2018 [24] and ANSI/UL Standards 1561 and 1562 [26,27], and they are adapted to the case in which the non-sinusoidal currents flowing through their windings have different RMS values and harmonic contents ( T H D i z % ) in each phase.
The rated load losses ( P L L R ) of the transformers operating at the fundamental frequency (50–60 Hz) satisfy the following expression [24,25]:
P L L - R = P J L - R + P E C L - R + P O S L - R = P J L - R + P T S L - R
The composition of this equation is as follows:
  • P J L - R = 3 · R D C · I R 2 are the nominal cooper (Joule) losses, as a function of the ohmic short-circuit resistance of the transformer ( R D C ) and the RMS value of the secondary rated current ( I R );
  • P E C L - R are the Rated Winding Eddy Current Losses;
  • P O S L - R are the Rated Other Stray Losses;
  • P T S L - R = P E C L - R + P O S L - R are the Rated Total Stray Losses.
The manufacturers of the transformer provide the values of each of the losses indicated in Equation (3).

2.1.1. Load Losses Adapted from the IEEE Standard C57.110

As the novelty of this paper, the equations for transformer load losses based on the IEEE Standard C57.110-2018 [24] were modified and adapted to the usual case in which the secondary currents have different RMS values and T H D i z % in each phase ( z = A , B , C ), as follows:
P L L = z = A ; B ; C P L L z = z = A , B , C P J L z + P E C L z + P O S L z
where P J L z represents the ohmic losses, P E C L z represents the Winding Eddy Current Losses, and P O S L z represents the Other Stray Losses of each phase ( z = A , B , C ).
Due to the Joule effect, the total ohmic losses ( P J L ) in the transformer windings are obtained, under these conditions, using the following expression:
P J L = z = A , B , C P J L z = R D C z = A , B , C h z = 1 h z , m a x I h z 2 = 1 3   · P J L R z = A , B , C h z = 1 h z , m a x I h z I R 2
The composition of this equation is as follows:
  • R D C is the short-circuit ohmic resistance of the transformer, calculated when direct currents are flowing through the windings of the transformer;
  • I h z is the RMS value of the harmonic current of order h z = f h z / f 1 and phase z = A , B , C .
Under these conditions, the Total Winding Eddy Current Losses ( P E C L ) can be calculated as follows:
P E C L = z = A , B , C P E C L z = 1 3 · P E C L - R z = A , B , C F E C L z  
where P E C L - R is the Rated Winding Eddy Current Losses, and the factor
F E C L z = h z = 1 h z , m a x I h z 2 · h z 2 I R 2
is the ratio of the Winding Eddy Current Losses caused by the harmonics in one of the phases ( z = A , B , C ) and the nominal losses, without Eddy and Other Stray effects. I h z is the RMS value of the harmonic current of order h z = f h z / f 1 circulating through that phase, and h z , m a x is the order of the highest harmonic frequency considered in the calculation.
The Total Other Stray Losses ( P O S L ) with non-sinusoidal currents of different RMS values and T H D i z % in each phase of the transformer windings can be obtained as follows:
P O S L = z = A , B , C P O S L z = 1 3 · P O S L - R z = A , B , C F O S L z
where P O S L - R is the Rated Other Stray Losses, and the factor
F O S L z = h z = 1 h z , m a x I h z 2 · h z 0.8 I R 2
Is related to the Other Stray Losses caused by harmonics in the phases z = A , B , C to the nominal losses without Eddy and Other Stray effects. Likewise, I h z , h z = f h z / f 1 , and h z , m a x have the same meanings, as indicated above.
In the case where the manufacturer of the transformer provides the value of the Rated Total Stray Losses ( P T S L - R ) but the values of P E C L - R and P O S L - R are not known, the IEEE Standard C57.12.90 TM [31] recommends considering that P E C L - R = 0.33 · P T S L - R for oil-immersed transformers and P E C L - R = 0.66 · P T S L - R for dry-type transformers.

2.1.2. Load Losses Adapted from the ANSI/UL Std. 1561 and 1562

The ANSI/UL Standards 1561 and 1562 [26,27] consider Other Stray Losses ( P O S L ) to be negligible in dry-type transformers, meaning that they do not directly affect the heating and lifetime of these transformers [29]. For this reason, proceeding in the same way as in the previous section, the expressions of the total load losses ( P L L ) proposed by the ANSI standards have been adapted to the habitual case in which non-sinusoidal currents have a different RMS value and T H D i z % in each phase and are calculated as the sum of the ohmic losses ( P J L z ) and the Winding Eddy Current Losses ( P J L z ) of each phase ( z = A , B , C ), as follows:
P L L = z = A ; B ; C P L L z = z = A , B , C P J L z + P E C L z
where, due to the Joule effect, the total ohmic losses ( P J L ) can be obtained using Equation (4), and the Winding Eddy Current Losses ( P E C L ) can be calculated as follows:
P E C L = z = A , B , C P E C L z = 1 3 · P E C L - R z = A , B , C K F z
where P E C L - R is the Rated Winding Eddy Current Losses, and the factor
K F z = h z = 1 h z , m a x h z 2 · I h z I R 2 ,  
is defined for each phase ( z = A , B , C ) and coincides in value with F E C L z .

2.2. Transformer Loss Calculator Software

This section describes the operational sequence and source code of the Transformer Loss Calculator (TLC) software version 1, which was implemented with the LabVIEW platform (2015 version). LabVIEW software is used in numerous applications, such as in medical, chemical, and electrical disciplines, as well as others [32,33,34,35,36,37,38,39].

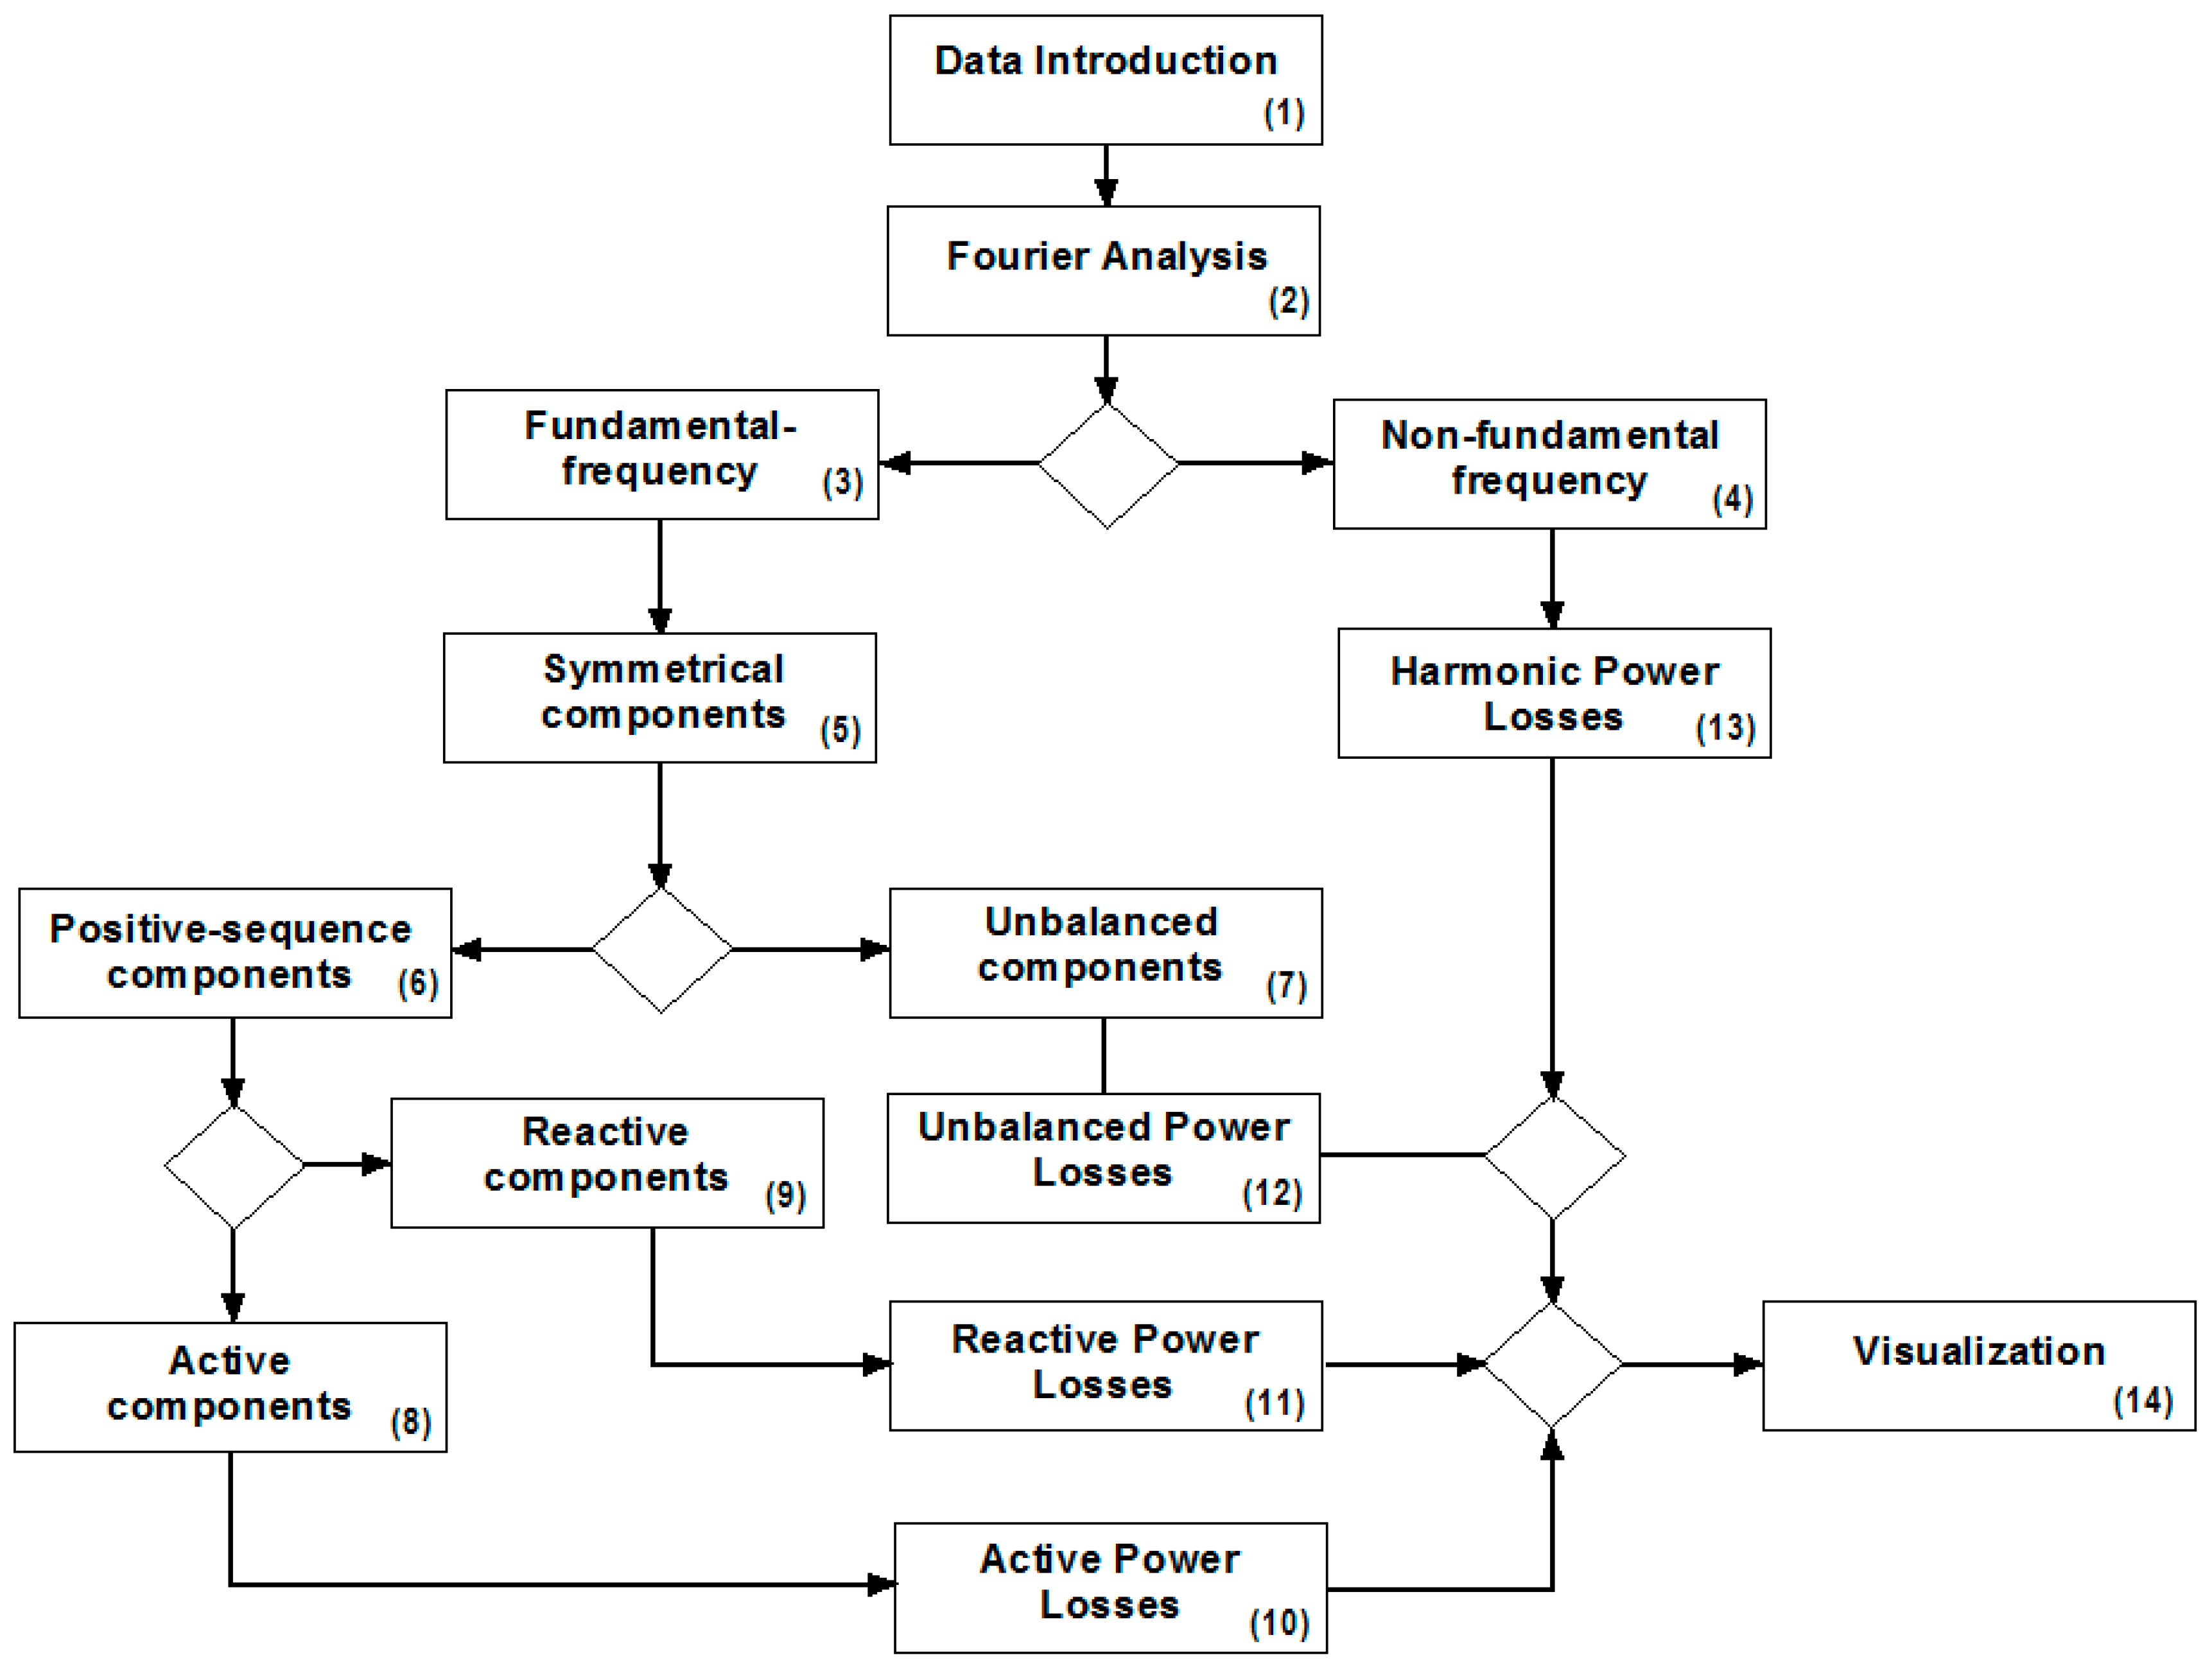
2.2.1. Operational Sequence of the TLC Software

The operational sequence of the TLC software version 1 depicted in Figure 1 comprises the following steps:
Stage (1). Data input, either of the signals (voltages and currents) recorded on each phase of the secondary transformer by means of a physical measurement system or, alternatively, by the manual input of voltage and current values. In the first case, the software is used for the analysis of real transformers. In the second case, the software is used for simulation analysis. The rated values of the transformer are also entered in this step.
Stage (2). Fourier analysis of the signals introduced in stage (1).
Stages (3) and (4). Obtaining the Complex Root Mean Square (CRMS) values of the fundamental frequency (50 Hz) and non-fundamental frequency (up to 10,150 Hz) voltages and currents.
Stage (5). Application of Fortescue’s Theorem to fundamental frequency voltages and currents.
Stage (6). Obtaining the CRMS values of the components of the fundamental frequency positive-sequence voltages and currents.
Stage (7). Determination of the CRMS values of the unbalanced voltage and current components.
Stage (8). Calculation of the CRMS values of the active currents, positive sequence, and fundamental frequency.
Stage (9). Obtaining the CRMS values of the reactive currents, those being the positive-sequence and fundamental frequency currents.
Stages (10), (11), (12), and (13). Determination of transformer load losses corresponding to fundamental (active, reactive, and imbalance) and non-fundamental frequency currents.
Stage (14). Display on a screen the absolute and relative values (in %) of the total load losses of the transformer and individual values corresponding to each of the current components.

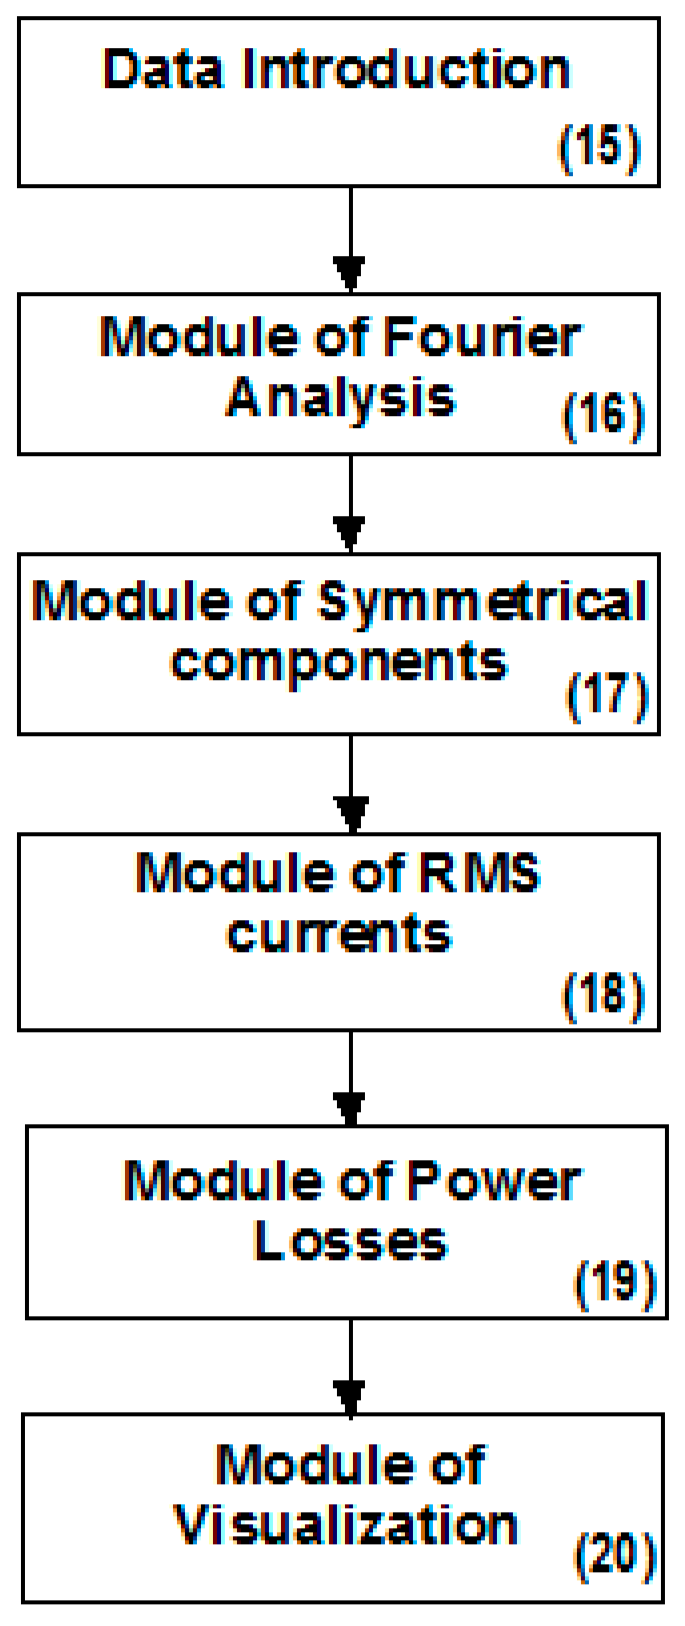
2.2.2. Programing Modules of TLC Software

The TLC software was developed in a programming module (Figure 2). We used the programming language indicated in Figure 3, which comprises the following stages:
Stage (15): Data Input. At this stage, the samples of voltages and currents recorded in each secondary phase of the transformer using a physical measurement system are incorporated, or the CRMS values of these quantities are manually entered, in order to carry out analysis via simulation. In addition, the values of the transformer rated power ( S R ), load losses ( P J L - R and P T S L - R ), and no-load secondary line-to-line voltages ( V s 0 ) are entered manually.
With the values entered at this stage, the nominal secondary current is obtained as follows:
I R = S R 3 V s 0
Stage (16): Fourier Analysis. At this stage, the CRMS values of the transformer line-to-neutral voltages and line currents of fundamental ( V ¯ 1 z ,   I ¯ 1 z ) and non-fundamental ( V ¯ h z ,   I ¯ h z ) frequencies are obtained for each secondary phase ( z = A , B , C ). These values can be displayed on the software’s screen (Figure 4) or transferred to Excel.
Stage (17): Symmetrical Components. Fortescue’s theorem is applied at this stage to the fundamental frequency voltages and currents obtained in the previous stage to determine the CRMS values of the fundamental frequency positive-sequence secondary line-to-neutral voltages ( V ¯ + ) and line currents ( I ¯ + ) as follows:
V ¯ + = 1 3 V ¯ A 1 + a V ¯ B 1 + a 2 V ¯ C 1 = V + α +   I ¯ + = 1 3 I ¯ A 1 + a I ¯ B 1 + a 2 I ¯ C 1 = I + α + φ +
with a = 1 120 ° as well as the CRMS values of the unbalanced line-to-neutral voltages ( V ¯ A u ,   V ¯ B u ,   V ¯ C u ) and currents ( I ¯ A u ,   I ¯ B u ,   I ¯ C u ) of each phase of the transformer secondary,
V ¯ A u = V ¯ 1 A V ¯ +   V ¯ B u = V ¯ 1 B a 2 V ¯ +   V ¯ C u = V ¯ 1 C a V ¯ +  
I ¯ A u = I ¯ 1 A I ¯ +   I ¯ B u = I ¯ 1 B a 2 I ¯ +   I ¯ C u = I ¯ 1 C a I ¯ +  
Stage (18): RMS Currents. At this stage, the following RMS values of the transformer secondary currents and its components are calculated as follows:
  • Secondary current ( I ):
    I = z = A , B , C I z 2 = z = A , B , C h z = 1 h z , m a x I h z 2  
  • Fundamental frequency current ( I 1 ) and its components active ( I a ), reactive ( I r ), and unbalanced ( I u ):
    I 1 = I 1 A 2 + I 1 B 2 + I 1 C 2 = 3 · I a 2 + I r 2 + I u 2   I a = I + · cos φ +   I r = I + · sin φ +   I u = I A u 2 + I B u 2 + I C u 2
  • Non-fundamental frequency current ( I H ):
    I H = z = A , B , C h z = 2 h z , m a x I h z 2  
Stage (19): Power Losses. The total load losses, as well as those caused by each of the secondary current components, are obtained at this stage. They are obtained in accordance with the expressions adapted from the IEEE Standard C57.110-2018, as seen in Section 2.1, as follows:
  • Total load losses:
    P L L = 1 3 z = A , B , C h z = 1 h z , m a x P J L - R + P E C L - R · h z 2 + P O S L - R · h z 0.8 · I h z I R 2
The terms corresponding to the fundamental frequency harmonics ( h z = 1 ) in Equation (20) represent the transformer fundamental frequency load losses, which have three components:
P L L 1 = 1 3 · P J L - R + P E C L - R + P O S L - R · I 1 I R 2 = P J L - R + P E C L - R + P O S L - R · I a I R 2 + P J L - R + P E C L - R + P O S L - R · I r I R 2 + 1 3   P J L - R + P E C L - R + P O S L - R · I u I R 2 = P L L a + P L L r + P L L u
  • Losses due to active currents ( P L L a ),
    P L L a = P J L - R + P E C L - R + P O S L - R · I a I R 2
  • Losses due to reactive currents ( P L L r ),
    P L L r = P J L - R + P E C L - R + P O S L - R · I r I R 2
  • Losses due to unbalanced currents ( P L L u ),
    P L L u = 1 3 · P J L R + P E C L R + P O S L R · I u I R 2
The load losses due to harmonics ( P L L H ) are the fourth summand of (20):
P L L H = 1 3 z = A , B , C h = 2 h m a x P J L R + P E C L R · h z 2 + P O S L R · h z 0.8 · I h z I R 2  
The relative values of the load losses are also determined at this stage, in %, caused by active currents ( ε a % ), reactive currents ( ε r % ), unbalanced currents ( ε u % ), and harmonic currents ( ε H % ), such as
ε a % = P L L a P L L · 100   ε r % = P L L r P L L · 100   ε u % = P L L u P L L · 100   ε H % = P L L H P L L · 100
Step (20): Visualization. The RMS values of the currents, as well as the absolute and relative values of the load losses that these currents produce in the transformers, are displayed on a screen of the TLC software for visualization.

2.2.3. Load Losses Adapted from Standard ANSI/UL Standard 1561/1562

The TLC software operates with the load loss expression adapted from the IEEE Standard C57.110-2018. However, we also planned to incorporate the ANSI/UL Standards 1561 and 1562. In this section, based on what is indicated in Section 2.1.2, the equations that provide the load losses of dry-type and oil-immersed three-phase transformers are established when feeding non-linear loads of different values and non-linearity in each phase.
The load losses caused by the circulation of the currents of different RMS values and harmonic contents through the windings of three-phase transformers can be expressed, according to (10), as follows:
P L L = 1 3   z = A , B , C h z = 1 h z , m a x P J L R + h z 2 · P E C L R I h z I R 2  
The losses originated at the fundamental frequency ( h z = 1 ) are
P L L 1 = 1 3   P J L R + P E C L R I 1 I R 2
where I 1 is the RMS value of the secondary currents of the fundamental frequency, determined by Equation (18), and I R is the transformer nominal secondary current, defined by Equation (13). These losses can be decomposed into active, reactive, and unbalanced losses, in a similar way to what was achieved in Equation (21).
The load losses caused by harmonic currents are expressed, according to the ANSI/UL Standards 1561 and 1562, as follows:
P L L H = 1 3   z = A , B , C h z = 2 h z , m a x P J L R + h z 2 · P E C L R I h z I R 2
Although the ANSI/UL Standards 1561 and 1562 refer to dry-type transformers, where Other Stray Losses ( P O S L ) have practically no effect on winding losses, in our opinion, the last three equations could also be applied to the calculation of load losses in oil-immersed transformers. In Section 4, we will outline that the values obtained with Equations (27)–(29) are close to those obtained with the IEEE Standard C57.110-2018 equations.

3. Results

The expressions of the load losses of the feeding loads of three-phase transformers of different values and non-linearity in each phase, developed in Section 2.2.2 and Section 2.2.3, are applied in this section to determine the daily and annual load losses and CO2 emissions of two oil-immersed Dyn11 distribution transformers when they supply the Low-Voltage (LV) installations of two very differently distorted residential areas. They were obtained from the manufacturer, ORMAZABAL, and their nominal characteristics are outlined in Table 1.
  • The first zone, supplied by transformer 1, is eminently residential, made up of dwellings, and has values of T H D i z % , which are not too high in each phase ( z = A , B , C );
  • The second zone, supplied by transformer 2, is also residential but has shops, with cold stores, LED, and discharge lighting, as well as small industrial companies, with high values of T H D i z % in each phase.
The RMS values and harmonic contents of the secondary line currents of both transformers were recorded using a FLUKE 435 Series II network analyzer between the months of October and November 2022.

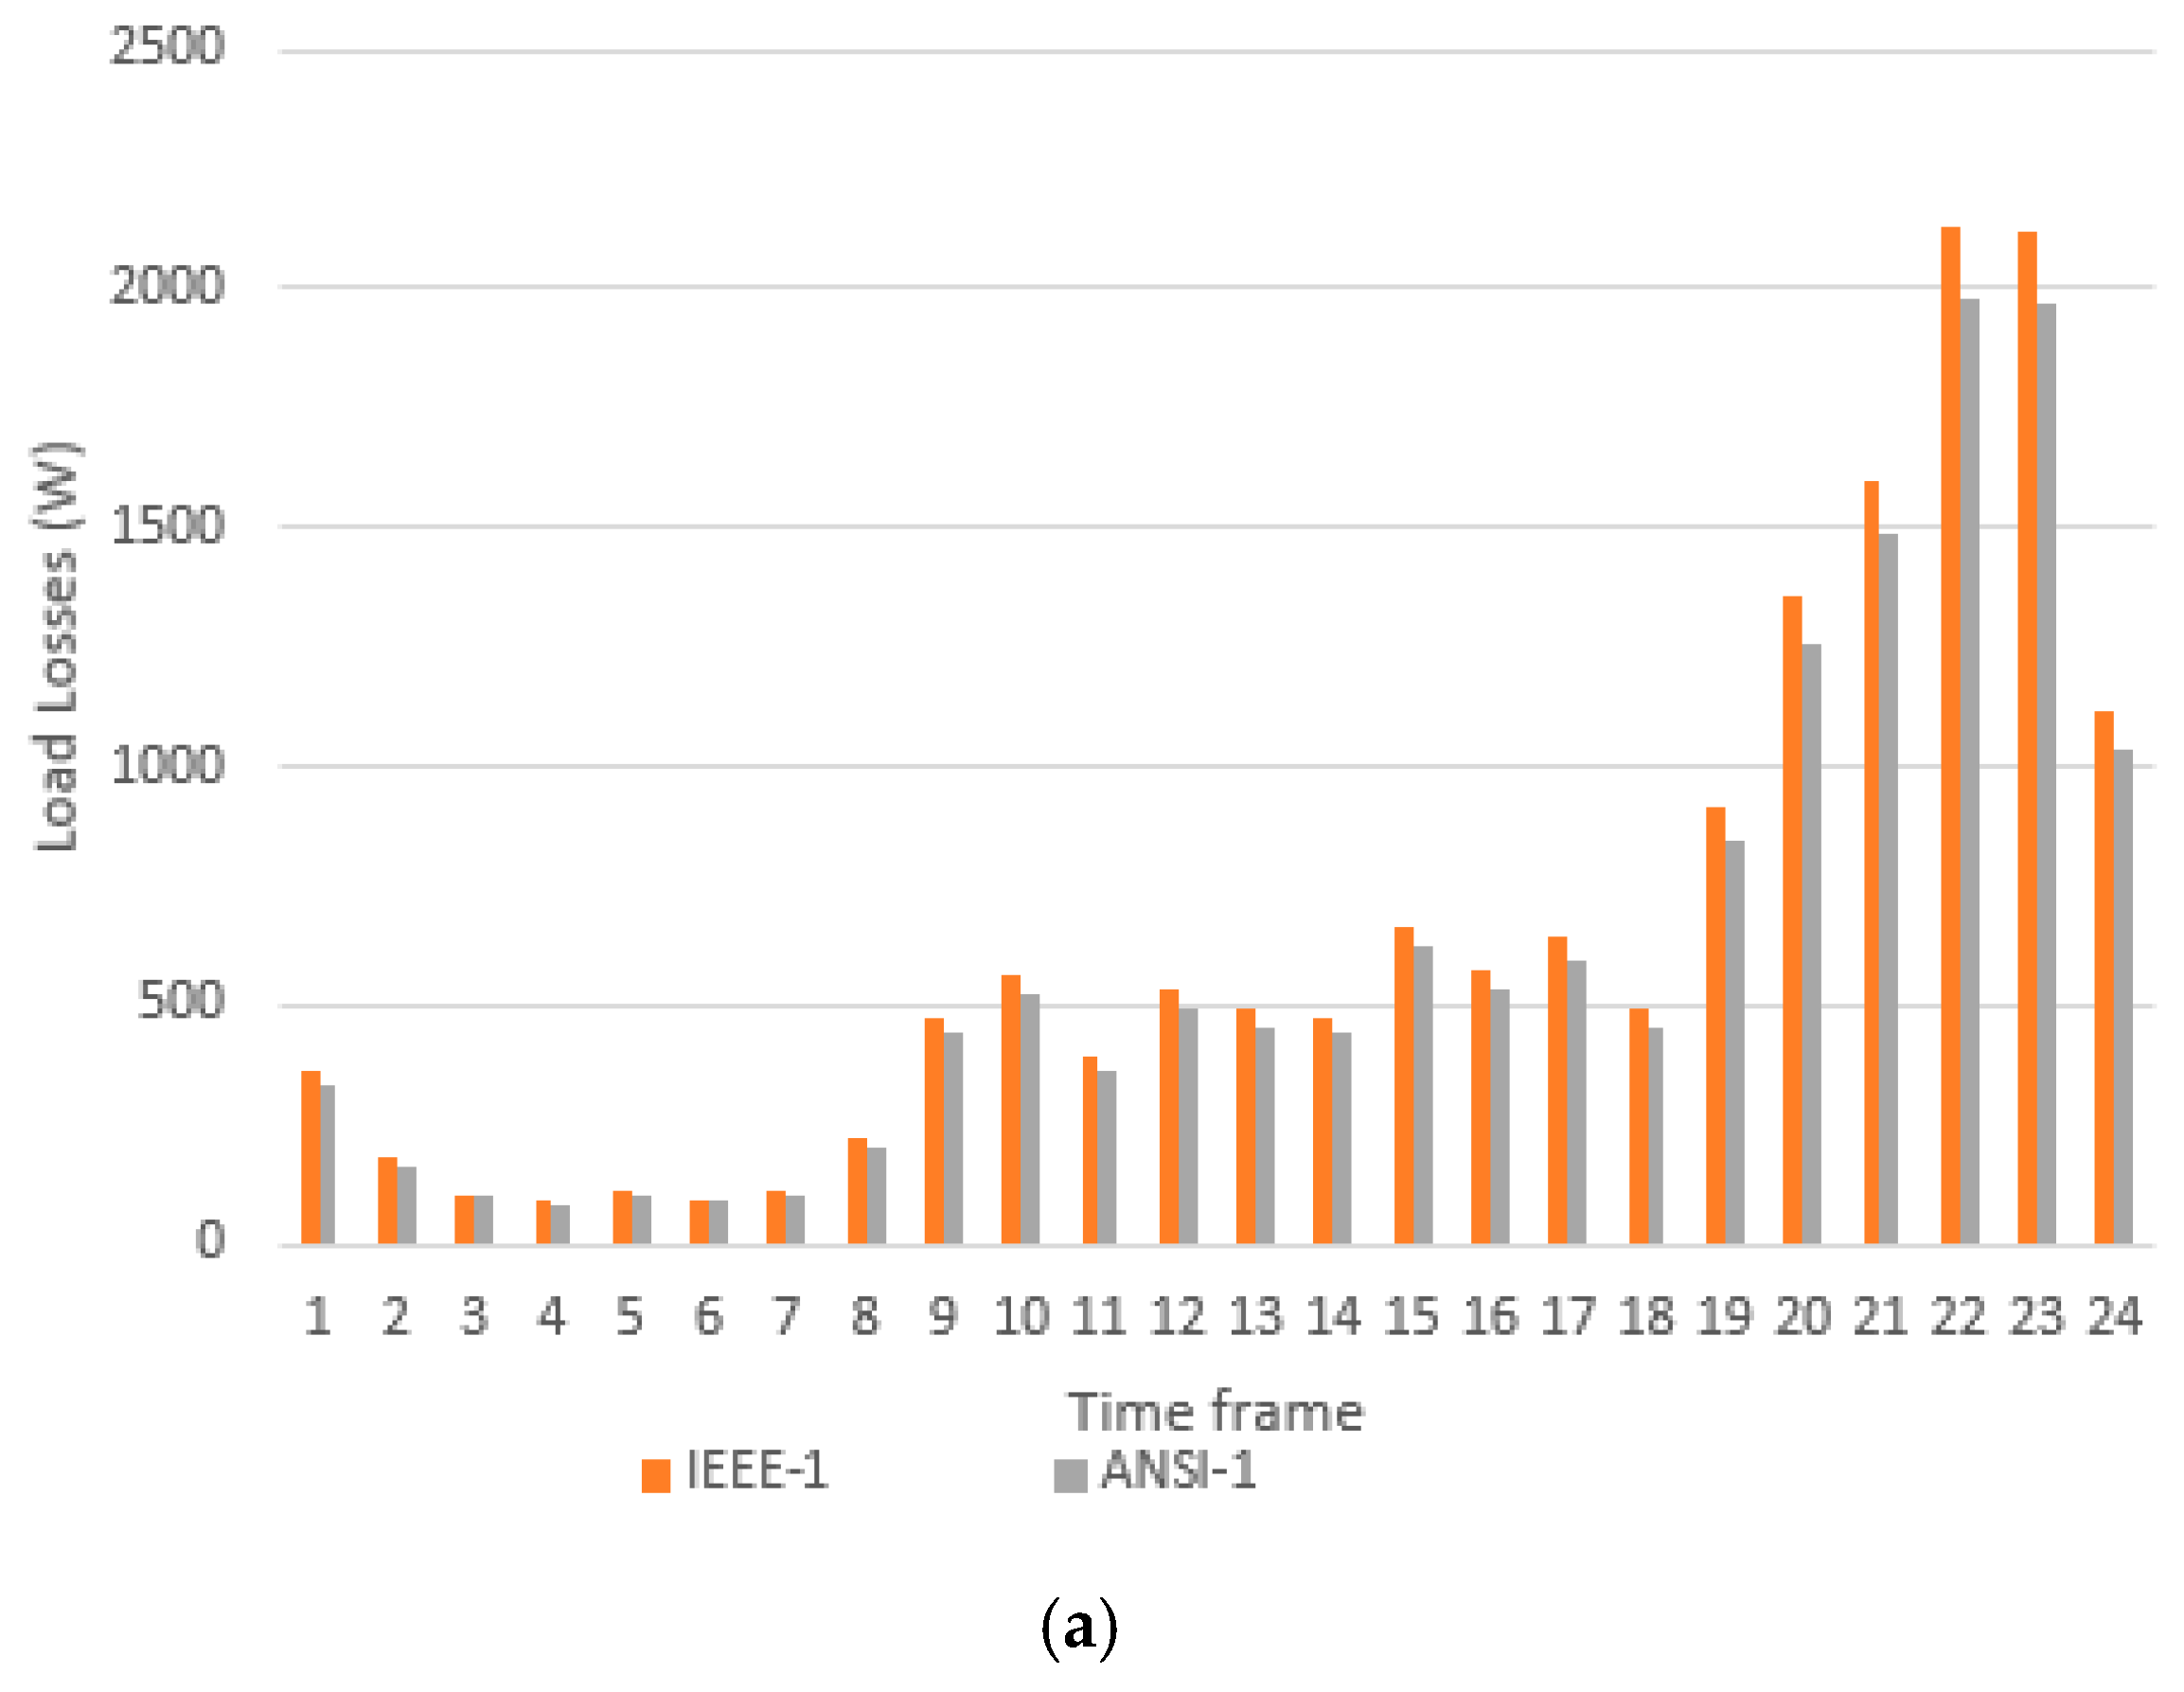
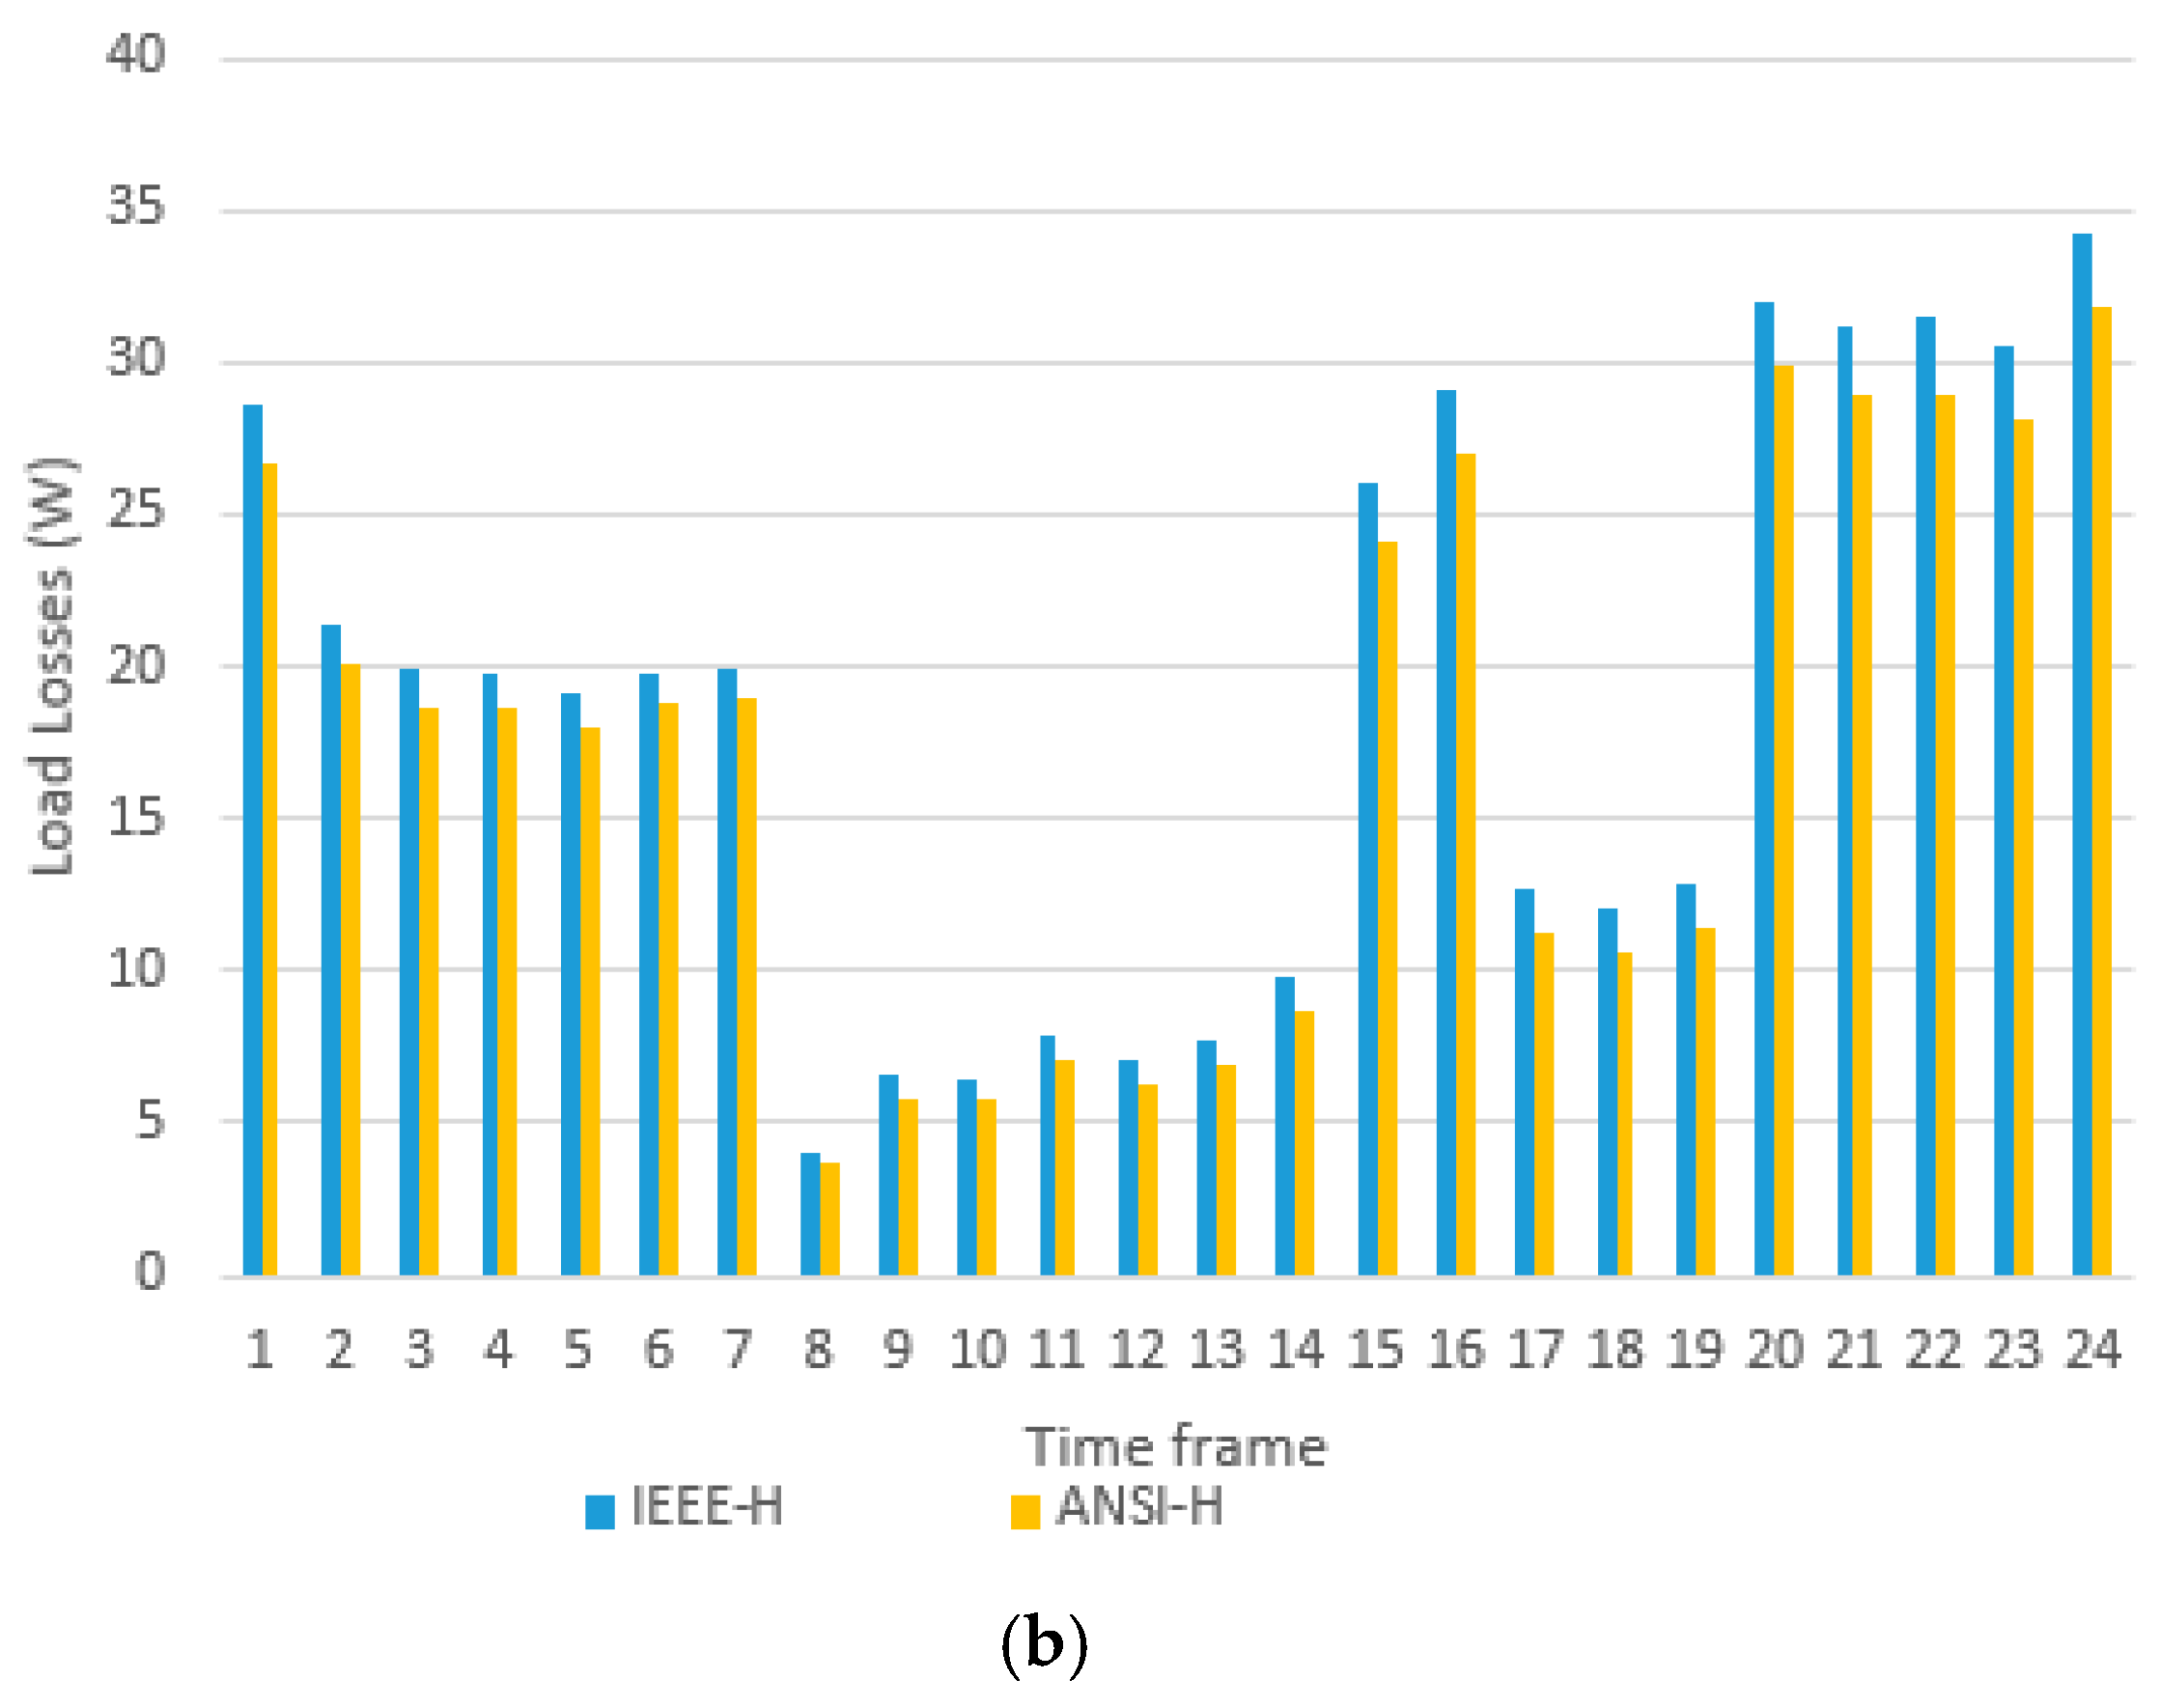
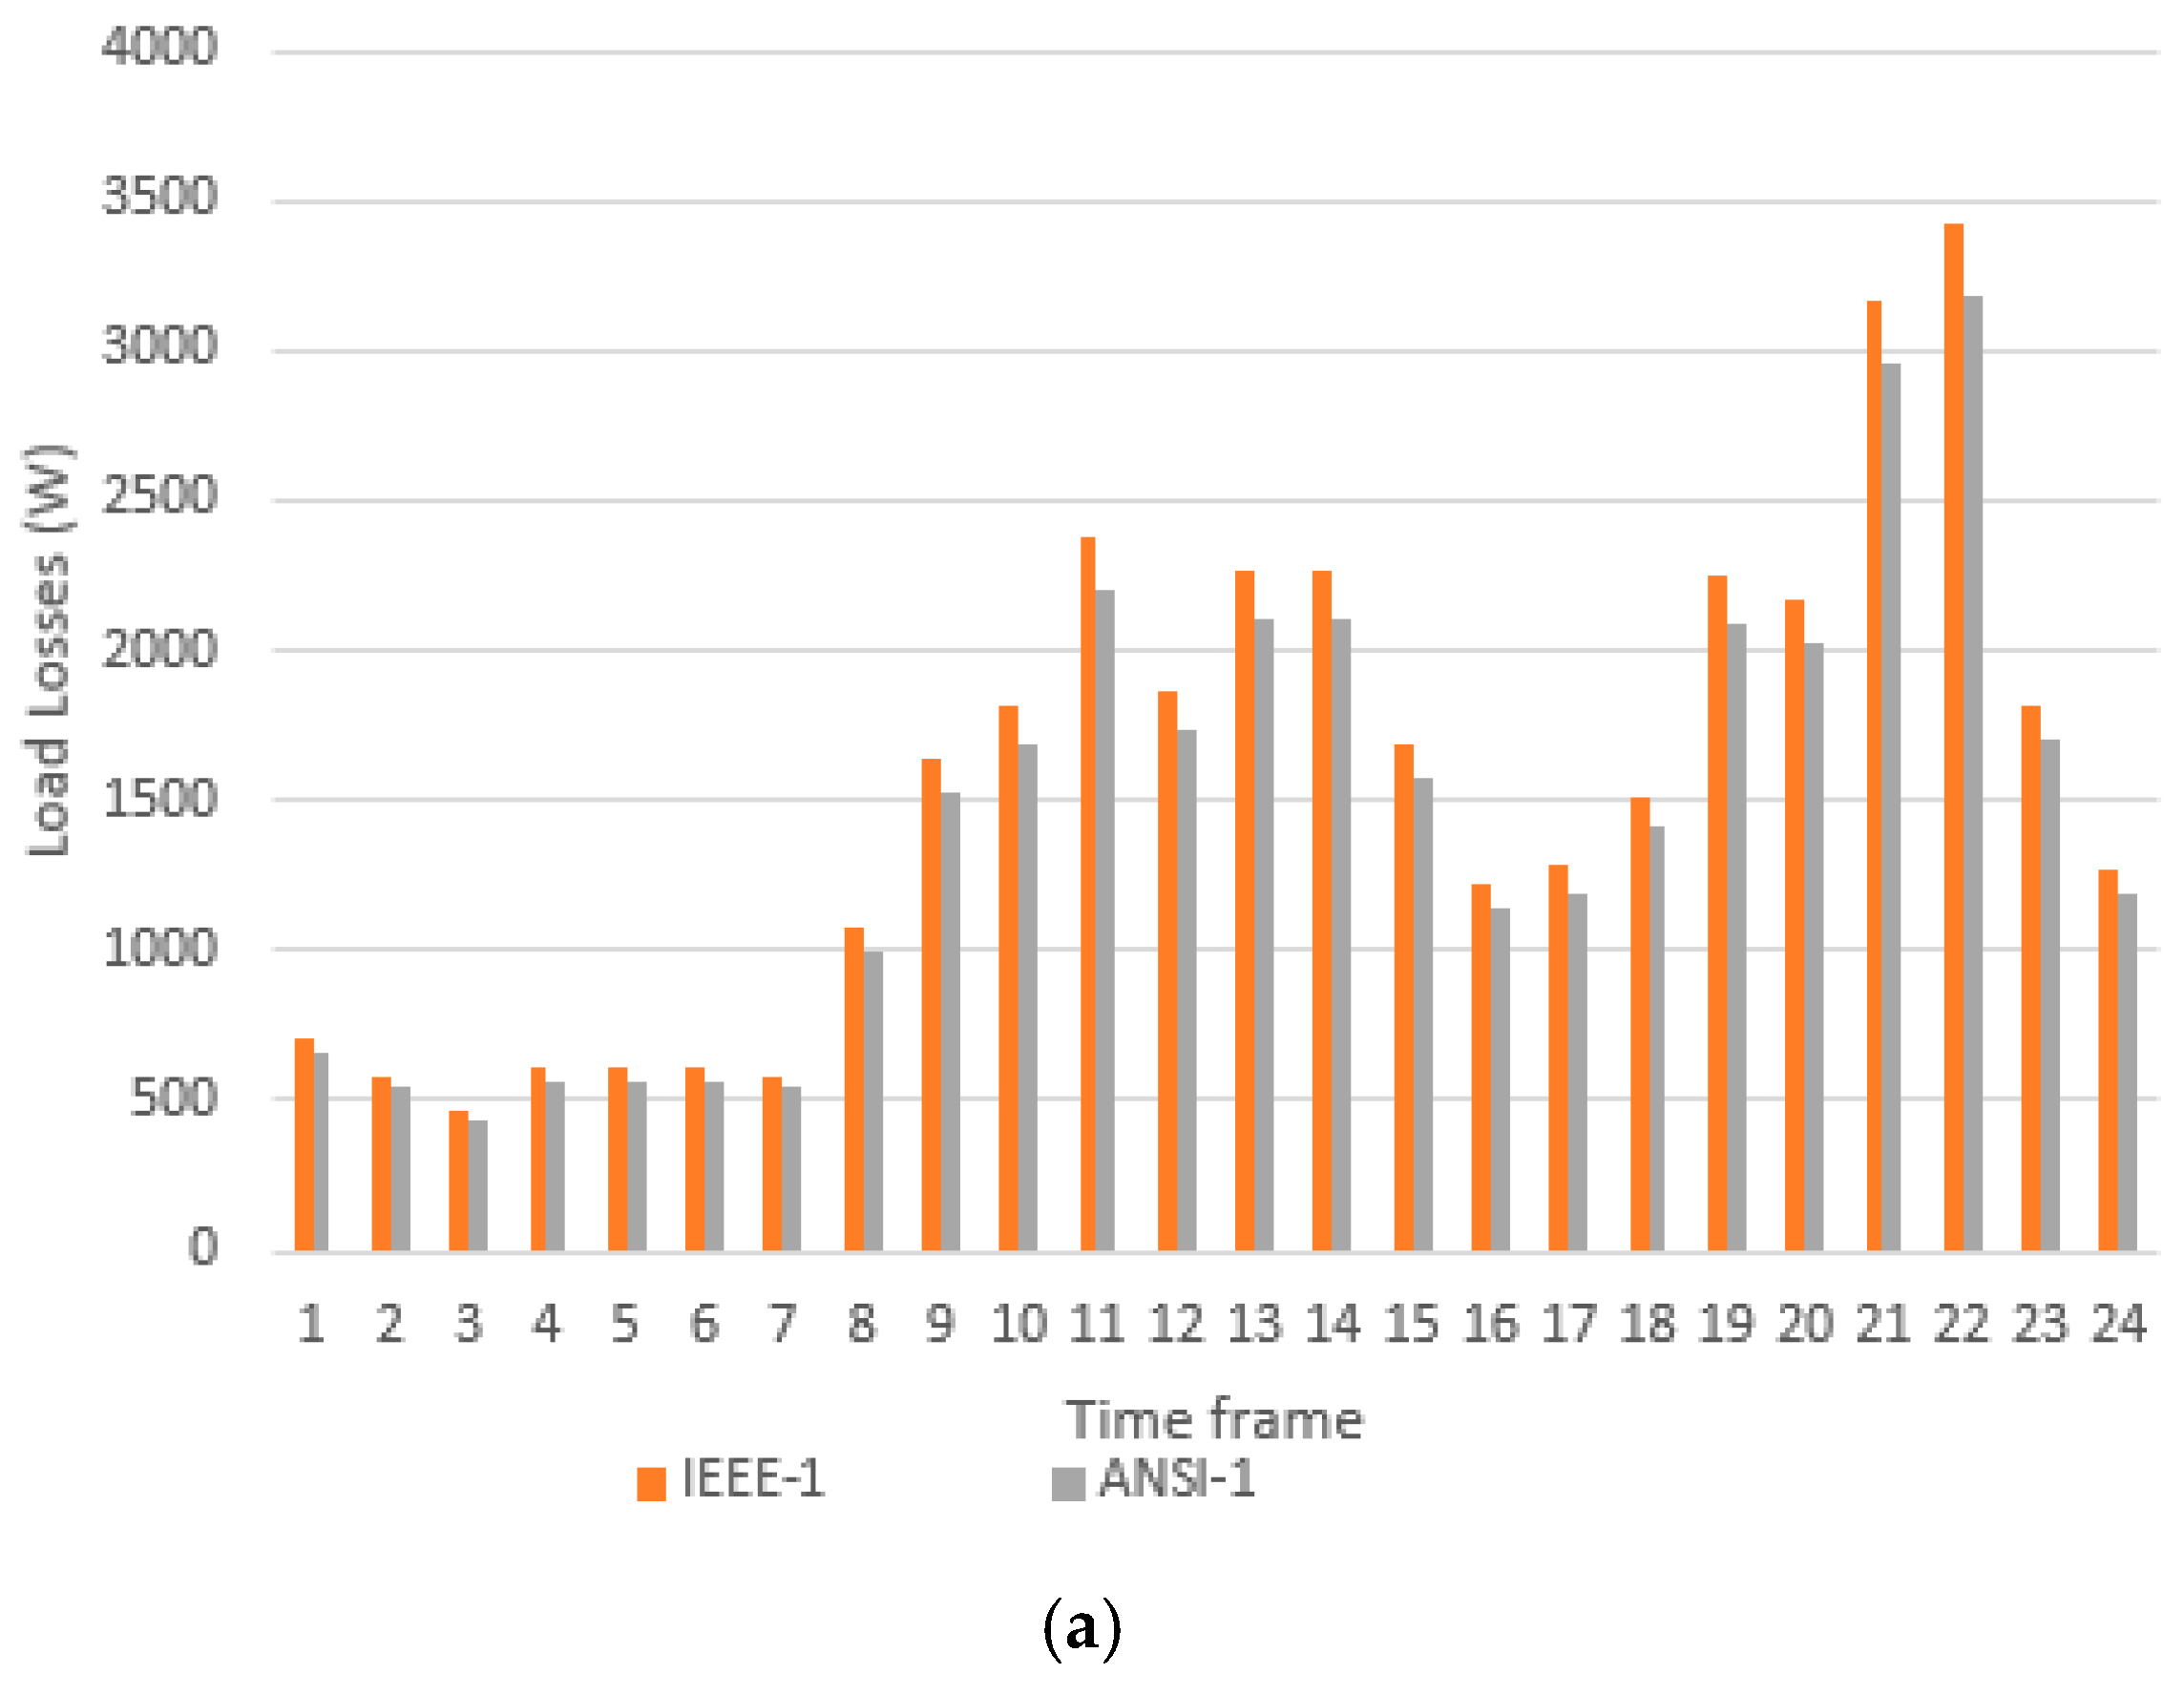
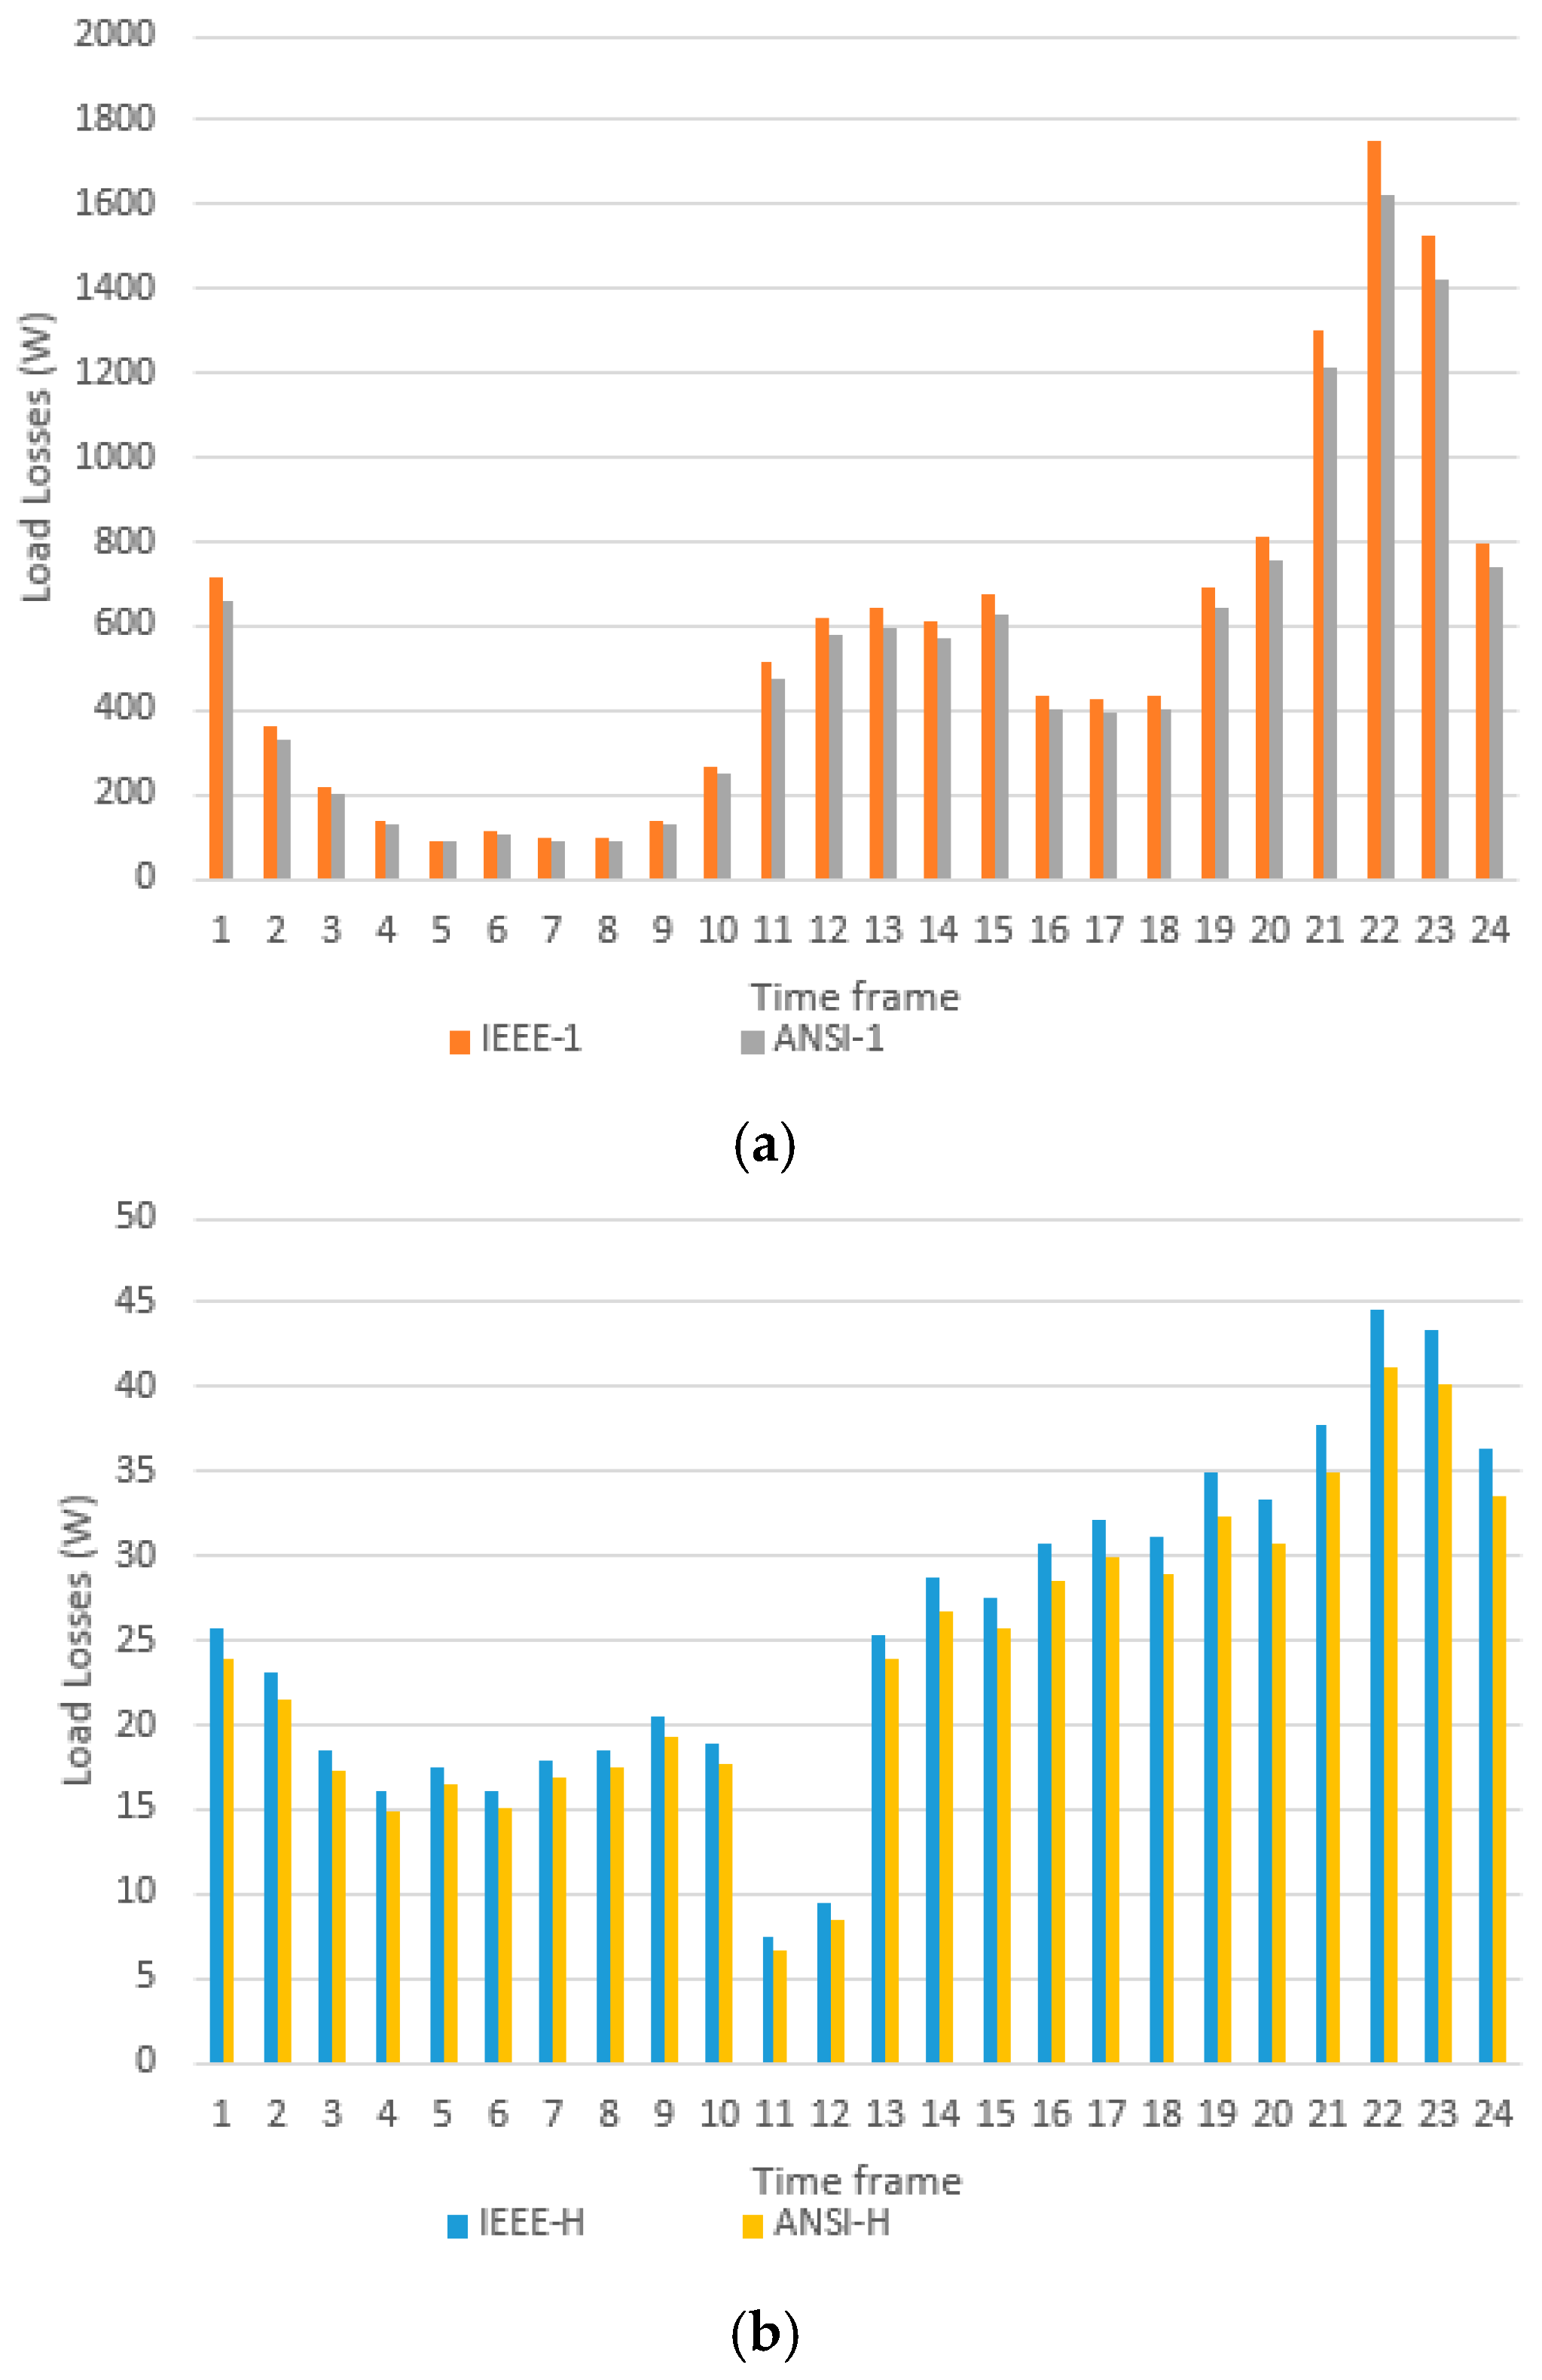
3.1. Losses and Daily CO2 Emissions in Transformer 1

Table 2 shows the RMS values of the fundamental frequency line currents, as well as the T H D i z % values of these currents registered by the FLUKE analyzer in each phase ( z = A , B , C ), of the secondary transformer 1 at one-hour intervals throughout the day of 13 November 2022 (a public holiday).
Figure 5a,b show the waveforms and the harmonic diagram of the currents at 14:24 h. These currents are slightly distorted.
Figure 6a,b show the values of transformer 1’s load losses, which were obtained every hour on 13 November 2022 for the first 25 harmonic currents, adapting the IEEE Standard C57.110 (IEEE-1, IEEE-H) and the ANSI/UL Standards 1561-1562 (ANSI-1, ANSI-H). The differences between the values of the losses, according to both standards (IEEE and ANSI), shown in Figure 6a,b, are the Other Stray Losses ( P O S L ).
Table 3 summarizes the RMS values of the fundamental frequency currents and the T H D i z % values of the line currents recorded using the FLUKE analyzer in each phase ( z = A , B , C ) of secondary transformer 1 at one-hour intervals throughout the day of 14 November 2022 (working day).
The waveforms and harmonic diagram of the currents at 16:02 h are represented in Figure 7a,b, respectively. Here, it can be seen that the currents supplied by transformer 1 to these installations on working days are also slightly distorted.
The values of the load losses in transformer 1, calculated throughout the day of 14 November 2022 for the fundamental frequency currents and the first 24 harmonics of non-fundamental frequency (harmonic currents), adapting the IEEE Standard C57.110 (IEEE-1, IEEE-H) and ANSI/UL Standard 1561-1562 (ANSI-1, ANSI-H), are shown in Figure 8a,b.

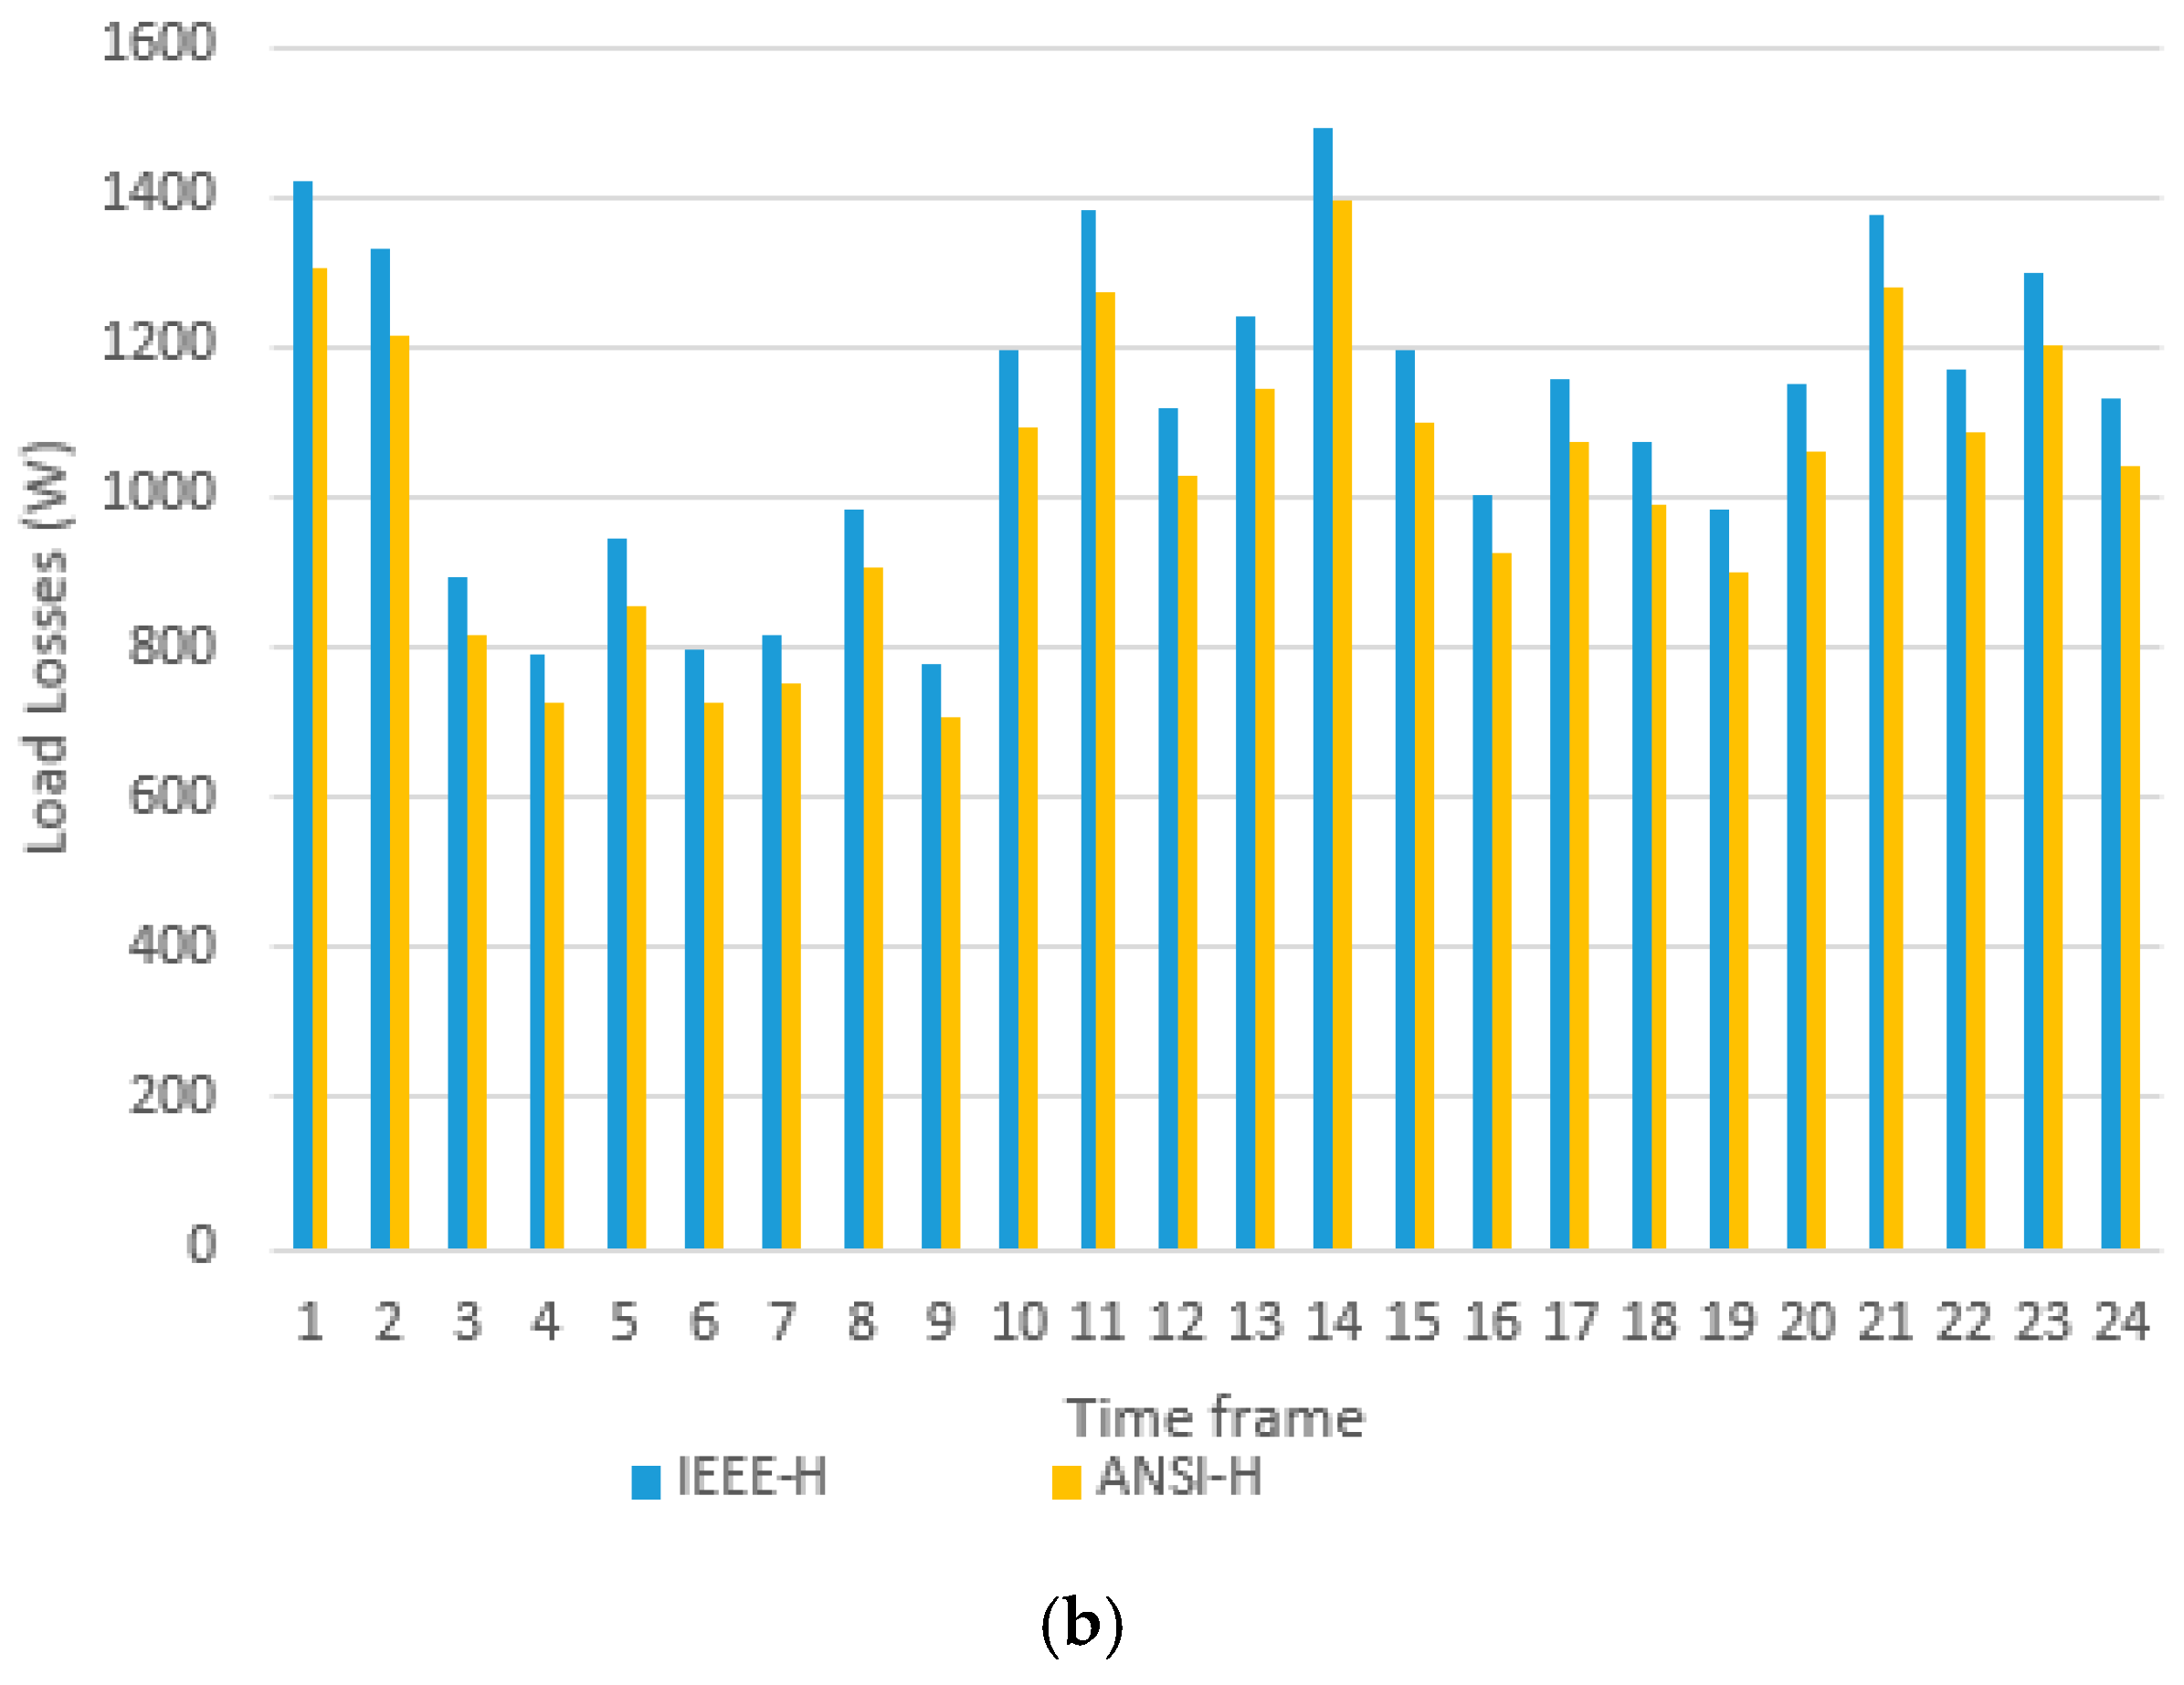
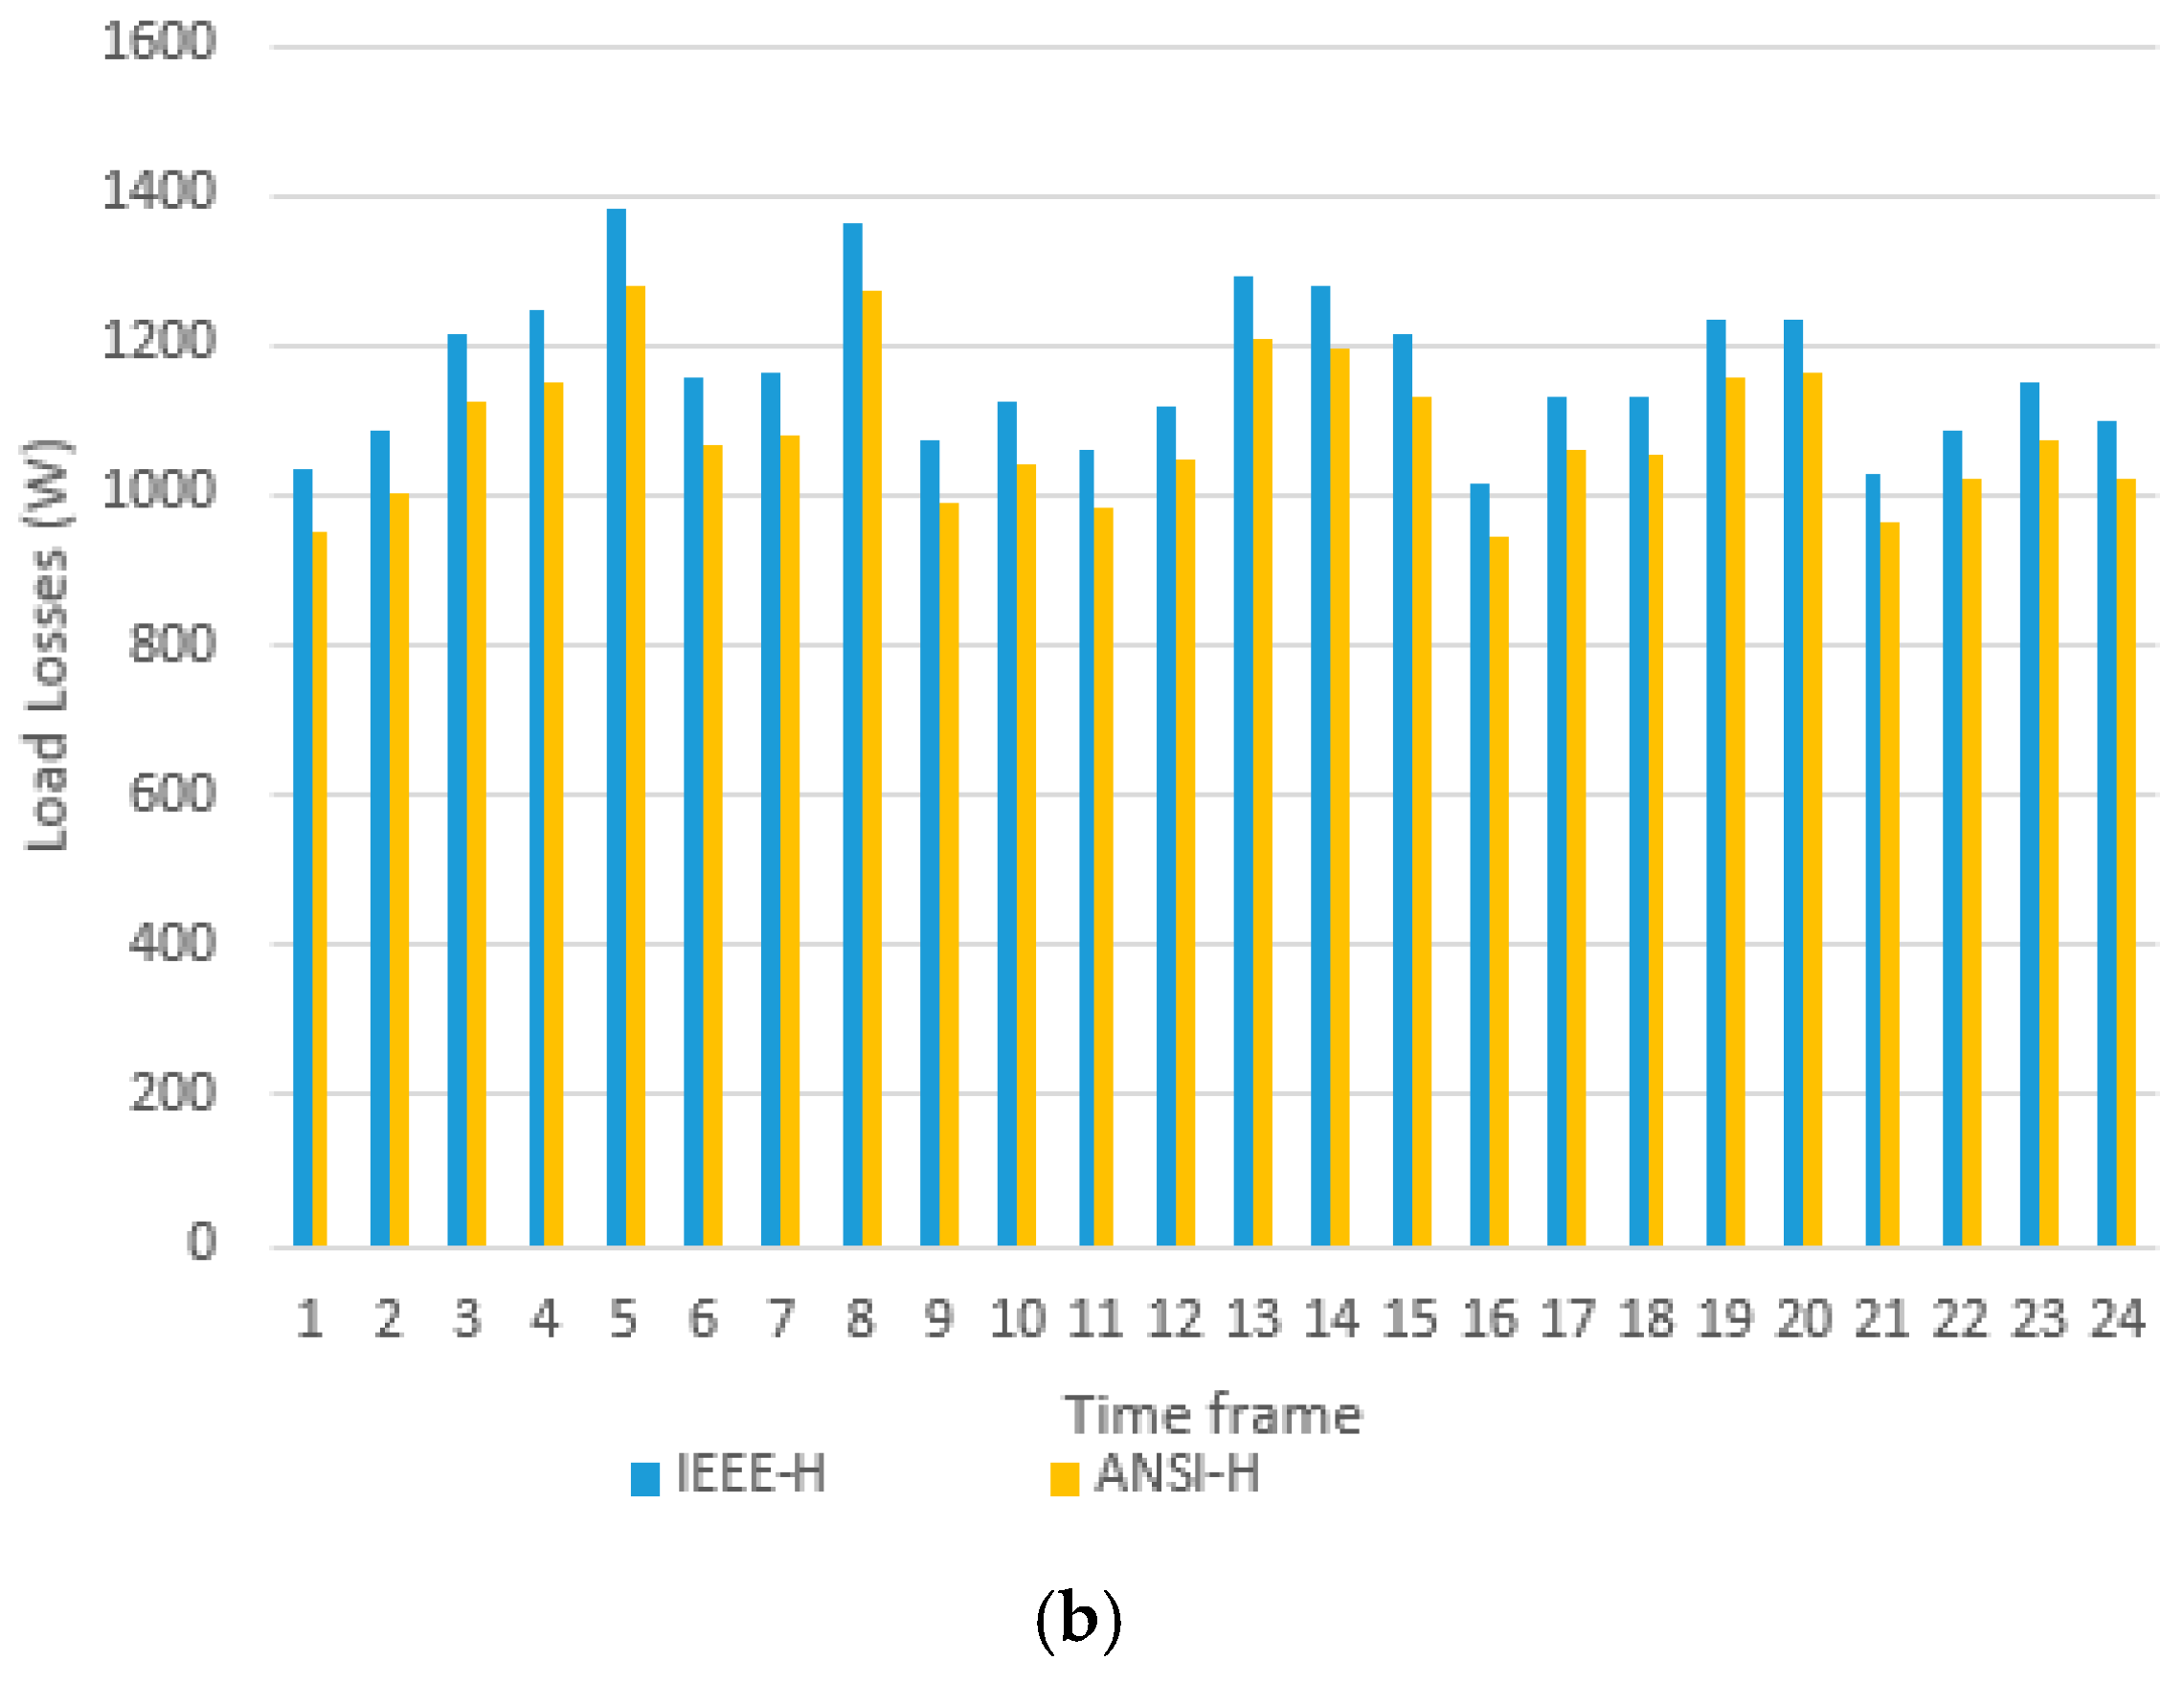
3.2. Losses and Daily CO2 Emissions from Transformer 2

The RMS values of the fundamental frequency currents recorded on 9 October 2022 (a public holiday) in each phase ( z = A , B , C ) of secondary transformer 2, as well as the T H D i z % values, are summarized in Table 4.
Figure 9a,b show, respectively, the waveform and the harmonic diagram of the A-phase secondary current of transformer 2 at 2:00 on 9 October 2022. It can be observed from these figures that these currents are strongly distorted.
Figure 10a,b show the values of losses in transformer 2 throughout 9 October 2022 (a public holiday) for the fundamental frequency currents and the first 24 harmonics of non-fundamental frequency, adapting the IEEE Standard C57.110 and ANSI/UL Standard 1651-1562.
Table 5 summarizes the RMS values of the fundamental frequency and the T H D i z % values of the currents registered in each phase of secondary transformer 2 throughout 10 October 2022 (working day).
The waveform and harmonic diagram of the current of phase A of transformer 2, recorded at 11:00 on 10 October 2022, are represented in Figure 11a,b. It can be seen in these figures that the currents continue to be highly distorted on weekdays.
The values of the load losses calculated in transformer 2 throughout 10 October 2022 (working day) for the fundamental frequency currents and the first 24 harmonics of non-fundamental frequency are represented in Figure 12a,b, adapting the IEEE Standard C57.110 and ANSI/UL Standard 1561-1562.

4. Discussion

In the previous section, the values of the load losses of two distribution transformers supplying residential facilities in a town near the city of Valencia (Spain) were presented. The losses were obtained on working days and holidays by entering the measurements recorded using the FLUKE 435 Series II analyzer in the TLC software, whose algorithms use expressions for load losses according to the IEEE Standard C57.110, but this was adapted to the usual case where the currents have different RMS values and T H D i z % in each phase. Likewise, in this paper, the load losses were also calculated according to the ANSI/UL Standards 1561 and 1562, adapting the expressions of this standard, as indicated in Section 2.2.3.
Although both installations are residential, there are important differences in terms of the linearity of the loads in each of them. Practically all of the installations powered by transformer 1 are residential, the loads are evenly distributed among the three phases, and the supplied currents have a very low harmonic content, with a T H D i z % value of around 10% during central hours on weekdays and holidays (Table 2 and Table 3). The installations powered by transformer 2 are mainly residential, but there is also a significant number of shops and small industries whose loads introduce high harmonic contents, meaning there are currents with a T H D i z % greater than 70% at many times on weekdays and public holidays (Table 4 and Table 5). The loads connected to transformer 2 are not evenly distributed, with phase C being the most heavily loaded and with the lowest harmonic content. It can also be seen that currents with a higher T H D i z % occur the smaller the supplies of transformer 2 are, which is a symptom of the presence of important non-linear loads that are permanently connected in phases A and B to that transformer.
Table 6 summarizes the values of the energy losses obtained in transformer 1 on 13 November (public holiday) and 14 (working days), and in transformer 2 on 9 October (public holiday) and 10 (working day) of 2022, using the adapted and original load loss expressions for the standards. The values for the original load loss expressions were obtained using the average RMS values of the currents in the three phases. It can be seen in Table 6 that there is not a proportional relationship between the distortion rate of the currents ( T H D i z % ) and the losses they produce in the transformers. Thus, the losses in transformer 1, due to the harmonics, are barely 4.3% of the total, even though the average distortion rate of the currents in that transformer ( T H D i z % ) is around 20%. In contrast, the losses due to harmonics in transformer 2, with average distortion rates of 40–50%, are comparable to the losses caused by fundamental frequency currents (Table 6).
The differences between the daily energy losses obtained according to the adapted IEEE C57.110 and ANSI/UL 1561-1562 standards constitute the Other Stray Losses. From the values indicated in Table 6, it can be seen that the Other Stray Losses in transformer 1 occur mainly at the fundamental frequency.
In Table 7 are summarized the lost energies in transformers 1 and 2 during 2022, considering that in that year there were 248 working days and 117 public holidays (with Saturdays and Sundays included as public holidays). The values of CO2 emissions, in kg, produced by these transformers in 2022 (Table 8), were obtained by multiplying the energy losses indicated in Table 7 by the emission factor, which is 0.154 kg CO2 /kWh consumed in the Valencian Community [13].
As seen in Table 7 and Table 8, using adapted expressions for the load losses developed in this paper, it is verified that the elimination of harmonic currents, by using suitable harmonic filters, could reduce the losses by 183.68 kWh and reduce the CO2 emissions by 28.29 kg (3.2% of the total) in transformer 1 in 2022, of which only 13.56 kWh and 2.09 kg of CO2 emissions correspond to the Other Stray Losses (0.24% of the total). In transformer 2, with high current distortion rates, the reduction in losses and CO2 emissions could be significant, at 10,053.18 kWh and 1548.19 kg (45.11% of the total), respectively, although only 726.91 kWh and 111.95 kg would be due to Other Stray Losses (3.26% of the total).
From Table 7 and Table 8, it can also be noted that, in the case of transformer 2, the total energy losses and CO2 emissions obtained annually from the adapted load loss expressions is 5.92% greater than that obtained according to the original expressions for the Standard IEEE C57.110 (5.55% for the ANSI/UL Standards 1561-1562).
However, our approach, like that used by the standards, has limitations. There are small differences between the loss values obtained with our approach and the actual transformer losses derived from the measurement procedure. To obtain the real value of the losses in the transformers, it is necessary to use two wattmeters: one arranged in the primary and the other in the secondary. The actual load losses would be obtained by subtracting the no-load losses from the difference between the active powers measured by the wattmeters in the primary and secondary transformers. This measurement procedure is accurate but more laborious and expensive to implement, especially when installing the wattmeter on the high-voltage side.
Like that used by the standards, our approach is based on measuring only one of the transformer windings. With this, we are making an approximation, since the effects of the circulation of vacuum currents through the primary coils have been neglected. As the vacuum currents are mainly of a fundamental frequency and their effective values do not usually change during the operation of the transformers, the maximum error that can be made in the measurement of the losses with the use of the TLC software can be estimated based on the square of the quotient between the RMS value of the no-load current and the RMS value of the nominal current of the transformer (at the nominal frequency) multiplied by 100. The manufacturers provide the value of this quotient. The load loss maximum errors determined in the 1000 kVA distribution transformers analyzed in the practical part of this article, when using our approach, would be less than 0.011%; therefore, the limitations regarding the use of the new expressions of the losses established in the article can be dismissed.

5. Conclusions

Transformers are important vectors in energy waste and CO2 emissions in electrical networks. These effects are aggravated when these machines feed non-linear loads. For this reason, new expressions have been established in this article to calculate the load losses of three-phase transformers obtained by the modification/adaptation of the original expressions included in the EEE Standard C57.110-2018 and ANSI/UL Standards 1561 and 1562. The limitations of these new expressions, derived from the fact that the calculation of the losses is carried out based on only one winding current of the transformer and not on both at the same time, as that would be more exact, can be neglected due to the minor errors introduced in the value of the losses (less than 0.011% in 1000 kVA transformers).
The novel expressions of the load losses obtained by adapting the original IEEE Standard C57.110 have been implemented using the TLC calculation version 1 software. Comparisons between the annual values of energy losses obtained with this software and those resulting from the direct application of the IEEE standard have determined differences of up to 5.92% in favor of the former. This shows that it is advisable to incorporate the TLC software in monitoring instruments to operate three-phase transformers.
The study of load losses and CO2 emissions carried out on real transformers supplying residential areas with Low-Voltage distribution networks has revealed the following:
  • The values of losses and CO2 emissions obtained according to the IEEE C57.110 standard are always higher than those calculated using the ANSI/UL Standards 1651 and 1562 because the latter standards do not include the effects of Other Stray Losses. However, the differences between the results of those standards are not too large; they are less than 7%, even with a high T H D i z % .
  • The current distortion rates ( T H D i z % ), between 10 and 20%, cause only very slight load losses and CO2 emissions, which are less than 5% of the total.
  • The current distortion rates ( T H D i z % ) of 40–60% produce high losses and CO2 emissions, which can be higher than 40% of the total.
Thus,   T H D i z % can be used as a helpful parameter to inform the necessity of using harmonic filters to improve sustainability, reducing losses and CO2 emissions from transformers.
Finally, in the future, we intend to improve the TLC software and provide information about other parameters that affect the aging and derating of transformers.

Author Contributions

Conceptualization, V.L.-M. and E.P.-L.; methodology, V.L.-M., E.P.-L. and C.A.-M.; software, V.L.-M. and J.M.-R.; validation, E.P.-L., C.A.-M. and L.M.-C.; formal analysis, V.L.-M., E.P.-L. and J.M.-R.; investigation, V.L.-M., E.P.-L. and C.A.-M.; resources, V.L.-M., E.P.-L. and L.M.-C.; data curation, V.L.-M. and J.M.-R.; writing—original draft preparation, V.L.-M.; writing—review and editing, V.L.-M. and E.P.-L.; visualization, V.L.-M. and L.M.-C.; supervision, V.L.-M. and E.P.-L.; project administration, V.L.-M.; funding acquisition, E.P.-L. All authors have read and agreed to the published version of the manuscript.

Funding

This research and APC was funded by GENERA Project (grant number 101077073) under the LIFE Programme of the EUROPEAN COMMISSION, and the Generalitat Valenciana within the ValREM Project (CIAICO/2022/007).

Conflicts of Interest

The authors declare no conflict of interest. The funders had no role in the design of the study; in the collection, analyses, or interpretation of the data; in the writing of the manuscript; or in the decision to publish the results.

References

  1. U4E. Accelerating the Global Adoption of Energy-Efficient Transformers; UN Environment, Economy Division, Energy & Climate; Branch: Paris, France, 2017. [Google Scholar]
  2. Biryulin, V.I.; Gorlov, A.N.; Larin, O.M.; Kudelina, D.V. Calculation of power losses in the transformer substation. In Proceedings of the 13th International Scientific-Technical Conference on Actual Problems of Electronics Instrument Engineering (APEIE), Novosibirsk, Russia, 3–6 October 2016. [Google Scholar] [CrossRef]
  3. Mahrous, A.T.; Salah, K.; Ziad, M.A. K-Factor and transformer losses calculations under harmonics. In Proceedings of the 2016 Eighteenth International Middle East Power Systems Conference (MEPCON), Cairo, Egypt, 27–29 December 2016. [Google Scholar] [CrossRef]
  4. Contreras-Ramirez, D.; Lata-García, J. K-Factor Analysis to Increase the Actual Capacity of Electrical Distribution Transformers. In Springer Communication, Smart Technologies and Innovation for Society; Springer: Singapore, 2021; pp. 367–379. [Google Scholar] [CrossRef]
  5. Elmoudi, A.; Lehtonen, M.; Nordman, H. Effect of harmonics on transformers loss of life. In Proceedings of the 2006 IEEE International Symposium on Electrical Insulation, Toronto, ON, Canada, 11–14 June 2006. [Google Scholar] [CrossRef]
  6. Gouda, O.E.; Amer, G.M.; Salem, W.A.A. Predicting transformer temperature rise and loss of life in the presence of harmonic load currents. Ain Shams Eng. J. 2012, 3, 113–121. [Google Scholar] [CrossRef]
  7. Godina, R.; Rodrigues, E.M.G.; Matias, J.C.O.; Catalão, J.P.S. Effect of Loads and Other Key Factors on Oil-Transformer Aging: Sustainability Benefits and Challenges. Energies 2015, 8, 12147–12186. [Google Scholar] [CrossRef]
  8. Mushtaq, I.H. Improving the cooling performance of electrical distribution transformer using transformer oil—Based MEPCM suspension. Eng. Sci. Technol. 2017, 20, 502–510. [Google Scholar] [CrossRef]
  9. Mikhak-Beyranvand, M.; Faiz, J.; Rezaeealam, B. Thermal analysis and derating of a power transformer with harmonic loads. IET Gener. Transm. Distrib. 2020, 14, 1233–1241. [Google Scholar] [CrossRef]
  10. European Cooper Institute. Coppers Contribution to a Low Carbon Future. A Plan to Decarbonize Europe by 25 Percent. 2018. Available online: https://copperalliance.sk/uploads/2018/05/coppers-contribution-to-a-low-carbon-future-a-plan-to-decarbonise-europe-by-25-percent.pdf (accessed on 1 March 2022).
  11. León-Martínez, V.; Andrada-Monrós, C.; Molina-Cañamero, L.; Cano-Martínez, J.; Peñalvo-López, E. Decarbonization of Distribution Transformers Based on Current Reduction: Economic and Environmental Impacts. Energies 2021, 21, 7207. [Google Scholar] [CrossRef]
  12. León-Martínez, V.; Peñalvo-López, E.; Andrada-Monrós, C.; Cano-Martínez, J.; León-Vinet, A.; Molina-Cañamero, L. Procedure for Improving the Energy, Environmental and Economic Sustainability of Transformation Houses. Appl. Sci. 2022, 9, 4204. [Google Scholar] [CrossRef]
  13. Energy Data from the Valencian Community; Valencian Energy Institute (IVACE), Sustainable Economy Valencian Community Ministry: Valencia, Spain, 2020. (In Spanish)
  14. IEA. Emission Factors 2022. International Energy Agency (IEA). Available online: https://www.iea.org/data-and-statistics/data-product/emissions-factors-2022 (accessed on 1 March 2022).
  15. EPA. Greenhouse Gas Equivalences Calculator; US Environmental Protection Agency: Washington, DC, USA, 2023. Available online: https//www.energy-and-the-environment/greenhouse-gas-equivalency-calculator (accessed on 29 August 2023).
  16. Thango, B.A.; Jordan, J.A.; Nnachi, A.F. A Novel Approach for Evaluating Eddy Current Loss in Wind Turbine Generator Step-Up Transformers. Adv. Sci. Technol. Eng. Syst. 2021, 6, 488–498. [Google Scholar] [CrossRef]
  17. Thango, B.A.; Akuru, U.B.; Nnachi, A.F. Corrected Estimation of the Transformer Winding Eddy Losses for Utility-Scale Solar Photovoltaic Plant Application. In Proceedings of the 2021 International Conference on Electrical, Computer and Energy Technologies (ICECET), Cape Town, South Africa, 9–10 December 2021. [Google Scholar] [CrossRef]
  18. Jakus, D.; Vasilj, J.; Čađenović, R.; Sarajčev, P. Optimising the transformer substation topology in order to minimise annual energy losses. IET Gener. Transm. Distrib. 2018, 12, 1323–1330. [Google Scholar] [CrossRef]
  19. Alame, D.; Azzouz, M.; Kar, N.C. Impact Assessment of Electric Vehicle Charging on Distribution Transformers Including State-of-Charge. In Proceedings of the 2018 IEEE 61st International Midwest Symposium on Circuits and Systems (MWSCAS), Windsor, ON, Canada, 5–8 August 2018. [Google Scholar] [CrossRef]
  20. Yaghoobi, J.; Alduraibi, A.; Martin, D.; Zare, F.; Eghbal, D.; Memisevic, R. Impact of high-frequency harmonics (0–9 kHz) generated by grid-connected inverters on distribution transformers. Int. J. Electr. Power Energy Syst. 2020, 122, 106177. [Google Scholar] [CrossRef]
  21. Megahed, T.F.; Kotb, M.F. Improved design of LED lamp circuit to enhance distribution transformer capability based on a comparative study of various standards. Energy Rep. 2022, 8, 445–465. [Google Scholar] [CrossRef]
  22. Chen, H.; Huang, Y.; Hu, H.; Wang, J.; Wang, W. Analysis of the influence of voltage harmonics on the maximum load capacity of the power supply transformer for the LHCD system. In Proceedings of the 2023 IEEE 6th International Electrical and Energy Conference (CIEEC), Hefei, China, 12–14 May 2023. [Google Scholar] [CrossRef]
  23. Sima, L.; Miteva, N.; Dagan, K.J. A novel approach to power loss calculation for power transformers supplying nonlinear loads. Electr. Power Syst. Res. 2023, 223, 109582. [Google Scholar] [CrossRef]
  24. IEEE Std C57.110™-2018; (Revision of IEEE Std C57.110-2008); IEEE Recommended Practice for Establishing Liquid Immersed and Dry-Type Power and Distribution. Transformer Capability When Supplying Nonsinusoidal Load Currents. Transformers Committee of the IEEE Power and Energy Society: New York, NY, USA, 2018; pp. 1–68. [CrossRef]
  25. Laso-Perez, A.; Martinez-Torre, R.; Morning-Canteli, M.; Cervero-García, D.; Sáez-Castro, J.A. A comparative between IEEE and EN in the transformer derating when supplying nonsinusoidal load current. A practical case. Renew. Energy Power Qual. J. (REPQJ) 2020, 18, 747–752. [Google Scholar] [CrossRef]
  26. ANSI/UL Standard 1561; Standard for Dry-Type General Purpose and Power Transformers. Ed 4, March 2, 2011, ANSI Approved May 13. Underwriters Laboratories Inc. (UL): Northbrook IL, USA, 2019.
  27. ANSI/UL Standard 1562; Transformers, Distribution, Dry-Type, Over 600 V. Ed 4, January 25, 2013, Revised August 11. Underwriters Laboratories Inc. (UL): Northbrook IL, USA, 2020.
  28. Deshpande, K.; Holmukhe, R.; Angal, Y.; Patil, Y. K-Factor Transformers and Non-linear Loads. Available online: https://powerquality.blog/2021/11/24/k-factor-transformers-and-non-linear-loads/ (accessed on 18 July 2023).
  29. ABB. Loading Transformers with Non-Sinusoidal Currents. K-Factor. ABB, 1LES100070-ZB–Rev. 1. pp. 1–7. Available online: https://library.e.abb.com/public/be0cadaf6a6708fcc1257792005162cb/Loading_transformers_with_non_sinusoidal_currents_KFactor.pdf (accessed on 14 June 2023).
  30. Fortescue, C.L. Method of symmetrical coordinates applied to solution of poly-phase networks. IEEE Trans. Am. Inst. Electr. Eng. 1918, XXXVII, 1027–1140. [Google Scholar] [CrossRef]
  31. C57.12.90™-2006 IEEE; Standard Test Code for Liquid-Immersed Distribution, Power, and Regulating Transformers. The Institute of Electrical and Electronics Engineers: New York, NY, USA, 2009.
  32. González, I.; Calderón, A.J. Integration of open source hardware Arduino platform in automation systems applied to Smart Grids/Micro-Grids. Sustain. Energy Technol. Assess. 2019, 36, 100557. [Google Scholar] [CrossRef]
  33. Leena, N.; Durai Raj, B.; Gunabalan, R. Computer-based laboratory teaching tools: An overview of LabVIEW and MATLAB. In Proceedings of the IEEE International Conference on Engineering Education: Innovative Practices and Future Trends (AICERA), Kottayam, India, 19–21 July 2012. [Google Scholar] [CrossRef]
  34. Nandagopal, V.; Maheswari, V.; Kannan, C. Newly Constructed Real Time ECG Monitoring System Using LabView. Sci. Res. Circuits Syst. 2016, 7, 4227–4235. [Google Scholar] [CrossRef]
  35. Schmidt, E.; Akopian, D.; Pack, D.J. Development of a Real-Time Software-Defined GPS Receiver in a LabVIEW-Based Instrumentation Environment. IEEE Trans. Instrum. Meas. 2018, 67, 2082–2096. [Google Scholar] [CrossRef]
  36. Pavithra, G.; Rao, V.V. Remote Monitoring and Control of VFD fed Three Phase Induction Motor with PLC and LabVIEW software. In Proceedings of the 2nd International Conference on I-SMAC (IoT in Social, Mobile, Analytics and Cloud), Palladam, India, 30–31 August 2018. [Google Scholar] [CrossRef]
  37. Rincón-Quintero, A.D.; Del Portillo-Valdés, L.A.; Meneses-Jácome, A.; Ascanio-Villabona, J.G.; Tarazona-Romero, B.E.; Durán-Sarmiento, M.A. Performance Evaluation and Effectiveness of a Solar-Biomass Hybrid Dryer for Drying Homogeneous of Cocoa Beans Using LabView Software and Arduino Hardware. In Proceedings of the International Conference on Intelligent Information Technology, Ho Chi Minh, Vietnam, 25–28 February 2021; pp. 238–252. [Google Scholar] [CrossRef]
  38. Villacorta, J.J.; del-Val, L.; Martínez, R.D.; Balmori, J.-A.; Magdaleno, A.; López, G.; Izquierdo, A.; Lorenzana, A.; Basterra, L.-A. Design and Validation of a Scalable, Reconfigurable and Low-Cost Structural Health Monitoring System. Sensors 2021, 21, 648. [Google Scholar] [CrossRef]
  39. Sivaranjani, S.; Velmurugan, S.; Kathiresan, K.; Karthik, M.; Gunapriya, B.; Gokul, C.; Suresh, M. Visualization of virtual environment through labVIEW platform. Materals Today Proc. 2021, 45, 2306–2312. [Google Scholar] [CrossRef]
Figure 1. Operational sequence of the TLC software version 1.
Environments 10 00177 g001
Figure 2. Programming stages.
Environments 10 00177 g002
Figure 3. Source code of software TLC.
Environments 10 00177 g003
Figure 4. A partial view of the harmonic voltage and current screen reported by the TLC software.
Environments 10 00177 g004
Figure 5. Transformer 1 currents at 20:02 (13 November 2022): (a) waveforms; (b) harmonic diagram.
Environments 10 00177 g005
Figure 6. Transformer 1 load losses on 14 November 2022, according to IEEE C57.110 and ANSI/UL 1561-1562 standards: (a) fundamental frequency; (b) non-fundamental frequency (harmonics).
Environments 10 00177 g006
Figure 7. Transformer 1 line currents at 16:02 (14 November 2022): (a) waveforms; (b) harmonic diagram.
Environments 10 00177 g007
Figure 8. Transformer 1 load losses on 13 November 2022, according to IEEE C57.110 and ANSI/UL 1561-1562 standards: (a) fundamental frequency; (b) non-fundamental frequency (harmonics).
Environments 10 00177 g008aEnvironments 10 00177 g008b
Figure 9. A-phase line current of transformer 2 at 16:02 (14 November 2022): (a) waveforms; (b) harmonic diagram.
Environments 10 00177 g009
Figure 10. Transformer 2 load losses on 9 October 2022 according to IEEE C57.110 and ANSI/UL 1561-1562 standards: (a) fundamental frequency; (b) non-fundamental frequency (harmonics).
Environments 10 00177 g010aEnvironments 10 00177 g010b
Figure 11. A-phase line current of transformer 2 at 11:00 (10 October 2022): (a) waveform; (b) harmonic diagram.
Environments 10 00177 g011
Figure 12. Transformer 2 load losses on 10 October 2022, according to IEEE C57.110 and ANSI/UL 1561-1562 Standards: (a) fundamental frequency; (b) non-fundamental frequency (harmonics).
Environments 10 00177 g012aEnvironments 10 00177 g012b
Table 1. Rated values of the ORMAZABAL transformers 1 and 2.
POWER
(kVA)
P J L - R
(W)
P E C L - R
(W)
P O S L - R
(W)
Line-to-Line Vacuum Voltage (V)
100010,500420818420
Table 2. Fundamental (50 Hz) RMS and T H D i z % values of the secondary line currents of transformer 1 measured each hour starting from 0:02 on 13 November 2022 (public holiday).
Time FrameTimeFundamental Currents (A)THD%
Phase APhase BPhase CPhase APhase BPhase C
10:02380.036280.334349.04210.5814.5312.29
21:02260.92229.703230.06913.6816.1816.64
32:02191.006190.796177.27616.3218.1918.77
43:02167.664144.969137.56517.0121.9323.17
54:02130.938111.515123.0321.1427.4725.04
65:02150.915130.791121.39116.6721.5423.43
76:02133.478112.819122.51818.7225.7823.47
87:02142.586102.358129.97617.0626.3321.24
98:02140.924172.741125.51317.9418.1423.96
109:02217.398189.012217.19814.5915.4313.99
1110:02343.127223.374282.7059.4714.8311.70
1211:02349.679276.687320.3029.7012.6911.78
1312:02354.129335.705269.7049.5511.1413.14
1413:02364.809312.967258.38111.0213.9514.90
1514:02374.324337.248272.88911.0011.7114.24
1615:02272.626276.445245.40315.6614.4818.24
1716:02322.359256.481189.70513.8617.3724.20
1817:02287.144261.985241.36515.0719.0519.02
1918:02339.659315.582346.15414.1716.3914.98
2019:02383.66329.891369.32413.0815.3614.11
2120:02422.833502.692447.89412.7310.7611.90
2221:02580.505541.733464.9599.5610.7312.07
2322:02564.522487.523429.6919.5211.4513.36
2423:02380.785371.051320.87312.3713.1715.75
Table 3. Fundamental (50 Hz) RMS and T H D i z % values of the secondary line currents of transformer 1 measured each hour starting from 0:02 on 14 November 2022 (working day).
Time FrameTimeFundamental Currents (A)THD%
Phase APhase BPhase CPhase APhase BPhase C
10:02256.527223.284244.48915.8618.5916.49
21:02163.891181.419162.5119.4120.0522.58
32:02140.102124.302126.96921.4827.4427.15
43:02140.065112.912107.14710.1928.0130.12
54:02150.183132.856117.54518.2322.7326.44
65:02147.48797.322121.53717.7729.9724.79
76:02143.68117.637134.97518.3824.9022.51
87:02198.247147.379212.26812.9619.8713.86
98:02297.828279.307250.46610.0410.8213.06
109:02318.37290.044292.5348.0910.3711.28
1110:02256.716265.426229.3110.3413.3214.81
1211:02321.838256.139300.2759.3313.4710.86
1312:02259.129243.364332.61612.2414.1210.28
1413:02298.438239.186288.27911.3515.2912.24
1514:02375.407262.883334.74811.4415.1812.06
1615:02245.77318.558338.14316.1513.0812.65
1716:02298.109321.629343.46712.5612.7812.62
1817:02256.703263.249318.41914.3814.5613.10
1918:02356.648391.825400.24411.0910.7110.29
2019:02501.284388.833503.2748.4211.428.38
2120:02551.973433.372531.7228.1510.128.24
2221:02615.821555.172584.7917.488.358.24
2322:02662.701560.962521.9917.058.139.59
2423:02451.841431.891383.63411.0311.9612.84
Table 4. Fundamental (50 Hz) RMS and T H D i z % values of the secondary line currents of transformer 2 measured each hour starting from 0:00 on 9 October 2022 (public holiday).
Time FrameTimeFundamental Currents (A)THD%
Phase APhase BPhase CPhase APhase BPhase C
10:00260.048250.148549.74970.6071.5739.82
21:00278.239260.066544.52672.0966.6442.72
32:00276.985240.753425.38768.9357.3654.22
43:00248.599239.669410.84759.2171.0136.97
54:00313.33221.065578.24565.6361.4442.28
65:00232.953253.647407.07565.0768.2043.31
76:00231.01215.224478.69369.2662.4742.09
87:00204.259200.562395.23664.5978.7140.49
98:00272.849287.224468.40357.9866.7936.46
109:00 o’clock281.268265.11512.29568.6563.6943.65
1110:00312.636373.305544.48366.4852.5541.23
1211:00411.159406.561617.13549.7351.7933.94
1312:00374.348380.28614.55352.4956.9233.98
1413:00372.745407.866712.21354.1051.1128.04
1514:00 p.m.392.063389.628658.77254.6951.4232.28
1615:00322.007288.37573.04155.6065.1733.49
1716:00348.959319.456485.14754.4860.3041.46
1817:00299.725257.722533.2862.0266.2436.32
1918:00316.776337.183582.82454.7059.7332.47
2019:00311.264316.519603.69162.1460.1734.21
2120:00438.887428648.86148.3650.6632.04
2221:00413.944425.264694.6848.0051.4927.60
2322:00344.851375.56565.45957.9053.7537.82
2423:00307.032307.242586.03462.7762.1934.44
Table 5. Fundamental (50 Hz) RMS and T H D i z % values of the secondary line currents of transformer 2 measured each hour from 0:00, 10 October 2022 (weekday).
Time FrameTimeFundamental Currents (A)CURRENT THD%
Phase APhase BPhase CPhase APhase BPhase C
10:00247.502282.254452.28971.5464.4046.26
21:00222.941217.087431.94171.8573.8046.04
32:00200.871203.342378.63475.8074.9550.37
43:00232.058229.298431.86773.8171.6647.75
54:00226.531213.053443.77972.8674.5047.65
65:00251.78239.705420.37470.5969.5748.09
76:00214.722213.536435.96974.2973.8246.62
87:00275.391312.453588.43464.1862.6634.93
98:00396.45428.569675.1154.1950.3330.43
109:00392.997450.682721.69652.2447.5328.03
1110:00493.038554.132774.50244.0740.7924.51
1211:00465.675452.764696.07647.3247.6927.23
1312:00498.188533.941752.8544.3341.6225.52
1413:00486.077535.109756.09444.6241.5625.80
1514:00375.441450.244688.35854.5146.9129.25
1615:00348.78371.5576.75255.7054.2135.27
1716:00358.338358.739602.02354.3256.3933.08
1817:00409.214403.265634.63749.8851.3130.98
1918:00495.427515.191761.42844.2441.8025.53
2019:00462.99497.983769.57644.9143.9524.24
2120:00624.84611.888878.47835.7636.6120.31
2221:00679.033609.481909.60232.6134.7919.54
2322:00425.532467.868695.50947.5546.3326.75
2423:00317.204388.835603.88357.8051.6933.61
Table 6. Daily energy losses, in kWh, caused by fundamental and harmonic currents in transformers 1 and 2, according to the adapted and original (within parentheses) expressions for the IEEE C57.110 and ANSI/UL 1561-1562 standards.
TransformerIEEE Std C57.110ANSI/UL 1561-1562Other Stray Losses
FundamentalHarmonicsTotalFundamentalHarmonicsTotal
No. 1
(Nov 13)
13.468 (13.327)0.615 (0.609)14.084 (13.936)12.530 (12.405)0.572 (0.567)13.102 (12.972)0.982
(0.964)
No. 1
(Nov 14)
15.776 (15.643)0.45 (0.445)16.226 (16.089)14.676 (14.553)0.416 (0.411)15.092 (14.965)1.133
(1.124)
No. 2
(Oct 9)
25.467 (23.513)26.711 (24.925)52.179 (48.438)23.693 (21.875)24.597 (22.762)48.290 (44.637)3.889
(3.801)
No. 2
(Oct 10)
37.306 (35.330)27.935 (26.358)65.241 (61.689)34.706 (32.868)26.002 (24.928)60.708 (57.797)4.533
(3.892)
Table 7. Total energy losses, in kWh, caused in the year 2022 by the fundamental and harmonic currents in transformers 1 and 2 according to the adapted and original (within parentheses) expressions for the IEEE C57.110 and ANSI/UL 1561-1562 standards.
TransformerIEEE Std C57.110ANSI/UL Std. 1561-1562Other Stray Losses
FundamentalHarmonicsTotalFundamentalHarmonicsTotal
No. 15488.34 (5438.87)183.68
(181.73)
5672 (5620.60)5105.87 (5060.61)170.12 (168.42)5276
(5529.03)
396.03 (391.56)
No. 212,231.57 (11,513.16)10,053.18 (9453.17)22,284.76
(20,966.33)
11,379.173
(10,710.83)
9326.27
(8845.41)
20,705.44
(19,556.24)
1579.3
(1410.10)
Table 8. Total CO2 emissions, in kg, caused in the year 2022 by the fundamental and harmonic load losses in transformers 1 and 2 according to the adapted and original (within parentheses) expressions for the IEEE C57.110 and ANSI/UL 1561-1562 standards.
TransformerIEEE Std C57.110ANSI/UL Std. 1561-1562Other Stray Losses
FundamentalHarmonicsTotalFundamentalHarmonicsTotal
No. 1845.2
(837.58)
28.29
(28.00)
873.49
(865.58)
786.3
(779.33)
26.2
(25.94)
812.5
(805.27)
61.0
(60.3)
No. 21883.66 (1773.02)1548.19 (1455.79)3431.85 (3228.81)1752.39 (1649.47)1436.24 (1362.19)3188.64 (3011.66)243.21
(217.15)
Disclaimer/Publisher’s Note: The statements, opinions and data contained in all publications are solely those of the individual author(s) and contributor(s) and not of MDPI and/or the editor(s). MDPI and/or the editor(s) disclaim responsibility for any injury to people or property resulting from any ideas, methods, instructions or products referred to in the content.

