Article

Red Claw Crayfish Cherax quadricarinatus Cultivation Influences the Dynamics and Assembly of Benthic Bacterial Communities in Paddy Fields

1
Wuxi Fisheries College, Nanjing Agricultural University, Wuxi 214081, China
2
Key Laboratory of Integrated Rice-Fish Farming Ecology, Ministry of Agriculture and Rural Affairs, Freshwater Fisheries Research Center, Chinese Academy of Fishery Sciences, Wuxi 214081, China
3
Animal Disease Prevention and Control Center of Huishan District, Wuxi 214100, China
*
Authors to whom correspondence should be addressed.
Environments 2023, 10(10), 178; https://doi.org/10.3390/environments10100178
Submission received: 27 August 2023 / Revised: 3 October 2023 / Accepted: 5 October 2023 / Published: 9 October 2023
(This article belongs to the Topic Environmental Bioengineering and Geomicrobiology)

Abstract

:
Red claw crayfish Cherax quadricarinatus has emerged as a highly significant and suitable species to be raised in integrated rice–aquatic animal farming systems. To optimize an integrated aquaculture and agriculture (IAA) system and ensure sustainable utilization and development of land resources, an IAA system combining rice cultivation with red claw crayfish culture was implemented to assess the impacts of rice–red claw crayfish co-culturing on the dynamics and assembly of bacterial communities in paddy soils. We established two experimental groups, each with eight replicates. We utilized 16S rRNA Illumina high-throughput sequencing to access the bacterial community composition and assembly in paddy soils. Red claw crayfish C. quadricarinatus cultivation did not significantly affect the alpha diversity of the bacterial community in the paddy field, but it obviously increased the relative abundances of the phyla Acidobacteriota and Pseudomonadota involved in organic matter degradation and nitrogen, phosphorus, and carbon cycling. Red claw crayfish cultivation could lead to more complex bacterial communities, increased bacterial resistance to disturbances, the promotion of niche differentiation, and increased competition intensity between bacterial communities during the mid-cultivation period. Nitrogen emerged as a critical factor influencing the bacterial community composition in paddy soil during the culture period, and the red claw crayfish cultivation affected the bacterial community by altering the ammonia concentration in the paddy soil. As the culture progressed, the assembly of the bacterial community in the paddy soil was predominantly driven by stochastic processes, and red claw crayfish cultivation accelerated the evolution of the bacterial community assembly towards a stochastic process. Our study offers valuable insights into the dynamic changes occurring in the composition and assembly of bacterial communities in paddy soils in response to red claw crayfish cultivation.

1. Introduction

An integrated aquaculture and agriculture (IAA) system is an effective agricultural model that follows the principles of environmentally responsible development to achieve environmental sustainability and higher food productivity [1,2]. By integrating agriculture and aquaculture, ecosystems comprising economic aquatic animals, rice, vegetables, etc., have more complex food webs and become more stable than single rice cultivation or aquaculture ecosystems [3]. The components of the integrated rice–aquatic animal ecosystem can effectively take advantage of and promote each other, thereby improving the overall resource utilization efficiency and productivity rates of the fields [4,5]. Asia, particularly China, has a rich historical tradition of integrated rice–fish farming, dating back to as early as 220 AD [6]. By 2022, integrated rice–aquatic animal (including fish, crab, crayfish, etc.) farming in China had extended over 2.86 million ha, equivalent to 9.72% of China’s total rice cultivation area [7,8]. Meanwhile, integrated rice–aquatic animal farming provided 3.87 million tons of various aquatic products in 2022, accounting for 11.77% of China’s total freshwater aquaculture production [7].
Aquaculture and agricultural productivity are generally indirectly affected by bacterial communities both in water bodies and sediments, as bacteria are critical for nutrient migration and transformation and for maintaining water quality and soil fertility [9,10,11]. Bacterial communities are also important and non-negligible indicators in both aquaculture and agricultural environments as they reflect the ecological status of an ecosystem [12,13]. The farming production operations and management, such as feed input and normal life activities of cultured animals in aquaculture ecosystems, can introduce multiple environmental changes that impact bacterial communities [14,15,16,17,18]. To explore how the ecosystems respond and adapt to environmental changes, such as those resulting from different agriculture or aquaculture models, it is essential to unravel the spatiotemporal variation in bacterial community composition and the underlying generation mechanisms [19,20,21]. Moreover, the turnover and dynamics of bacterial community composition are primarily influenced by the assembly processes of the bacterial community, which are simultaneously controlled by deterministic and stochastic processes and are considered crucial in coupling with environmental changes [22]. It is vital for grasping microbial ecology to delve into the fundamental mechanisms shaping bacterial community assembly [23]. Previous studies have highlighted the effects of integrated rice–aquatic animal farming on the physicochemical properties of water bodies and soil, nutritional and material exchange, migration and transformation of biogenic elements, and greenhouse gas emissions [10,24,25,26,27,28,29,30]. However, the dynamics of bacterial communities impacted by integrated rice–fish farming, especially the bacterial communities’ assembly mechanism and their relationships with environmental factors in integrated rice–fish farming ecosystems, remain unclear.
The red claw crayfish, Cherax quadricarinatus, is originally native to regions encompassing northern Australia and Papua New Guinea. It is widely introduced and popularly cultivated around the world because of its remarkable attributes such as large size, rapid growth rate, strong disease resistance, high economic value, and suitability for aquaculture [31,32,33]. Since C. quadricarinatus was first introduced to China in 1992, it has gradually become a very important and suitable variety to be raised in an integrated rice–aquatic animal farming system [34,35,36,37]. Crayfish are typical benthic organisms that can transform the function and structure of aquatic habitats due to their feeding habits [38,39,40,41,42,43]. Benthic fauna plays a crucial role not only in the biogeochemical cycle at the sediment–water interface of aquatic ecosystems but also in influencing the composition, diversity, metabolism, and function of benthic bacterial communities [44,45,46,47,48,49,50,51]. However, there is a lack of studies describing the impacts of red claw crayfish C. quadricarinatus cultivation on the farmland ecosystem, especially in relation to the variations and assembly mechanisms of benthic bacterial communities in paddy fields.
Hence, in this study, we performed 16S rRNA gene sequencing to access the microbial community in paddy fields with and without red claw crayfish C. quadricarinatus cultivation during the whole experimental progression. Variations in the composition and stability of the benthic bacterial community after red claw crayfish cultivation were analyzed. Concerning environmental factors, the effects of red claw crayfish cultivation on the environmental adaptation of benthic bacterial communities were investigated. Moreover, we identified the ecological process driving the assembly of bacterial communities and determined its variation associated with red claw crayfish cultivation. The objective of our study was to examine the impacts of red claw crayfish C. quadricarinatus cultivation on the dynamic variations and assembly mechanisms of bacterial communities in paddy fields, thus hoping to provide valuable and theoretical support for optimizing the IAA system and ensuring the sustainable utilization and development of land resources.

2. Materials and Methods

2.1. Field Experiment

The experiment was carried out at the Jingjiang scientific research experimental base at the Freshwater Fisheries Research Center (120°19′53.6628″ E, 32°5′55.4604″ N; Taizhou, China). Sixteen paddy fields, each with an area of approximately 667 m2, were selected for this study. Rice seedlings (Nangeng 5055) were transplanted into all paddy fields in mid-June and were harvested in early November. Intact and healthy red claw crayfish C. quadricarinatus with an average wet body weight of 8~9 g were stocked in eight paddy fields at the density of 2000 individuals·mu−1, according to Yang et al. [36]. The remaining eight paddy fields were set up as a control group with no red claw crayfish stocks, and the red claw crayfish cultivation and control groups were presented as QE and QC, respectively. The experiment began on 25 August and ended on 25 October. During the experimental field period, management was performed according to conventional local agricultural practices and previous studies [36,52]. Red claw crayfish were fed commercial pellet diets (Zhejiang Haida Feed Co., Ltd., Shaoxing, China) once daily at 5:00 p.m., and the feeding amount was equivalent to 2% of their body weight.

2.2. Sample Collection

During the experimental period, five sampling points were selected from each paddy field using the five-point sampling method. Paddy soil samples with a depth of 0–5 cm were collected at three culture stages (stage I on 25 August, stage Ⅱ on 25 September, and stage Ⅲ on 25 October, respectively) using a Kajak Sediment Corer (KC Denmark A/S, Silkeborg, Denmark). All five soil samples from the same paddy field were mixed thoroughly, promptly transferred into sterilized containers, and transported to the laboratory in a portable icebox. The soil samples, which were intended for the assessment of bacterial communities, were promptly frozen at −80 °C to preserve their integrity until DNA extraction could be performed. Another set of soil samples used to analyze paddy soil properties was subjected to a drying process in a lyophilizer (CHRIST LYO Alpha 1–4 LD plus) at −50 °C for 72 h, followed by grinding and homogenization in a mortar.

2.3. Paddy Soil Properties Determination

The content of total nitrogen (TN) in the soil sample was determined using the Kjeldahl method and UV spectrophotometry. The total phosphorus (TP) content in the soil sample was assessed following the prescribed Chinese national standard [53]. Before determining the ammonia, nitrite, and nitrate contents in soil samples, the soil samples were extracted with KCl solution (2M), and the supernatant was collected after equilibration and filtration, according to Norman and Bremner [54]. The ammonia, nitrite, and nitrate contents of the supernatant were determined as described by Lei et al. [55].

2.4. Bacterial DNA Extraction and 16S rRNA Sequencing

The extraction and the concentration determination of bacterial DNA in paddy soil samples were carried out using E.Z.N.A.® Soil DNA Kit (Omega Bio-tek, Norcross, GA, USA) and NanoDrop 2000 Spectrophotometer (Bio-Rad Laboratories, Inc., Hercules, CA, USA), respectively. Primers 341F-806R (341F: ACTCCTACGGGAGGCAGCAG; 806R: GGACTACHVGGGTWTCTAAT) were employed to amplify the V3-V4 regions of the 16S rRNA genes for each extracted bacterial DNA in 15 μL reaction volumes through polymerase chain reaction (PCR) [56]. The components of the 15 μL reaction volume and the procedure for PCR were according to our previous study [57]. To analyze the PCR products of each sample, electrophoresis was performed using a 1.5% agarose gel. Sequencing libraries were constructed by purifying, quantifying, and mixing the obtained PCR products in equal amounts. An Agilent Bioanalyzer 2100 system and a Qubit @2.0 Fluorometer (Thermo Scientific, Waltham, MA, USA) were responsible for library quality determination. The libraries were sequenced using the Illumina NovaSeq 6000 platform (San Diego, CA, USA) at BIOZERON Biotech. Co., Ltd. (Shanghai, China) using the 250 bp paired-end strategy.

2.5. Sequence Data Processing

Reads were subjected to quality control measures to ensure reliable data for analysis. Specifically, reads with an average Phred score (Q score) below 20, the presence of ambiguous bases or homopolymer runs with over eight primer mismatches, and sequence lengths below 250 bp were eliminated [58]. Afterward, paired-end reads that exhibited a minimum overlap of 10 bp without any mismatches were further processed into tags using the FLASH [59]. These tags were then dereplicated, subjected to the Divisive Amplicon Denoising Algorithm 2 (DADA 2) algorithm using Quantitative Insights into Microbial Ecology 2 (OIIME 2) to identify indel mutations and substitutions, and assigned to amplicon sequence variants (ASVs) [60,61]. The 16S ASV was chosen and taxonomically classified using the SILVA 138 database [62]. The abundance tables of bacterial ASVs were normalized by standardizing the number of tags to match the sample with the lowest tag count (78,286 tags).

2.6. Statistical Analysis

To evaluate the alpha diversity of bacterial communities in the paddy field, indices including Chao, Shannon, Pielou_J, and Pd_faith were calculated. Principal coordinate analyses (PCoA) with PERMANOVA tests were conducted using the Bray–Curtis distances to determine the effect of C. quadricarinatus and culture stage on the bacterial community in the paddy field. The differences in alpha diversity, Bray–Curtis distances, bacterial functional groups, and environmental factors among the different groups were confirmed using Tukey’s honest significant difference (HSD) test. For each specific culture stage, the Wilcoxon rank-sum test was used to verify the dissimilarity in the composition of the bacterial community between the QE and QC groups. Network analysis was conducted to investigate the co-occurrence patterns within soil bacterial communities and to identify potential biological interactions [63]. Statistically robust correlations were calculated to identify the co-occurrence events and species with a relative abundance <0.1% and detection rate < 40% were removed before analysis. The correlations with |correlation coefficient| > 0.8 and p < 0.05 were considered significant. The neutral community model (NCM) was used in the present study, and the relative contributions of neutral processes were determined in shaping the structure of bacterial communities in paddy soils [64]. To assess the contribution of environmental indices to variations in the bacterial communities within paddy soils, redundancy analysis (RDA) was employed. The relationship between bacterial communities and environmental factors was evaluated by calculating Spearman’s correlation coefficients. An aggregated boosted tree (ABT) was used to assess the importance of environmental variables for changes in bacterial communities in paddy soils.
All analyses and related figures were completed using the multcomp, vegan, ape, ggalluvial, pheatmap, linkET, Gephi, ggplot2, and minpack.lm packages in R v. 4.0.3 (R Core Team, Vienna, Austria).

3. Results

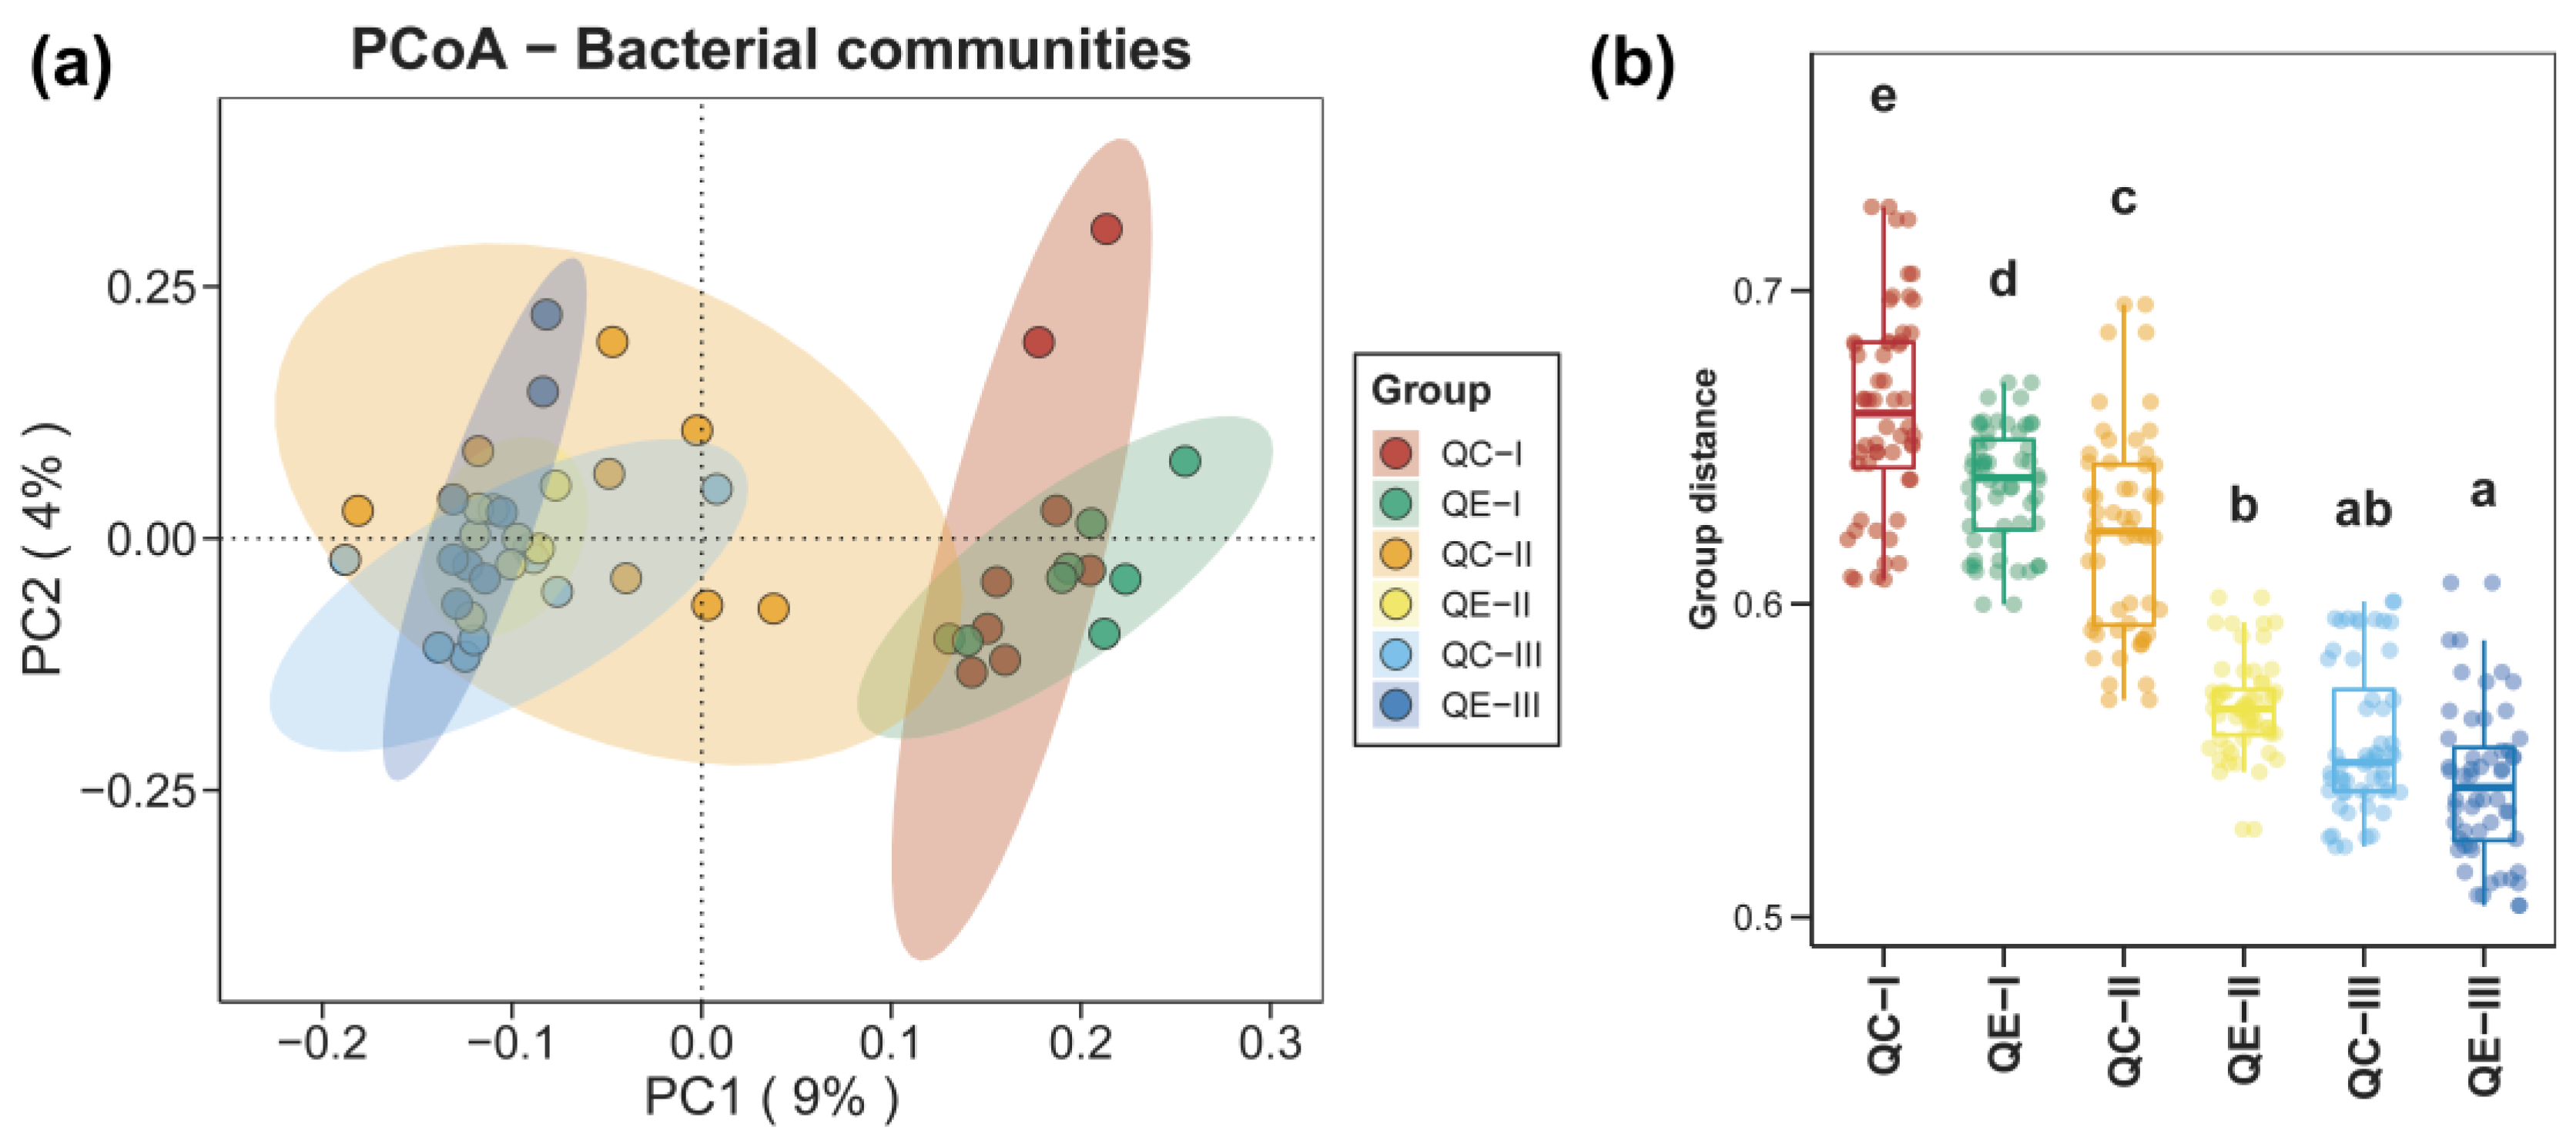
3.1. Alpha and Beta Diversities of Bacterial Communities in Paddy Soil

In total, our study generated 934,656 bacterial sequences from 48 different samples, which were then analyzed and classified into 78,286 unique ASVs. Figure S1 illustrates the results of the four alpha diversity indices (Chao, Shannon, Pielou_J, and Pd_faith) for the bacterial communities within the paddy soils. The results revealed no significant variations in any of the alpha diversity indices across the different groups (p > 0.05). These findings suggested that the bacterial community diversity remained stable throughout the experimental period, indicating that red claw crayfish cultivation had no discernible impact on the bacterial community diversity.
The dissimilarities in bacterial communities within the paddy soil between the QE and QC groups during different culture stages were assessed through the conducted PCoA analysis based on the Bray–Curtis distance, as depicted in Figure 1a. The bacterial community within the paddy soil was clustered mainly according to the culture stage rather than red claw crayfish cultivation, and the bacterial communities at the same sampling time were relatively close and similar. Two-way PERMANOVA revealed that red claw crayfish cultivation had no obvious impacts on the bacterial community within the paddy soil (p > 0.05, Table S1), but the culture stage significantly affected the bacterial community (p < 0.05, Table S1). For further analysis of beta diversity, the Bray–Curtis distances of the QE and QC groups at different culture stages are shown in Figure 1b. Overall, the Bray–Curtis distances in both the QC and QE groups decreased significantly as the experiment progressed (p < 0.05). In culture stages I and II, the Bray–Curtis distances in the QC group were clearly greater than those in the QE group (p < 0.05). However, at the end of the experiment, the Bray–Curtis distance exhibited no remarkable differences between the QC and QE groups (p > 0.05).

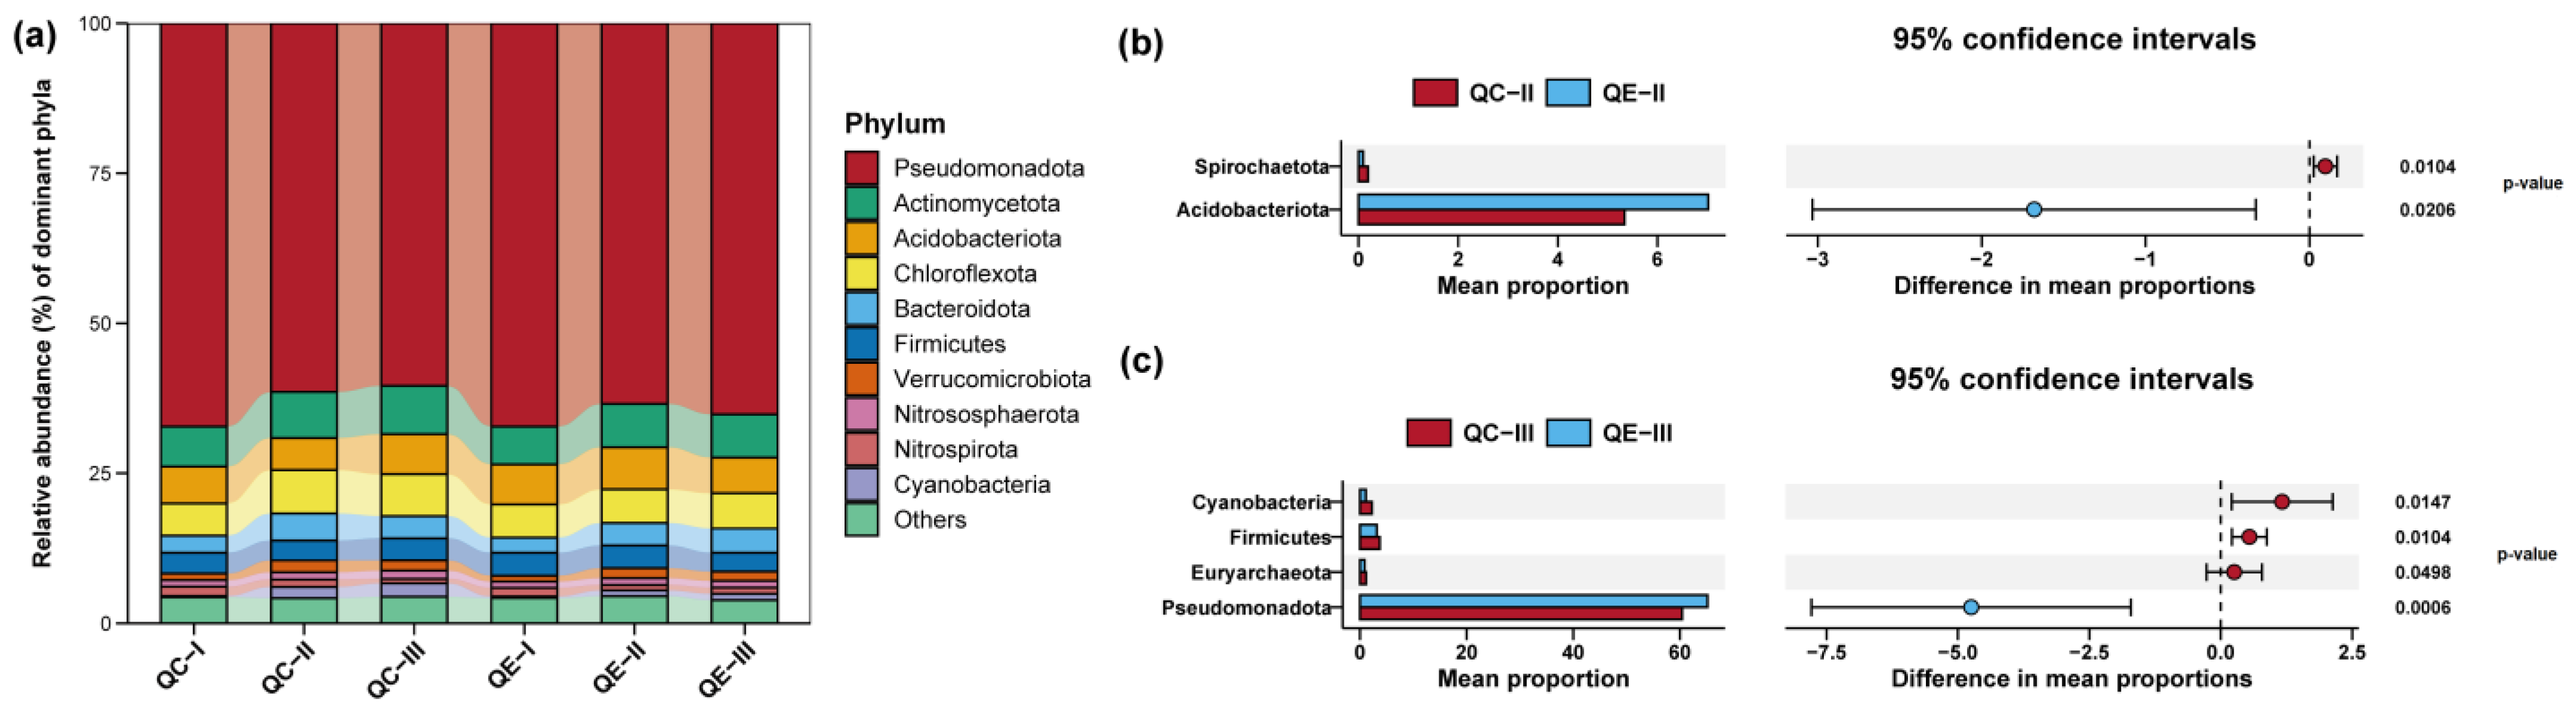
3.2. Compositions of Bacterial Communities in Paddy Soil

All 78,286 ASVs obtained from the paddy soil samples were assigned to 52 phyla and 1052 genera in the present study. Figure 2a and Figure S2a presented the relative abundances of the dominant phyla and genera, respectively. Pseudomonadota (64.15%) was the dominant phylum, followed by Actinomycetota (7.19%), Acidobacteriota (6.30%), Chloroflexota (6.10%), Bacteroidota (3.57%), Firmicutes (3.53%), Verrucomicrobiota (1.49%), Nitrososphaerota (1.16%), Nitrospirota (1.15%), and Cyanobacteria (1.09%). The dominant genus was Cronobacter (19.33%), followed by Escherichia (4.92%), Luteitalea (4.34%), Salmonella (3.74%), Defluviicoccus (3.59%), Ralstonia (2.78%), Steroidobacter (1.71%), Bellilinea (1.42%), Duodenibacillus (1.32%), and Desulfomonile (1.25%).
Differences in the bacterial phyla between the QC and QE groups are shown in Figure 2b,c. There were no significantly different phyla in the paddy soils between the QC and QE groups at culture stage I (p > 0.05). As culturing progressed, the QC group exhibited a significantly decreased relative abundance of Acidobacteriota and a clearly increased relative abundance of Spirochaetota in the paddy soil compared with the QE group at culture stage Ⅱ (p < 0.05). At culture stage Ⅲ, the relative abundances of Cyanobacteria, Firmicutes, and Euryarchaeota in the paddy soil of the QC group were significantly higher relative to the QE group, whereas the relative abundance of Pseudomonadota in the paddy soil of the QC group was notably lower than QE group (p < 0.05). The differences in the composition of bacterial communities at the genus level between the QC and QE groups are shown in Figure S2b–d. At culture stage I, the QC group showed significantly higher relative abundances of the genera Bradyrhizobium, Phenylobacterium, Clostridium, and Paraclostridium compared with the QE group (p < 0.05). In addition, the QC group had notably lower relative abundances of Hypericibacter, Chryseolinea, Sideroxydants, and Desulfonatronum compared with the QE group (p < 0.05). As the culture progressed, an increasing number of genera exhibited significantly different relative abundances between the QC and QE groups. At culture stages Ⅱ and Ⅲ, there were 17 and 24 different genera in the QC and QE groups, respectively (p < 0.05). Most differentially expressed genera were significantly enriched in the QE group (p < 0.05).

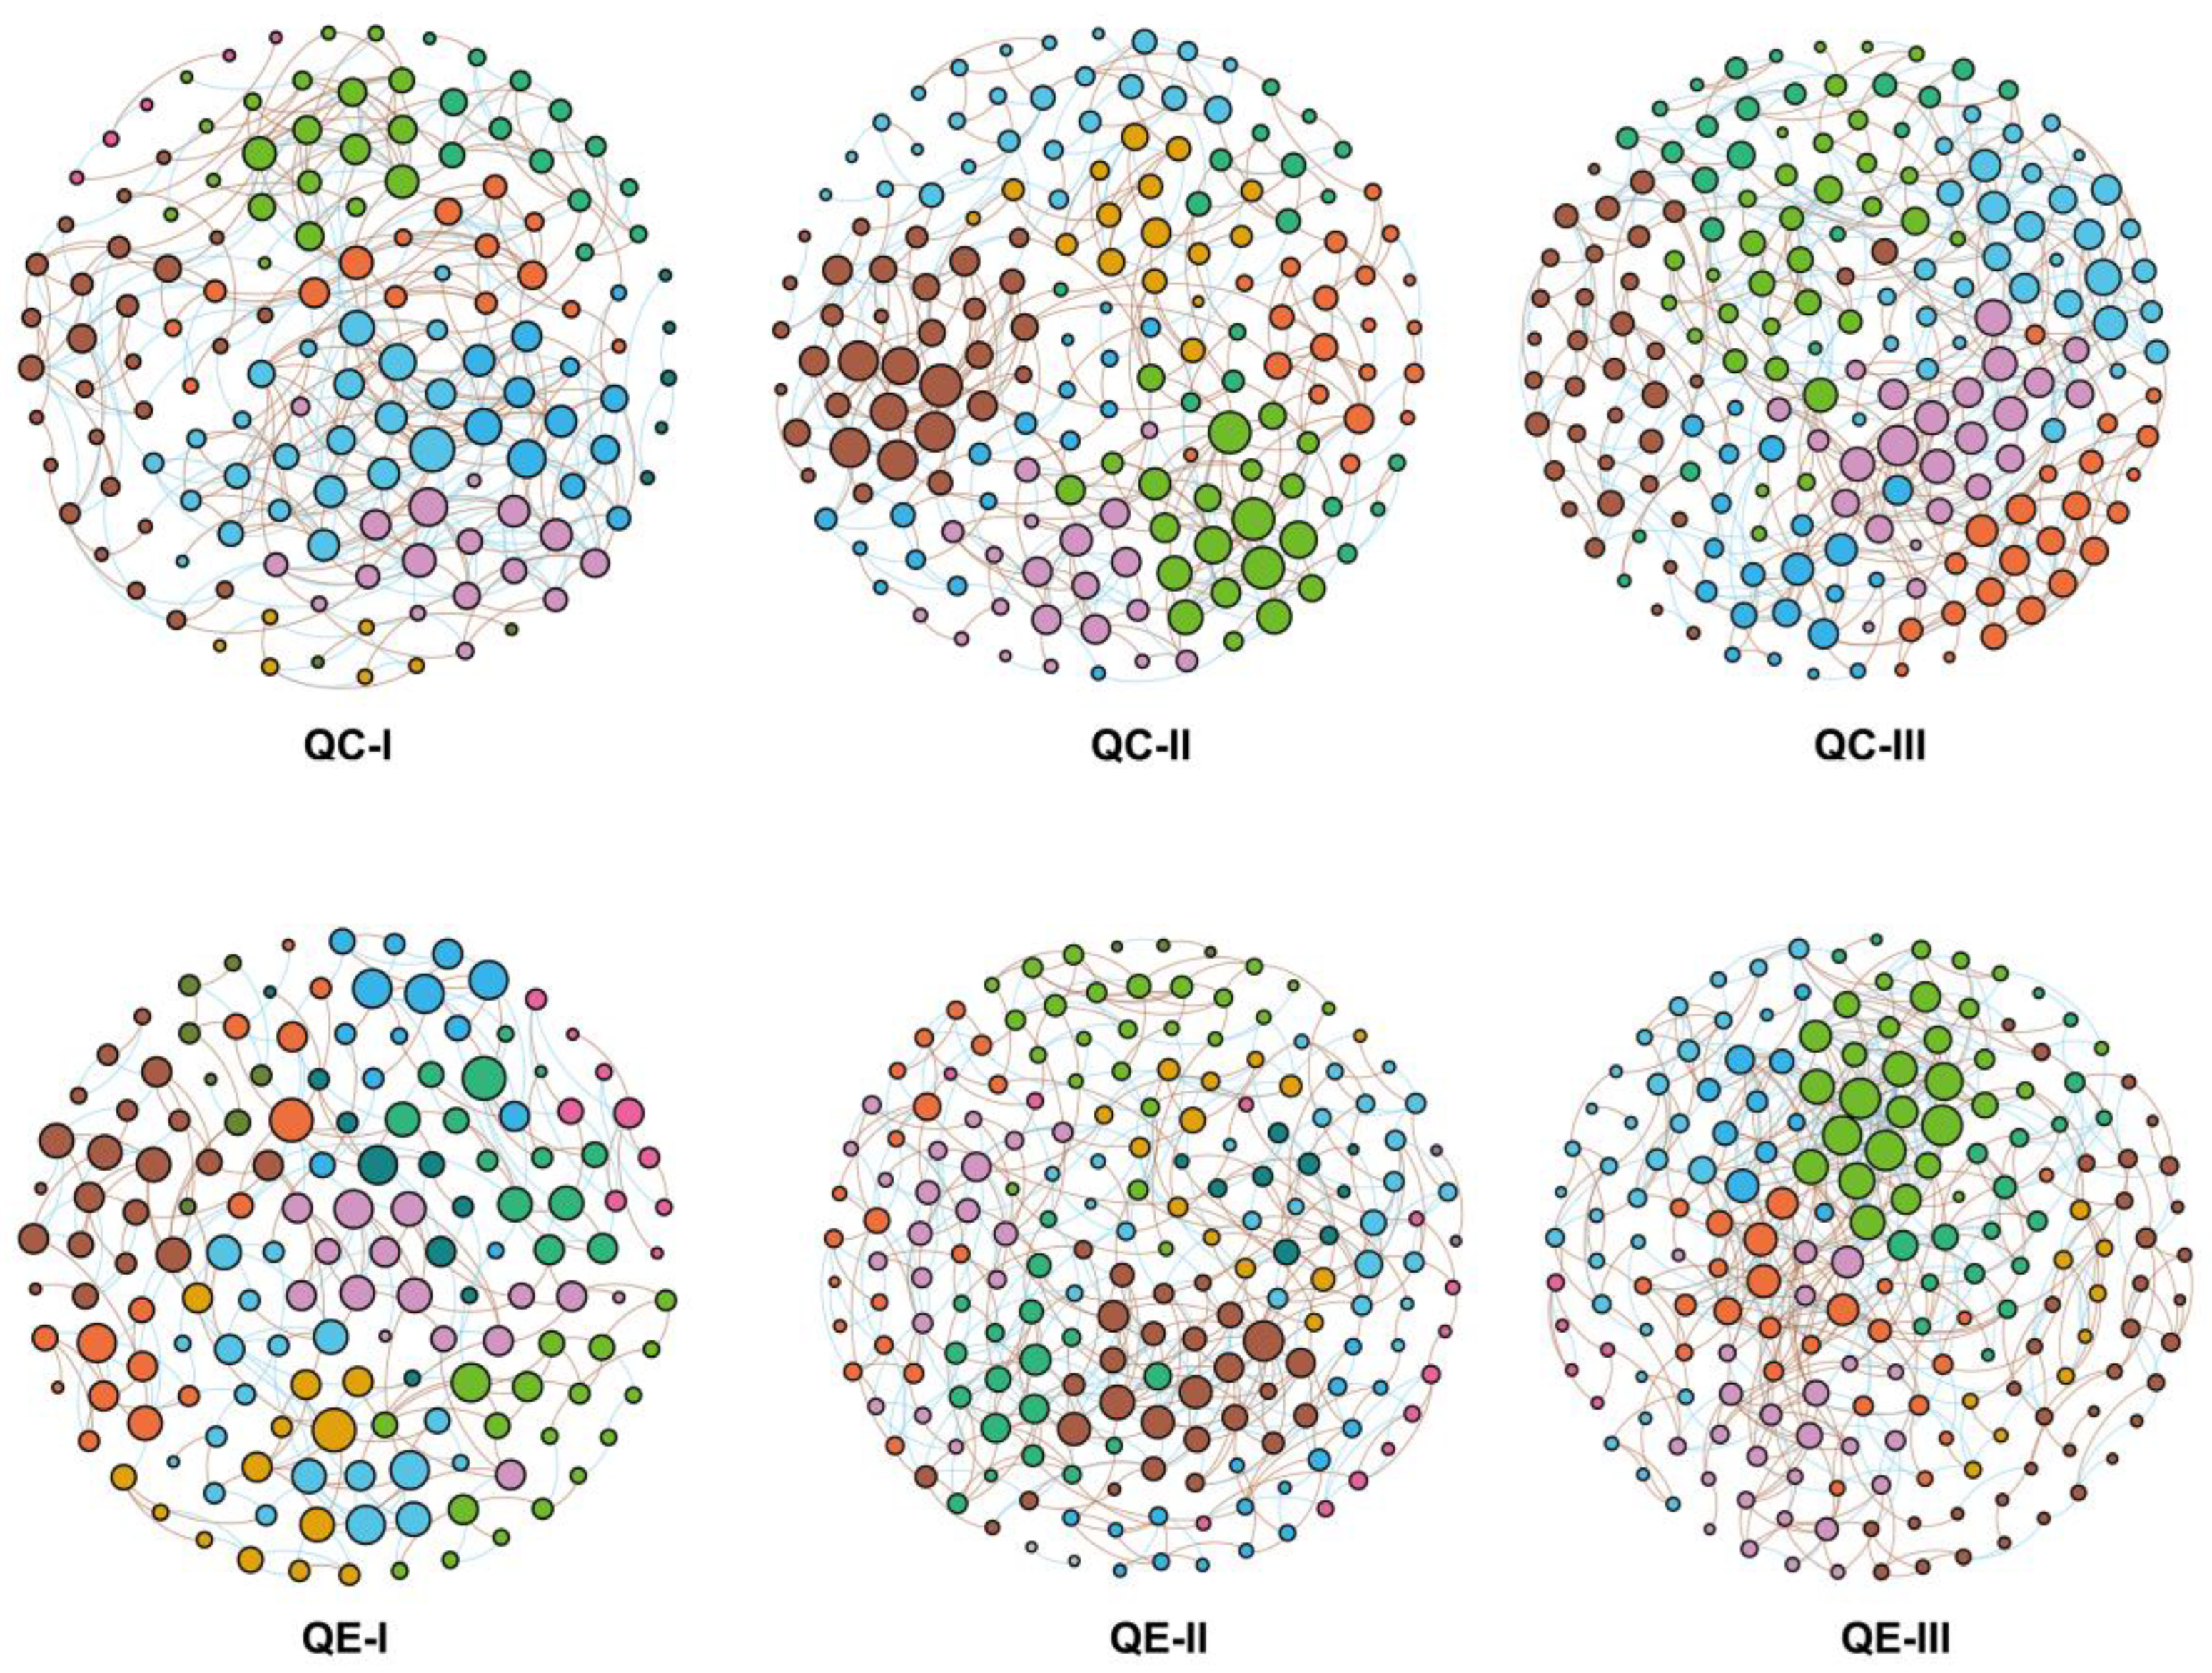
3.3. Co-Occurrence Patterns in the Soil Bacterial Communities

The co-occurrence networks and topological parameters for the soil bacterial communities in our study are illustrated in Figure 3 and Table S2, respectively. In culture stage Ⅰ, the co-occurrence network for the QC group displayed 145 nodes and 488 edges, while the co-occurrence network for the QE group included 151 nodes and 293 edges. As the culture progressed, the co-occurrence network for the QC group displayed 170 nodes and 432 edges at culture stage Ⅱ, whereas the co-occurrence network for the QE group displayed 188 nodes and 499 edges. In the final stage, the co-occurrence network for the QC group exhibited 192 nodes and 577 edges, whereas the co-occurrence network for the QE group included 190 nodes and 607 edges. Additionally, the positive edge ratio of the co-occurrence network for the QC group was 55.53% at culture stage Ⅰ, increased continuously to reach a maximum (65.51%) at culture stage Ⅱ, and decreased to 58.06% at culture stage Ⅲ. However, the positive edge ratio of the co-occurrence network for the QE group increased continuously during the culture process, from 53.92% at stage I to 59.14% at stage Ⅲ. The changing trends in the negative edge ratio for the QC and QE groups during the culture period were exactly opposite those of the positive edge ratio.

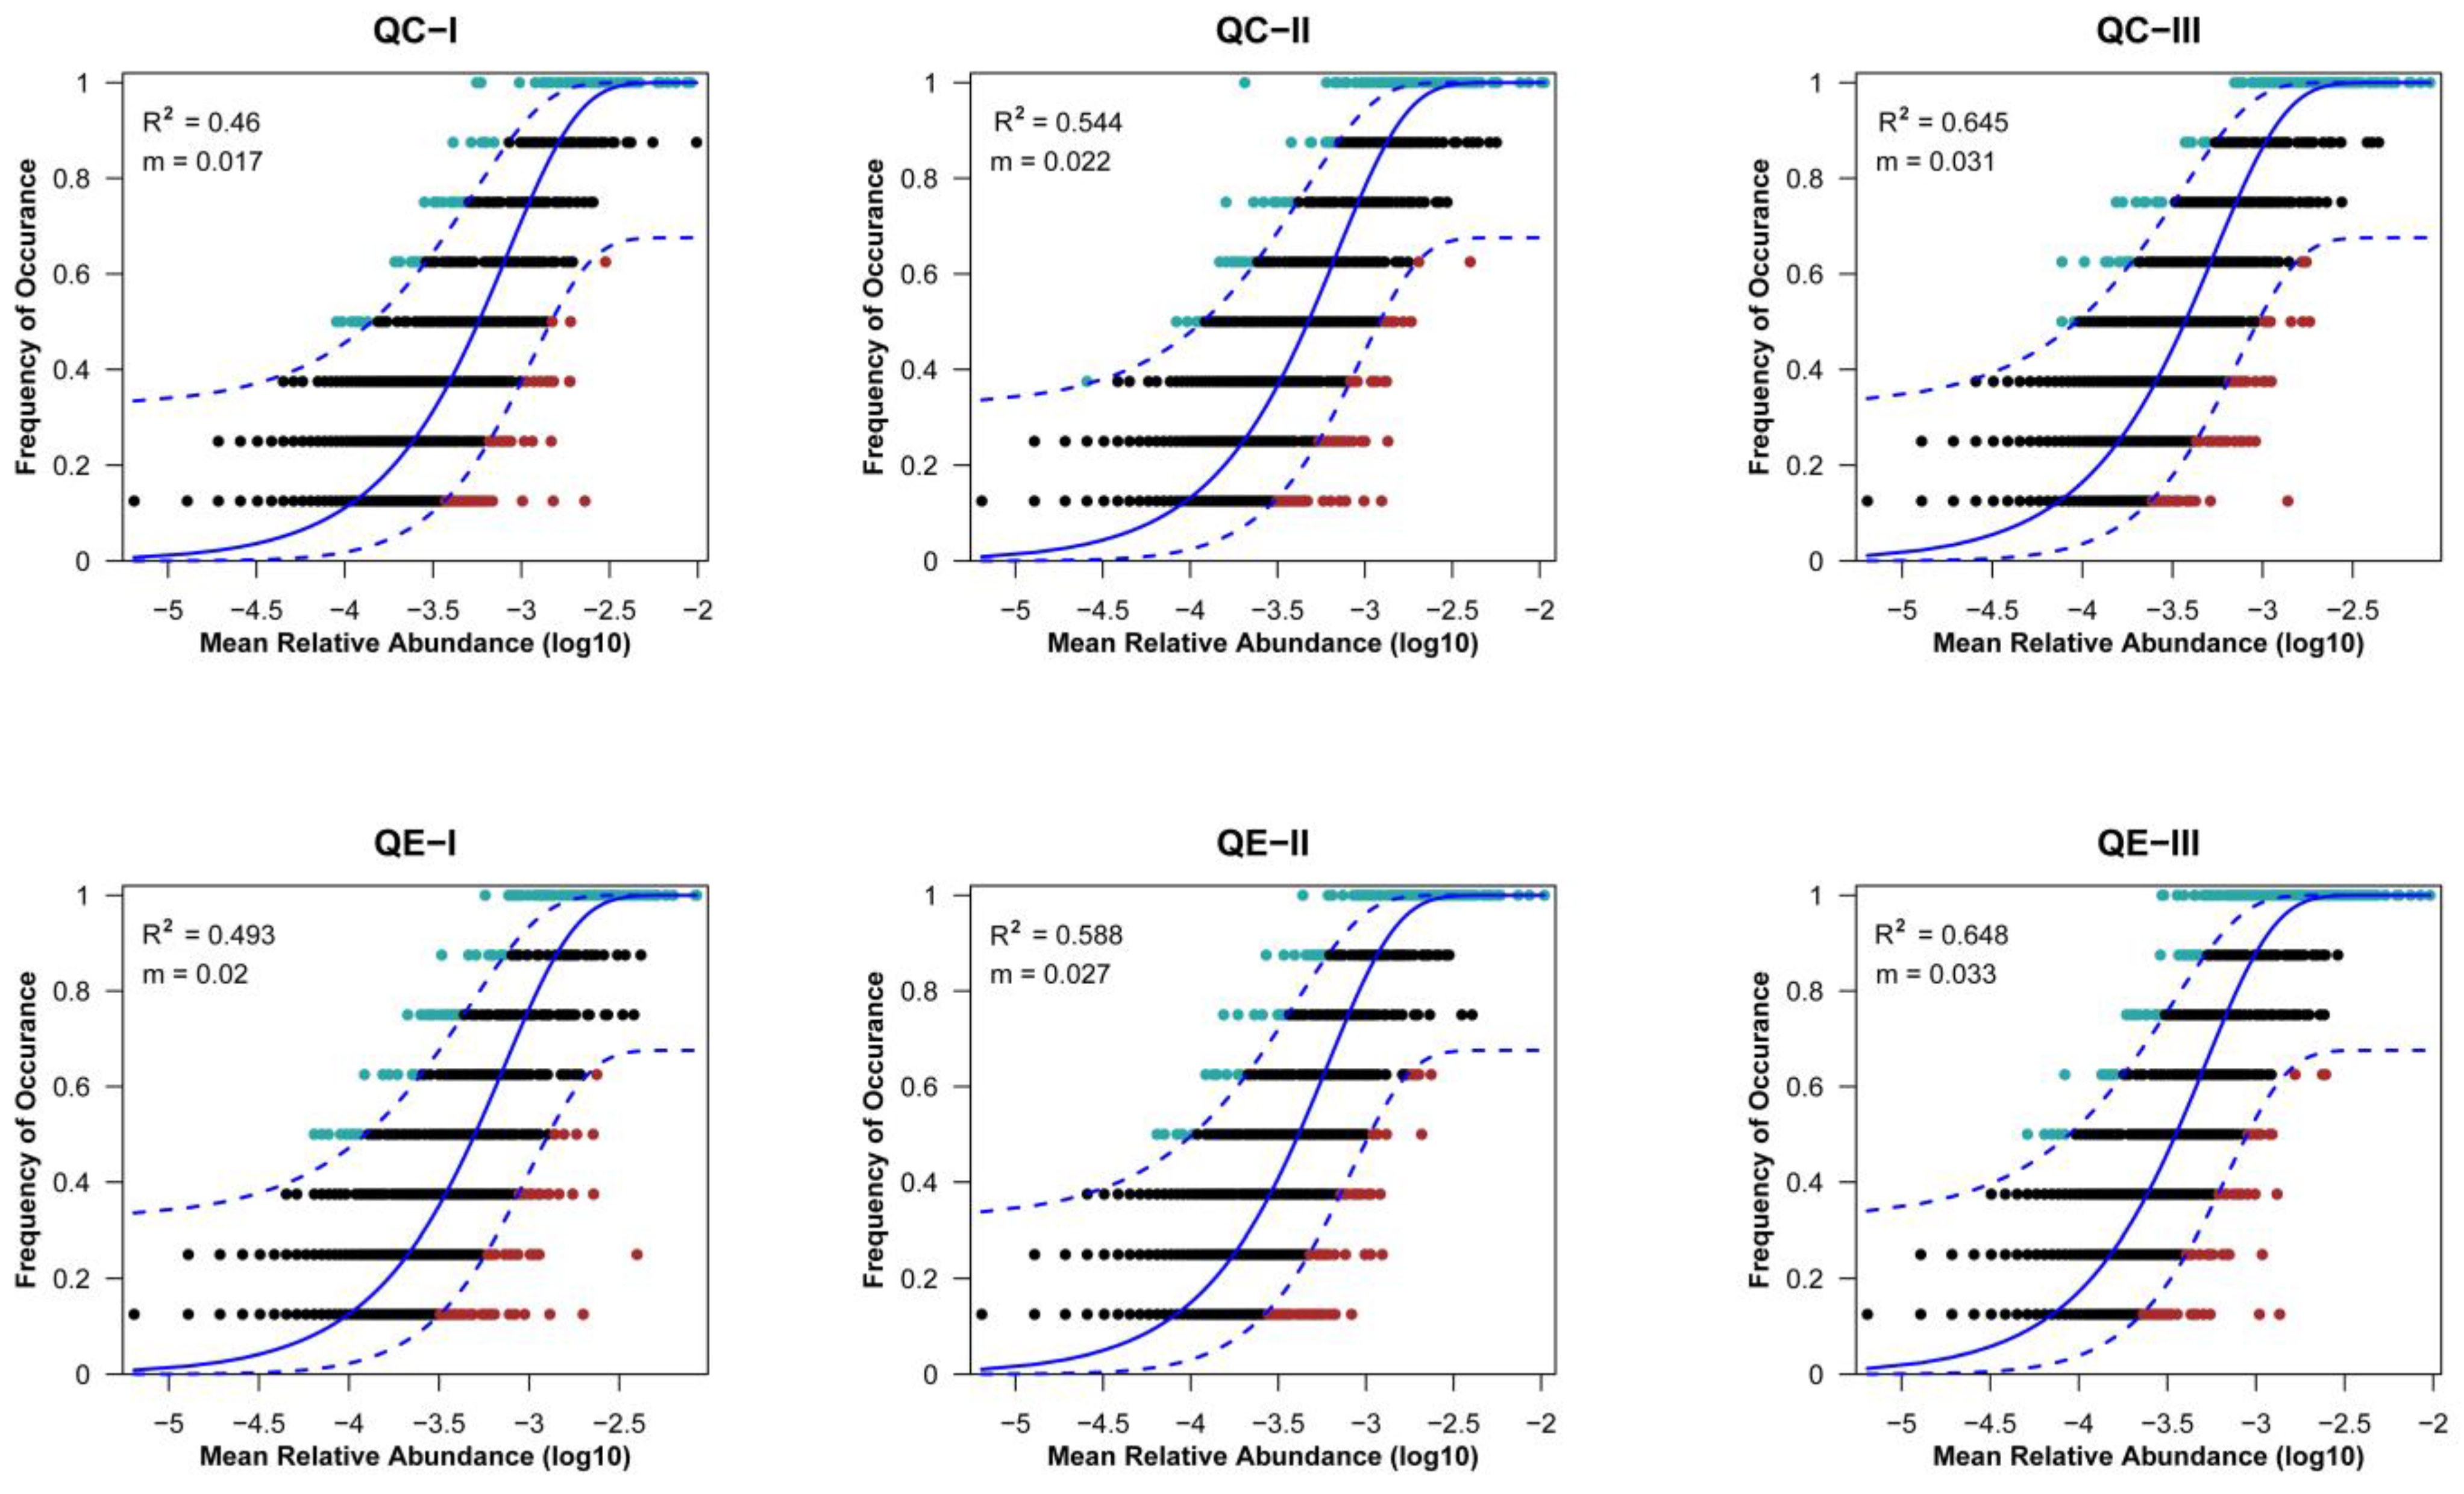
3.4. Assembly Processes in the Soil Bacterial Communities

NCM was used to quantify the assembly processes in driving soil bacterial communities (Figure 4). There were 46.0–64.8% of the variations in bacterial community during the culture period can be explained by NCM. The R2 of NCM increased as the culture progressed in both the QC and QE groups. The R2 values of the NCM for the QC and QE groups were 0.460 and 0.493 at culture stage I, 0.544 and 0.588 at culture stage Ⅱ, and 0.645 and 0.648 at culture stage Ⅲ, respectively. The m-values also increased as the culture progressed in both the QC and QE groups. The m-value of NCM for the QC group was 0.017 at culture stage I and then increased continuously to 0.031 at culture stage Ⅲ. The m-value for the QE group was 0.02 at culture stage Ⅰ and then increased continuously to 0.033 at culture stage Ⅲ. In contrast to the QC group, the R2, and m-values for NCM in the QE group at the same stage were slightly higher.

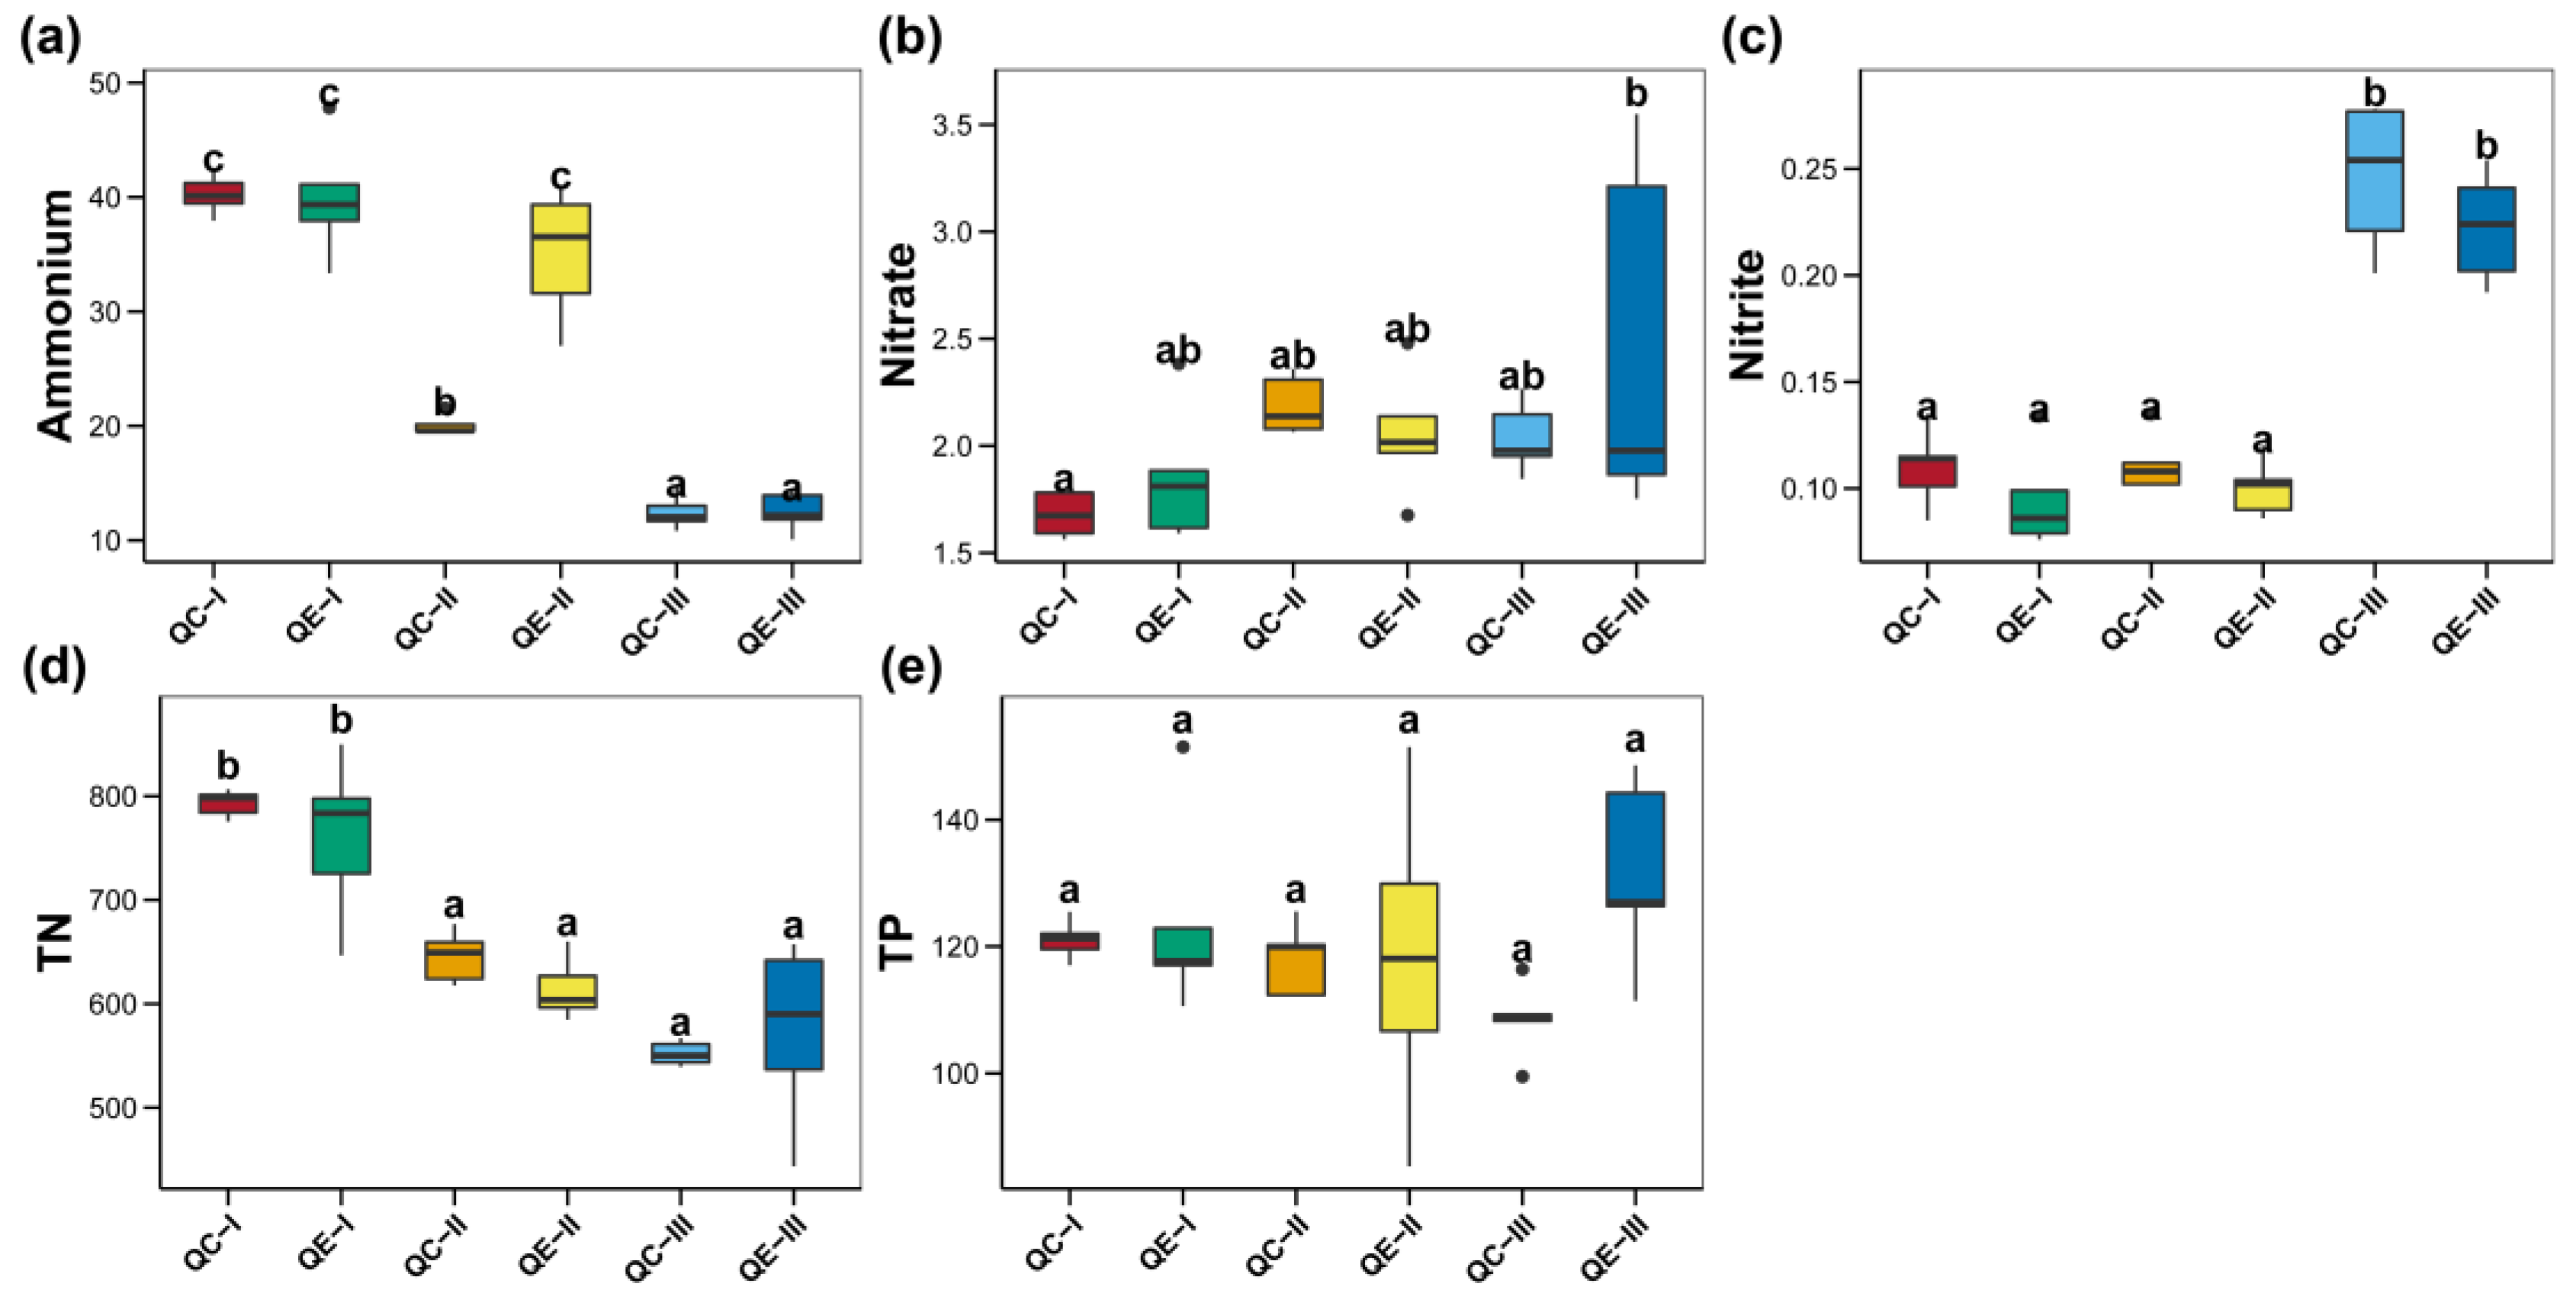
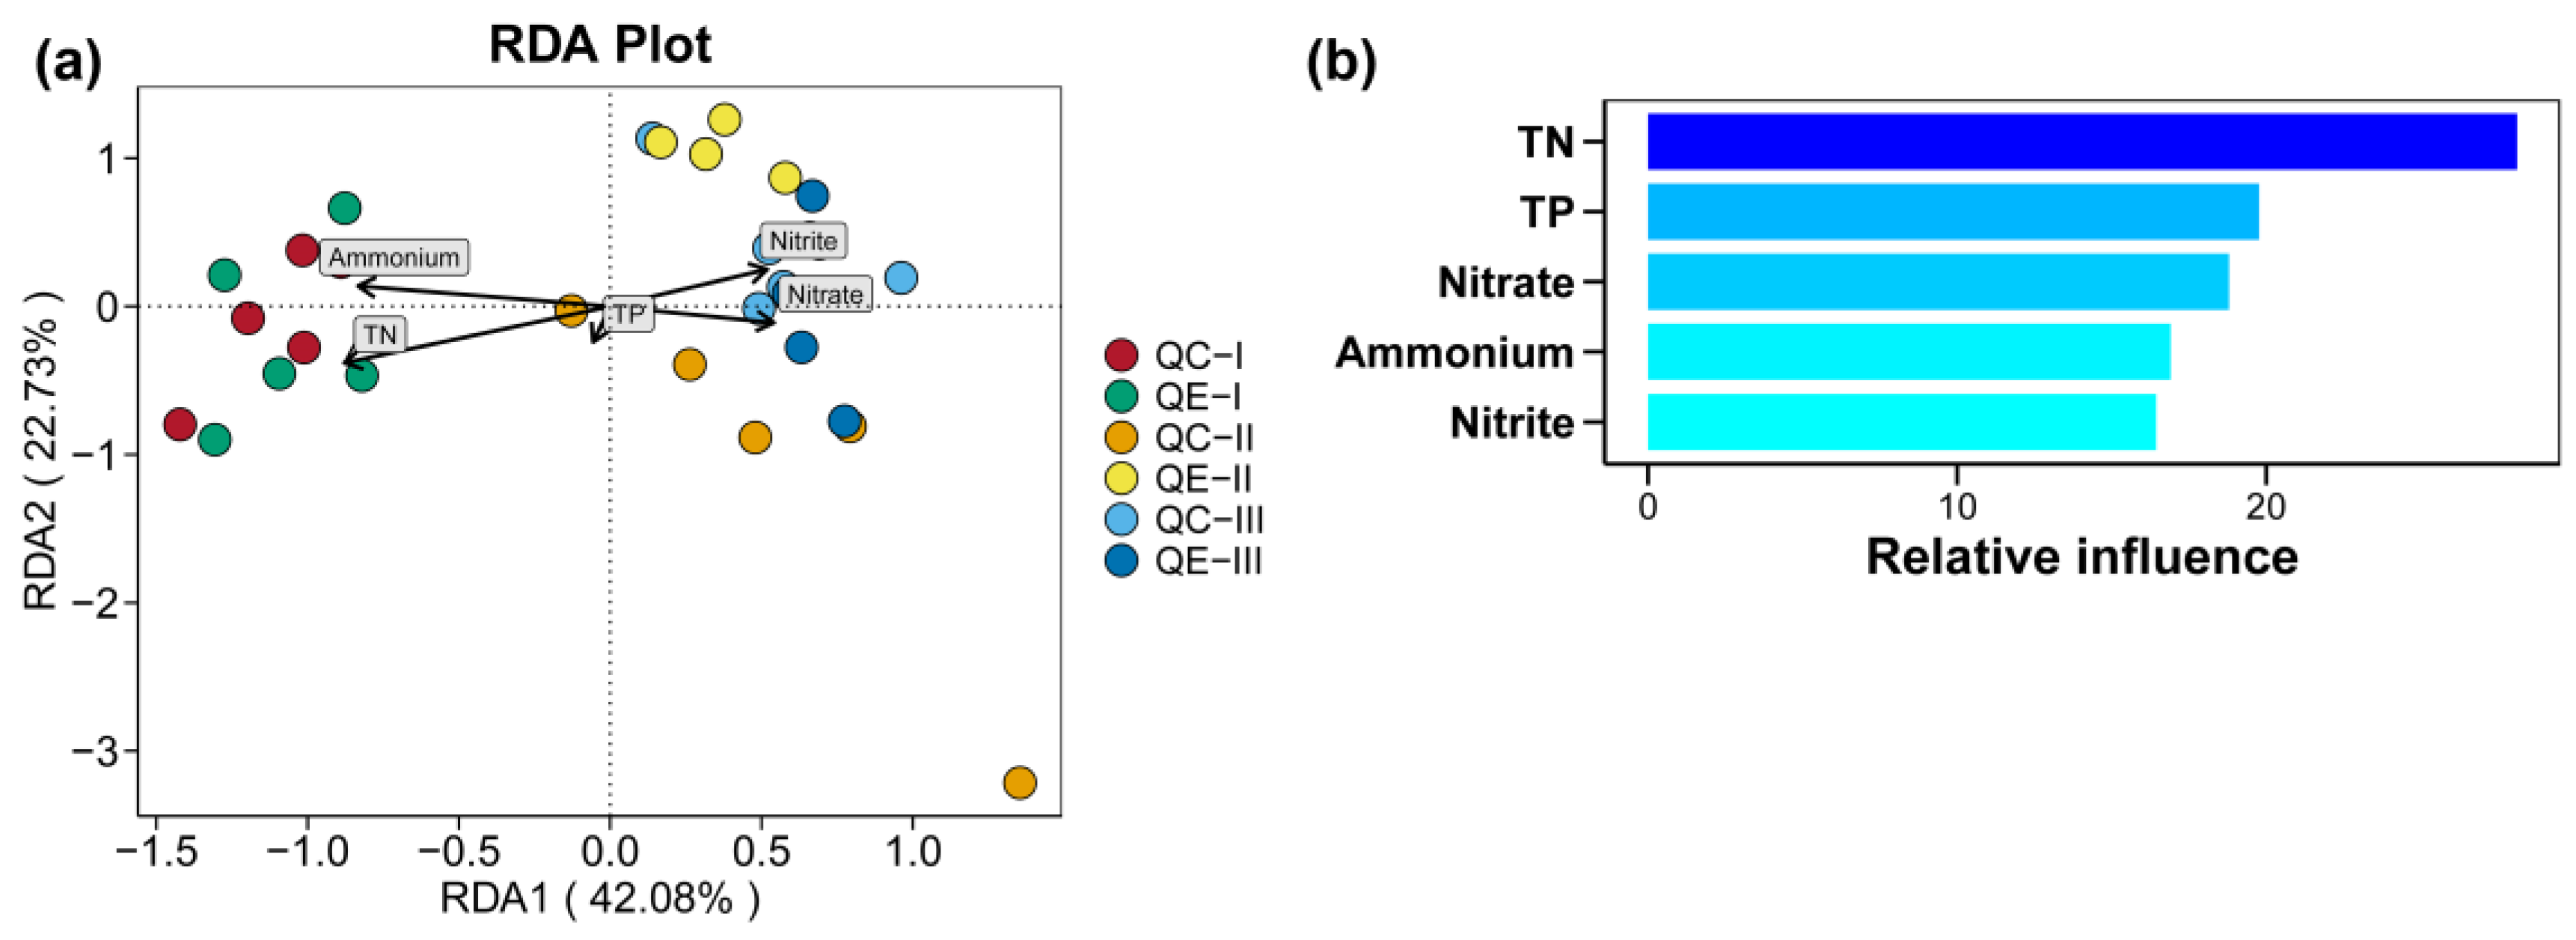
3.5. Effect of Environmental Factors on the Soil Bacterial Communities

Variations in ammonia, nitrate, nitrite, TN, and TP contents in paddy soil for the QC and QE groups during the culture period are shown in Figure 5. There were no significant differences in the nitrate, nitrite, TN, or TP concentrations between the QC and QE groups during the entire culture period (p > 0.05). However, significantly lower ammonia concentration was observed in the QC group than in the QE group at culture stage II (p < 0.05), whereas no significant differences were found in ammonia concentration between the QC and QE groups at both culture stages Ⅰ and Ⅲ (p > 0.05). In terms of temporal variation, both the QC and QE groups showed significantly decreasing trends in ammonia and TN concentrations in the paddy soils over time (p < 0.05). Nitrite concentrations in the paddy soil at culture stage Ⅲ were significantly higher than those at culture stages I and Ⅱ (p < 0.05). No significant temporal changes in the nitrate and TP concentrations of the paddy soils were observed throughout the culture period (p > 0.05).
According to the results of RDA, the determined environmental factors in the present study accounted for 64.81% of the variance in the bacterial communities within the paddy soils (Figure 6a). The bacterial communities displayed significant correlations with most environmental variables except for TP (Table S3). The bacterial communities in paddy soils exhibited distinct variations at different culture stages and were remarkably separated by environmental variables in the RDA. TN and ammonia concentrations showed positive correlations with bacterial communities at culture stage Ⅰ and negatively correlated with bacterial communities at culture stage Ⅲ. However, nitrate and nitrite concentrations were positively correlated with bacterial communities at culture stage Ⅲ and negatively correlated with bacterial communities at culture stage Ⅰ. The most important environmental factor for changes in bacterial communities, based on ABT, was TN, with a relative influence value of 28.11. The relative influences of TP, nitrate, ammonia, and nitrite were 19.76, 18.79, 16.90, and 16.44, respectively.

4. Discussion

4.1. Bacterial Community and Its Composition in Paddy Field Influenced by Red Claw Crayfish

Previous studies on integrated rice–aquatic animal farming systems have shown that aquaculture activities can have an obvious impact on bacterial communities in paddy fields [10,65,66]. Zhao et al. [66] found significant differences in the paddy field bacterial community composition between integrated rice–fish farming systems and rice monoculture fields. Similar to the findings of Arunrat et al. [65], although red claw crayfish cultivation had no significant impacts on the diversity of the bacterial community in the paddy field, it clearly influenced the relative abundances of many bacterial phyla and genera, especially at culture stages Ⅱ and Ⅲ. At culture stages Ⅱ and Ⅲ, red claw crayfish cultivation significantly increased the relative abundances of the phyla Acidobacteriota and Pseudomonadota in paddy soil. Acidobacteriota (previously named Actinobacteria) are highly abundant bacteria in soils, playing an important ecological role in metabolizing complex organic matter, enhancing substance recycling, promoting soil agglomerate formation, removing xenobiotics compounds, and maintaining ecosystem stability [67,68,69]. Pseudomonadota (synonym Proteobacteria) have been reported as the largest phylum in both soils and sediments and can be involved in various biogeochemical processes [69,70]. Proteobacterial microorganisms also play an important ecological role, contributing to nitrogen, phosphorus, and carbon cycling and degrading a variety of environmental organic pollutants [70,71]. Hence, the significantly increased Acidobacteriota and Pseudomonadota might indicate that red claw crayfish cultivation significantly promotes the microbial capacity to break down organic matter and accelerate nitrogen, phosphorus, and carbon cycling mediated by bacteria.

4.2. Bacterial Community Assembly in Paddy Field Influenced by Red Claw Crayfish

According to the results of the NCM for bacterial communities in paddy fields, both stochastic and deterministic processes made nearly equivalent contributions to the assembly of paddy soil bacterial communities in both the QC and QE groups at culture stage I. As the experiment progressed, stochastic processes emerged as the prevailing process in the assembly of bacterial communities across all groups. During culture stage III, the dominance of the stochastic process over the deterministic process was found in the bacterial communities’ assembly. These findings align with previous studies conducted in various aquatic or aquaculture ecosystems, such as ponds, lakes, and recirculating systems, demonstrating the predominance of stochastic processes in controlling bacterial community assembly [21,72,73,74,75]. However, it is worth noting that aquaculture activities in these natural or artificial ecosystems have a very limited impact on the assembly of bacterial communities [73,75]. Zeng et al. [75] found that seasonality played a decisive role in determining bacterial community assembly compared with the slight effects of aquaculture activities. Similarly, Hou et al. [73] discovered a slight effect derived from mandarin fish culture on the bacterioplankton community assembly in crustacean aquaculture ponds. Moreover, the R2 and m-values of the NCM for the QE group in the present study were slightly higher than those for the QC group at each culture stage, which suggests that red claw crayfish cultivation could enhance the mobility of the bacterial community and accelerate the evolution of bacterial community assembly towards a stochastic process.

4.3. Bacterial Community Co-Occurrence Pattern in Paddy Field Influenced by Red Claw Crayfish

Bacteria play a crucial role in paddy soils, contributing to the maintenance of terrestrial ecosystems and fundamental ecological processes, most of which thrive in numerous communities rather than in isolation [76,77,78,79]. Close interactions among bacteria can provide additional advantages to the entire bacterial community, ultimately influencing and shaping its overall structure and function [76,77,79]. Co-occurrence networks of bacteria have been extensively utilized to comprehensively investigate and assess the complex structures and interlinked patterns of bacterial communities [77]. Many studies have found significant variations in bacterial co-occurrence networks in aquaculture ecosystems as farming progresses [21,73,80,81]. In the present study, the edge number in the paddy soil bacterial co-occurrence network for the QE group was much lower than that for the QC group at culture stage I. Edges in the bacterial co-occurrence network indicate interactive relationships between bacterial communities [82]. The much lower edge number for the QE group revealed that red claw crayfish cultivation initially resulted in looser interactions between bacterial communities and decreased bacterial resistance to disturbances [82,83]. However, the negative effects of red claw crayfish cultivation were gradually eliminated as the culture progressed, and the QE group showed more complex bacterial communities and increased resistance to disturbance at culture stage Ⅱ, as suggested by the higher node and edge numbers [82,83]. Meanwhile, in culture stage Ⅱ, the negative edge ratio of the co-occurrence network for the QE group was 43.29%, which was much higher than that for the QC group (34.49%). Negative edges within bacterial co-occurrence networks indicate negative interactions between bacterial communities, encompassing phenomena such as competition, parasitism, and predation, which may arise from various co-exclusion mechanisms, including direct competition, toxin production, environmental modifications, and differential niche adaptation [76,84]. Generally, higher proportions of negative edges in bacterial co-occurrence networks suggest higher intensities of competition or niche differentiation in the soil, and low proportions of negative edges indicate the prevalence of collaboration or niche sharing in contrast [77]. Thus, red claw crayfish cultivation promoted bacterial niche differentiation and increased competition intensity in paddy soil at culture stage II, which was different from the snail Bellamya purificata cultivation reported by Zhou et al. [85]. In Zhou et al. [85] and our study, both snail and red claw crayfish cultivations involved exogenous feed inputs, and the primary reasons for the different results between these two cultivations lay in biomass, disturbance behavior or intensity, and culture environment. In addition to the great variations in culture environment, the red claw crayfish C. quadricarinatus is a macrobenthic species that possesses an extremely high bioturbation capacity, unlike snail B. purificata. Previous studies have shown that crayfish, due to their voracious feeding habits and dietary adaptability, are capable of swiftly depleting all accessible food sources, resulting in dramatic effects on the entire aquatic ecosystem [41,86,87,88,89]. For our study, the enhanced niche differentiation and increased competition intensity in the paddy soil bacterial community at culture stage Ⅱ may have resulted from the rapid growth and dramatic consumption of red claw crayfish.

4.4. Correlations of Environmental Factors with Soil Bacterial Community in Integrated Rice–Crayfish Farming System

Frequent reports have highlighted that variations in environmental conditions can directly influence the composition and distribution of bacterial communities across diverse environments [90,91,92,93]. According to the results of the RDA and ABT analyses, the nitrogen concentrations had a significant effect on the bacterial community in the paddy soil, especially the TN concentration. As in previous studies, TN was found to be a limiting factor for bacterial growth, with bacterial abundance and activity-dependent on its concentration [94]. In addition, red claw crayfish cultivation significantly decreased the ammonia concentration in paddy soil at culture stage Ⅱ of the present study. The activities of benthic fauna can effectively alter the sediment structure and properties, accelerate biogeochemical processes, and accelerate material cycles, thus affecting the bacterial processes of bacterial communities [47,95,96]. Thus, even though the overall impact of red claw crayfish cultivation on environmental factors in paddy soil was limited, red claw crayfish cultivation could still influence the bacterial community by altering the ammonia concentration in the paddy soil during the culture period.

5. Conclusions

Red claw crayfish C. quadricarinatus cultivation, while not significantly affecting the bacterial community diversity in paddy fields, significantly increased the relative abundances of the phyla Acidobacteriota and Pseudomonadota involved in organic matter degradation and nitrogen, phosphorus, and carbon cycling. Red claw crayfish cultivation initially resulted in looser interactions between bacterial communities and decreased bacterial resistance to disturbance. However, the negative effect was gradually eliminated as the culture progressed and instead turned into a positive facilitative effect, with more complex bacterial communities observed at culture stage Ⅱ. Red claw crayfish cultivation also promoted niche differentiation and increased the intensity of competition between bacterial communities at culture stage Ⅱ. During the culture period, nitrogen emerged as a pivotal factor affecting the bacterial community in the paddy field, and red claw crayfish cultivation affected the bacterial community by altering the ammonia concentration in the paddy soil. As the culture progressed, the bacterial community assembly in the paddy soil was predominantly driven by stochastic processes, and red claw crayfish cultivation accelerated the evolution of the bacterial community assembly towards a stochastic process. The results of this study contribute to a deeper comprehension of the effects derived from the red claw crayfish cultivation on the bacterial communities in paddy fields from the perspective of composition and assembly.

Supplementary Materials

The following supporting information can be downloaded at https://www.mdpi.com/article/10.3390/environments10100178/s1, Figure S1: Differences in alpha diversity indices of bacterial communities in paddy soil with and without red claw crayfish Cherax quadricarinatus cultivation during the experimental period. Different lowercase letters above each box in the same sub-figure represent significant differences between groups (Tukey’s HSD test, p < 0.05). QE and QC indicate the red claw crayfish cultivation group and the control group, respectively. I, Ⅱ, and Ⅲ represent three culture stages, which are 25th August, 25th September, and 25th October, respectively. Figure S2: Compositions of bacterial communities at genus level in the paddy soil. (a) Relative abundances of the dominant genera (most abundant top 30) in paddy soil during the experimental period. (b) Significantly different genera in paddy soil between QC and QE groups at the culture stage I. (c) Significantly different genera in paddy soil between QC and QE groups at the culture stage Ⅱ. (c) Significantly different genera in paddy soil between QC and QE groups at the culture stage Ⅲ. QE and QC indicate the red claw crayfish cultivation group and the control group, respectively. I, Ⅱ, and Ⅲ represent three culture stages, which are 25th August, 25th September, and 25th October, respectively. Table S1: Two-way PERMANOVA of culture stages and red claw crayfish Cherax quadricarinatus cultivation for the bacterial community in a paddy field based on the Bray–Curtis distance. Table S2: Topological parameters of co-occurrence networks constructed by bacteria in paddy soil. QE and QC indicate the red claw crayfish cultivation group and the control group, respectively. I, Ⅱ, and Ⅲ represent three culture stages, which are 25th August, 25th September, and 25th October, respectively. Table S3: Significance tests of environmental factors in Redundancy analysis (RDA).

Author Contributions

Y.H.: conceptualization, methodology, formal analysis, data curation, and writing—original draft preparation. R.J., W.S. and H.D.: visualization and investigation. B.L.: visualization, writing, reviewing, and editing. J.Z.: Resources, writing, review, editing, and supervision. All authors have read and agreed to the published version of the manuscript.

Funding

This research was funded by the Central Public-interest Scientific Institution Basal Research Fund, Freshwater Fisheries Research Center, CAFS (Grant No. 2023JBFZ04), the National Natural Science Foundation of China (Grant No. 31802302), the Central Public-interest Scientific Institution Basal Research Fund, CAFS (2020TD60), and the National Key R&D Program of China (2019YFD0900305).

Data Availability Statement

The bacterial datasets used in this study can be found in online repositories. The names of the repositories and their accession numbers (s) are listed in PRJNA967861.

Conflicts of Interest

The authors declare no conflict of interest.

References

  1. Ahmed, N.; Hornbuckle, J.; Turchini, G.M. Blue–green water utilization in rice–fish cultivation towards sustainable food production. Ambio 2022, 51, 1933–1948. [Google Scholar] [CrossRef]
  2. Ahmed, N.; Ward, J.D.; Saint, C.P. Can integrated aquaculture-agriculture (IAA) produce “more crop per drop”? Food Secur. 2014, 6, 767–779. [Google Scholar] [CrossRef]
  3. Cai, S.; Lv, W.; Zhu, H.; Zhang, D.; Fu, Z.; Zhang, H.; Xu, S. Effect of nitrogen application rate on soil fungi community structure in a rice-fish mutualistic system. Sci. Rep. 2019, 9, 16188. [Google Scholar] [CrossRef]
  4. Lu, J.; Li, X. Review of rice–fish-farming systems in China—One of the Globally Important Ingenious Agricultural Heritage Systems (GIAHS). Aquaculture 2006, 260, 106–113. [Google Scholar] [CrossRef]
  5. Wang, Y.; Wang, C.; Chen, Y.; Zhang, D.; Zhao, M.; Li, H.; Guo, P. Microbiome Analysis Reveals Microecological Balance in the Emerging Rice–Crayfish Integrated Breeding Mode. Front. Microbiol. 2021, 12, 669570. [Google Scholar] [CrossRef]
  6. Li, K. Rice fish culture in China—A review. Aquaculture 1988, 71, 173–186. [Google Scholar]
  7. Yu, X.; Hao, X.; Dang, Z.; Yang, L. Industrial development report on integrated rice-fish farming in China (2023). China Fish. News 2023, 3, 1–12. [Google Scholar] [CrossRef]
  8. NBS. Statistical Bulletin of the People’s Republic of China on National Economic and Social Development, 2022; National Bureau of Statistics: Beijing, China, 2023.
  9. Day, J.; Diener, C.; Otwell, A.; Tams, K.; Bebout, B.; Detweiler, A.; Lee, M.; Scott, M.; Ta, W.; Ha, M.; et al. Lettuce (Lactuca sativa) productivity influenced by microbial inocula under nitrogen-limited conditions in aquaponics. PLoS ONE 2021, 16, e0247534. [Google Scholar] [CrossRef]
  10. Herlambang, A.; Murwantoko, M.; Istiqomah, I. Dynamic change in bacterial communities in the integrated rice–fish farming system in Sleman, Yogyakarta, Indonesia. Aquac. Res. 2021, 52, 5566–5578. [Google Scholar] [CrossRef]
  11. Moriarty, D. The role of microorganisms in aquaculture ponds. Aquaculture 1997, 151, 333–349. [Google Scholar] [CrossRef]
  12. Zhao, Z.; Jiang, J.; Pan, Y.; Dong, Y.; Chen, Z.; Zhang, G.; Gao, S.; Sun, H.; Guan, X.; Wang, B.; et al. Temporal dynamics of bacterial communities in the water and sediments of sea cucumber (Apostichopus japonicus) culture ponds. Aquaculture 2020, 528, 735498. [Google Scholar] [CrossRef]
  13. Zhang, J.; Tang, H.; Zhu, J.; Lin, X.; Feng, Y. Effects of elevated ground-level ozone on paddy soil bacterial community and assembly mechanisms across four years. Sci. Total Environ. 2019, 654, 505–513. [Google Scholar] [CrossRef]
  14. Nicholaus, R.; Lukwambe, B.; Zhao, L.; Yang, W.; Zhu, J.; Zheng, Z. Bioturbation of blood clam Tegillarca granosa on benthic nutrient fluxes and microbial community in an aquaculture wastewater treatment system. Int. Biodeterior. Biodegrad. 2019, 142, 73–82. [Google Scholar] [CrossRef]
  15. Nicholaus, R.; Zheng, Z. The effects of bioturbation by the Venus clam Cyclina sinensis on the fluxes of nutrients across the sediment–water interface in aquaculture ponds. Aquac. Int. 2014, 22, 913–924. [Google Scholar] [CrossRef]
  16. Qin, Y.; Hou, J.; Deng, M.; Liu, Q.; Wu, C.; Ji, Y.; He, X. Bacterial abundance and diversity in pond water supplied with different feeds. Sci. Rep. 2016, 6, 35232. [Google Scholar] [CrossRef] [PubMed]
  17. Zheng, X.; Tang, J.; Zhang, C.; Qin, J.; Wang, Y. Bacterial composition, abundance and diversity in fish polyculture and mussel–fish integrated cultured ponds in China. Aquac. Res. 2016, 48, 3950–3961. [Google Scholar] [CrossRef]
  18. Zhou, T.; Wang, Y.; Tang, J.; Dai, Y. Bacterial communities in Chinese grass carp (Ctenopharyngodon idellus) farming ponds. Aquac. Res. 2013, 45, 138–149. [Google Scholar] [CrossRef]
  19. Andersen, C. Source-sink balance and carbon allocation below ground in plants exposed to ozone: Tansley review. New Phytol. 2003, 157, 213–228. [Google Scholar] [CrossRef]
  20. Vellend, M. Conceptual Synthesis in Community Ecology. Q. Rev. Biol. 2010, 85, 183–206. [Google Scholar] [CrossRef]
  21. Hou, Y.; Li, B.; Xu, G.; Li, D.; Zhang, C.; Jia, R.; Li, Q.; Zhu, J. Dynamic and Assembly of Benthic Bacterial Community in an Industrial-Scale In-Pond Raceway Recirculating Culture System. Front. Microbiol. 2021, 12, 797817. [Google Scholar] [CrossRef]
  22. Zhou, L.; Wang, P.; Huang, S.; Li, Z.; Gong, H.; Huang, W.; Zhao, Z.; Yu, Z. Environmental filtering dominates bacterioplankton community assembly in a highly urbanized estuarine ecosystem. Environ. Res. 2021, 196, 110934. [Google Scholar] [CrossRef]
  23. Stegen, J.C.; Fredrickson, J.K.; Wilkins, M.J.; Konopka, A.E.; Nelson, W.C.; Arntzen, E.V.; Chrisler, W.B.; Chu, R.K.; Danczak, R.E.; Fansler, S.J.; et al. Groundwater-surface water mixing shifts ecological assembly processes and stimulates organic carbon turnover. Nat. Commun. 2016, 7, 11237. [Google Scholar] [CrossRef] [PubMed]
  24. Chen, F.; Zhang, Z. Ecological economic analysis of a rice-crab model. Chin. J. Appl. Ecol. 2002, 13, 323–326. [Google Scholar]
  25. Li, F.; Feng, J.; Zhou, X.; Wu, D.; Chen, F.; Xu, C.; Fang, F. Nutrients removal from fish pond by rice planting. Chin. J. Rice Sci. 2015, 29, 174–180. [Google Scholar] [CrossRef] [PubMed]
  26. Liu, M.; Zhang, D.; Li, W. Evaluation of comprehensive benefit of rice-fish agriculture and rice monocropping—A case study of Qingtian County, Zhejiang Province. Chin. J. Eco-Agric. 2010, 18, 164–169. [Google Scholar] [CrossRef]
  27. Liu, Y.; Meng, Q.; He, T.; Luo, H.; Qian, X. Research on water quality dynamics of integrated rice-fish farming and rice growth and economic benefits. Tillage Cultiv. 2003, 5, 5–6. [Google Scholar]
  28. Si, G.; Peng, C.; Xu, X.; Xu, D.; Yuan, J.; Li, J. Effect of integrated rice-crayfish farming system on soil physico-chemical properties in waterlogged paddy soils. Chin. J. Eco-Agric. 2017, 25, 61–68. [Google Scholar]
  29. Sun, G.; Fang, Y.; Han, G.; Fu, Y. Effects of rice -fish integrated ecosystem on physical and chemical properties of paddy soil. Soil Fertil. Sci. China 2009, 4, 21–24. [Google Scholar]
  30. Wang, Q. Regulation and mechanism of greenhouse gas emissions of circular agriculture ecosystem of planting and breeding in paddy. Chin. J. Eco-Agric. 2018, 26, 633–642. [Google Scholar]
  31. Ahyong, S.; Yeo, D. Feral populations of the Australian Red-Claw crayfish (Cherax quadricarinatus von Martens) in water supply catchments of Singapore. Biol. Invasions 2007, 9, 943–946. [Google Scholar] [CrossRef]
  32. Diaz, F.; Re, A.; Sierra, E.; Amador, A.N.D. Behavioral thermoregulation and critical limits applied to culture of red claw crayfish Cherax quadricarinatus (Von Martens). Freshw. Crayfish 2004, 14, 90–98. [Google Scholar]
  33. Zuo, D.; Wu, D.-L.; Ma, C.-A.; Li, H.-X.; Youhui, H.; Wang, D.-L.; Zhao, Y.-L. Effects of white spot syndrome virus infection and role of immune polysaccharides of juvenile Cherax quadricarinatus. Aquaculture 2015, 437, 235–242. [Google Scholar] [CrossRef]
  34. Tao, X.; Li, B.; Yu, Z.; Hou, Y.; Wang, L.; Zhu, J. Effects of rice-crayfish integrated model on root exudates and microorganisms of rice during grain filling. J. Fish. China 2022, 46, 2122–2133. [Google Scholar] [CrossRef]
  35. Yang, H.; Lv, M.; Yang, Y.; Lu, T.; Tong, T.; Liang, J.; Yang, Q.; Zhang, Q.; Huang, Z.; Wang, R. Study on the correlation in Cherax quadricarinatus cultured in rice field between body size and intestinal microbiota. Freshw. Fish. 2022, 52, 14–20. [Google Scholar]
  36. Yang, W.; Zhang, J.; Liang, Z.; Huang, F.; Cui, M. Integrated rice-red claw crayfish farming technology. Fish. Guide Be Rich. 2021, 24, 50–51. [Google Scholar]
  37. He, J.; Zhang, X.; Jiang, Z.; Jiang, Y.; Luo, S. Effects of integrated rice-red claw crayfish Cherax quadricarinatus on water environment. Jiangsu Agric. Sci. 2019, 47, 213–215. [Google Scholar]
  38. Angeler, D.; Sánchez-Carrillo, S.; Garcia, G.; Alvarez-Cobelas, M. The influence of Procambarus clarkii (Cambaridae, Decapoda) on water quality and sediment characteristics in a Spanish floodplain wetland. Hydrobiologia 2001, 464, 89–98. [Google Scholar] [CrossRef]
  39. Gutiérrez-Yurrita, P.; Marténez, J.; Bravo-Utrera, M.; Montes, C.; Ilhéu, M.; Bernardo, J. The Status of Crayfish Populations in Spain and Portugal; Routledge: New York, NY, USA, 2017; pp. 161–192. [Google Scholar]
  40. Gutiérrez-Yurrita, P.; Montes, C. Bioenergetics of juveniles of red swamp crayfish (Procambarus clarkii). Comp. Biochem. Physiol. Part A Mol. Integr. Physiol. 2001, 130, 29–38. [Google Scholar] [CrossRef]
  41. Ilhéu, M.; Bernardo, J. Aspects of trophic ecology of red swamp crayfish (Procambarus clarkii Girard) in Alentejo, South of Portugal. In Proceedings of the Actas VI Congreso Español de Limnología, Granada, Spain, 9–13 September 1991; pp. 417–423. [Google Scholar]
  42. Lodge, D.; Hill, A.M. Factors governing species composition, population size and productivity of coolwater crayfishes. Nord. J. Freshw. Res. 1994, 69, 111–136. [Google Scholar]
  43. Momot, W. Redefining the Role of Crayfish in Aquatic Ecosystems. Rev. Fish. Sci. 1995, 3, 33–63. [Google Scholar] [CrossRef]
  44. Aller, R.C. Benthic fauna and biogeochemical processes in marine sediments: The role of burrow structures. In Nitrogen Cycling in Coastal Marine Environments; Blackburn, T.H., Sorensen, J., Eds.; John Wiley & Sons Ltd.: Hoboken, NJ, USA, 1988; pp. 301–338. [Google Scholar]
  45. Hou, Y.; Li, B.; Luo, J.; Zhang, C.; He, J.; Zhu, J. Effect of Bellamya purificata on organic matter degradation in surface sediment as revealed by amino acids. Aquac. Environ. Interact. 2021, 13, 1–12. [Google Scholar] [CrossRef]
  46. Laverock, B.; Smith, C.J.; Tait, K.; Osborn, A.M.; Widdicombe, S.; Gilbert, J.A. Bioturbating shrimp alter the structure and diversity of bacterial communities in coastal marine sediments. ISME J. 2010, 4, 1531–1544. [Google Scholar] [CrossRef]
  47. Mermillodblondin, F.; Rosenberg, R.; Francoiscarcaillet, F.; Norling, K.; Mauclaire, L. Influence of bioturbation by three benthic infaunal species on microbial communities and biogeochemical processes in marine sediment. Aquat. Microb. Ecol. 2004, 36, 271–284. [Google Scholar] [CrossRef]
  48. Murray, J.M.H.; Meadows, A.; Meadows, P.S. Biogeomorphological implications of microscale interactions between sediment geotechnics and marine benthos: A review. Geomorphology 2002, 47, 15–30. [Google Scholar] [CrossRef]
  49. Pelegrí, S.P.; Blackburn, T.H. Bioturbation effects of the amphipod Corophium volutator on microbial nitrogen transformations in marine sediments. Mar. Biol. 1994, 121, 253–258. [Google Scholar] [CrossRef]
  50. Rugenski, A.T.; Murria, C.; Whiles, M.R. Tadpoles enhance microbial activity and leaf decomposition in a neotropical headwater stream. Freshw. Biol. 2012, 57, 1904–1913. [Google Scholar] [CrossRef]
  51. Stockdale, A.; Davison, W.; Zhang, H. Micro-scale biogeochemical heterogeneity in sediments: A review of available technology and observed evidence. Earth-Sci. Rev. 2009, 92, 81–97. [Google Scholar] [CrossRef]
  52. Zhang, H.; Tu, J.; Lin, F.; Guo, J.; Lu, D.; Guo, S. A preliminary study on the technology of integrated rice-red claw crayfish farming. Sci. Fish. Farming 2019, 3, 28–30. [Google Scholar]
  53. Ministry of Environmental Protection of the People’s Republic of China. Soil-Determination of Total Phosphorus by Alkali Fusion–Mo-Sb Anti Spectrophotometric Method; Ministry of Environmental Protection of the People’s Republic of China: Beijing, China, 2011.
  54. Norman, A.; Bremner, J. Inorganic Forms of Nitrogen; American Society of Agronomy: Madison, WI, USA, 1965. [Google Scholar]
  55. Lei, Y.; Zang, W.; Yang, F.; Jiang, M.; Xu, H.; Zhang, M.; Zhang, G.; Jiang, L. Aquaculture Water Environment Chemistry Experiment; China Agricultural Press: Beijing, China, 2006. [Google Scholar]
  56. Berg, J.; Brandt, K.; Abu Al-Soud, W.; Holm, P.; Hansen, L.; Sørensen, S.; Nybroe, O. Selection for Cu-Tolerant Bacterial Communities with Altered Composition, but Unaltered Richness, via Long-Term Cu Exposure. Appl. Environ. Microbiol. 2012, 78, 7438–7446. [Google Scholar] [CrossRef]
  57. Hou, Y.; Jia, R.; Ji, P.; Li, B.; Zhu, J. Organic matter degradation and bacterial communities in surface sediment influenced by Procambarus clarkia. Front. Microbiol. 2022, 13, 985555. [Google Scholar] [CrossRef]
  58. Bokulich, N.A.; Subramanian, S.; Faith, J.J.; Gevers, D.; Gordon, J.I.; Knight, R.; Mills, D.A.; Caporaso, J.G. Quality-filtering vastly improves diversity estimates from Illumina amplicon sequencing. Nat. Methods 2013, 10, 57–59. [Google Scholar] [CrossRef] [PubMed]
  59. Magoč, T.; Salzberg, S.L. FLASH: Fast length adjustment of short reads to improve genome assemblies. Bioinformatics 2011, 27, 2957–2963. [Google Scholar] [CrossRef] [PubMed]
  60. Bokulich, N.A.; Kaehler, B.D.; Rideout, J.R.; Dillon, M.; Bolyen, E.; Knight, R.; Huttley, G.A.; Caporaso, J.G. Optimizing taxonomic classification of marker-gene amplicon sequences with QIIME 2 ‘ s q2-feature-classifier plugin. Microbiome 2018, 6, 90. [Google Scholar] [CrossRef] [PubMed]
  61. Callahan, B.J.; McMurdie, P.J.; Rosen, M.J.; Han, A.W.; Johnson, A.J.A.; Holmes, S.P. DADA2: High-resolution sample inference from Illumina amplicon data. Nat. Methods 2016, 13, 581–583. [Google Scholar] [CrossRef] [PubMed]
  62. Yilmaz, P.; Parfrey, L.W.; Yarza, P.; Gerken, J.; Pruesse, E.; Quast, C.; Schweer, T.; Peplies, J.; Ludwig, W.; Glöckner, F.O. The SILVA and “All-species Living Tree Project (LTP)” taxonomic frameworks. Nucleic Acids Res. 2014, 42, D643–D648. [Google Scholar] [CrossRef] [PubMed]
  63. Barberan, A.; Bates, S.T.; Casamayor, E.O.; Fierer, N. Using network analysis to explore co-occurrence patterns in soil microbial communities. ISME J. 2012, 6, 343–351. [Google Scholar] [CrossRef]
  64. Sloan, W.T.; Lunn, M.; Woodcock, S.; Head, I.M.; Nee, S.; Curtis, T.P. Quantifying the roles of immigration and chance in shaping prokaryote community structure. Environ. Microbiol. 2006, 8, 732–740. [Google Scholar] [CrossRef]
  65. Arunrat, N.; Sansupa, C.; Kongsurakan, P.; Sereenonchai, S.; Hatano, R. Soil Microbial Diversity and Community Composition in Rice-Fish Co-Culture and Rice Monoculture Farming System. Biology 2022, 11, 1242. [Google Scholar] [CrossRef]
  66. Zhao, Z.; Chu, C.B.; Zhou, D.P.; Wang, Q.F.; Wu, S.H.; Zheng, X.Q.; Song, K.; Lv, W.G. Soil bacterial community composition in rice-fish integrated farming systems with different planting years. Sci. Rep. 2021, 11, 10855. [Google Scholar] [CrossRef]
  67. Alvarez, A.; Maria Saez, J.; Davila Costa, J.S.; Leticia Colin, V.; Soledad Fuentes, M.; Antonio Cuozzo, S.; Susana Benimeli, C.; Alejandra Polti, M.; Julia Amoroso, M. Actinobacteria: Current research and perspectives for bioremediation of pesticides and heavy metals. Chemosphere 2017, 166, 41–62. [Google Scholar] [CrossRef]
  68. Bull, A.T.; Stach, J.E.M.; Ward, A.C.; Goodfellow, M. Marine actinobacteria: Perspectives, challenges, future directions. Antonie Van. Leeuwenhoek Int. J. Gen. Mol. Microbiol. 2005, 87, 65–79. [Google Scholar] [CrossRef] [PubMed]
  69. Oren, A.; Garrity, G.M. Valid publication of the names of forty-two phyla of prokaryotes. J. Syst. Evol. Microbiol. 2021, 71, 005056. [Google Scholar] [CrossRef] [PubMed]
  70. Cheng, W.; Zhang, J.; Wang, Z.; Wang, M.; Xie, S. Bacterial communities in sediments of a drinking water reservoir. Ann. Microbiol. 2014, 64, 875–878. [Google Scholar] [CrossRef]
  71. Fan, Y.-Y.; Li, B.-B.; Yang, Z.-C.; Cheng, Y.-Y.; Liu, D.-F.; Yu, H.-Q. Mediation of functional gene and bacterial community profiles in the sediments of eutrophic Chaohu Lake by total nitrogen and season. Environ. Pollut. 2019, 250, 233–240. [Google Scholar] [CrossRef] [PubMed]
  72. Hou, D.W.; Zhou, R.J.; Zeng, S.Z.; Wei, D.D.; Deng, X.S.; Xing, C.G.; Weng, S.P.; He, J.G.; Huang, Z.J. Stochastic processes shape the bacterial community assembly in shrimp cultural pond sediments. Appl. Microbiol. Biotechnol. 2021, 105, 5013–5022. [Google Scholar] [CrossRef]
  73. Hou, Y.R.; Jia, R.; Li, B.; Zhu, J. Apex Predators Enhance Environmental Adaptation but Reduce Community Stability of Bacterioplankton in Crustacean Aquaculture Ponds. Int. J. Mol. Sci. 2022, 23, 10785. [Google Scholar] [CrossRef]
  74. Qin, M.Y.; Xu, H.M.; Zeng, J.; Zhao, D.Y.; Yu, Z.B.; Wu, Q.L.L. Composition and assembly of bacterial communities in surface and deeper sediments from aquaculture-influenced sites in Eastern Lake Taihu, China. Aquat. Sci. 2020, 82, 80. [Google Scholar] [CrossRef]
  75. Zeng, J.; Lin, Y.Q.; Zhao, D.Y.; Huang, R.; Xu, H.M.; Jiao, C.C. Seasonality overwhelms aquacultural activity in determining the composition and assembly of the bacterial community in Lake Taihu, China. Sci. Total Environ. 2019, 683, 427–435. [Google Scholar] [CrossRef]
  76. Faust, K.; Raes, J. Microbial interactions: From networks to models. Nat. Rev. Microbiol. 2012, 10, 538–550. [Google Scholar] [CrossRef]
  77. Ma, B.; Wang, Y.L.; Ye, S.D.; Liu, S.; Stirling, E.; Gilbert, J.A.; Faust, K.; Knight, R.; Jansson, J.K.; Cardona, C.; et al. Earth microbial co-occurrence network reveals interconnection pattern across microbiomes. Microbiome 2020, 8, 82. [Google Scholar] [CrossRef]
  78. Pu, Q.; Zhang, K.; Poulain, A.J.; Liu, J.; Zhang, R.; Abdelhafiz, M.A.; Meng, B.; Feng, X.B. Mercury drives microbial community assembly and ecosystem multifunctionality across a Hg contamination gradient in rice paddies. J. Hazard. Mater. 2022, 435, 129055. [Google Scholar] [CrossRef] [PubMed]
  79. Rottjers, L.; Faust, K. From hairballs to hypotheses-biological insights from microbial networks. Fems Microbiol. Rev. 2018, 42, 761–780. [Google Scholar] [CrossRef] [PubMed]
  80. Ding, Y.H.; Chen, N.; Ke, J.D.; Qi, Z.Y.; Chen, W.J.; Sun, S.Z.; Zheng, Z.M.; Xu, J.L.; Yang, W. Response of the rearing water bacterial community to the beneficial microalga Nannochloropsis oculata cocultured with Pacific white shrimp (Litopenaeus vannamei). Aquaculture 2021, 542, 736895. [Google Scholar] [CrossRef]
  81. Qin, M.Y.; Xu, H.M.; Zhao, D.Y.; Zeng, J.; Wu, Q.L.L. Aquaculture drives distinct patterns of planktonic and sedimentary bacterial communities: Insights into co-occurrence pattern and assembly processes. Environ. Microbiol. 2022, 24, 4079–4093. [Google Scholar] [CrossRef] [PubMed]
  82. Shaw, G.T.-W.; Liu, A.-C.; Weng, C.-Y.; Chen, Y.-C.; Chen, C.-Y.; Weng, F.C.-H.; Wang, D.; Chou, C.-Y. A network-based approach to deciphering a dynamic microbiome’s response to a subtle perturbation. Sci. Rep. 2020, 10, 19530. [Google Scholar] [CrossRef] [PubMed]
  83. Hunt, D.E.; Ward, C.S. A network-based approach to disturbance transmission through microbial interactions. Front. Microbiol. 2015, 6, 1182. [Google Scholar] [CrossRef]
  84. Decaestecker, E.; Gaba, S.; Raeymaekers, J.A.M.; Stoks, R.; Van Kerckhoven, L.; Ebert, D.; De Meester, L. Host–parasite ‘Red Queen’ dynamics archived in pond sediment. Nature 2007, 450, 870–873. [Google Scholar] [CrossRef]
  85. Zhou, M.; Hou, Y.; Jia, R.; Li, B.; Zhu, J. Effects of Bellamya purificata Cultivation at Different Stocking Densities on the Dynamics and Assembly of Bacterial Communities in Sediment. Biomolecules 2023, 13, 254. [Google Scholar] [CrossRef]
  86. Gutiérrez-Yurrita, P.; Sancho, G.; Bravo-Utrera, M.; Baltanas, A.; Montes, C. Diet of the Red Swamp Crayfish Procambarus clarkii in Natural Ecosystems of the Doñana National Park Temporary Fresh-Water Marsh (Spain). J. Crustac. Biol. 1998, 8, 120–127. [Google Scholar] [CrossRef]
  87. Lodge, D.; Kershner, M.; Aloi, J.; Covich, A. Effects of an Omnivorous Crayfish (Orconectes rusticus) on a Freshwater Littoral Food Web. Ecology 1994, 75, 1265. [Google Scholar] [CrossRef]
  88. McCormick, P.V. Direct and Indirect Effects of Consumers on Benthic Algae in Isolated Pools of an Ephemeral Stream. Can. J. Fish. Aquat. Sci. 1990, 47, 2057–2065. [Google Scholar] [CrossRef]
  89. NystrÖM, P.E.R.; Brönmark, C.; Graneli, W. Patterns in benthic food webs: A role for omnivorous crayfish? Freshw. Biol. 1996, 36, 631–646. [Google Scholar] [CrossRef]
  90. Ouyang, L.; Chen, H.; Liu, X.; Wong, M.H.; Xu, F.; Yang, X.; Xu, W.; Zeng, Q.; Wang, W.; Li, S. Characteristics of spatial and seasonal bacterial community structures in a river under anthropogenic disturbances. Environ. Pollut. 2020, 264, 114818. [Google Scholar] [CrossRef] [PubMed]
  91. Rath, K.M.; Fierer, N.; Murphy, D.V.; Rousk, J. Linking bacterial community composition to soil salinity along environmental gradients. ISME J. 2019, 13, 836–846. [Google Scholar] [CrossRef] [PubMed]
  92. Zhao, Z.; Pan, Y.; Jiang, J.; Gao, S.; Sun, H.; Dong, Y.; Sun, P.; Guan, X.; Zhou, Z. Unrevealing variation of microbial communities and correlation with environmental variables in a full culture-cycle of Undaria pinnatifida. Mar. Environ. Res. 2018, 139, 46–56. [Google Scholar] [CrossRef]
  93. Guan, X.; Wang, B.; Duan, P.; Tian, J.; Dong, Y.; Jiang, J.; Sun, B.; Zhou, Z. The dynamics of bacterial community in a polyculture aquaculture system of Penaeus chinensis, Rhopilema esculenta and Sinonovacula constricta. Aquac. Res. 2020, 51, 1789–1800. [Google Scholar] [CrossRef]
  94. Kolukirik, M.; Ince, O.; Cetecioglu, Z.; Celikkol, S.; Ince, B.K. Spatial and temporal changes in microbial diversity of the Marmara Sea Sediments. Mar. Pollut. Bull. 2011, 62, 2384–2394. [Google Scholar] [CrossRef]
  95. Gilbert, F.; Bonin, P.; Stora, G. Effect of bioturbation on denitrification in a marine sediment from the West Mediterranean littoral. Hydrobiologia 1995, 304, 49–58. [Google Scholar] [CrossRef]
  96. Nogaro, G.; Mermillod-Blondin, F.; Valett, H.; Carcaillet, F.; Gaudet, J.-P.; Lafont, M.; Gibert, J. Ecosystem engineering at the sediment-water interface: Bioturbation and consumer-substrate interaction. Oecologia 2009, 161, 125–138. [Google Scholar] [CrossRef]
Figure 1. Differences in beta diversities of bacterial communities in paddy soil with and without red claw crayfish Cherax quadricarinatus cultivation during the experimental period. (a) Principal coordinate analysis (PCoA) of bacterial communities in paddy soil among different groups. (b) Differences in the Bray–Curtis distances of bacterial communities in paddy soil among different groups. Significant differences between groups in the same sub-figure are indicated by different lowercase letters above each box (Tukey’s HSD test, p < 0.05). QE and QC indicate the red claw crayfish cultivation group and the control group, respectively. I, Ⅱ, and Ⅲ represent three culture stages that are 25 August, 25 September, and 25 October, respectively.
Environments 10 00178 g001
Figure 2. Composition and difference of the bacterial community at phylum level within paddy soils. (a) Relative abundances of the dominant phyla (most abundant top 10) in paddy soil during the experimental period. (b) Significantly different phyla in paddy soil between the QC and QE groups at culture stage Ⅱ. (c) Significantly different phyla in paddy soil between the QC and QE groups at culture stage Ⅲ. QE and QC indicate the red claw crayfish cultivation group and the control group, respectively. Ⅰ, Ⅱ, and Ⅲ represent three culture stages that are 25 August, 25 September, and 25 October, respectively.
Environments 10 00178 g002
Figure 3. Co-occurrence networks of bacterial communities in the paddy field for QC and QE groups during the culture period. In the respective networks, modules are visually distinguished by being labeled in different colors. QE and QC indicate the red claw crayfish cultivation group and the control group, respectively. Ⅰ, Ⅱ, and Ⅲ represent three culture stages, which are 25 August, 25 September, and 25 October, respectively.
Environments 10 00178 g003
Figure 4. Fit of the neutral community model (NCM) for bacterial communities in the QC and QE groups. The best fit to the NCM was represented by solid lines, while the dashed lines indicated the 95% confidence intervals around the model prediction. The parameter “m” denoted immigration, and the value of “R2” represented the goodness of fit to the model. QE and QC indicate the red claw crayfish cultivation group and the control group, respectively. I, Ⅱ, and Ⅲ represent three culture stages, which are 25 August, 25 September, and 25 October, respectively.
Environments 10 00178 g004
Figure 5. Differences in environmental factors within sediment between QC and QE groups, including ammonia (a), nitrate (b), nitrite (c), total nitrogen (d), and total phosphorus (e). Significant differences between groups in the same sub-figure are indicated by different lowercase letters above each box (Tukey’s HSD test, p < 0.05). QE and QC indicate the red claw crayfish cultivation group and the control group, respectively. I, Ⅱ, and Ⅲ represent three culture stages, which are 25 August, 25 September, and 25 October, respectively.
Environments 10 00178 g005
Figure 6. Effects of environmental factors on the bacterial communities in paddy soil. (a) Redundancy analysis (RDA) for accessing the relationships between the bacterial communities and environmental variables. (b) Aggregated boosted tree (ABT) for accessing the importance of environmental variables for changes in bacterial communities. QE and QC indicate the red claw crayfish cultivation group and the control group, respectively. I, Ⅱ, and Ⅲ represent three culture stages, which are 25 August, 25 September, and 25 October, respectively.
Environments 10 00178 g006
Disclaimer/Publisher’s Note: The statements, opinions and data contained in all publications are solely those of the individual author(s) and contributor(s) and not of MDPI and/or the editor(s). MDPI and/or the editor(s) disclaim responsibility for any injury to people or property resulting from any ideas, methods, instructions or products referred to in the content.

