1. Introduction
Petroleum-derived spray oil (PDSO) has been employed to control insect and fungal pests of horticultural production systems for over a hundred years [
1,
2]. Owing to its low mammalian toxicity and environmental risk, appreciation for PDSO by practitioners remains ongoing. Civitas Pre-M1xed Turf Defense™ (Intelligro, Mississauga, ON, Canada) comprises a popular and widely-available PDSO plus Cu II phthalocyanine liquid product for inclusion in turfgrass spray applications as a spray pattern indicator, dormancy colorant, and/or combination product synergist.
The impetus for the latter includes reports of reduced pesticide requirements when using Civitas in a disease management program [
3,
4,
5,
6,
7,
8,
9]. Having a unique mode of action relative to traditional fungicides, Civitas features a fungicide resistance action committee (FRAC) classification of “not” [
10], is OMRI listed (Organic Materials Review Institute, Eugene, OR), and proves useful in organic management programs or where cosmetic pesticide use is prohibited.
Application of PDSO results in a coating of the plant canopy, to which an often-characterized leaf chlorosis is attributed. This response has been correlated to reduced photosynthetic capacity arising from the inhibition of gas exchange [
11,
12,
13]. In the second year of continual treatment, repeated 55 L ha
–1 application of PDSO or PDSO–colorant combination product to maintained putting greens was reported to reduce creeping bentgrass (
Agrostis stolonifera L.) canopy quality, chlorophyll content, carbon dioxide exchange and transpiration rates [
14,
15,
16,
17]. Semimonthly application of Civitas Pre-M1xed Turf Defense™ (27 L ha
–1) to an annual bluegrass (
Poa annua L.) putting green in Oregon from Sept. to June significantly reduced canopy density on plots subjected to 5 d week
–1 double-rolling treatment [
18].
However, studies describing ethephon-complementing, one-time, 54 L ha
–1 application of Civitas to putting greens cohabited by creeping bentgrass and annual bluegrass proved synergistic in suppressing seedheads and did not incite a phytotoxic response [
19]. The current Civitas Turf Defense Pre-M1xed label (revised 2017 November) recommends an application rate between 27 and 55 L ha
–1, made on no less than 7-d intervals, either alone or in combination with routine tank mix ingredients.
Foliar application of liquid N fertilizer is a popular approach to ensuring golf course turfgrass nutritional sufficiency in season [
20,
21]. For turfgrass managers using primarily urea-N fertilizer, the N loss pathway of concern is ammonia (NH
3) volatilization. Turfgrass systems’ notable susceptibility to this fertilizer N loss is a result of its elevated urease activity relative to bare soil, which has been recognized for no less than sixty years [
22]. Once in aqueous solution and proximity of urease, urea undergoes hydrolysis as described by Chin and Kroonjte [
23]. Resulting NH
3 then either diffuses to atmosphere or is sequestered as plant available ammonium (NH
4+).
Given that urease is not consumed in substrate hydrolysis, abundant urease in turfgrass vegetation, thatch/litter, and soil furthers uninhibited transformation [
24]. As much as 11% of 20 kg ha
–1 foliar urea-N applications to a golf course putting green were volatilized as NH
3 within 24 h [
25]. More recent field evaluations showed between 3 and 8% of 7 to 10 kg ha
–1 urea-N foliar applications were lost in the 24 h following golf course putting green treatment [
26].
Although not an uncommon practice of golf course superintendents, little research has evaluated urea-N and PDSO–colorant combination products when foliar-fertilizing cool-season turfgrass fairways. In a 2015 colonial bentgrass (
Agrostis capillaris L.) fairway study, clippings collected from negative control, positive control (Civitas Turf Defense
TM Pre-M1xed treatment at 27 L ha
–1), and Civitas combined with 5 kg ha
–1 soluble-N treatment plots were analyzed for N concentration. Clippings from plots treated only by Civitas showed significantly greater tissue N content than untreated control plots [
27].
Considering coating of the plant canopy by PDSO is the mechanism by which reduced carbon dioxide exchange and transpiration rate is often attributed, the authors hypothesize PDSO inclusion may influence NH3 diffusion (volatilization) in the 0- to 48-h following foliar fertilization of golf course fairways by urea-based N fertilizers. The objective of this research is to quantify how efficacy of creeping bentgrass golf course fairway foliar fertilization by urea-based N fertilizers is influenced by PDSO plus Cu II phthalocyanine product inclusion (Civitas Turf DefenseTM Pre-M1xed, Intelligro LLC, Mississauga, ON, Canada).
2. Materials and Methods
The experiment was initiated in 2019 on a Hagerstown silt loam (fine, mixed, semiactive, mesic, Typic Hapludalf) maintained as a ‘Declaration’ creeping bentgrass fairway within the Valentine Turfgrass Research Center (University Park, PA, USA). The upper 15-cm soil profile, thatch excluded, was thoroughly sampled in April 2019 and submitted to the Penn State Univ. Agricultural Analytical Services Laboratory (PSU-AASL; University Park, PA) for routine soil analysis [
28,
29,
30].
The fairway was irrigated with potable water as necessary to prevent drought stress and treated with paclobutrazol per label directions (Trimmit 2SC, Syngenta Crop Protection Inc., Greensboro, NC, USA) on a semimonthly basis. Maintenance fertilizer treatments applied fractionally between March and June delivered nutrient totals of 24.4 kg K, 18.8 kg P, and 0.6 kg Fe ha–1 in 2019, and 39 kg N, 2.4 kg Mg, 0.6 kg S, 2.2 kg Fe, and 1.0 kg Mn ha–1 in 2020.
2.1. Ammonia Volatilization Measurement
Treatments were arranged in a randomized complete block design of five blocks separated by 0.6-m buffers and containing seven plots 1.83 × 0.92 m in size. Foliar applications supplied 9.76 kg ha–1 of soluble N by: urea (46% N, Alfa-Aesar), urea ammonium nitrate, UAN (30% N, Plant Food Co. Inc., Cranbury, NJ, USA), or methylol urea, MU (30% N, Nitamin, Koch Agronomic Services LLC, Wichita, KS, USA). Containing 46, 15, or 12% free urea by mass respectively, these soluble N fertilizer treatments were randomly assigned to two plots in each block. One of the two was further randomly selected for complementation by a PDSO plus synthetic Cu II phthalocyanine combination product (Civitas PreM1xed Turf Defense) at a 27 L ha–1 rate. A control plot was retained for identical treatment by distilled water spray application in each block.
The seven described treatments were applied every 11 ± 4 d from 24 May to 1 October 2019 and 13 May to 29 August 2020 in 611 L ha
–1 carrier volume using a single nozzle (TeeJet 11008EVS) CO
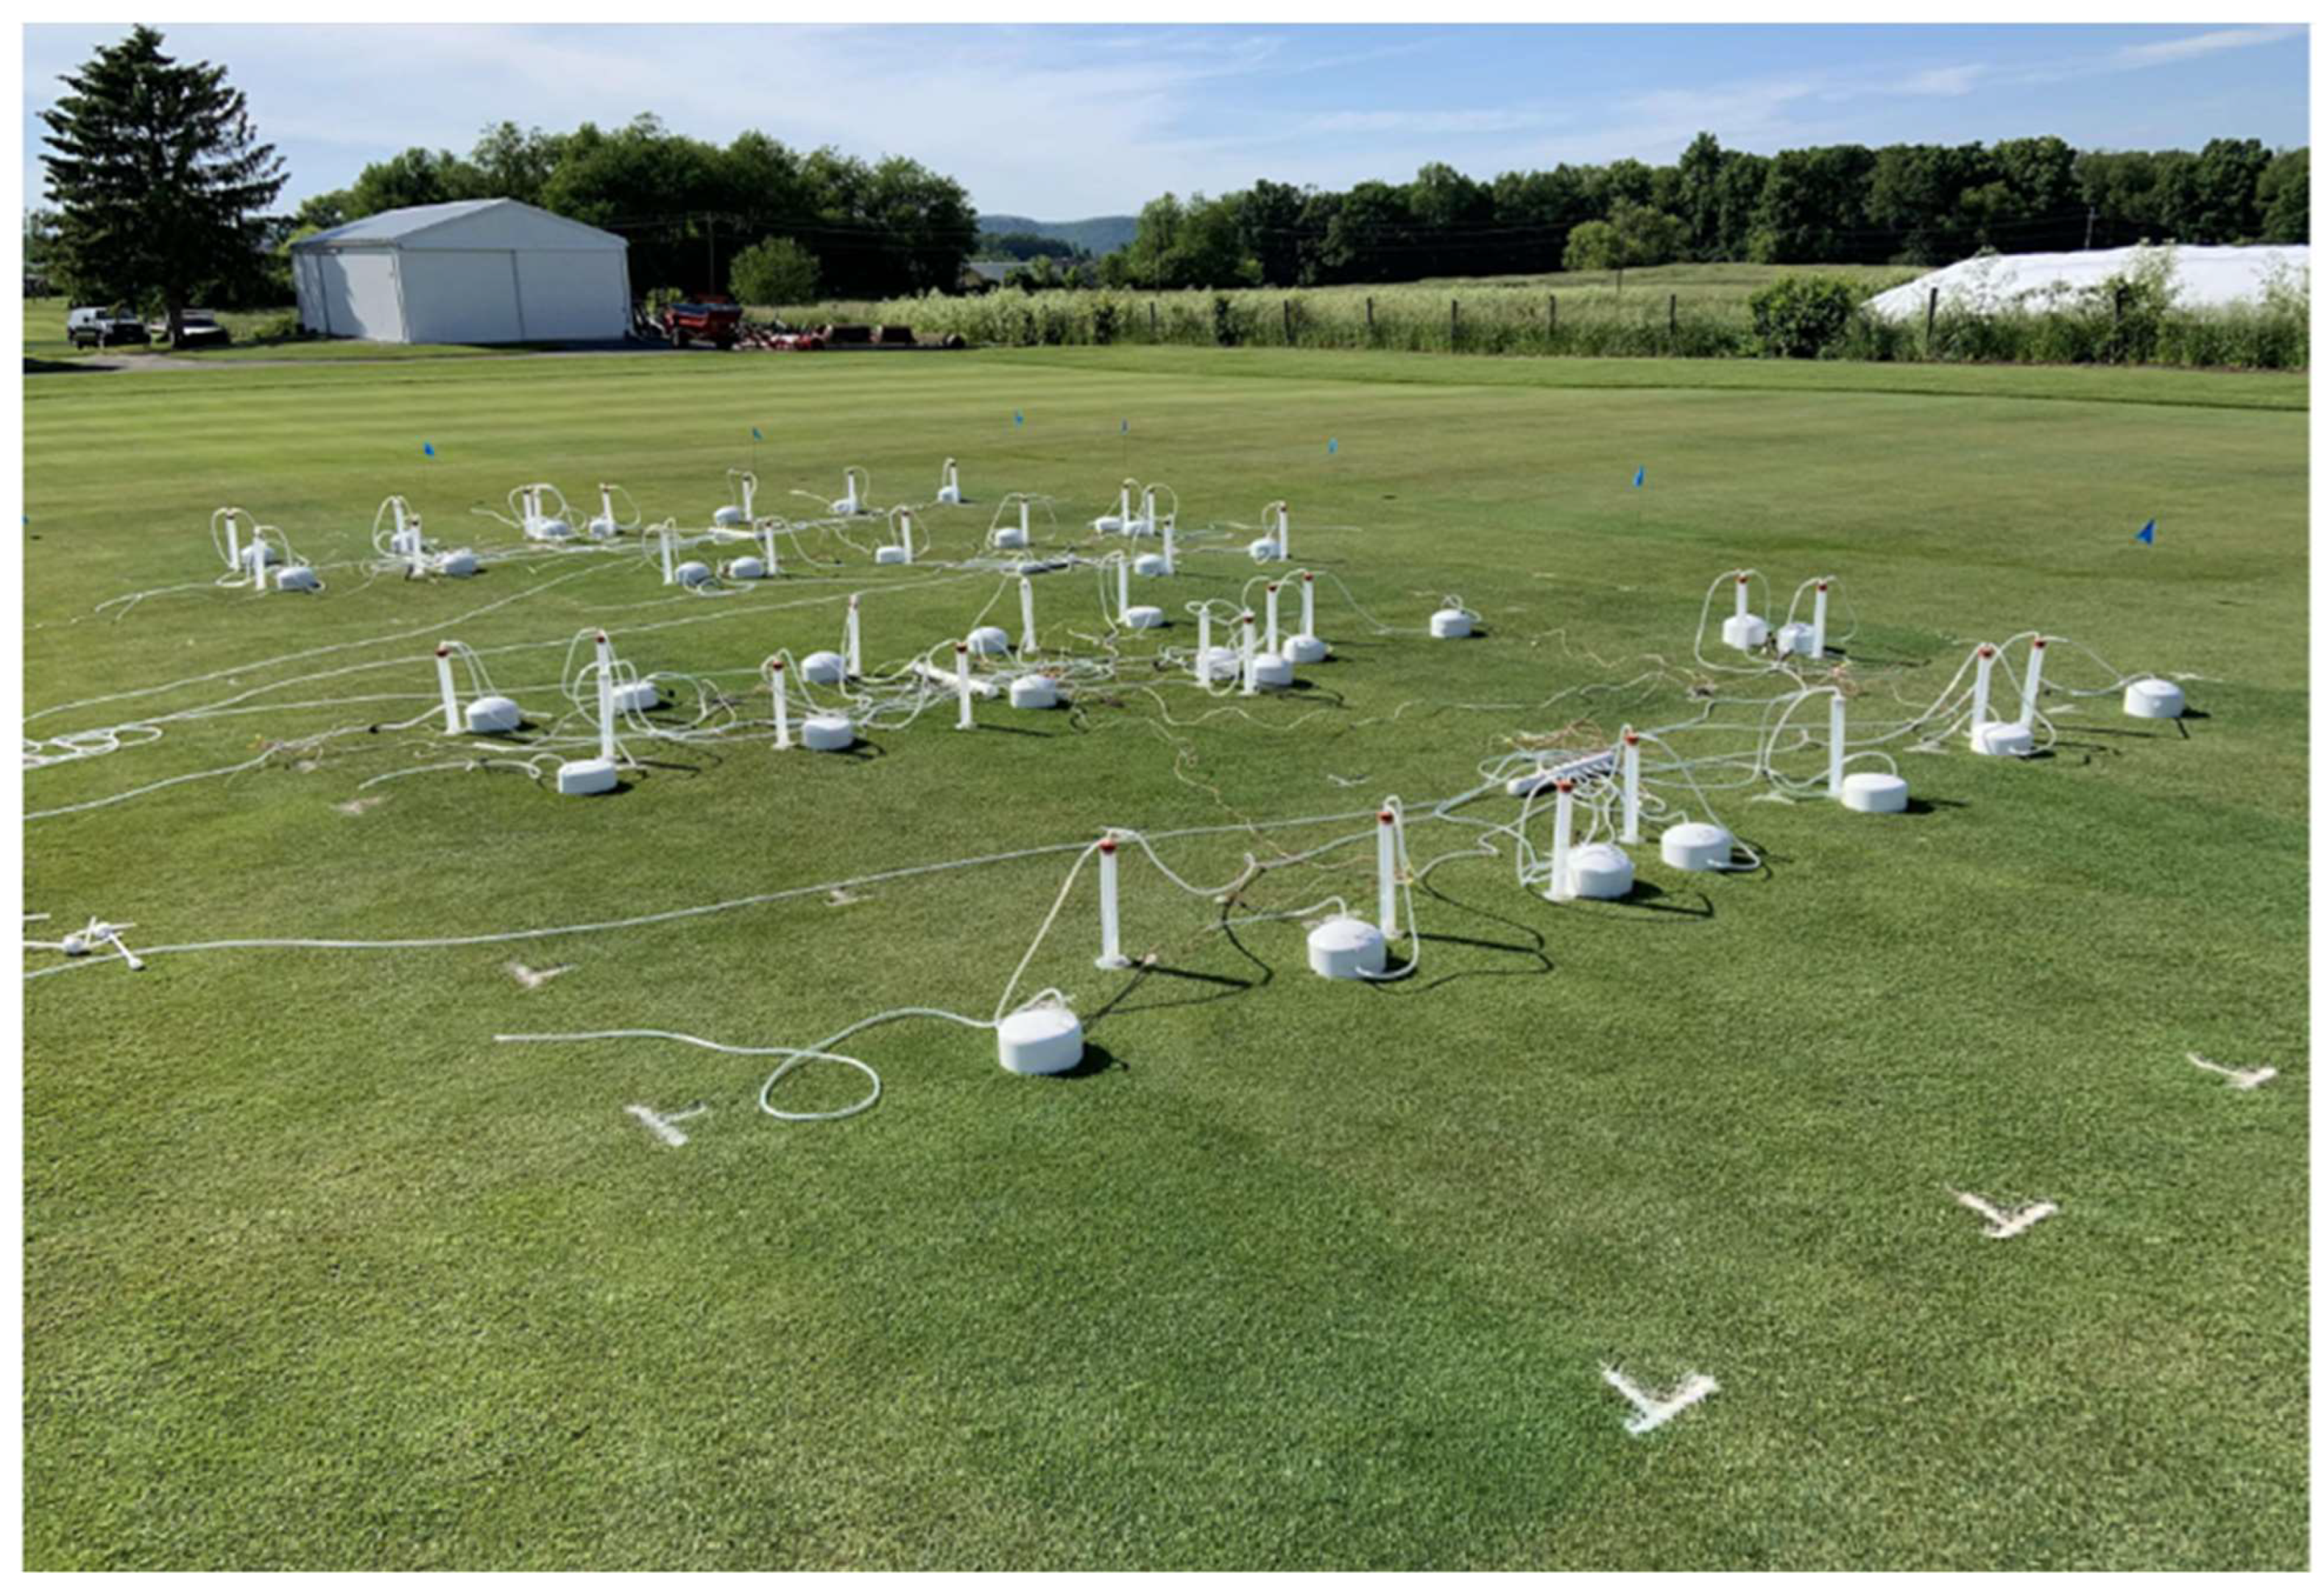
2–powered sprayer. Previously detailed closed flux chamber ammonia volatilization measures [
31] immediately followed foliar application to the bentgrass fairway plots on 19 July and 3 September 2019, and 9 and 30 June 2020 (
Figure 1). No less than two trip blanks were prepared during all boric acid (2% by mass) apportions and 2 modified chambers were employed to quantify the chamber trapping efficiency in each experimental run. Upon activation, trapping efficiency chambers liberated NH
3 from 50-mL of 0.156 M (NH
4)
2SO
4 as described by Schlossberg et al. [
31] and were terminated 24 h later.
Ammonia loss was assessed over each 0 to 24, then 24 to 48, hours since treated (HST) period. Chambers were not disturbed over the 48-h post application period. At precisely 24 HST, vacuum tubes were clamped, and boric acid transferred from scrubbing flasks into labelled bottles. The scrubbing flasks were then refilled with fresh boric acid, tightly stoppered, and clamps removed from the vacuum tubes. At precisely 48 HST, vacuum tubes were again clamped, boric acid transferred from scrubbing flasks into labelled bottles, and the chambers and all associated equipment removed from the plots. Ammonia emission for each plot and 24-h period was determined by a 0.01 N HCl titration procedure [
31]. Fertilizer-N loss as NH
3 was corrected for background N by subtracting control plot values on a per block basis.
2.2. Canopy Dark Green Color Measurement
Following the first treatment application in each year, a passive multi-spectral radiometer (CropScan MSR87, Rochester, MN, USA) was used to measure canopy reflectance relative to simultaneous irradiance in the 460, 560, and 660 ± 5-nm wavebands. Optimal radiometer operation required cloudless conditions and orientation of its downward-facing silicon photodiodes perpendicular to the turfgrass surface [
32,
33]. Two successive rounds of plot scans were collected at a 0.7-m height in the ±3-h interval centered on solar noon; 5, 10, 18, 21, 28, 32, 38, 46, 54, 61, 63, 67, 73, 80, 84, 87, 89, 93, 97, 105, 110, and 117 days following initiation (DFI) in 2019, and 372, 379, 385, 389, 390, 396, 402, 411, 413, 418, 423, 432, 437, 441, 452, 468, and 480 DFI in 2020. Duplicate measures of percent reflectance, from unique 0.1-m
2 sample areas, were averaged per plot prior to calculation of the dark green color index (DGCI) [
34].
2.3. Clipping Yield Measurement
The fairway was mowed 3 d week–1 at a 12.7-mm (0.5″) height of cut May through September, and clippings were collected and discarded offsite. Turfgrass shoot growth was quantified as clipping yield collected 21 June, 29 July, and 30 August 2019, and 17 June, 13 July, and 1 August 2020. These dates, respectively, correspond to 15, 11, 15, 9, 14, and 6 d since treatment; or 28, 66, and 98 DFI in 2019; and 390, 416, and 435 DFI in 2020. Samples were collected by making a single mower (Toro Greensmaster 1000, Bloomington, MN, USA) pass (0.53-m wide) at a 12.7-mm height of cut across the entire 183-cm length of each plot. Plots were not mowed 4 to 8 d prior to, but broomed 2 h prior to, clipping yield collections. The remaining turf was mowed, and clippings were discarded offsite. Clipping yield samples were oven-dried at 60 °C and weighed to 0.1-mg precision.
2.4. Nitrogen Offtake (NOFF) and Fertilizer N Recovery Measurement
Once their mass was determined, the dry clippings were ground to pass a 0.5-mm sieve, and then analyzed for total nitrogen by high temperature furnace combustion (Vario MAX cube, Elementar Americas Inc., Ronkonkoma, NY, USA) as described by Horneck & Miller [
35]. Nitrogen offtake (kg ha
−1) was calculated as the product of each clipping yield mass and its total tissue N content on a per-plot basis.
Fertilizer-N offtake was corrected for background N by subtracting control plot N offtake on a per block basis [
31]. Negative fertilizer N recoveries were replaced with zeroes before statistical analysis. Percent fertilizer N recovery (% FNR) was calculated as the quotient of fertilizer N offtake by the 9.76 kg N ha
−1 fertilizer application rate. Ten 0.5-mL aliquots of homogenized PDSO plus synthetic Cu II phthalocyanine combination product (Civitas PreM1xed Turf Defense) were analyzed for total N content [
36] (UNICUBE, Elementar Americas Inc., Ronkonkoma, NY, USA).
2.5. Civitas Evaporation vs. Residue Evaluation
On 29 August 2020, approx. 0.6 g of dried bentgrass fairway leaf clippings were spread uniformly within labeled, anti-static polystyrene trays (10803-162, VWR International, Radnor, PA, USA). The mass of each 21.1 cm2 tray and dry clippings was determined using a 0.1 mg resolution balance before being placed outside each plot receiving a N+ Civitas fertilizer treatment to purposefully collect the plot overrun of the prescribed spray solutions at the calibrated rate. The mass of each treated tray and clippings was determined ≤1 min after application and recorded. Each treated tray was then placed in a shallow cardboard box in full sun. Approximately 480 min later, the box was moved to a ventilated storage building to continue drying under ambient conditions. The final mass of each tray and clippings was determined 1440 ± 3 min after treatment and recorded.
2.6. Statistical Analysis
‘As collected’ measures of clipping yield, N offtake, and canopy dark green color index (DGCI) and ‘control-corrected’ measures of fertilizer N volatilization or recovery were modeled by Civitas and/or N fertilizer treatment in one-way analysis using PROC MIXED (SAS Institute, v. 8.2, Cary, NC, USA). Spray treatment (TRT) comprised the main plot effect and was F-tested using its block interaction term. Repeated 2019 and 2020 collection events comprised split-plots in time, specifically as days from initiation (DFI) of treatments. Significance of this fixed effect and its interaction with TRT were F-tested using the ‘block × TRT × DFI’ term. Regarding analysis of fertilizer-N volatilization data, the fixed effect of hours since treated (0 to 24 vs. 24 to 48 HST) was analyzed as a split-split-plot in time. This HST source and its associated interaction terms were F-tested by the residual.
Diagnostic plots were inspected to confirm normal error distribution, constant variance, and independent errors assumption abidance. Noncompliant observations falling >3 standardized residuals from predicted were omitted as missing data. All main and interaction effect hypothesis tests employed two-tailed separation of treatment means by Fisher’s protected least significant difference at the 0.05 alpha level (LSD
0.05). Following statistical analysis, fertilizer N loss as ammonia was scaled by the reciprocal of the field-determined mean efficiency (32%) of the flux chambers as previously described by Schlossberg et al. [
31].
3. Results
The routine soil analysis of the fairway 0- to 15-cm-deep soil sampled in April 2019 revealed a 1:1 soil pH of 6.8. Nutrients and base cations as extracted by Mehlich-3 were reported in the following mean concentrations: 1208, 11, 94, 220, 63, 12, and 150 mg kg−1 of Ca, Cu, K, Mg, P, S, and Zn, respectively.
3.1. Ammonia Volatilization by Treatment and/or Time
Global ANOVA of the four, 48-h ammonia-N collection periods showed mean fertilizer-N volatilization was influenced by foliar spray treatment (
p ≤ 0.01) and hours since treated (
p ≤ 0.01), but not days from initiation (
p = 0.11). Fertilizer N source did not interact with Civitas inclusion to influence 48-h ammonia loss (contrast
p ≥ 0.62) (
Table 1). Regarding the main treatment effects, total loss of fertilizer-N over the first 48 h since treated (HST) related directly to the fraction of conventional urea-N contained within the liquid fertilizer (contrast
p ≤ 0.01).
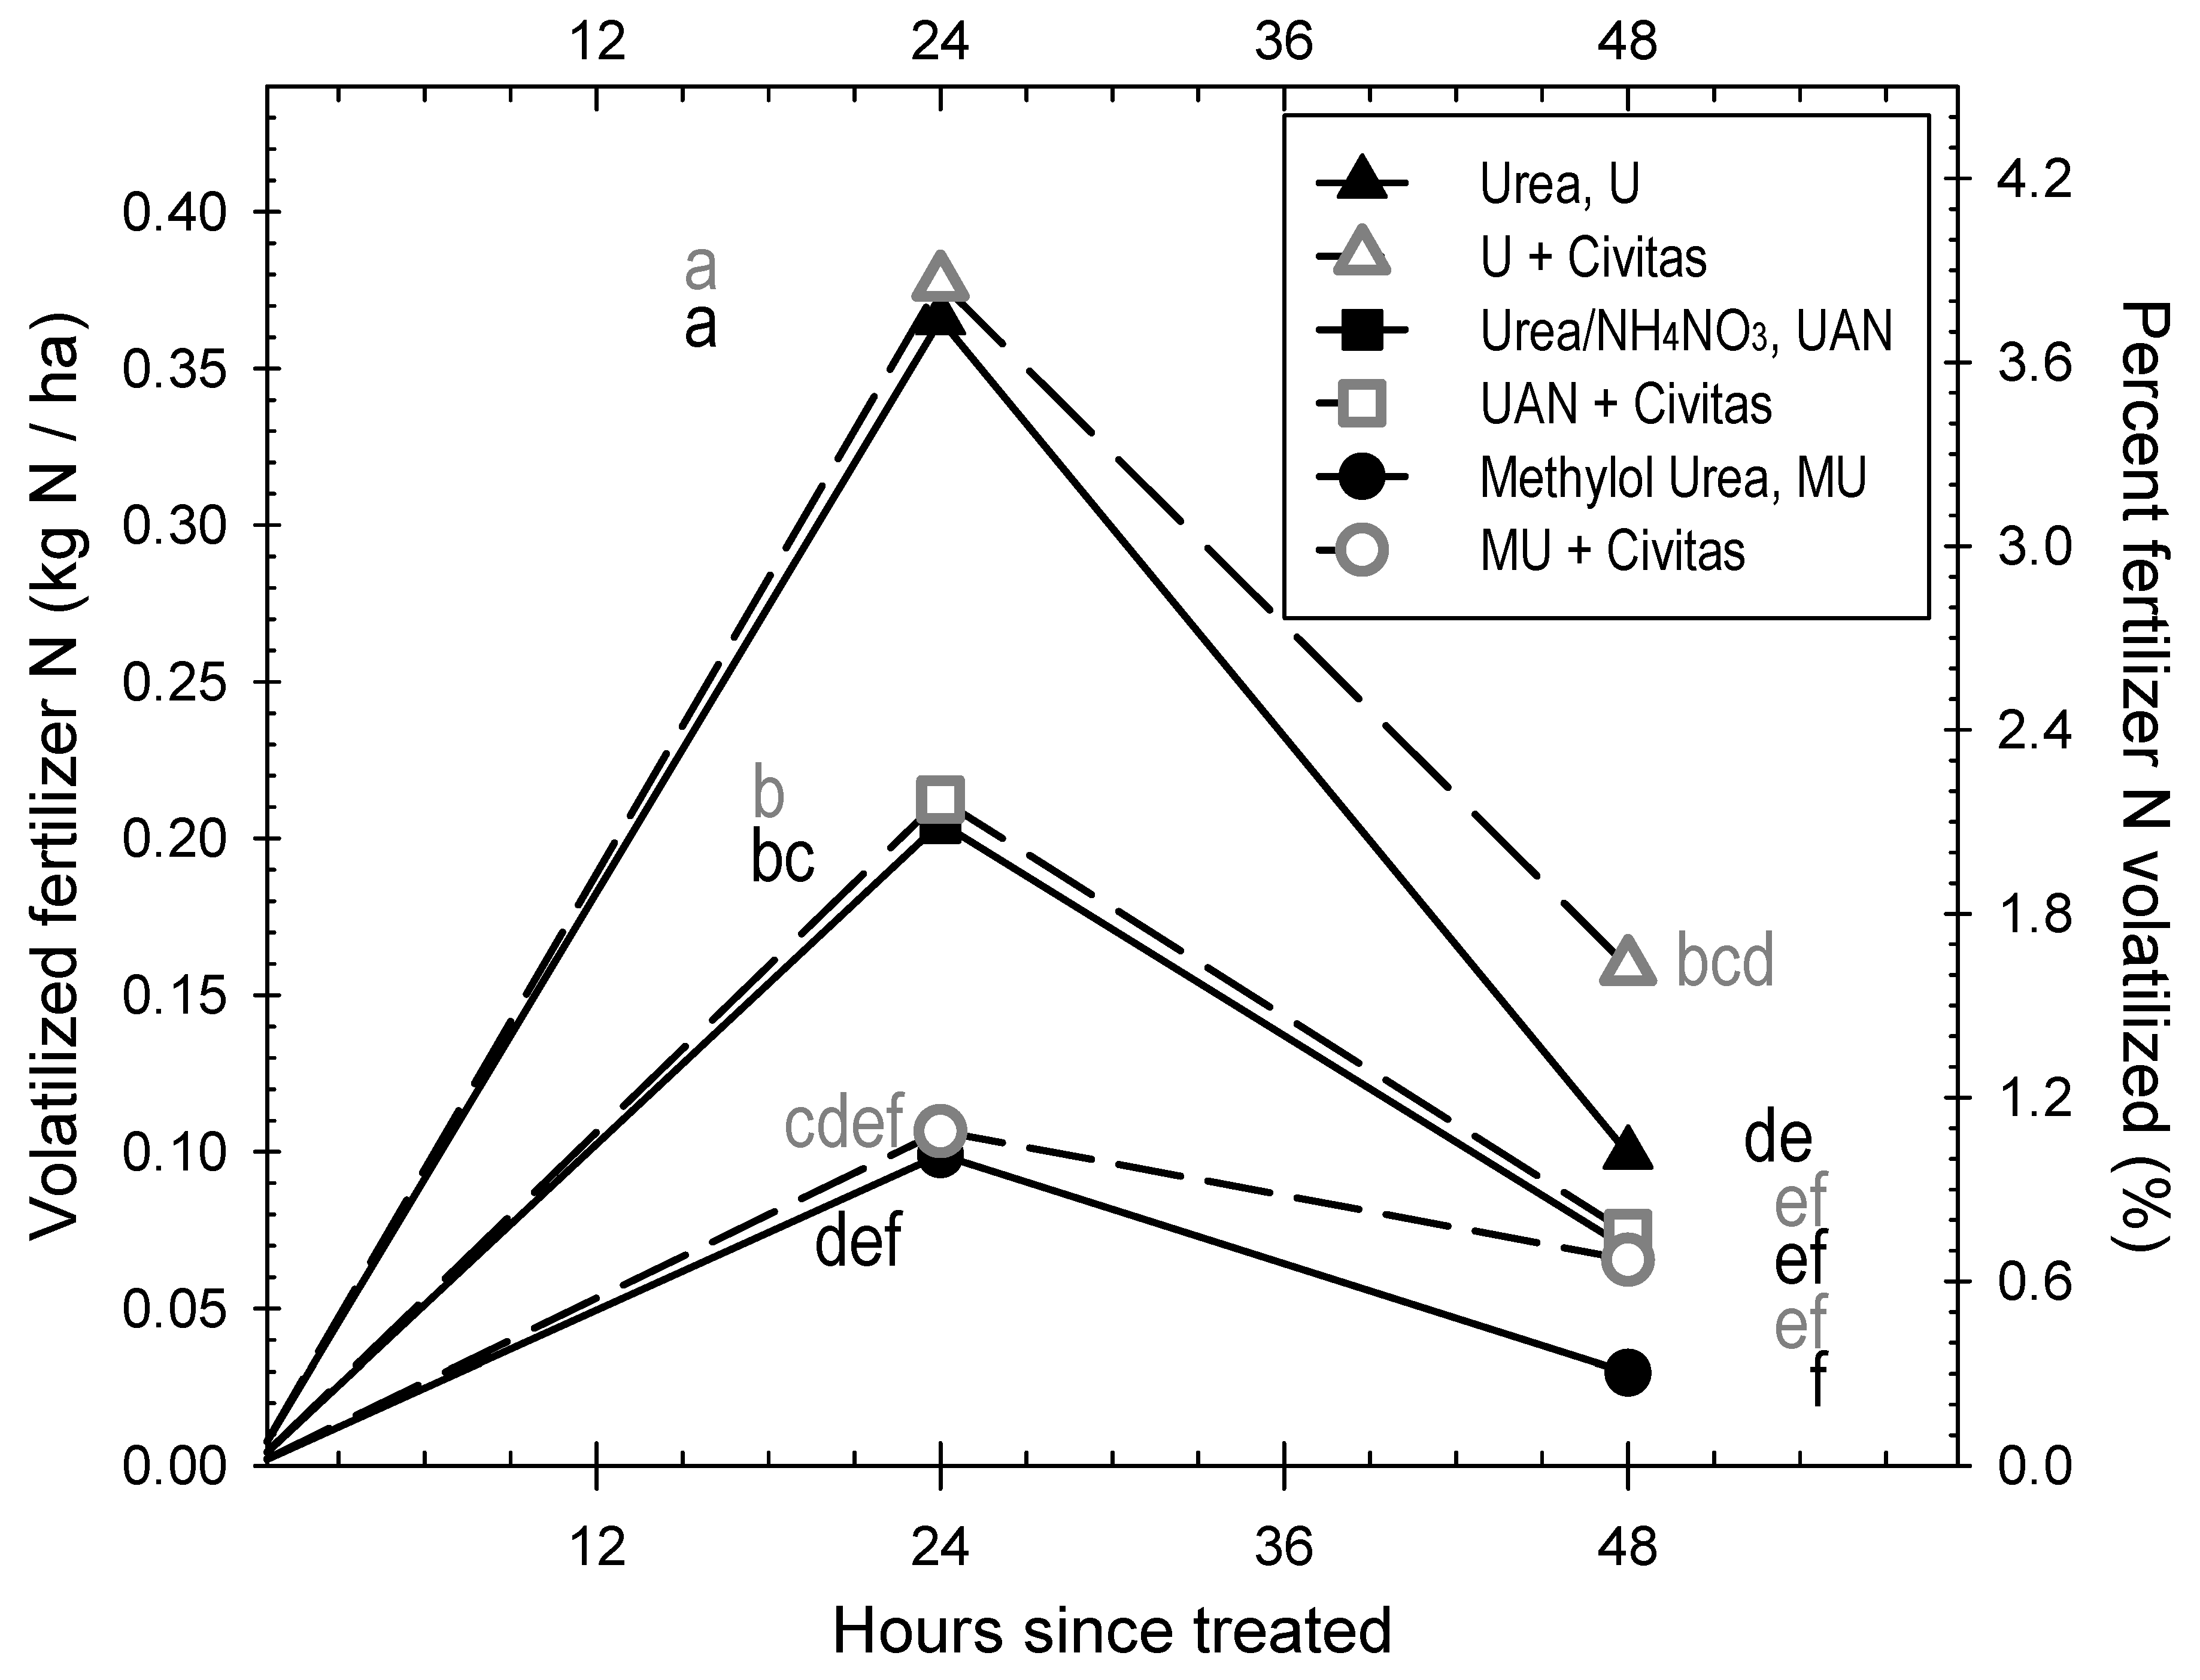
The significant hours since treated main effect (p ≤ 0.01) resulted from greater mean fertilizer-N volatilization in the first than second 24-h period following treatment (0.23 vs. 0.08 kg FN ha–1). Yet, fertilizer-N loss by HST varied considerably by N source and Civitas inclusion; i.e., global ANOVA confirmed a significant interaction of spray treatment by HST (p ≤ 0.01).
Regardless of PDSO combination, foliar application by conventional urea resulted in the greatest fertilizer-N loss as ammonia 24 HST and comprised the top statistical grouping (
Figure 2). For the conventional urea or UAN treatments, fertilizer N loss as ammonia in the first 24 h since treated amounted to 3.8 or 2.1% of the applied N respectively. Complementation of either N fertilizer source by Civitas did not affect this outcome (
Figure 2). Likewise, 1% of the methylol urea (MU) fertilizer treatment volatilized 0 to 24 HST. But while ammonia volatilization from conventional urea or UAN treatments was significantly greater in the first 24 h since treated than the second, statistically equivalent masses of fertilizer N volatilized from the MU treated plots over the first and second 24-h post treatment periods (
Figure 2).
This unique result may perhaps be attributed to controlled-release methylol urea, C
2N
2O
2H
6, comprising 60% of the N in liquid MU fertilizers. Given that simple urea, CON
2H
4, constitutes 100% or 50% of conventional urea or UAN fertilizer, substrate loads are greatest initially but lessen with time from urea or UAN fertilizer application. Hence, more urea and UAN volatized over the first 24 HST than the second. On the contrary, the 60% fraction methylol urea in liquid MU fertilizer requires biological transformation to urea before assimilation by vegetation or hydrolysis by urease. This necessary mineralization of MU may have limited urea substrate availability, inciting a lag in hydrolysis rate and statistically equivalent volatilization over the second 24 HST period as the first (
Figure 2).
3.2. Canopy Dark Green Color by Treatment and/or Time
Global ANOVA of the 39 canopy reflectance measurements showed mean dark green color index (DGCI) was influenced by foliar spray treatment (
p ≤ 0.01) and days from initiation (
p ≤ 0.01). Regarding the main effect of spray treatment and relative to the alternative, semimonthly N fertilization significantly improved mean canopy DGCI (contrast
p ≤ 0.01). Yet compared to only N-fertilized plots, complementation by Civitas further increased mean canopy DGCI (contrast
p ≤ 0.01) of all fertilizer N sources but conventional urea. The top statistical grouping for mean DGCI included urea and all N sources complimented by Civitas (
Table 1).
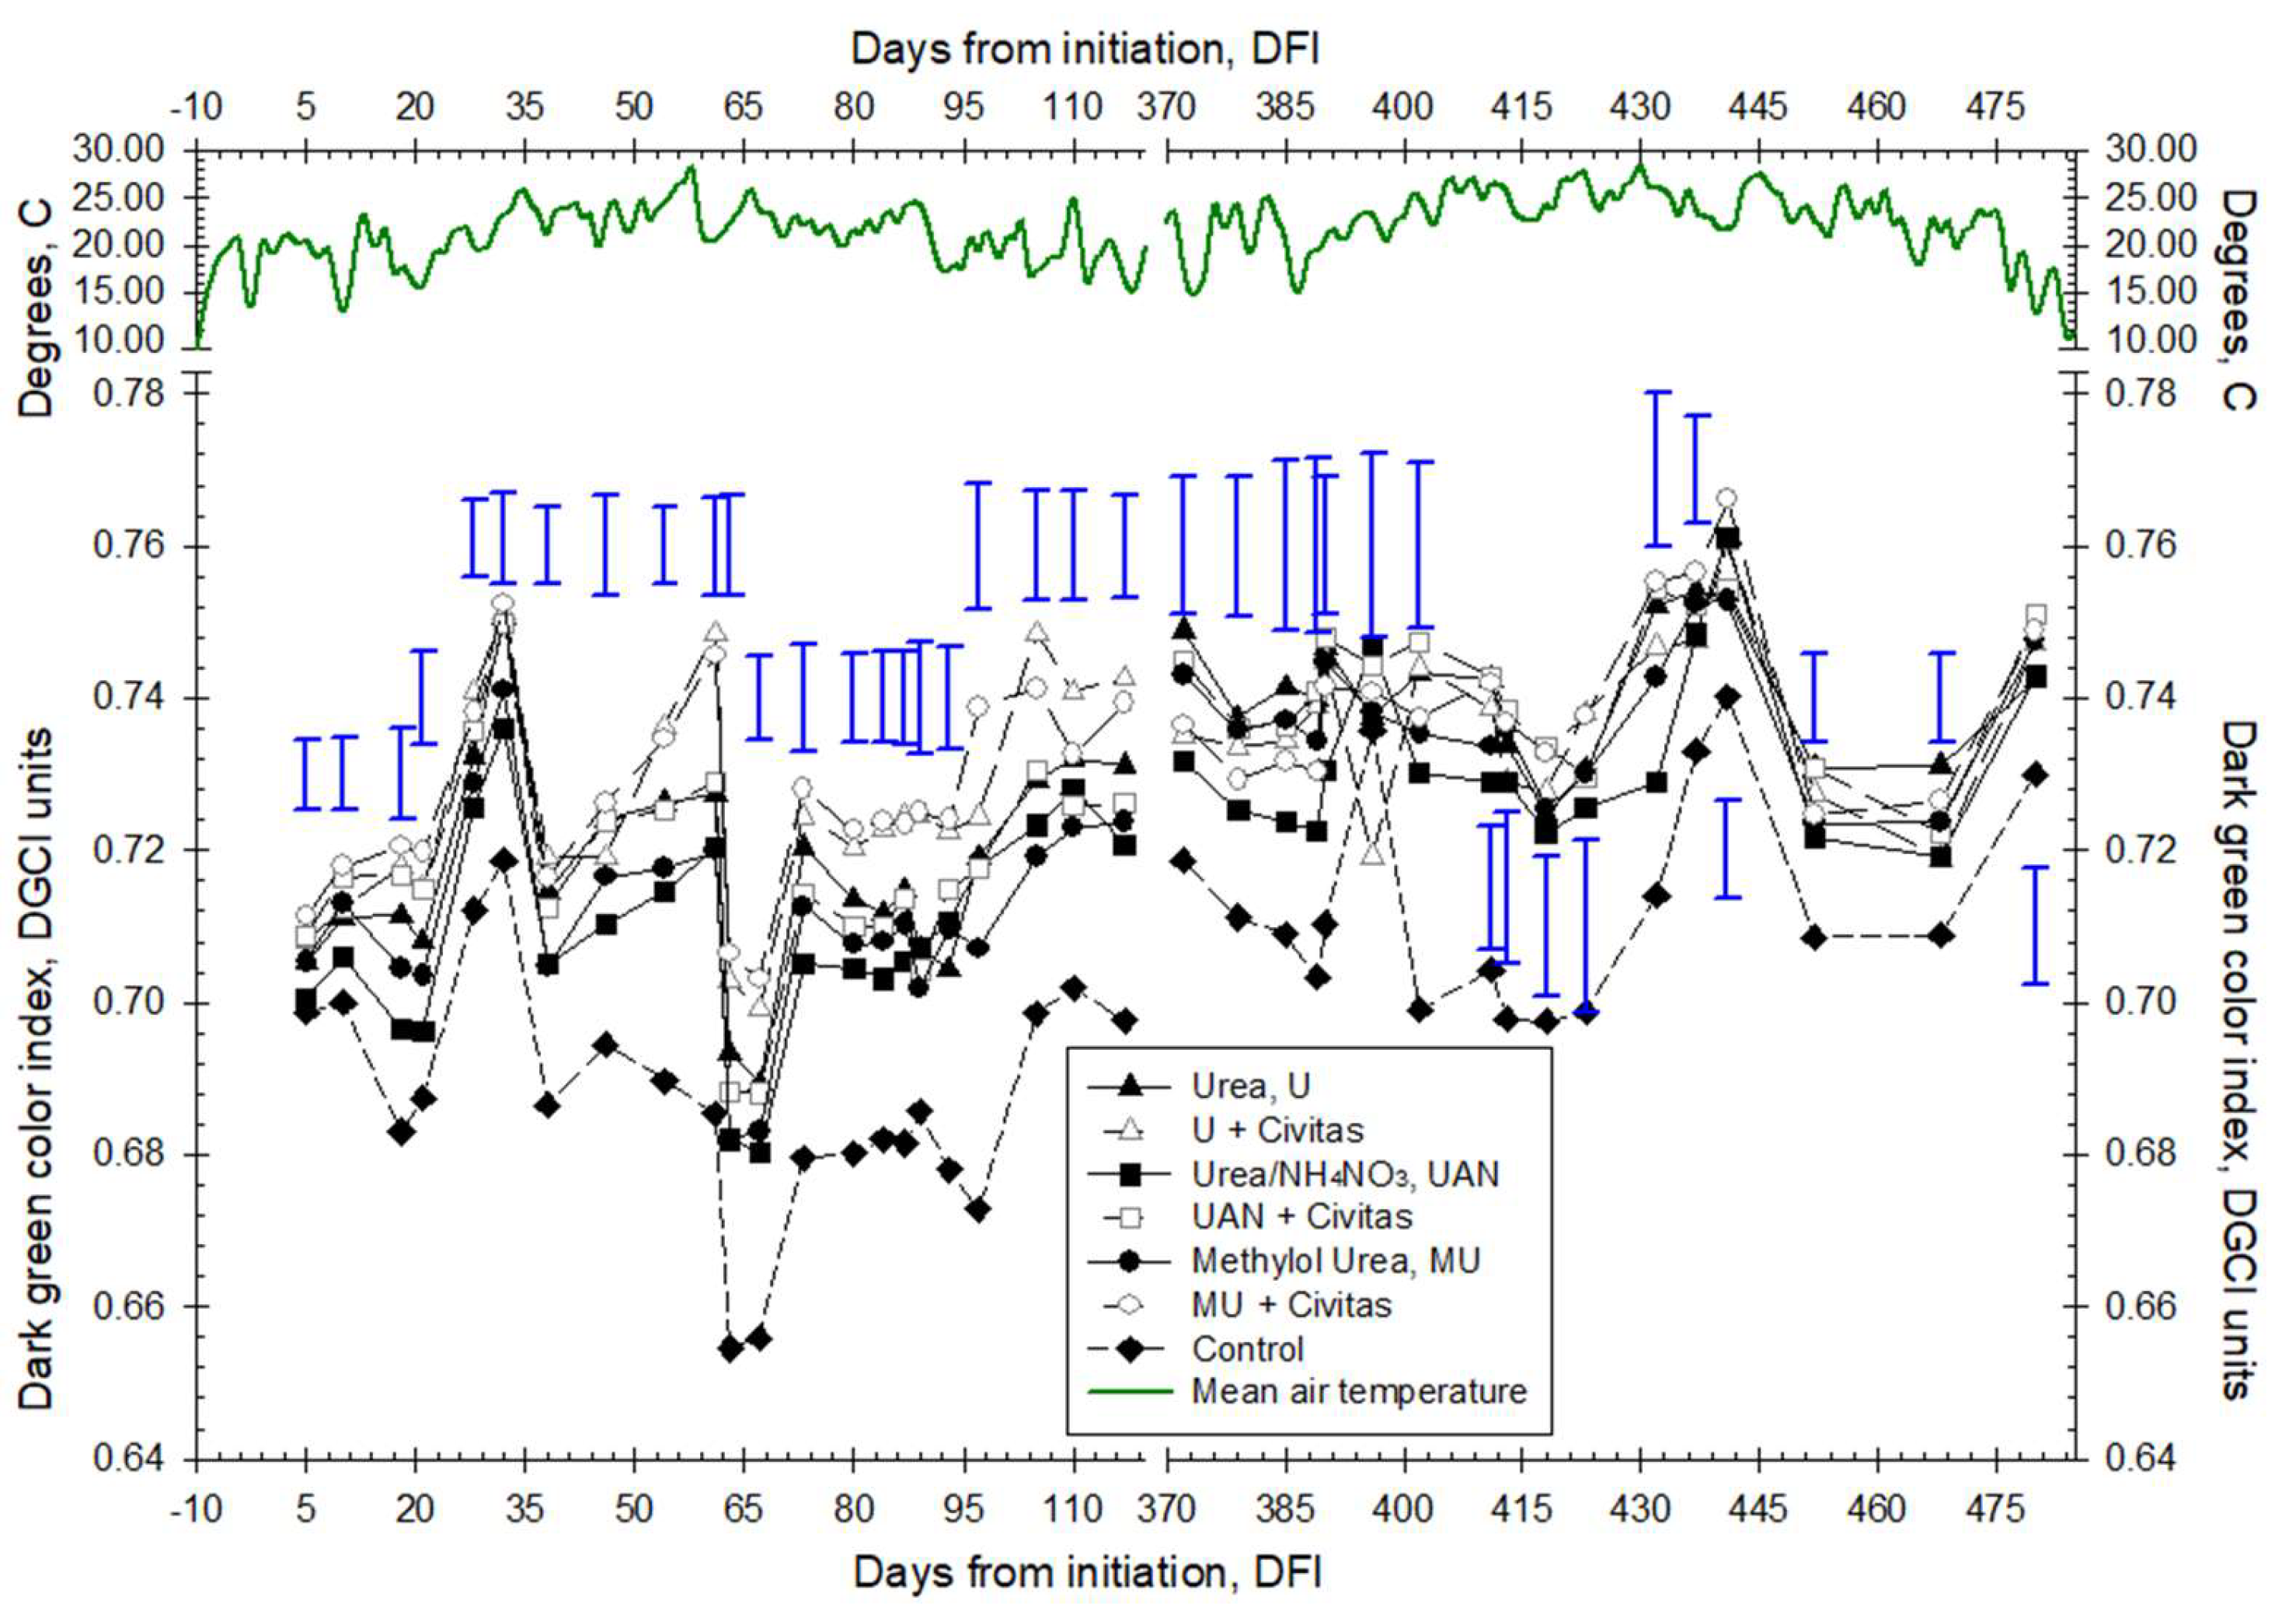
Significant variation in canopy DGCI by DFI was not an unexpected result of deviations in time elapsed since last mowing, climate conditions, available nutrients, and/or mower sharpness over two growing seasons. The most ostensible trend in canopy DGCI by DFI was the significantly greater mean DGCI over the 2020 season compared to the 2019 season (
Figure 3). The probable cause of this disparity was the purposeful withholding of N fertilizer from Fall 2018 until treatment initiation on 24 May 2019, coupled with an early arrival of growing conditions in 2019. For example, the mean temperatures for April and May 2019 were 10.3 and 16.1 C, respectively, but only 7.4 and 13.5 C in 2020 (
Figure 3). All plots were supplemented by split applications of fertilizer in March and April 2020, totaling 39 kg ha
–1 soluble N.
Canopy DGCI was significantly influenced by the interaction of spray treatment and DFI (
p ≤ 0.01). Factors contributing to this interaction, on the one hand, was the extent the DGCI of the Civitas complemented N sources that significantly exceeded the untreated control 5 to 20 DFI (
Figure 3). On the other hand, the DGCI of the UAN + Civitas treatment did not exceed that of only urea, UAN, or MU treatment from 54 to 117 DFI. Nearly all N treatments, regardless of Civitas, resided within the highest DGCI statistical grouping from 372 to 423 DFI. However, the DGCI of the UAN treatment was not significantly greater than the control from 432 to 480 DFI (
Figure 3). The mean DGCI for N-only treatments significantly exceeded the DGCI of the control plot mean on 24 out of 39 measurement dates (
Figure 3). Meanwhile, The DGCI of plots treated by N and Civitas significantly exceeded DGCI of the control plot mean on 35 out of 39 measurement dates. Circumstances in which Civitas’ inclusion did not significantly improve DGCI were neither associated with a unique N source nor any particular experimental condition (
Figure 3).
3.3. Clipping Yield by Treatment and/or Time
The global ANOVA of the six clipping yield measures showed that shoot growth was influenced by foliar spray treatment (
p ≤ 0.01) and days from initiation (
p ≤ 0.01). Regarding the main effect of spray treatment and relative to none, semimonthly N fertilization significantly fostered the clipping yield of the creeping bentgrass fairway (contrast
p ≤ 0.01). Yet, the complementation of all fertilizer N sources with Civitas further increased the mean clipping yield (contrast
p ≤ 0.01) and comprised the top statistical grouping (
Table 1).
Clipping yields were collected 15-, 11-, and 15-d following spray treatment in 2019 (mean of 13.7 d) or 9-, 14-, and 6-d (mean of 9.7) following spray treatment in 2020; then dried to constant mass, weighed, and presented as kg ha–1. As mentioned, a comparatively delayed arrival of Spring 2020 and subsequent N inputs likely contributed to an increased shoot growth rate relative to 2019. While 7, 8, and 8 d mowing holidays pre-empted yield collections in 2019 (mean of 7.7 d), only 5 d of postponed mowing was required to collect adequate biomass in 2020. Not standardizing the yield by the number of days elapsed since the last mowing certainly contributed to this significant DFI effect, and significantly greater mean yield was observed in 2020 (contrast p ≤ 0.01).
Perhaps more importantly, clipping yield was significantly influenced by interaction of treatment by DFI (
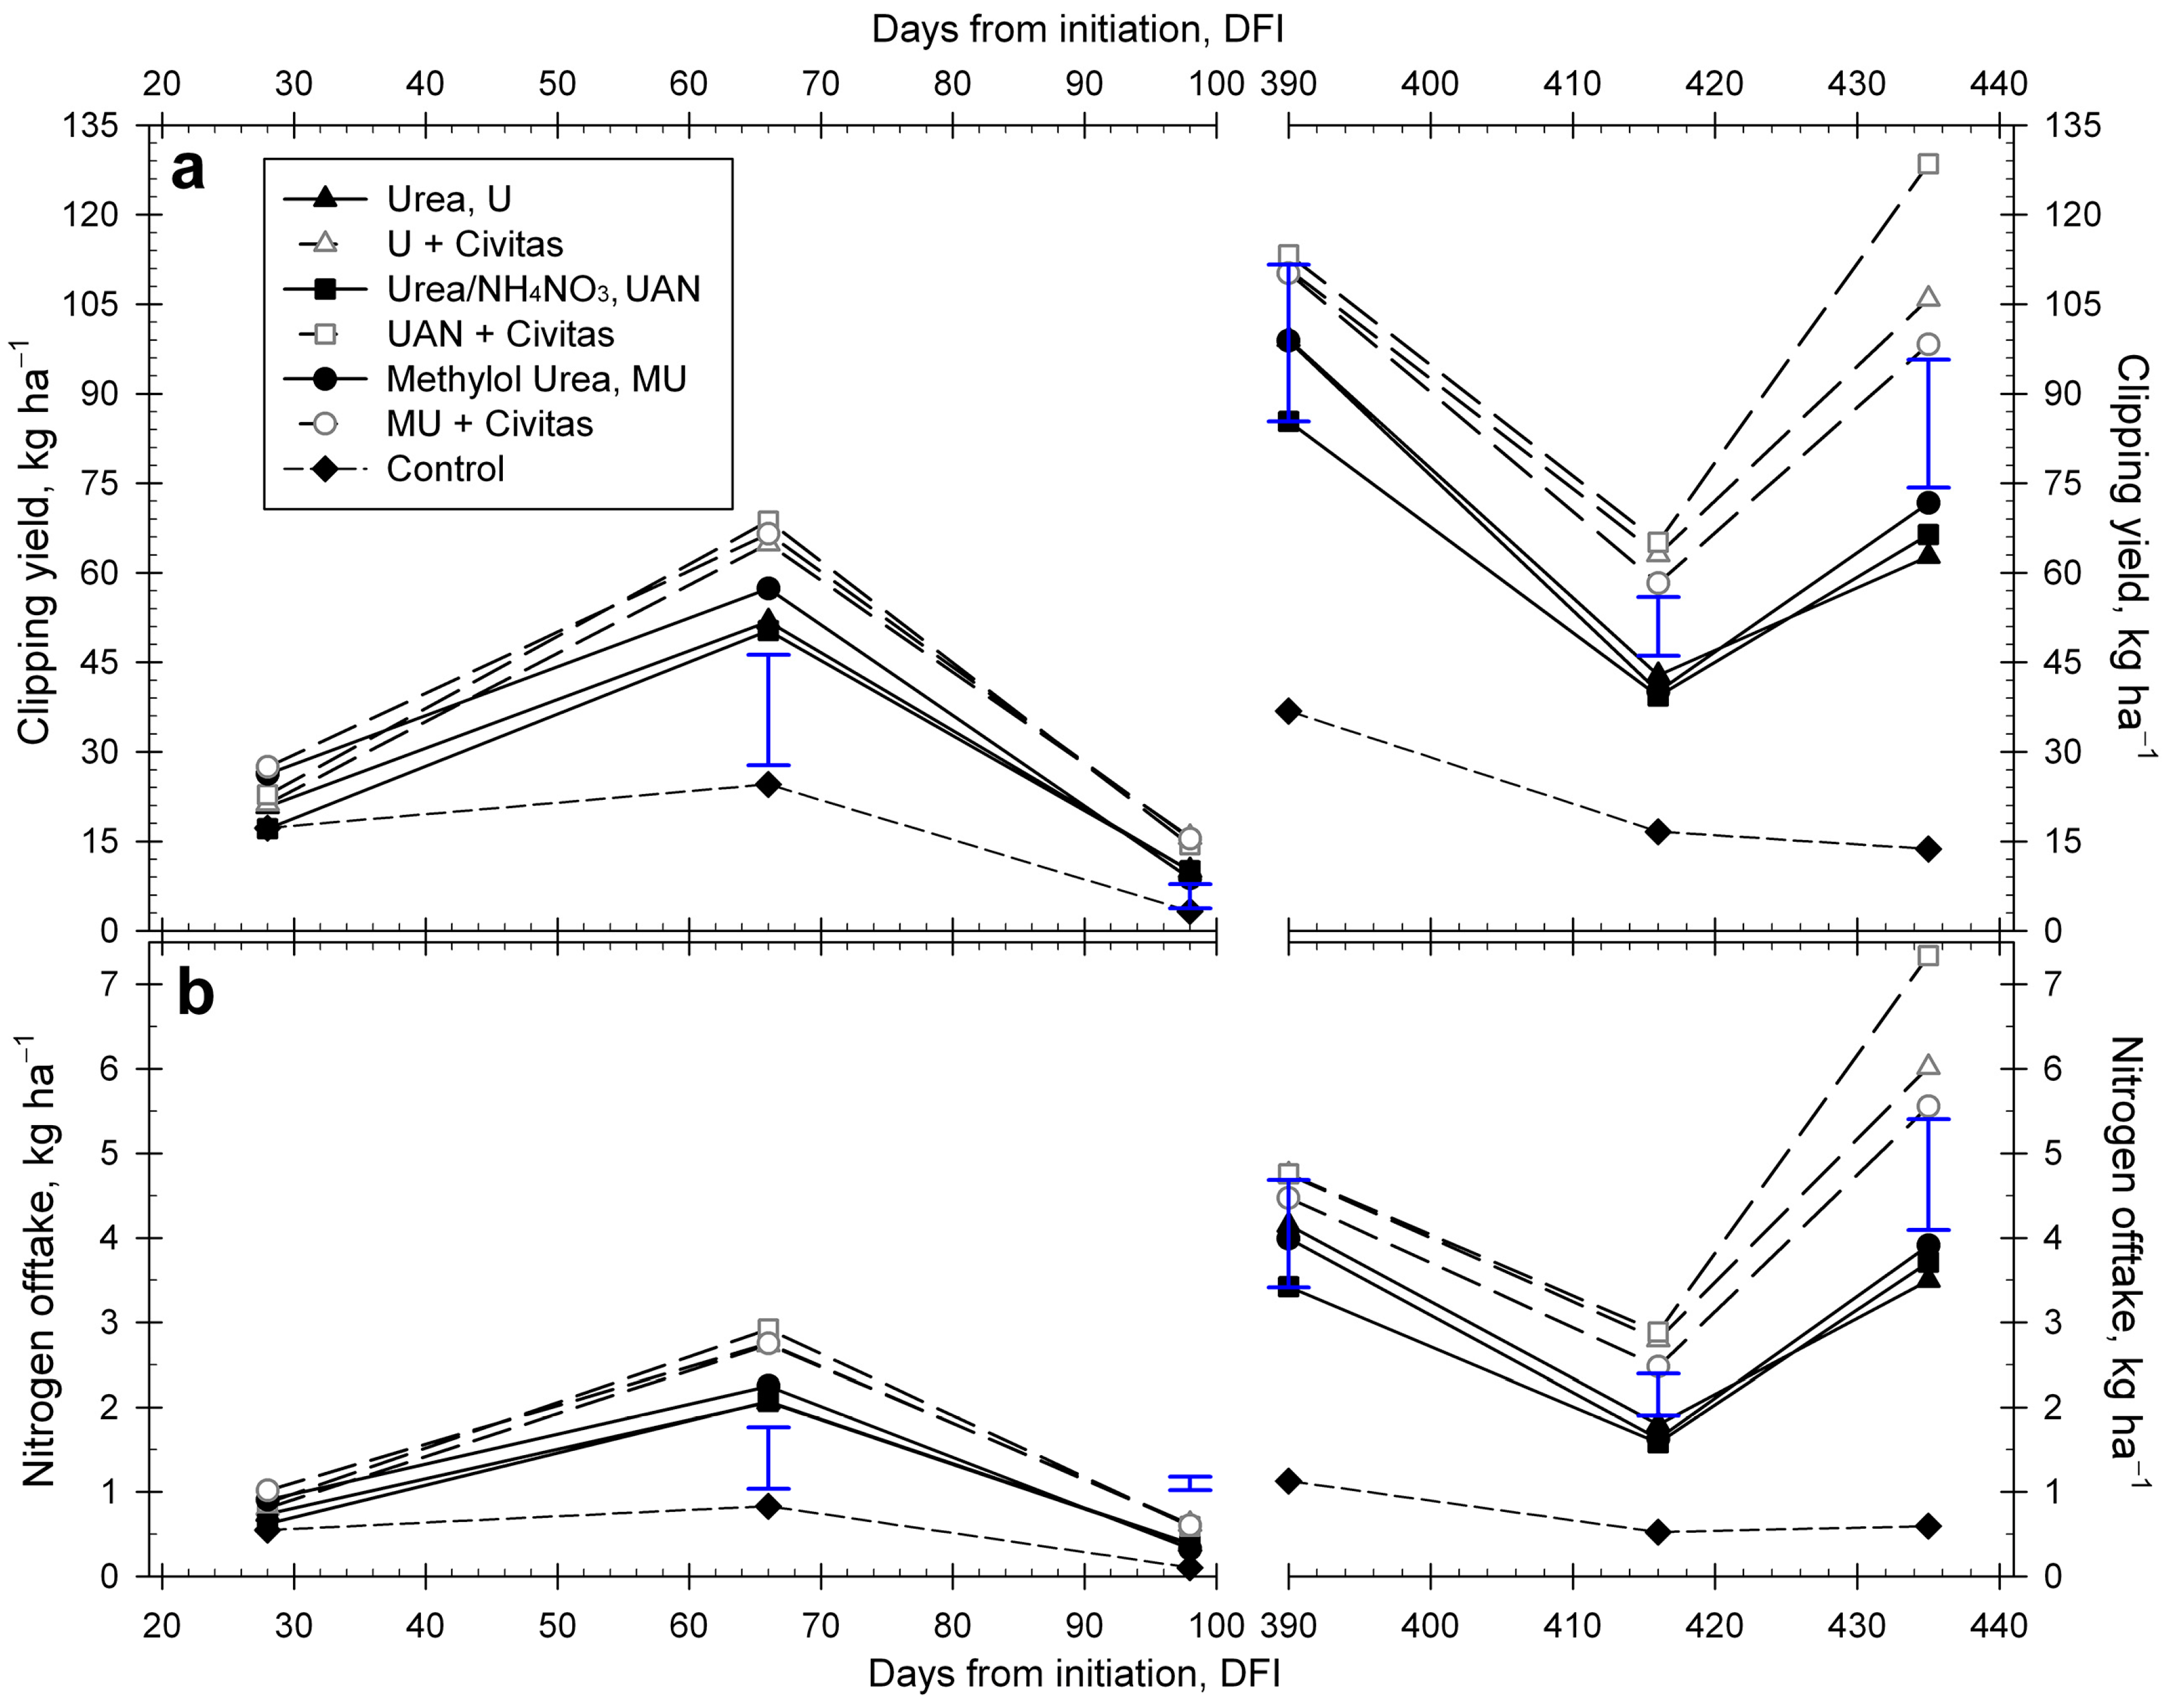
p ≤ 0.01). Twenty-eight DFI, the control plots showed equivalent clipping yield to all spray treatments (
Figure 4a). Yet 66 DFI, when cumulative N treatment exceeded 47 kg N ha
–1, all spray treatments containing N showed equivalent clipping yields significantly exceeding that of the control (
Figure 4a). Ninety-eight DFI, treatments containing Civitas comprised the highest statistical grouping (5% alpha), while the control showed significantly less clipping yield than all other treatments.
In June 2020 (390 DFI), all treatments but the UAN and control comprised the highest statistical grouping for the clipping yield (
Figure 4a), yet the control showed significantly less clipping yield than UAN. At 416 DFI, treatments containing Civitas comprised the highest statistical grouping, while the control showed significantly less clipping yield than all other treatments (
Figure 4a). The UAN+ Civitas treatment was the sole occupant of the highest statistical grouping 435 DFI, but clipping yield of the other treatments containing Civitas significantly exceeded their ‘N only’ counterparts, while the control showed significantly less clipping yield than all other treatments (
Figure 4a).
Still the mechanism(s) responsible for shoot growth increases incited by Civitas complementation of semimonthly N 66 to 435 DFI loom(s) inscrutably. Kreuser and Rossi [
14] reported that Civitas PDSO-containing treatments did not alter the quantity or composition of plants’ epicuticular wax as determined by gas chromatography, yet interpretated an electron micrograph scan of a leaf 48 h following a 55 L ha
–1 re-application as showing altered epicuticular wax morphology and stomata occluded by Civitas PDSO and/or redistributed epicuticular wax. Reports of PDSO and/or Cu II phthalocyanine mass remaining on turfgrass canopies by time from treatment are absent from the literature.
As a proxy, mass retention of Civitas Pre-M1xed Turf Defense applied to dry clippings within a polystyrene tray was measured ≤1 and 1440 min following spray application. Within one minute of each N+ Civitas spray treatment, the mass of solution applied at 611 L ha–1 ranged from 0.0956 to 0.1206 g, averaging 0.1051 g. These masses are less than the 0.128 g a 21.1-cm2 tray would be expected to intercept following a 611 L ha–1 application of aqueous solution having a 0.994 kg L–1 specific gravity, likely the result of evaporative tension imparted during and following a spray application outdoors. More importantly, an average of 1.174% of the initially applied spray remained as dry solids approximately 1440 min following. Considering the 0.86 kg L–1 specific gravity of Civitas Turf Defense, these data indicate 0.273 kg ha–1 of solid Civitas residue would be expected to remain on the canopy ≥1440 min following the described spray treatments.
This persistence of dry Civitas residue observed 1 d following spray coating of clippings within a polystyrene tray begs the question: Is the Civitas coating itself responsible for the significantly greater clipping yield of the containing treatments observed over the last four data collections? The authors believe not and support that belief with 390 and/or 98, 416, and 435 DFI clipping yield data. On the last four yield collections for example, clipping yield from the UAN+ Civitas plots exceeds yields measured from the UAN-only plots by 4.3 to 62.1 kg ha
–1. These margins exceed the sum of the respective Fisher’s LSD
0.05 and 0.273 kg ha
–1 maximum possible dry Civitas residue unanimously (
Figure 4a). Similarly, clipping yield collected from U+ or MU+ Civitas plots exceeded the yield measured of their ‘N only’ counterparts by 5.6 to 43.1 or 6.6 to 26.6 kg ha
–1 at 98, 416, and 435 DFI. These margins also exceed the sum of the respective Fisher’s LSD
0.05 and 0.273 kg ha
–1 maximum possible dry Civitas residue.
3.4. Nitrogen Offtake (NOFF) and Fertilizer N Recovery (FNR) by Treatment and/or Time
Clipping leaf N was least in the control plots, ranging from 27.9 to 45.6 g kg–1. Intermediate levels of leaf N, registering between 32.7 and 57.7 g kg–1, were observed in plots receiving only liquid N fertilizer. Liquid N fertilizer complimented by Civitas treatments resulted in the highest observed leaf N levels, ranging from 35.7 to 59.9 g kg–1.
Global ANOVA of the six N offtake measures showed significant influence by foliar spray treatment (
p ≤ 0.01) and days from initiation (
p ≤ 0.01). Regarding the main effect of spray treatment and relative to none, semimonthly N fertilization significantly increased N offtake from the creeping bentgrass fairway (contrast
p ≤ 0.01). Complementation of all fertilizer N sources by Civitas further increased mean N offtake (contrast
p ≤ 0.01) and comprised the top statistical grouping (
Table 1).
Nitrogen offtake by control or spray treatment did not significantly differ 28 DFI (
Figure 4b). All spray treatments containing N resulted in N offtake significantly exceeding the control 66 DFI, yet the MU spray treatment and all treatments containing Civitas comprised the highest statistical grouping (
Figure 4b). Ninety-eight DFI, treatments containing Civitas comprised the highest statistical grouping for N offtake (5% alpha), while the control showed significantly less N offtake than all other treatments.
All treatments but the UAN and control comprised the highest statistical grouping for N offtake 390 DFI (
Figure 4b). Yet as with the 390 DFI clipping yield, the UAN treatment showed significantly greater N offtake than the control. At 416 DFI, treatments containing Civitas comprised the highest statistical grouping for N offtake, while the control showed significantly less N offtake than all other treatments (
Figure 4b). At 435 DFI, urea or UAN fertilizer complemented by Civitas comprised the highest statistical grouping for N offtake. Nitrogen offtake from Civitas-complemented urea and Civitas-complemented MU were statistically equivalent and significantly exceeded all ‘N only’ treatments, while the control showed significantly less N offtake than all other treatments (
Figure 4b).
The global ANOVA of the six measures of control-corrected fertilizer N recovery (FNR) showed a significant influence of foliar spray treatment (
p ≤ 0.01) and days from initiation (
p ≤ 0.01). Regarding the main effect of spray treatment, the complementation of all fertilizer N sources with Civitas increased the mean FNR (contrast
p ≤ 0.01). The top statistical grouping for mean FNR, pooled over the six clipping yield sample dates, included the three Civitas treatments (
Table 1).
Dynamic climatic and cultural inherencies of field research often contribute to temporal variations in dependent variable response. Likewise, FNR was derived from clipping yields that terminated mowing holidays of varying duration but were not standardized by that number, i.e., the days elapsed since the last mowing. Whereas the authors hope to have adequately justified this approach in the discussion of clipping yield results above, it precludes representation of FNR over the full 14 d reapplication interval while inciting a significant interaction of treatment and DFI (p ≤ 0.01).
The ‘Test of Effect Slices’ in PROC MIXED identified significant spray treatment effects on FNR 98, 416, and 435 DFI. Nearly identical inference applies to the 98 and 416 DFI collections, when the top statistical grouping for the mean FNR consisted of the three treatments containing Civitas. At 435 DFI, the FNR of both the Civitas-complimented urea and UAN treatments comprised the top statistical grouping.
These results again raise the question: to what extent is the Civitas coating itself responsible for the significantly increased FNR of the containing treatments? Nitrogen analysis of Civitas Pre-M1xed Turf Defense™ reveals a mean concentration of 10 g kg
–1, the origin of which is the Cu II phthalocyanine pigment (C
32H
16CuN
8). Having a reference 195 g kg
–1 N content [
37], this organic N is neither immediately assimilable by plants nor disclosed on the label. However, the estimated 0.232 kg ha
–1 N load of Cu II phthalocyanine exceeded the calculated FNR LSD
0.05 for the 98 DFI observations.
4. Discussion
4.1. Ammonia Volatilization by Treatment and/or Time
The observed relation of urea-N content and total loss of fertilizer-N from 0- to 48-HST corresponds to the disparity in 96-h ammonia volatilization from MU or suspended urea formaldehyde spray treatment (49 kg N ha
–1) directly attributed to the urea-N content of each by Torello et al. [
38]. Likewise, while greater mean fertilizer-N volatilization over the first 24 HST compared to the second may run counter to reports of increasing day 1 to day 2 ammonia loss following granular urea fertilizer applications to turfgrass [
39,
40] or pasture [
41,
42], the described results concur with reported losses from dissolved urea spray applications [
43].
The conventional urea treatment resulted in the greatest fertilizer-N loss as ammonia 24 HST yet amounted to less than half the gaseous loss measured throughout an identical protocol employed in two experiments of a creeping bentgrass golf course putting green trial [
26]. This lesser mean volatilization of fertilizer urea-N from the fairway vs. putting green (0.37 vs. 0.73 kg FN ha
–1) may be attributed to greater urea-N assimilation by the comparatively greater mass of vegetation maintained under a 12.7- vs. a 3.3-mm height of cut, as evidenced by the simultaneous NDVI assessment of ‘Penn G-2′ putting green plots and non-trafficked ‘Declaration’ fairway plots present in the literature [
44,
45].
4.2. Canopy Dark Green Color by Treatment and/or Time
Improved mean canopy DGCI of the bentgrass fairway as a result of semimonthly liquid N fertilizer application was expected [
21]. Yet the further improvement in mean canopy DGCI of plots treated by UAN or MU fertilizer complemented by Civitas was not. This is because only one study has employed instruments to quantify turfgrass canopy color or density response to Civitas Pre-M1xed Turf Defense treatment. Employ of a multispectral radiometer to determine the chlorophyll curvature vegetative index, measured using 675- to 690-nm canopy reflectance 24-h following a 2.7 L ha
–1 Civitas treatment of creeping bentgrass, identified no significant effect relative to untreated plots [
46]. In that same study, chlorophyll a, b, and carotenoids extracted from leaf tissue sampled 7-d following Civitas treatment showed no statistical difference by treatment.
Like DGCI, the above study employed one vegetative index calculated exclusively using canopy reflectance of visible wavelengths; the photochemical reflectance index (PRI). The PRI, calculated from 531- and 570-nm canopy reflectance, showed creeping bentgrass photochemical efficiency was negatively affected by 2.7 L ha
–1 Civitas treatment applied 24-h earlier [
46].
Future field research should further evaluate suitability of vegetative indices for accurate assessment of turfgrass response to liquid products containing PDSO and colorant. Achievement of this objective should facilitate additional future research quantifying foliar N-fertilizer effectively supplanted by semimonthly Civitas treatment over the growing season.
4.3. Clipping Yield by Treatment and/or Time
Stimulated vegetative/shoot growth, manifesting in greater clipping yield, is a dependable response of maintained turfgrass to increasing N availability [
21]. But despite the yield connotation, increased clipping yield poses neither an agronomic nor economic boon to managers. Simply put, and relative to the alternative, a growing turfgrass system is a functional and resilient system that promptly recuperates from divoting and/or wear injury associated with recreational use in season.
Thus cultural practices, apart from N fertilization, that subsequently increase N availability are likely to be adopted by turfgrass managers. Not because such practices stimulate shoot growth, but because they lessen the systems’ N fertilizer requirements. An example is the employ of mulching mower blades in conjunction with returning, rather than collecting and removing, turfgrass clippings (yield).
When a cultural practice that increases N availability is made in conjunction with N fertilization, it comprises an efficiency enhancement. As stated above, the authors hypothesized complementing urea-based fertilizer with a PDSO-containing product would coat the canopy and influence, i.e., reduce, NH3 diffusion (volatilization) in the 0- to 48-h following foliar treatment of golf course fairways. If the plots treated by Civitas-complimented foliar N showed significantly less NH3 volatilization than their N-only counterparts, then it seems reasonable that this fertilizer N would alternatively be recovered by creeping bentgrass, and support increased clipping yield.
Sans evidence of Civitas: (i) reducing NH3 volatilization in the 0- to 48-h following golf course fairway foliar treatment, and (ii) significantly persisting on canopy vegetation >1-d following golf course fairway foliar treatment; the authors attribute the Civitas-incited increase in mean clipping yield to biological mineralization of Cu II phthalocyanine-N in the upper soil profile.
4.4. N Offtake and Fertilizer N Recovery (FNR) by Treatment and/or Time
Given Civitas Pre-M1xed Turf Defense complementation of urea-based foliar fertilization did not influence 0- to 48-h volatilization, the significantly increased N offtake observed from such complemented plots compelled its N analysis. Future research should evaluate the fate of Civitas spray applications, particularly the recalcitrance or susceptibility of its organic-N components to biological mineralization.
For the purpose of calculating the percentage FNR, the Civitas-complimented N rate is adjusted to 9.932 from 9.76 kg ha
–1. Accounting for the estimated 0.232 kg ha
–1 N supplied in each semimonthly dose of Cu II phthalocyanine, the mean percentage of FNR of the Civitas-complimented N treatments (
Table 1) was subsequently deflated 0.53 to 0.62%. Despite this adjustment, the absolute percent FNR of Civitas-complemented treatments exceeded their ’N only’ counterparts (contrast
p ≤ 0.01).
While perhaps underwhelming relative to published and more comprehensive percent FNR values [
20,
31]; the N rate adjustment for the N in Civitas makes the pooled main effect percent FNR means (
Table 1) the more appropriate inference tool for comparing treatments. The concomitant 0.232 kg ha
–1 N load from Civitas comprised only a fraction of the FNR LSD
0.05 at 416 and 435 DFI, conferring a linear model of increased fairway bentgrass clipping yield by cumulative Civitas treatment over the two growing seasons [
47] but contrasting the detrimental effects reported in the second year of repeated applications to putting greens in the field [
14,
15,
16,
17].
5. Conclusions
Forty-eight hours following foliar application, the inclusion of PDSO + Cu II phthalocyanine had no influence on the total NH3 volatilization of the conventional urea, UAN, or MU. Fertilizer-N loss as NH3 ranged from 1.3 to 5.5% of the 9.76 kg ha–1 applied and corresponded directly to the fertilizer urea content. In the 1 to 14 d following semimonthly reapplication of treatments, Civitas PreM1xed Turf Defense inclusion had either a beneficial (MU and UAN) or negligible (urea) effect on canopy mean DGCI.
While a Civitas-associated increase in the tissue N of unfertilized colonial bentgrass has been observed, this is the first manuscript to conclude the shoot growth and N nutrition of creeping bentgrass fairways consistently increased with Civitas complementation of semimonthly commercial liquid N fertilizer. Furthermore, this work is the first to analyze homogenous Civitas PreM1xed Turf Defense and report its mean N concentration as 10 g kg–1. Over this 2-yr study, absolute mean percent fertilizer N recovery from plots treated by Civitas-complemented foliar liquid N treatment exceeded their ’N only’ counterparts by 8.7%.


