The Enduring Gender Gap in STEM: A Meta-Analysis of Gender Differences in Self-Efficacy in STEM Fields
Abstract
1. Introduction
1.1. Domain of Self-Efficacy
Participant Background
1.2. Educational Stage of Participants
1.3. Date of Study
1.4. Aim of the Current Research
2. Materials and Methods
2.1. Search Strategy to Identify Articles
- Databases: PsycInfo, ERIC, Engineering Village, PubMed1
- Search Terms: (“Gender Difference*” OR “Sex Difference*”) AND (STEM OR Scien* NOT “STEM Cell”) AND (Biolog* OR Chemist* OR Math* OR “Computer Scien*” OR Computing OR Engineer* OR Physic* NOT Physician NOT Physical) AND (“self-efficacy” OR “self efficacy” OR “anticipated success” OR confiden* OR “expectancy for success” OR competenc* OR “academic self-concept” OR “academic self concept”)
- Additional Review Citations: In addition to the database searches, we also collected potential articles cited by recent review papers (Ceci et al., 2009; Cheryan et al., 2017; Wang & Degol, 2017). Finally, to collect more recent articles that may focus on gender differences in self-efficacy in specific STEM fields (rather than STEM in general), we collected articles in a descendancy search that cited Cheryan et al. (2017).
2.2. Method of Reviewing Studies for Inclusion
2.3. Articles with Multiple Reported Effects
2.4. Data Analysis Method
2.5. Corrections for Error and Bias
2.6. Relationship Between Study Date and Effect Size
2.7. Transparency and Openness
3. Results
3.1. Descriptive Statistics for Included Effects
3.2. Gender Differences in Self-Efficacy in STEM
3.2.1. Meta-Analysis
All STEM Fields Combined
Underrepresented Versus Representation Improved
Specific STEM Fields
Gender Differences in Self-Efficacy by Educational Stage
3.3. Gender Differences by Year of Study
4. Discussion
4.1. Relationship Between Gender and STEM Self-Efficacy
4.1.1. Domain-Specific Self-Efficacy
4.1.2. Life-Stage and Gender Differences in Self-Efficacy
5. Conclusions
Supplementary Materials
Author Contributions
Funding
Institutional Review Board Statement
Informed Consent Statement
Data Availability Statement
Conflicts of Interest
| 1 | These databases were recommended by research librarians at the researcher’s university in order to access articles related to psychological constructs (e.g., self-efficacy), education, and specific STEM fields. The searches were completed in May 2023. |
| 2 | Online Resource S1 is available at https://osf.io/jt3a4/?view_only=3109a214794d406b8a3e2ef0837d8a43. Citations for all articles included in the meta-analysis are available in Supplementary F in Online Resource S1. |
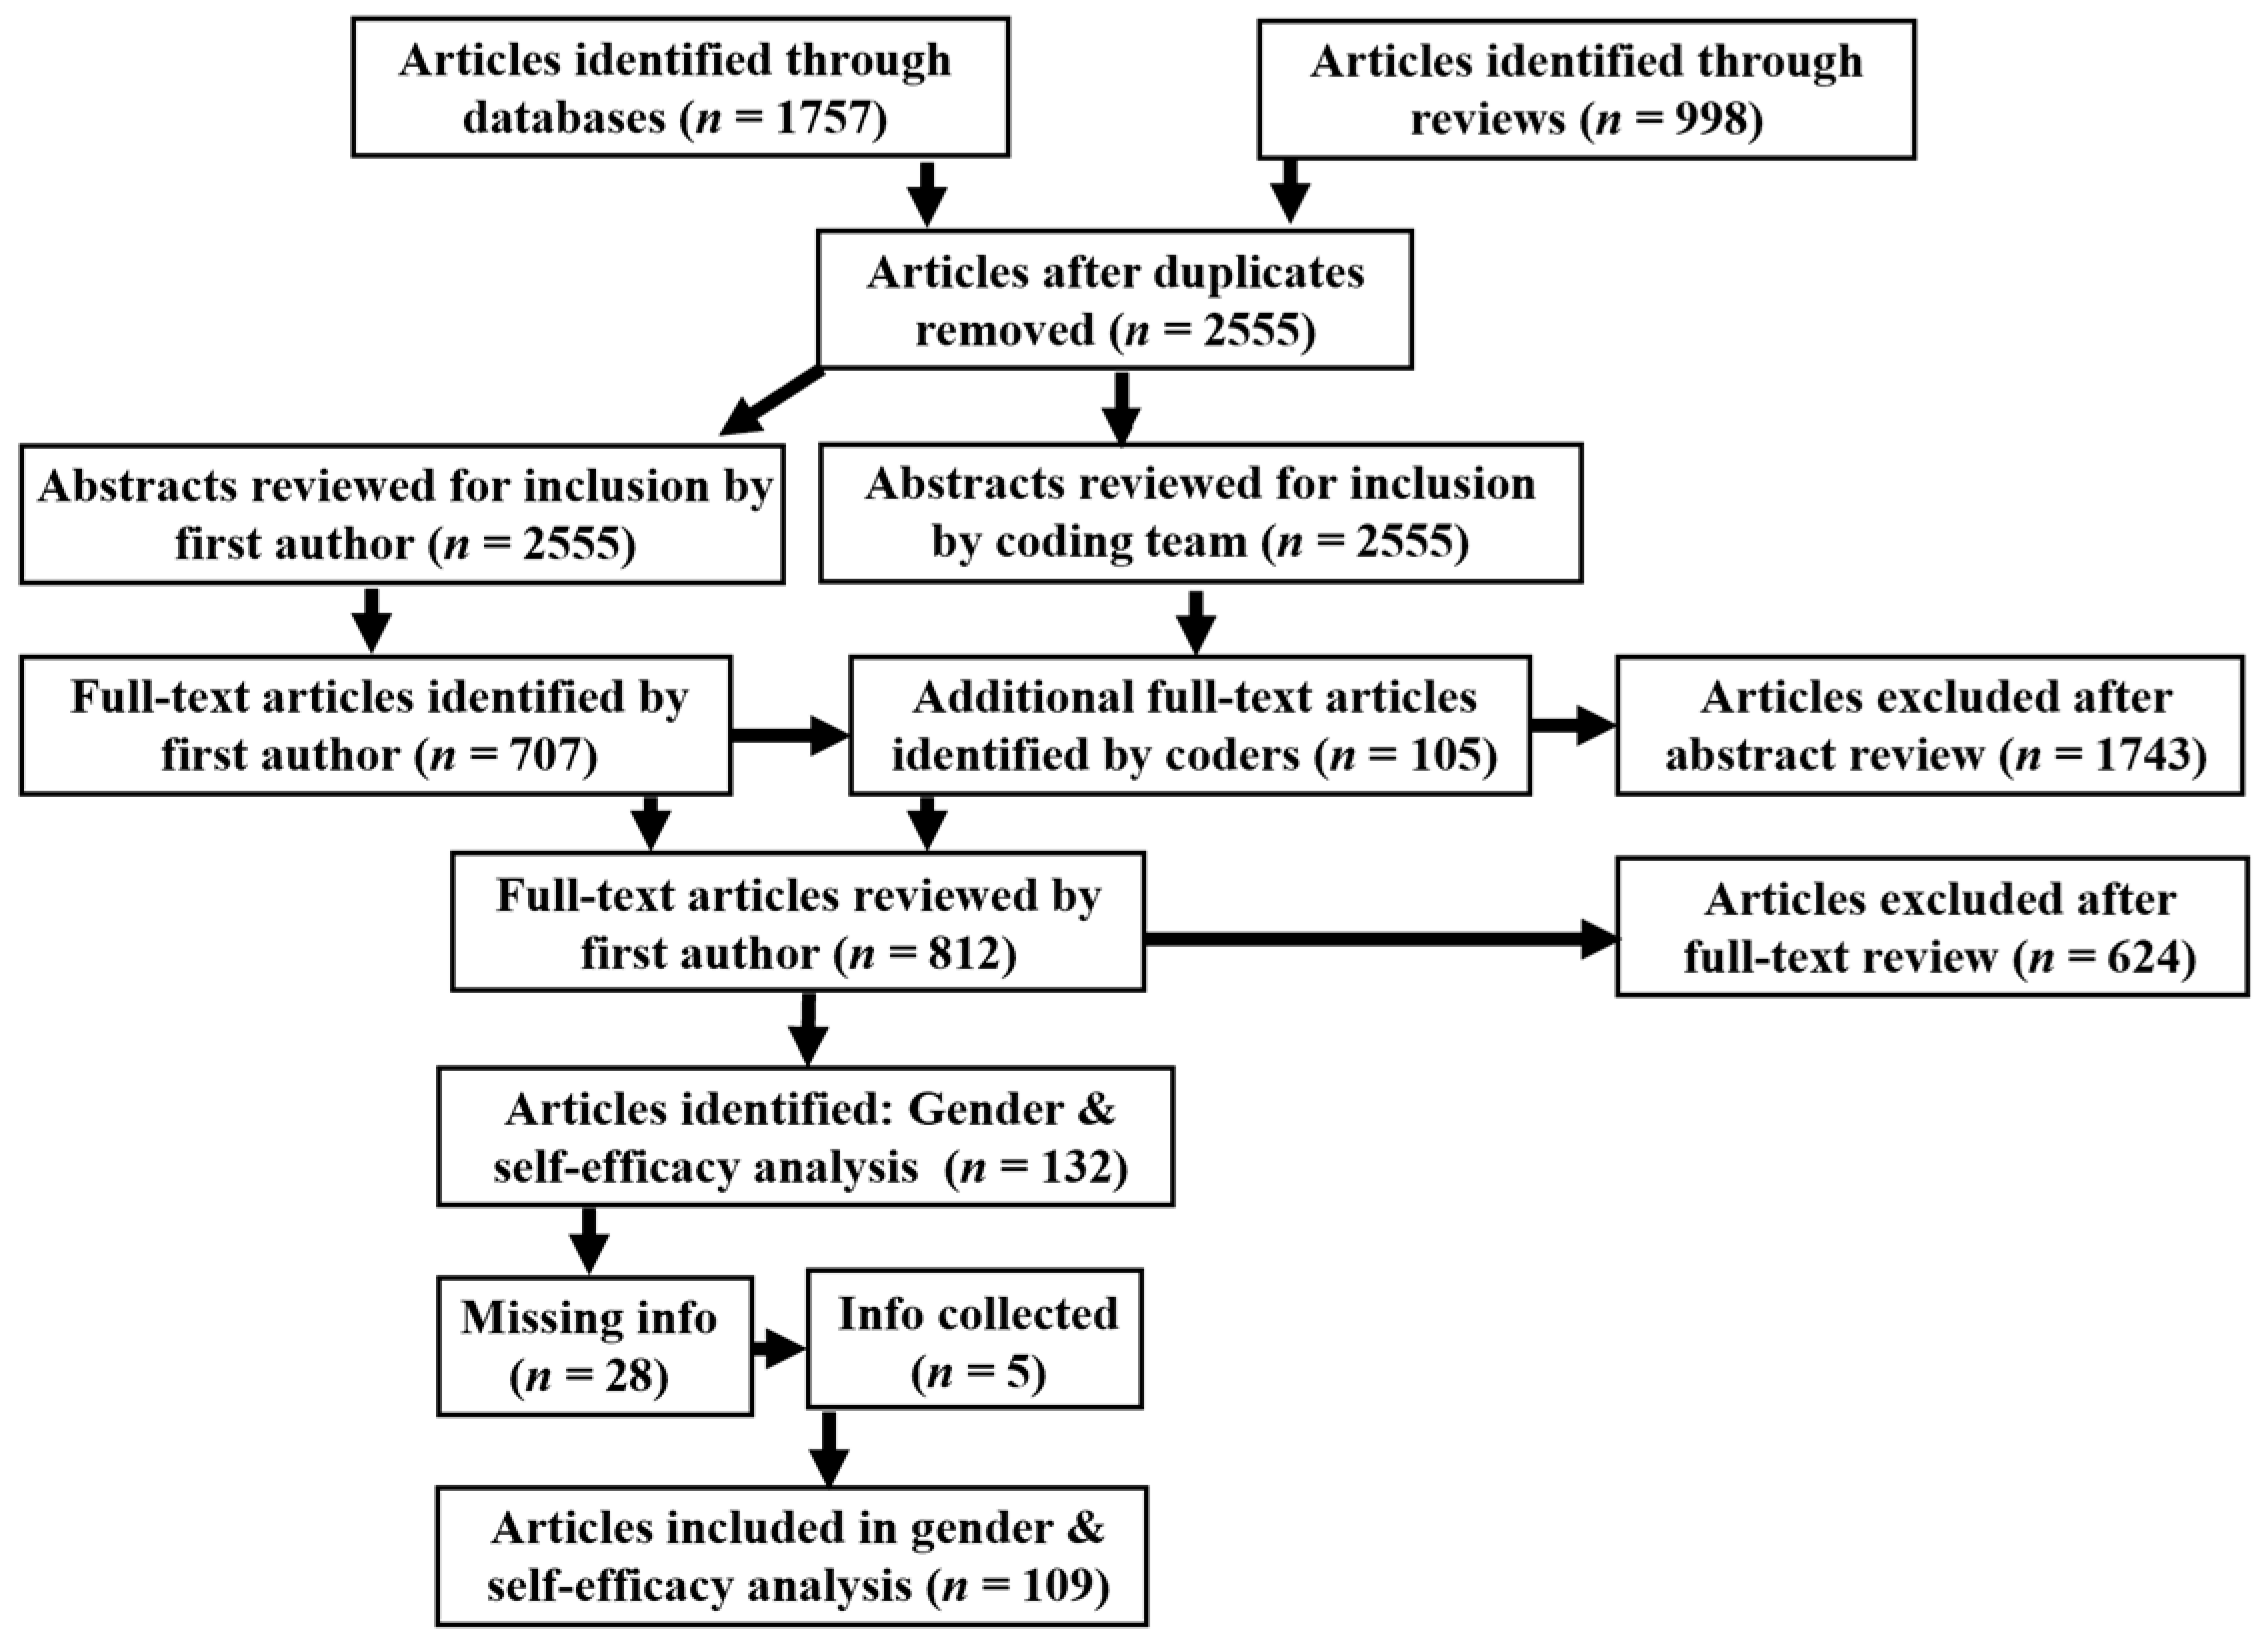
| 3 | One hundred and five abstracts were identified by coding team members but were not identified by the first author. The first author reviewed the full-text of all identified abstracts (Abstracts Identified by First Author, n = 707; Unique Abstracts Identified by Coding Team, n = 105; Total Full-Text Articles Reviewed Based on Identified Abstracts, N = 812; see the flow chart in Figure 1). |
| 4 | See Schmidt and Hunter (2017) for details regarding how the corrected effect sizes, confidence intervals, and credibility intervals are calculated. |
| 5 | In articles in which the actual year the study was conducted was reported, we used that value for the date of the study. In articles in which the year of data collection was not reported, we used publication date as a proxy for year of data collection. |
| 6 | The Hunter–Schmidt method of meta-analysis does not recommend the use of significance testing to determine if effects differ across sub-groups (see Schmidt & Hunter, 2017). For purposes of quantifying the differences in effect sizes between groups, after computing the meta-analysis statistics by sub-groups, we calculated 95% confidence intervals to provide a description of the effect size of each of the groups and to provide information for approximate statistical inference regarding differences between the groups (Cumming & Finch, 2005; Cumming, 2012). Additionally, we conducted independent group t-tests using the meta-analysis results to provide a clearer understanding of the significance of the differences between subgroups. |
| 7 | Forest plots depicting the meta-analyses findings are presented in Online Resource S1. The plots present the effects by sample size in descending order allowing for identification of potential outliers and publication bias (i.e., effect sizes that are systematically larger as sample sizes decrease; Schmidt & Hunter, 2017). In random effects models for meta-analysis, it can be problematic to distinguish between outliers and true, extreme effects especially if the sample size for the potential outlier effect is small (Schmidt & Hunter, 2017; Baker & Jackson, 2008). Erroneously eliminating true, deviant effects can lead to artificially small estimated variance in the meta-analysis effect size (for a detailed discussion of this issue see Schmidt & Hunter, 2017). As such, the current meta-analysis created forest plots to visualize the data points and identify evidence of very extreme data points that could be due to error (Schmidt & Hunter, 2017). Inspection of the plots did not reveal extreme data points that were clear outliers. As such, all effects were included in the meta-analyses. |
| 8 | See Supplementary E in Online Resource S1 for additional exploratory meta-analyses on the relationship between self-efficacy and interest and persistence in STEM fields by women’s representation. |
References
- Amatea, E. S., Cross, E. G., Clark, J. E., & Bobby, C. L. (1986). Assessing the work and family role expectations of career-oriented men and women: The life role salience scales. Journal of Marriage and the Family, 48(4), 831–838. [Google Scholar] [CrossRef] [Scilit]
- American Society for Engineering Education. (2022). Profiles of engineering and engineering technology. American Society for Engineering Education. [Google Scholar]
- Appelbaum, M., Cooper, H., Kline, R. B., Mayo-Wilson, E., Nezu, A. M., & Rao, S. M. (2018). Journal article reporting standards for quantitative research in psychology: The APA Publications and Communications Board task force report. The American Psychologist, 73(1), 3–25. [Google Scholar] [CrossRef] [Scilit] [PubMed]
- Arnett, J. J. (2000). Emerging adulthood: A theory of development from the late teens to the early twenties. American Psychologist, 55(5), 469–480. [Google Scholar]
- Baker, R. D., & Jackson, D. (2008). A new approach to outliers in meta-analysis. Health Care Management Science, 11(2), 121–131. [Google Scholar] [CrossRef] [Scilit]
- Bandura, A. (1977). Self-efficacy: Toward a unifying theory of behavioral change. Psychological Review, 84, 191–215. [Google Scholar] [CrossRef] [Scilit]
- Bandura, A. (1981). Self-referent thought: A developmental analysis of self-efficacy. In J. H. Flavell, & L. Ross (Eds.), Social cognitive development: Frontiers and possible futures. Cambridge University Press. [Google Scholar]
- Bedyńska, S., Krejtz, I., & Sedek, G. (2019). Chronic stereotype threat and mathematical achievement in age cohorts of secondary school girls: Mediational role of working memory, and intellectual helplessness. Social Psychology of Education, 22, 321–335. [Google Scholar] [CrossRef] [Scilit]
- Bonnot, V., & Croizet, J.-C. (2007). Stereotype internalization and women’s math performance: The role of interference in working memory. Journal of Experimental Social Psychology, 43(6), 857–866. [Google Scholar] [CrossRef] [Scilit]
- Borenstein, M., Hedges, L. V., Higgins, J. P., & Rothstein, H. R. (2021). Introduction to meta-analysis. John Wiley & Sons. [Google Scholar]
- Ceci, S. J., Williams, W. M., & Barnett, S. M. (2009). Women’s underrepresentation in science: Sociocultural and biological considerations. Psychological Bulletin, 135, 218–261. [Google Scholar] [CrossRef] [Scilit] [PubMed]
- Cervone, D., & Peake, P. K. (1986). Anchoring, efficacy, and action: The influence of judgmental heuristics on self-efficacy judgments and behavior. Journal of Personality and Social Psychology, 50, 492–501. [Google Scholar] [CrossRef]
- Cheryan, S., & Plaut, V. C. (2010). Explaining underrepresentation: A theory of precluded interest. Sex Roles, 63, 475–488. [Google Scholar] [CrossRef] [Scilit] [PubMed]
- Cheryan, S., Ziegler, S. A., Montoya, A. K., & Jiang, L. (2017). Why are some STEM fields more gender balanced than others? Psychological Bulletin, 143(1), 1–35. [Google Scholar] [CrossRef] [Scilit]
- Cleveland, W. S. (1981). LOWESS: A program for smoothing scatter plots by robust locally weighted regression. The American Statistician, 35, 54. [Google Scholar] [CrossRef] [Scilit]
- Cohen, J. A. (1960). A coefficient of agreement for nominal scales. Educational and Psychological Measurement, 20, 37–46. [Google Scholar] [CrossRef] [Scilit]
- Cohen, J. A. (1988). Statistical power analysis for the behavioral sciences (2nd ed.). Lawrence Erlbaum. [Google Scholar]
- Concannon, J. P., & Barrow, L. H. (2009). A cross-sectional study of engineering students’ self-efficacy by gender, ethnicity, year, and transfer status. Journal of Science Education and Technology, 18, 163–172. [Google Scholar] [CrossRef] [Scilit]
- Cooper, H. (2017). Research synthesis and meta-analysis: A step-by-step approach (5th ed.). Sage. [Google Scholar]
- Cumming, G. (2012). Understanding the new statistics: Effect sizes, confidence intervals, and meta-analysis. Routledge. [Google Scholar]
- Cumming, G., & Finch, S. (2005). Inference by eye: Confidence intervals and how to read pictures of data. American Psychologist, 60(2), 170–180. [Google Scholar] [CrossRef] [Scilit]
- Department of Education. (2021). Digest of education statistics. National Center for Education Statistics. Available online: https://nces.ed.gov/programs/digest/current_tables.asp (accessed on 5 May 2023).
- Fredricks, J. A., & Eccles, J. S. (2002). Children’s competence and value beliefs from childhood through adolescence: Growth trajectories in two male-sex-typed domains. Developmental Psychology, 38(4), 519–533. [Google Scholar] [CrossRef] [PubMed]
- Fry, R., Kennedy, B., & Funk, C. (2021, April 1). STEM jobs see uneven progress in increasing gender, racial and ethnic diversity. Pew Research Center. Available online: https://www.pewresearch.org/science/2021/04/01/stem-jobs-see-uneven-progress-in-increasing-gender-racial-and-ethnic-diversity/ (accessed on 5 May 2023).
- Gelernter, D. (1999, June 21). Women and science at Yale. The Weekly Standard. [Google Scholar]
- Glanville, J. (2019). Searching bibliographic databases. In H. Cooper, L. V. Hedges, & J. C. Valentine (Eds.), The handbook of research synthesis and meta-analysis (pp. 73–100). Russell Sage Foundation. [Google Scholar] [CrossRef] [Scilit]
- Henry, P. J. (2024, April). Gender gaps in employment go deeper than women’s choices: Economists who declare the “myth” of gender gaps are neglecting psychology. Psychology Today. Available online: https://www.psychologytoday.com/intl/blog/the-gender-revolution/202404/gender-gaps-in-employment-go-deeper-than-womens-choices (accessed on 5 May 2023).
- Henry, P. J., & Sears, D. O. (2009). The crystallization of contemporary racial prejudice across the lifespan. Political Psychology, 30, 569–590. [Google Scholar] [CrossRef] [Scilit]
- Huang, C. (2013). Gender differences in academic self-efficacy: A meta-analysis. European Journal of Psychology of Education, 28(1), 1–35. [Google Scholar] [CrossRef] [Scilit]
- Huguet, P., & Régner, I. (2007). Stereotype threat among schoolgirls in quasi-ordinary classroom circumstances. Journal of Educational Psychology, 99(3), 545–560. [Google Scholar] [CrossRef] [Scilit]
- Hunter, J. E., & Schmidt, F. L. (1980). Methods of meta-analysis: Correcting error and bias in research findings. Sage Publications. [Google Scholar]
- Hyde, J. S., Fennema, E., Ryan, M., Frost, L. A., & Hopp, C. (1990). Gender comparisons of mathematics attitudes and affect: A meta-analysis. Psychology of Women Quarterly, 14(3), 299–324. [Google Scholar] [CrossRef] [Scilit]
- Lent, R. W., Brown, S. D., Sheu, H.-B., Schmidt, J., Brenner, B. R., Gloster, C. S., Wilkins, G., Schmidt, L. C., Lyons, H., & Treistman, D. (2005). Social cognitive predictors of academic interests and goals in engineering: Utility for women and students at historically black universities. Journal of Counseling Psychology, 52(1), 84–92. [Google Scholar] [CrossRef] [Scilit]
- Liem, G. A. D., & Martin, A. J. (2012). The motivation and engagement scale: Theoretical framework, psychometric properties, and applied yields. Australian Psychologist, 47(1), 3–13. [Google Scholar] [CrossRef] [Scilit]
- Martinez, A., & Christnacht, C. (2021, January 26). Women are nearly half of U.S. workforce but only 27% of STEM workers. United States Census Bureau. Available online: https://www.census.gov/library/stories/2021/01/women-making-gains-in-stem-occupations-but-still-underrepresented.html (accessed on 5 May 2023).
- Matskewich, H. E., & Cheryan, S. (2016). Comparing stereotypes and attitudes across STEM fields [data files and codebooks]. Available online: https://osf.io/6gmn5 (accessed on 5 May 2023).
- Muzzatti, B., & Agnoli, F. (2007). Gender and mathematics: Attitudes and stereotype threat susceptibility in Italian children. Developmental Psychology, 43(3), 747–759. [Google Scholar] [CrossRef] [Scilit]
- National Science Foundation. (2014). Integrated postsecondary education data system, completions. National Center for Science and Engineering Statistics: Integrated Science and Engineering Resources Data System. [Google Scholar]
- National Science Foundation. (2018). Field of degree: Women. National Center for Science and Engineering Statistics. Available online: https://ncses.nsf.gov/pubs/nsf21321/report/field-of-degree-women (accessed on 5 May 2023).
- Park, G., Lubienski, D., & Benbow, C. P. (2007). Contrasting intellectual patterns predict creativity in the arts and sciences. Psychological Science, 18, 948–952. [Google Scholar] [CrossRef] [Scilit]
- Parker, P. D., Van Zanden, B., Marsh, H. W., Owen, K., Duineveld, J. J., & Noetel, M. (2020). The intersection of gender, social class, and cultural context: A meta-analysis. Educational Psychology Review, 32, 197–228. [Google Scholar] [CrossRef] [Scilit]
- Raudenbush, S. W. (2009). Random effects models. In H. Cooper, L. V. Hedges, & J. C. Valentine (Eds.), The handbook of research synthesis and meta-analysis (2nd ed., pp. 295–315). Russell Sage. [Google Scholar]
- Robbins, S. B., Lauver, K., Le, H., Davis, D., Langley, R., & Carlstrom, A. (2004). Do psychosocial and study skill factors predict college outcomes? A meta-analysis. Psychological Bulletin, 130(2), 261–288. [Google Scholar] [CrossRef] [Scilit]
- Rosson, M. B., Carroll, J. M., & Sinha, H. (2011). Orientation of undergraduates toward careers in the computer and information sciences: Gender, self-efficacy and social support. ACM Transactions on Computing Education, 11(3), 14. [Google Scholar] [CrossRef] [Scilit]
- Sax, L. J. (1994). Mathematical self-concept: How college reinforces the gender gap. Research in Higher Education, 35, 141–166. [Google Scholar] [CrossRef] [Scilit]
- Schmidt, F. L., & Hunter, J. E. (1977). Development of a general solution to the problem of validity generalization. Journal of Applied Psychology, 62, 529–540. [Google Scholar] [CrossRef]
- Schmidt, F. L., & Hunter, J. E. (2017). Methods of meta-analysis: Correcting error and bias in research findings (3rd ed.). SAGE Publications, Ltd. [Google Scholar]
- Schmidt, F. L., & Le, H. (2014). Software for the Hunter-Schmidt meta-analysis methods (V.2.0). University of Iowa, Department of Management & Organizations. [Google Scholar]
- Schunk, D. H. (1984). Enhancing self-efficacy and achievement through rewards and goals: Motivational and informational effects. The Journal of Educational Research, 78(1), 29–34. [Google Scholar] [CrossRef] [Scilit]
- Shadish, W. R., Matt, G. E., Navarro, A. M., & Phillips, G. (2000). The effects of psychological therapies under clinically representative conditions: A meta-analysis. Psychological Bulletin, 126(4), 512–529. [Google Scholar] [CrossRef] [Scilit]
- Steele, C., & Aronson, J. (1995). Stereotype threat and the intellectual test performance of African Americans. Journal of Personality and Social Psychology, 69(5), 797–811. [Google Scholar] [CrossRef]
- The EndNote Team. (2013). EndNote (X9) [Computer software]. Clarivate Analytics.
- Usher, E. L. (2009). Sources of middle school students’ self-efficacy in mathematics: A qualitative investigation. American Educational Research Journal, 46(1), 275–314. [Google Scholar] [CrossRef] [Scilit]
- Usher, E. L., & Pajares, F. (2006). Sources of academic and self-regulatory efficacy beliefs of entering middle school students. Contemporary Educational Psychology, 31(2), 125–141. [Google Scholar] [CrossRef] [Scilit]
- Valentine, J. C., Hedges, L. V., & Cooper, H. (2019). The handbook of research synthesis and meta-analysis (3rd ed.). Russell Sage Foundation. [Google Scholar]
- Wang, M. T., & Degol, J. L. (2017). Gender gap in science, technology, engineering, and mathematics (STEM): Current knowledge, implications for practice, policy, and future directions. Educational Psychology Review, 29, 119–140. [Google Scholar] [CrossRef] [Scilit]
- Wang, M. T., Eccles, J. S., & Kenny, S. (2013). Not lack of ability but more choice: Individual and gender differences in STEM career choice. Psychological Science, 24, 770–775. [Google Scholar] [CrossRef] [Scilit]
- White, H. D. (2019). Scientific communication and literature retrieval. In H. Cooper, L. V. Hedges, & J. C. Valentine (Eds.), The handbook of research synthesis and meta-analysis (3rd ed., pp. 51–71). Russell Sage Foundation. [Google Scholar]
- Whitely, B. E. (1997). Gender differences in computer related attitudes and behavior: A meta analysis. Computers in Human Behavior, 13(1), 1–22. [Google Scholar] [CrossRef] [Scilit]
- Wigfield, A., Eccles, J. S., Mac Iver, D., Reuman, D. A., & Midgley, C. (1991). Transitions during early adolescence: Changes in children’s domain-specific self-perceptions and general self-esteem across the transition to junior high school. Developmental Psychology, 27(4), 552–565. [Google Scholar] [CrossRef]
- Zeldin, A. L., Britner, S. L., & Pajares, F. (2008). A comparative study of the self-efficacy beliefs of successful men and women in mathematics, science, and technology careers. Journal of Research in Science Teaching, 45(9), 1036–1058. [Google Scholar] [CrossRef] [Scilit]
- Zeldin, A. L., & Pajares, F. (2000). Against the odds: Self-efficacy beliefs of women in mathematical, scientific, and technological careers. American Educational Research Journal, 37(1), 215–246. [Google Scholar] [CrossRef]
- Zimmerman, B. J., Bandura, A., & Martinez-Pons, M. (1992). Self-motivation for academic attainment: The role of self-efficacy beliefs and personal goal setting. American Educational Research Journal, 29(3), 663–676. [Google Scholar] [CrossRef]



| Criteria | Description |
|---|---|
| Quantitative Measures and Statistical Information | Studies must include quantitative measures of gender composition of sample and self-efficacy in STEM. Each included study must have a quantitative result reported for the relationship between gender and the self-efficacy variable. For example, the study could report mean self-efficacy values for males and females, a correlation between gender and the self-efficacy variable, a regression coefficient between gender and self-efficacy. Measures of self-efficacy were defined as measures that assessed an individual’s judgments about their skills and abilities to succeed. |
| STEM Field Specific | Studies must focus on one or more of the STEM fields where women are currently underrepresented (i.e., computer science, engineering, physics) and/or STEM fields where women’s representation has improved (i.e., math, chemistry, biology). Study sample must be currently involved in the specific STEM field (e.g., enrolled in a Chemistry course; Chemistry majors; Chemistry professionals). |
| Participants | To allow for comparisons in self-efficacy, samples must include both male and female participants. |
| Date of Publication | No restrictions for publication date. |
| Publication Type | Publications can include peer-reviewed articles and peer-reviewed conference papers. |
| Language | Full-text must be available in English. |
| Location | To limit differences due to structure of the education system and national culture, samples must be located within the United States. |
| New and Original Data | Systematic reviews, meta-analyses, and literature reviews that do not present new data findings were excluded. |
| Articles | Computer Science | Engineering | Physics | Biology | Chemistry | Math | Total Effects | |
|---|---|---|---|---|---|---|---|---|
| SE Gender Comparison | 109 | 16 | 17 | 24 | 12 | 8 | 67 | 144 |
| Male Greater than Female | Female Greater than Male | No Significant Difference | Total Number of Effects | ||
|---|---|---|---|---|---|
| Representation Improved | Biology | 4 (33.3%) | 1 (8.3%) | 7 (58.3%) | 12 |
| Chemistry | 5 (62.5%) | 0 (0%) | 3 (37.5%) | 8 | |
| Math | 43 (64.2%) | 1 (1.5%) | 23 (34.3%) | 67 | |
| Totals | 52 (59.8%) | 2 (2.3%) | 33 (37.9%) | 87 | |
| Underrepresented | Computer Science | 12 (75.0%) | 0 (0%) | 4 (25.0%) | 16 |
| Physics | 23 (95.8%) | 0 (0%) | 1 (4.2%) | 24 | |
| Engineering | 8 (47.1%) | 1 (5.9%) | 8 (47.1%) | 17 | |
| Totals | 43 (75.4%) | 1 (1.8%) | 13 (22.8%) | 57 | |
| All STEM Fields Combined | |
|---|---|
| # of Effects (k) | 145 |
| Mean d-Value | 0.308 |
| 95% Confidence Interval | 0.273–0.342 |
| 80% Credibility Interval | 0.050–0.566 |
| Variance of d-Values | 0.045 |
| Variance due to Artifacts | 0.005 |
| Percent Variance due to Artifacts | 10.1% |
| Bare Bones Mean d-Value | 0.277 |
| Bare Bones Variance of d-Values | 0.031 |
| Underrepresented | Representation Improved | |
|---|---|---|
| # of Effects (k) | 58 | 87 |
| Mean d-Value | 0.521 | 0.234 |
| 95% Confidence Interval | 0.451–0.590 | 0.207–0.262 |
| 80% Credibility Interval | 0.201–0.840 | 0.101–0.368 |
| Variance of d-Values | 0.073 | 0.017 |
| Variance due to Artifacts | 0.010 | 0.006 |
| Percent Variance due to Artifacts | 14.32% | 36.62% |
| Bare Bones Mean d-Value | 0.469 | 0.210 |
| Bare Bones Variance of d-Values | 0.041 | 0.009 |
| Representation Improved | Underrepresented | |||||
|---|---|---|---|---|---|---|
| Biology | Math | Chemistry | Engineering | Physics | Computer Science | |
| # of Effects (k) | 12 | 67 | 8 | 17 | 24 | 16 |
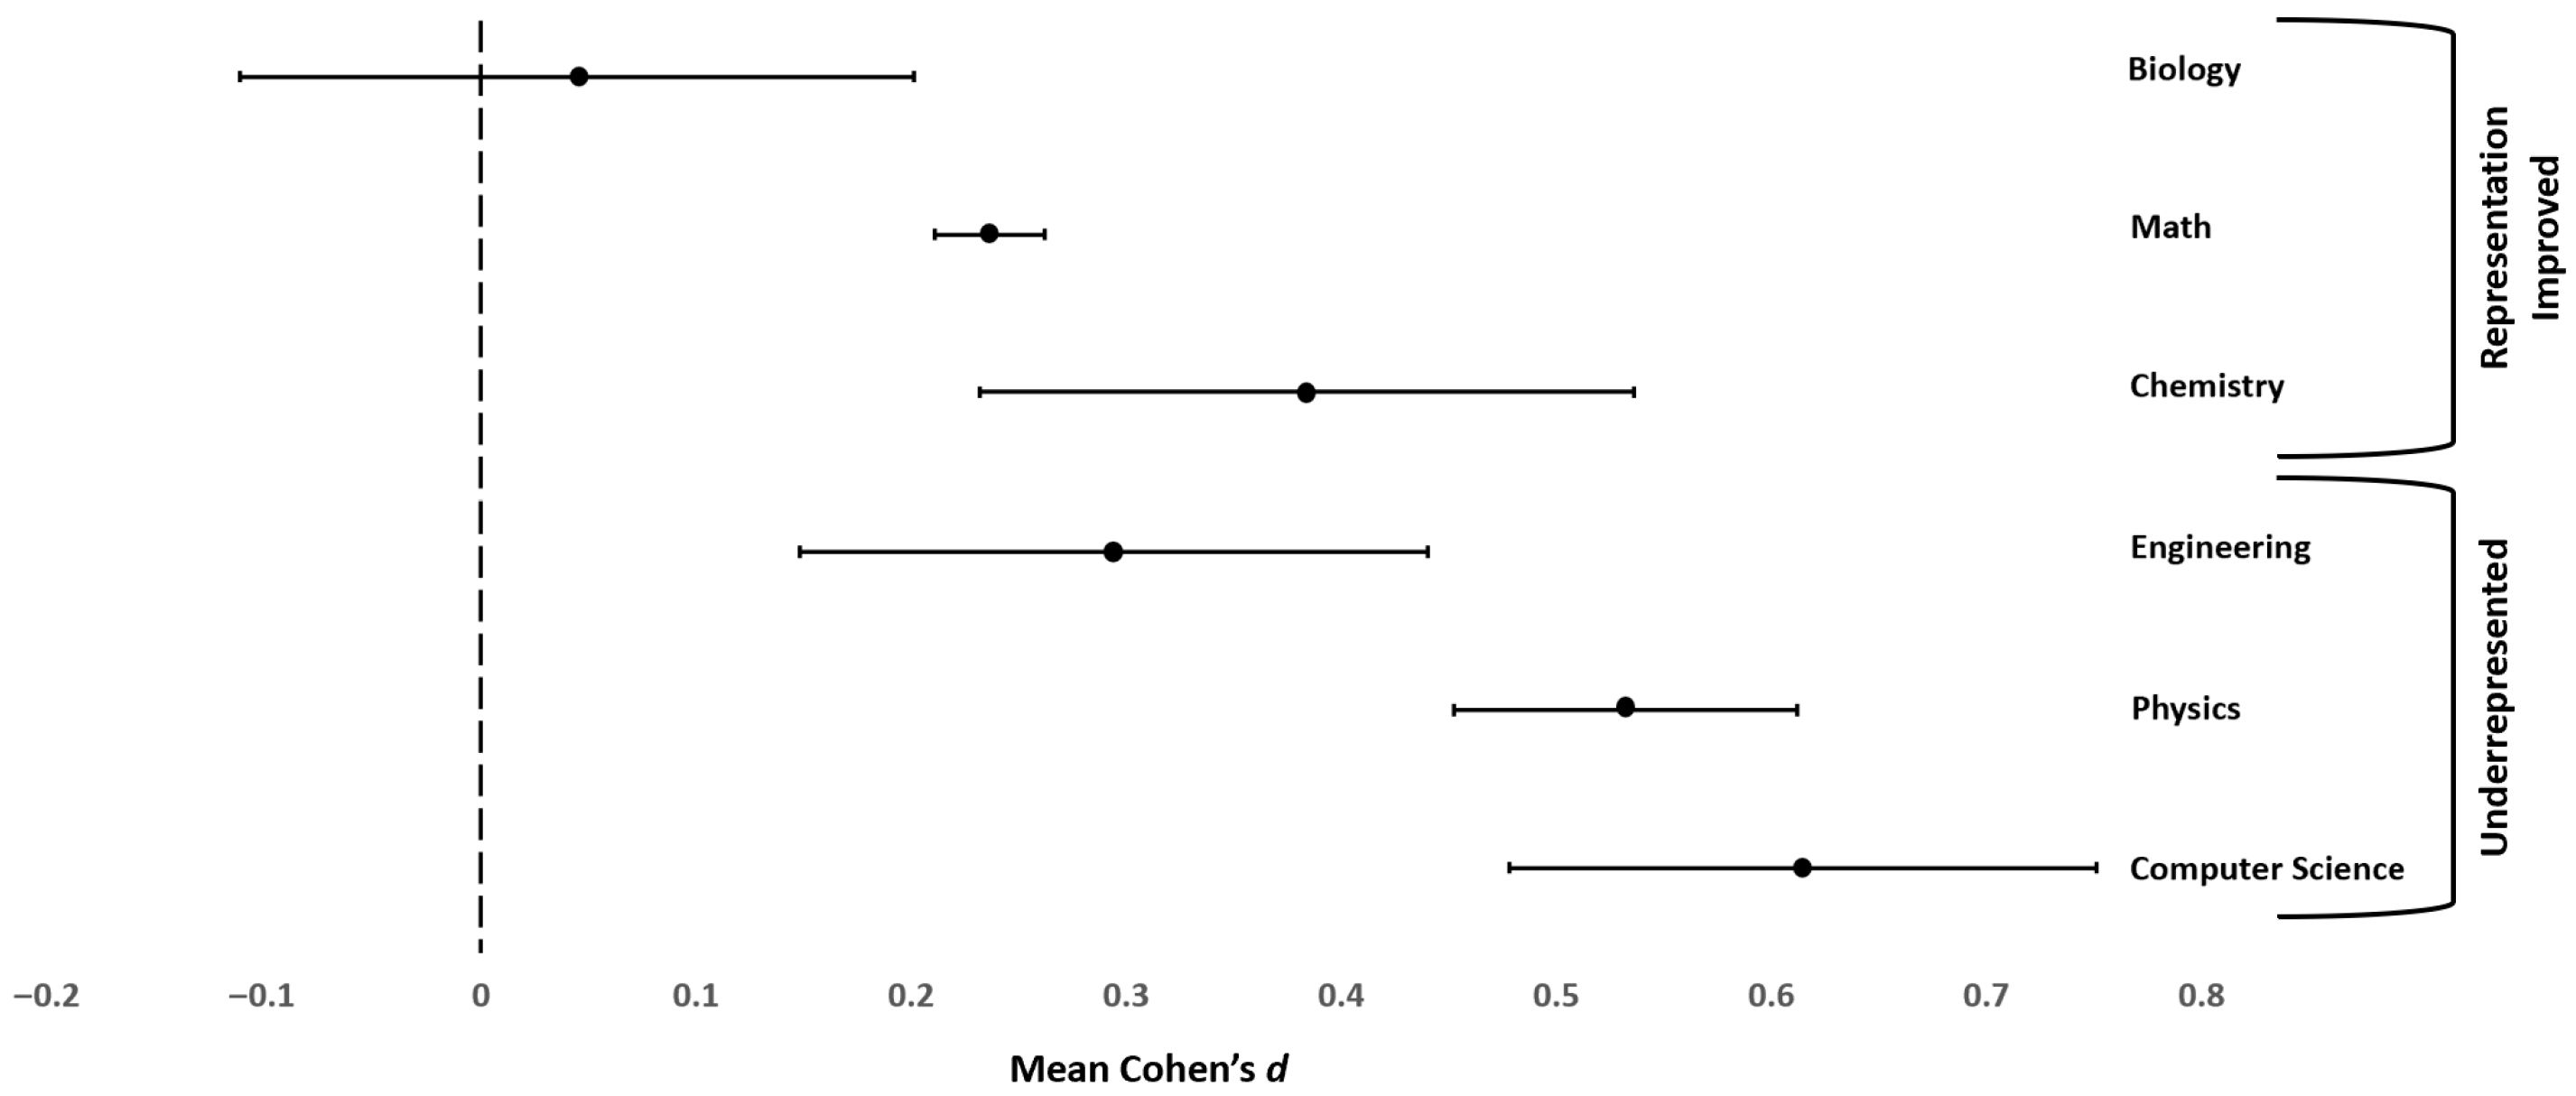
| Mean d-Value | 0.045 | 0.236 | 0.384 | 0.294 | 0.532 | 0.615 |
| 95% Confidence Interval | −0.112–0.201 | 0.211–0.262 | 0.232–0.536 | 0.148–0.440 | 0.452–0.612 | 0.478–0.751 |
| 80% Credibility Interval | −0.250–0.339 | 0.136–0.336 | 0.156–0.612 | −0.060–0.648 | 0.308–0.756 | 0.278–0.951 |
| Variance of d-Values | 0.077 | 0.011 | 0.048 | 0.094 | 0.040 | 0.078 |
| Variance due to Artifacts | 0.024 | 0.005 | 0.017 | 0.018 | 0.009 | 0.009 |
| % Variance due to Artifacts | 30.80% | 45.92% | 34.29% | 19.01% | 22.55% | 11.06% |
| Bare Bones Mean d-Value | 0.046 | 0.211 | 0.355 | 0.268 | 0.491 | 0.527 |
| Bare Bones Variance | 0.046 | 0.005 | 0.022 | 0.060 | 0.020 | 0.038 |
| Biology | Chemistry | Math | Physics | Engineering | |
|---|---|---|---|---|---|
| Biology Mean d-Value: 0.045 95CI: −0.112–0.201 | |||||
| Chemistry Mean d-Value: 0.384 95CI: 0.232–0.536 | t(18) = 2.901, p = 0.010 | ||||
| Math Mean d-Value: 0.236 95CI: 0.211–0.262 | t(77) = 4.265, p < 0.0001 | t(73) = 3.278, p = 0.002 | |||
| Physics Mean d-Value: 0.532 95CI: 0.452–0.612 | t(34) = 6.047, p < 0.0001 | t(30) = 1.772, p = 0.087 | t(89) = 9.145, p < 0.0001 | ||
| Engineering Mean d-Value: 0.294 95CI: 0.148–0.440 | t(27) = 2.238, p = 0.034 | t(23) = 0.741, p = 0.466 | t(82) = 1.294, p = 0.200 | t(39)= 3.009, p = 0.005 | |
| Computer Science Mean d-Value: 0.615 95CI: 0.478–0.751 | t(26) = 5.366, p < 0.0001 | t(22) = 2.041, p = 0.054 | t(81) = 8.904, p < 0.0001 | t(38) = 1.100, p = 0.280 | t(31) = 3.137, p = 0.004 |
| Elementary | Middle School | High School | Undergraduate | Grad School | Career | |
|---|---|---|---|---|---|---|
| Computer Science | 1 | 4 | 1 | 6 | 1 | - |
| Engineering | 1 | - | - | 13 | - | 1 |
| Physics | - | - | - | 22 | - | - |
| Biology | - | - | 2 | 7 | 1 | - |
| Chemistry | - | - | - | 7 | - | - |
| Math | 11 | 30 | 13 | 8 | - | - |
| Life Stages | |||
|---|---|---|---|
| Elementary | Middle School | High School | |
| # of Effects (k) | 11 | 30 | 13 |
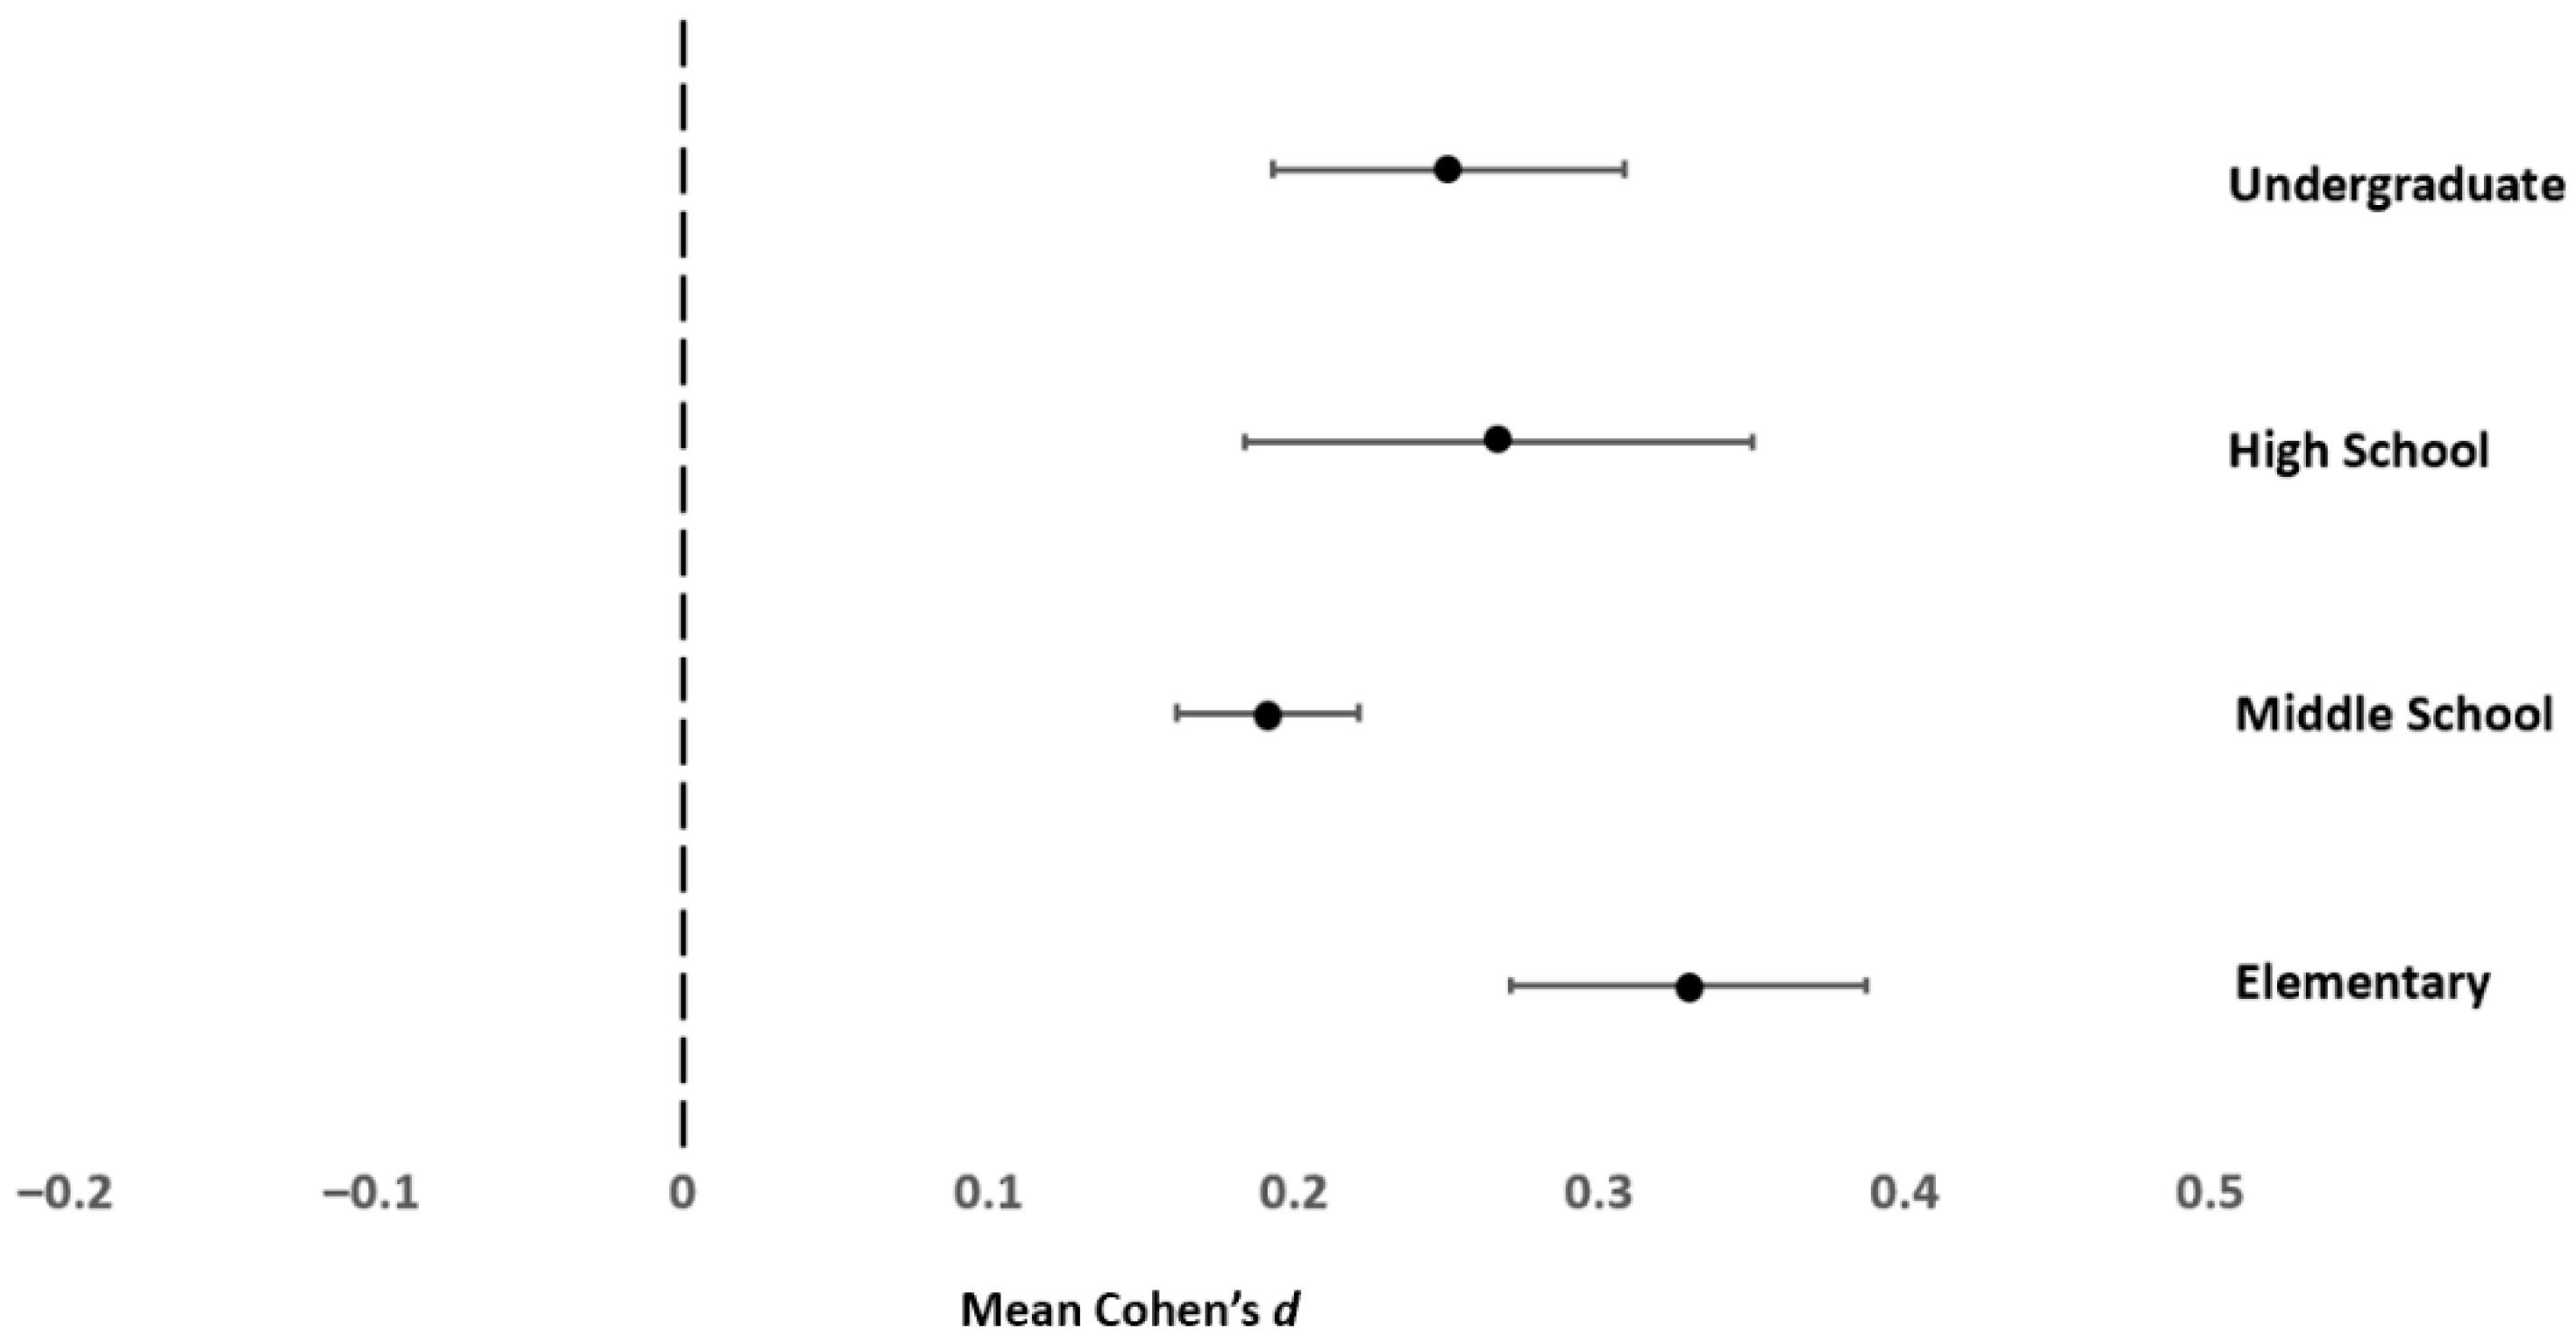
| Mean d-Value | 0.329 | 0.191 | 0.267 |
| 95% Confidence Interval | 0.271–0.387 | 0.162–0.221 | 0.184–0.350 |
| 80% Credibility Interval | 0.250–0.408 | 0.142–0.241 | 0.111–0.423 |
| Variance of d-Values | 0.010 | 0.007 | 0.023 |
| Variance due to Artifacts | 0.006 | 0.005 | 0.009 |
| % Variance due to Artifacts | 59.68% | 77.72% | 36.79% |
| Bare Bones Mean d-Value | 0.300 | 0.170 | 0.244 |
| Bare Bones Variance | 0.003 | 0.002 | 0.013 |
| Elementary | Middle School | High School | Undergraduate | |
|---|---|---|---|---|
| Elementary Mean d-Value: 0329 95CI: 0.271–0.387 | ||||
| Middle School Mean d-Value: 0.191 95CI: 0.162–0.221 | t(39) = 4.430, p < 0.0001 | |||
| High School Mean d-Value: 0.267 95CI: 0.184–0.350 | t(22) = 1.156, p = 0.260 | t(41) = 2.111, p = 0.041 | ||
| Undergraduate Mean d-Value: 0.250 95CI: 0.193–0.308 | t(17) = 1.814, p = 0.087 | t(36) = 1.765, p = 0.086 | t(19) = 0.289, p = 0.776 |
Disclaimer/Publisher’s Note: The statements, opinions and data contained in all publications are solely those of the individual author(s) and contributor(s) and not of MDPI and/or the editor(s). MDPI and/or the editor(s) disclaim responsibility for any injury to people or property resulting from any ideas, methods, instructions or products referred to in the content. |
© 2026 by the authors. Licensee MDPI, Basel, Switzerland. This article is an open access article distributed under the terms and conditions of the Creative Commons Attribution (CC BY) license.
Share and Cite
McMichael, S.L.; West, S.G.; Kwan, V.S.Y. The Enduring Gender Gap in STEM: A Meta-Analysis of Gender Differences in Self-Efficacy in STEM Fields. Behav. Sci. 2026, 16, 141. https://doi.org/10.3390/bs16010141
McMichael SL, West SG, Kwan VSY. The Enduring Gender Gap in STEM: A Meta-Analysis of Gender Differences in Self-Efficacy in STEM Fields. Behavioral Sciences. 2026; 16(1):141. https://doi.org/10.3390/bs16010141
Chicago/Turabian StyleMcMichael, Samantha L., Stephen G. West, and Virginia S. Y. Kwan. 2026. "The Enduring Gender Gap in STEM: A Meta-Analysis of Gender Differences in Self-Efficacy in STEM Fields" Behavioral Sciences 16, no. 1: 141. https://doi.org/10.3390/bs16010141
APA StyleMcMichael, S. L., West, S. G., & Kwan, V. S. Y. (2026). The Enduring Gender Gap in STEM: A Meta-Analysis of Gender Differences in Self-Efficacy in STEM Fields. Behavioral Sciences, 16(1), 141. https://doi.org/10.3390/bs16010141