
Ratings or Sales? The Neural and Psychological Processes of Online Experience Product Purchase: Evidence from a Sample of Chinese University Students


Abstract
1. Introduction
2. Theoretical Background and Hypothesis Development
2.1. Online Cues and Cue Diagnosticity Framework
2.2. Product Type Theory
2.3. Behavioural Hypotheses
2.4. ERP Method
2.5. ERP Components and ERP Hypotheses
2.5.1. P2 Hypothesis
2.5.2. N400 Hypothesis
2.5.3. LPP Hypothesis
3. Materials and Methods
3.1. Subjects
3.2. Materials
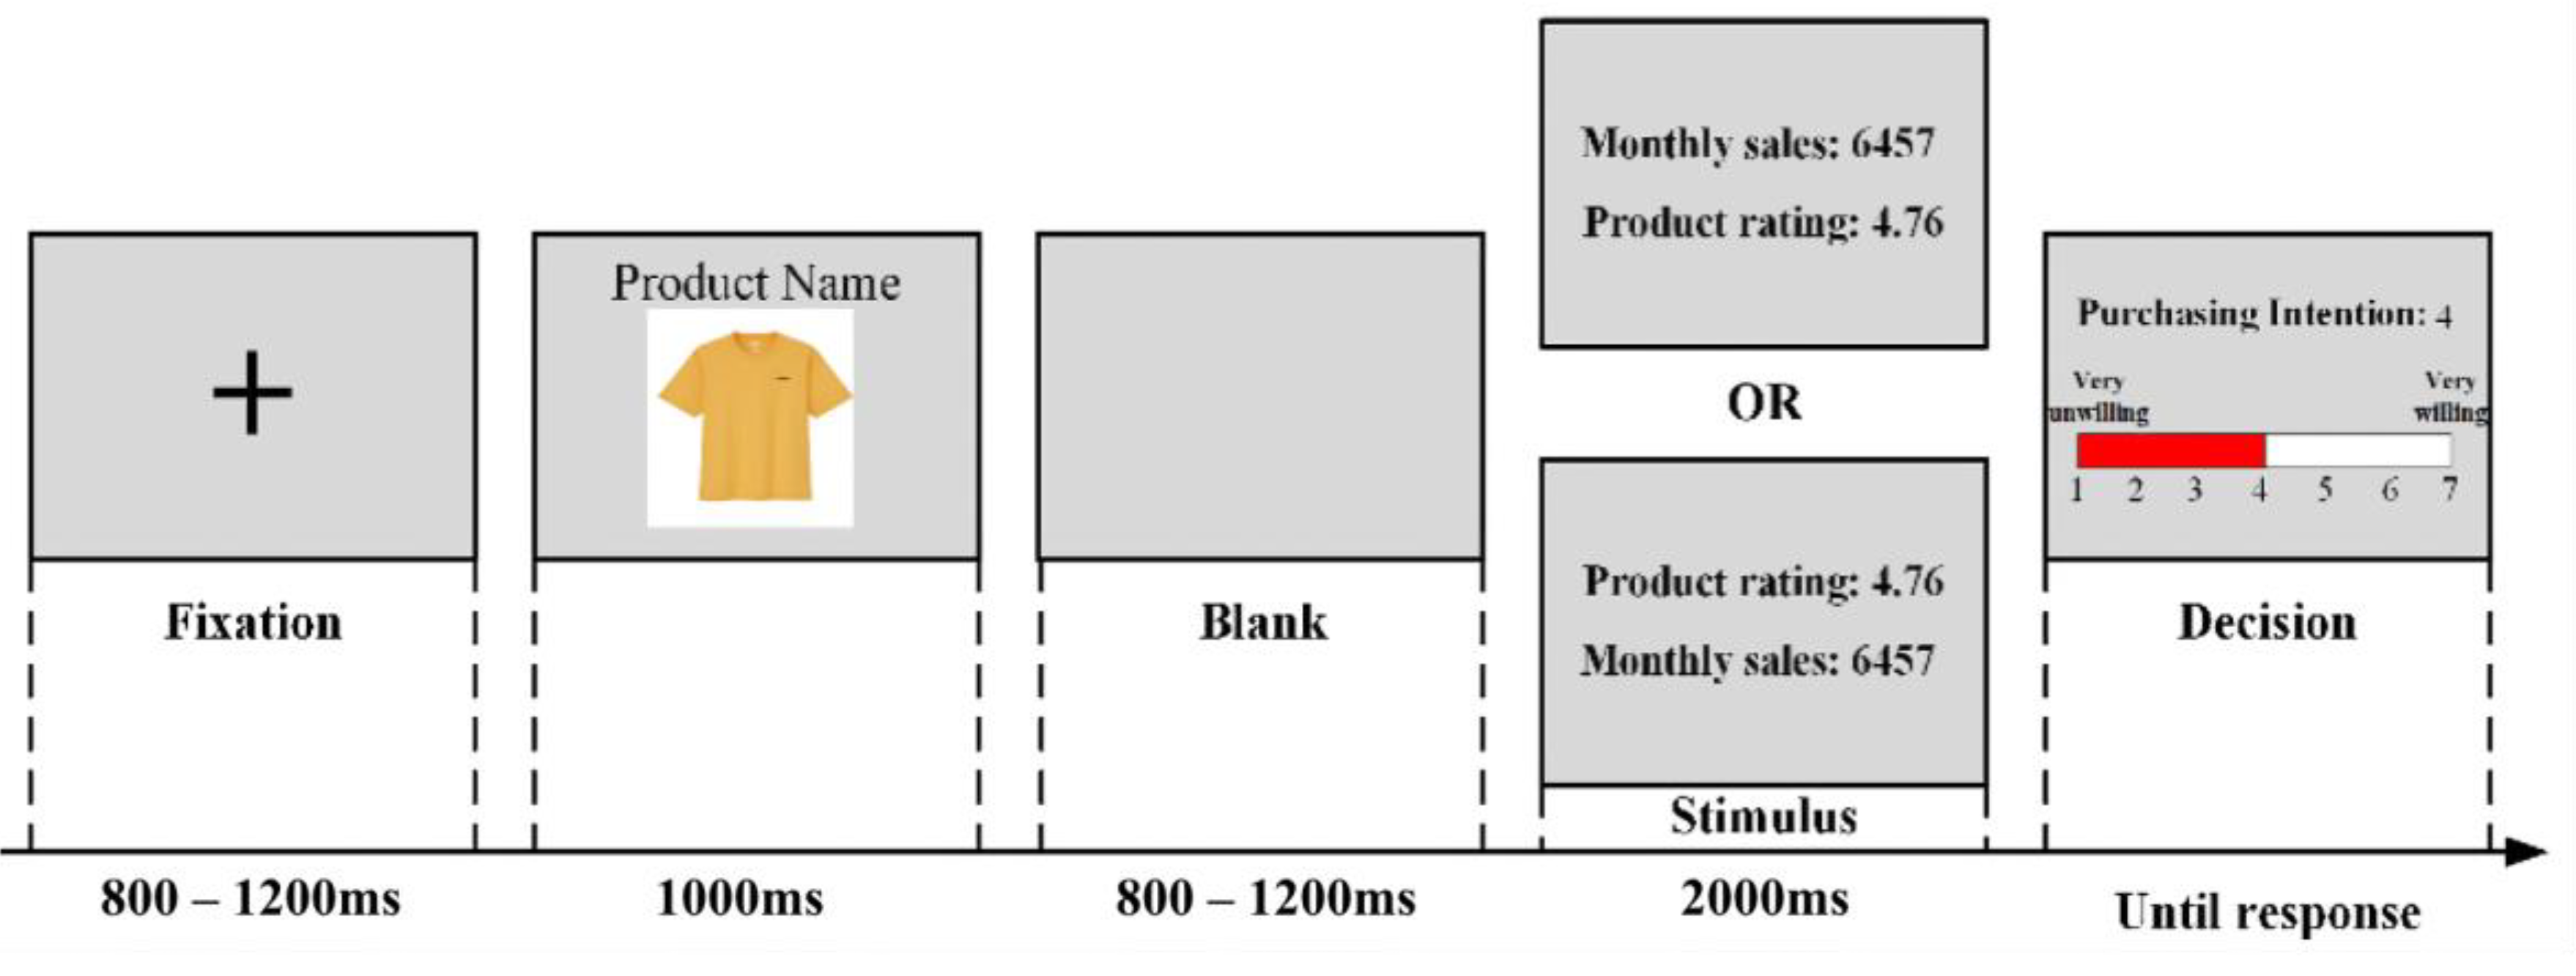
3.3. Procedures
3.4. Behavioural Data Recording and Analysis
3.5. Electroencephalograph (EEG) Recording and Analysis
4. Results
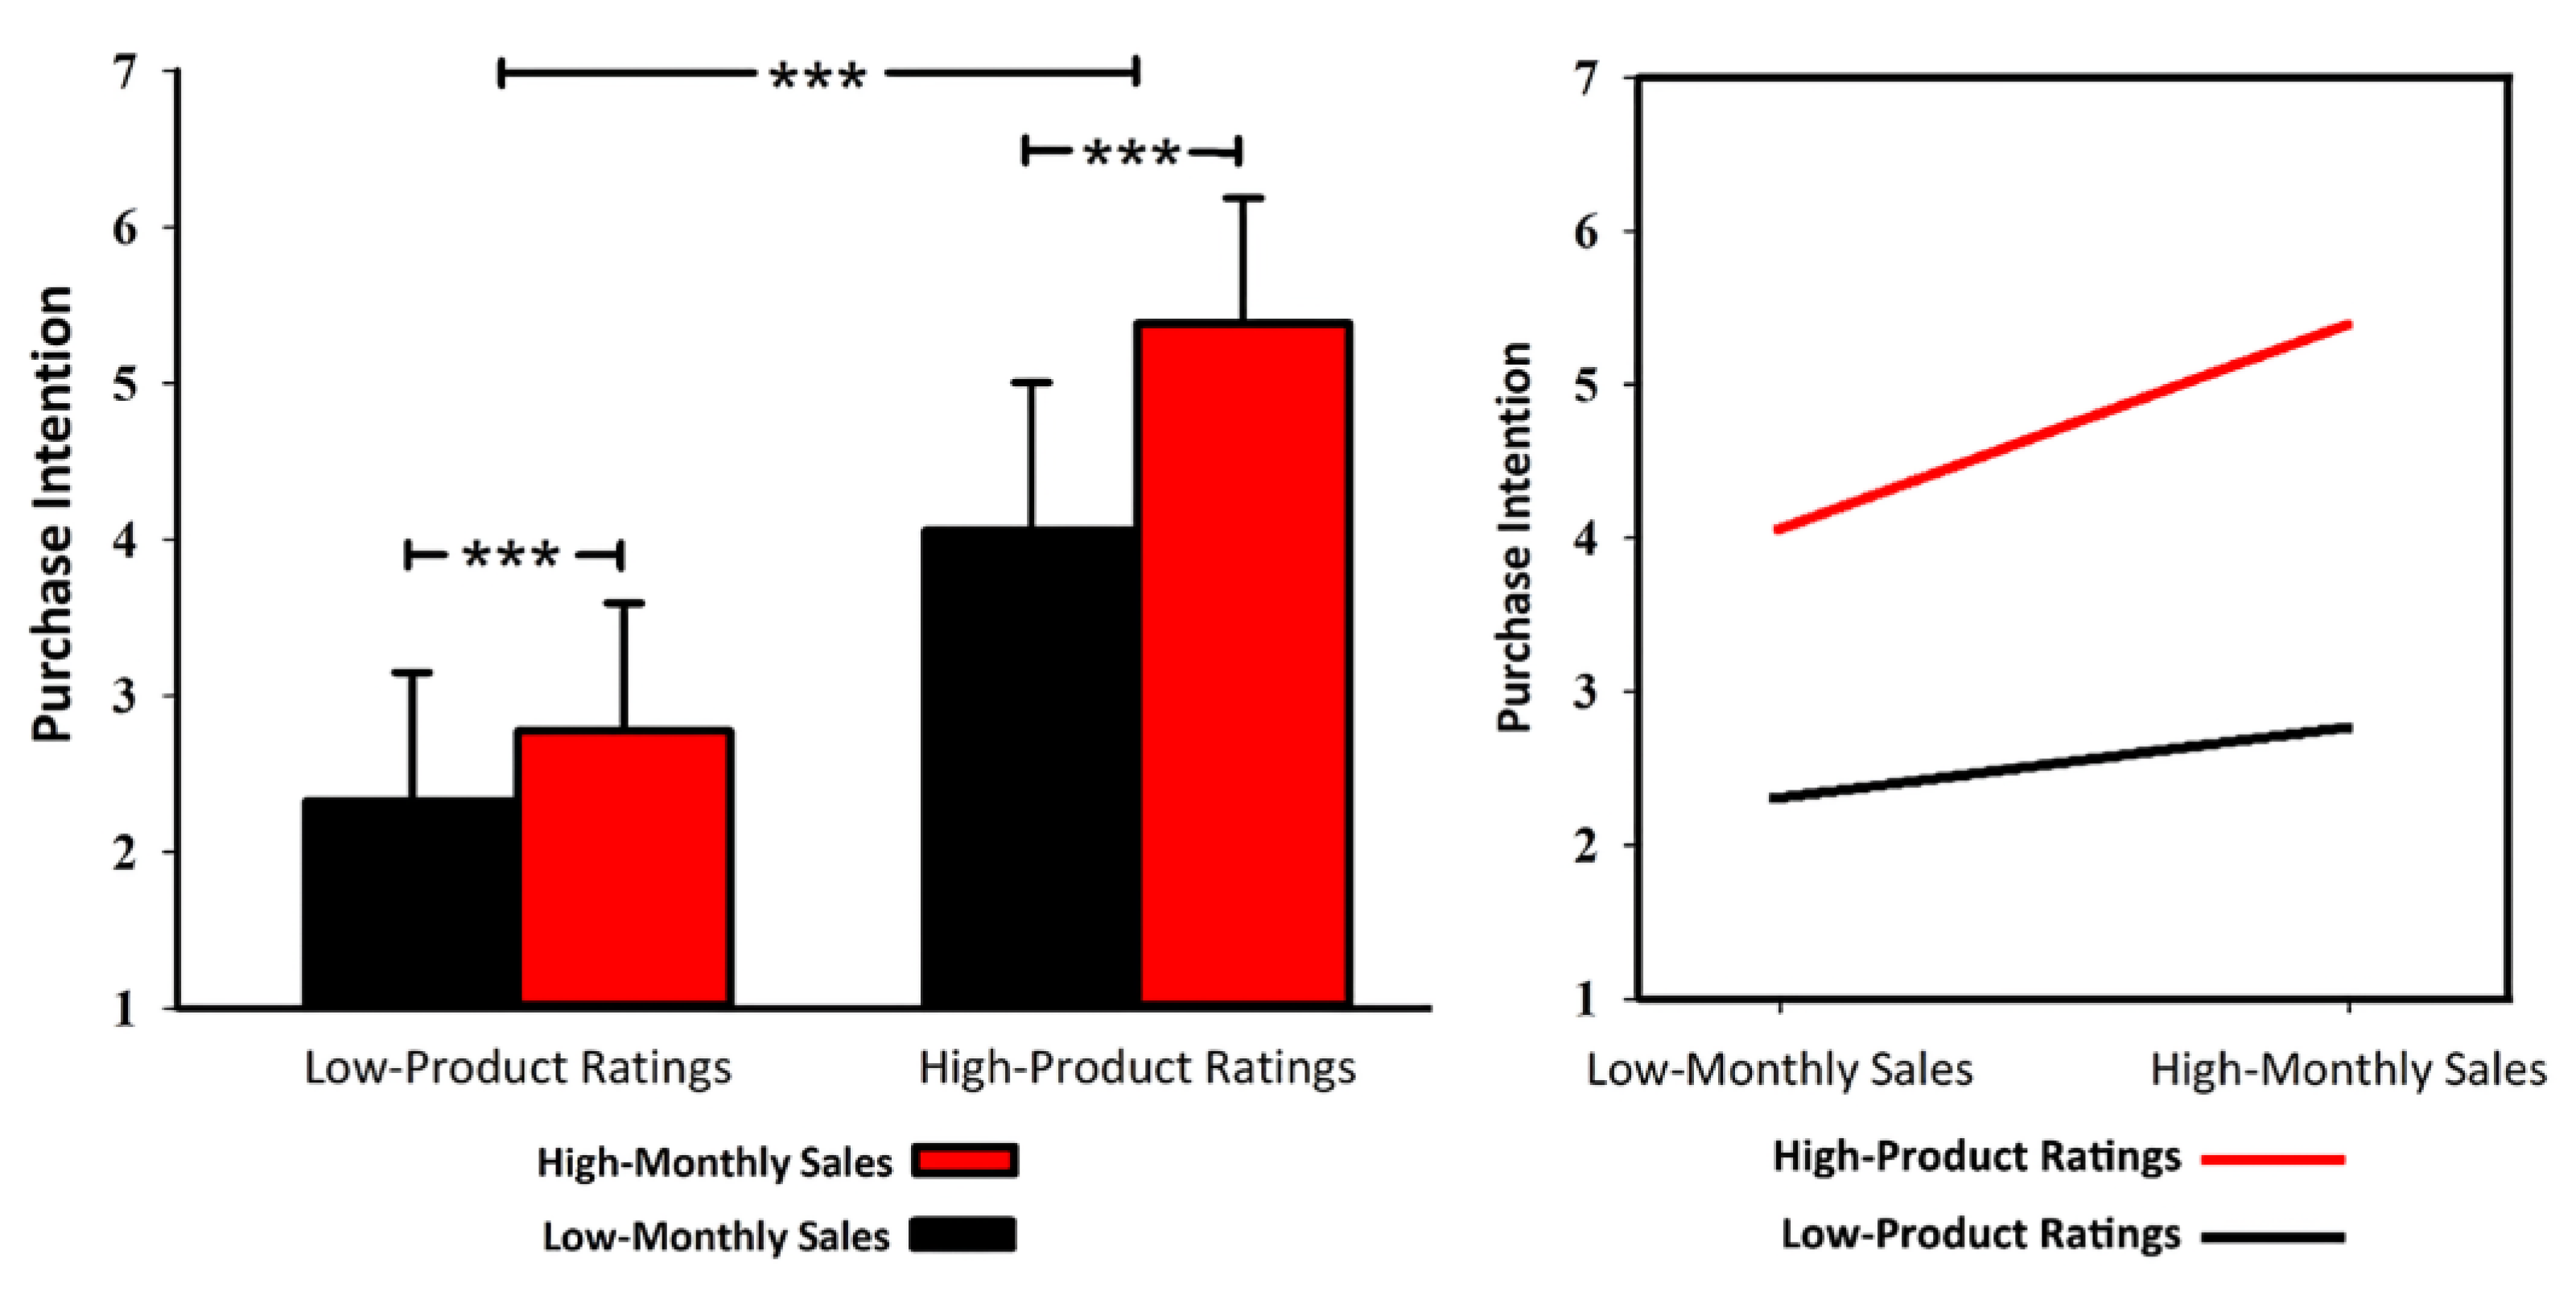
4.1. Behavioural Results
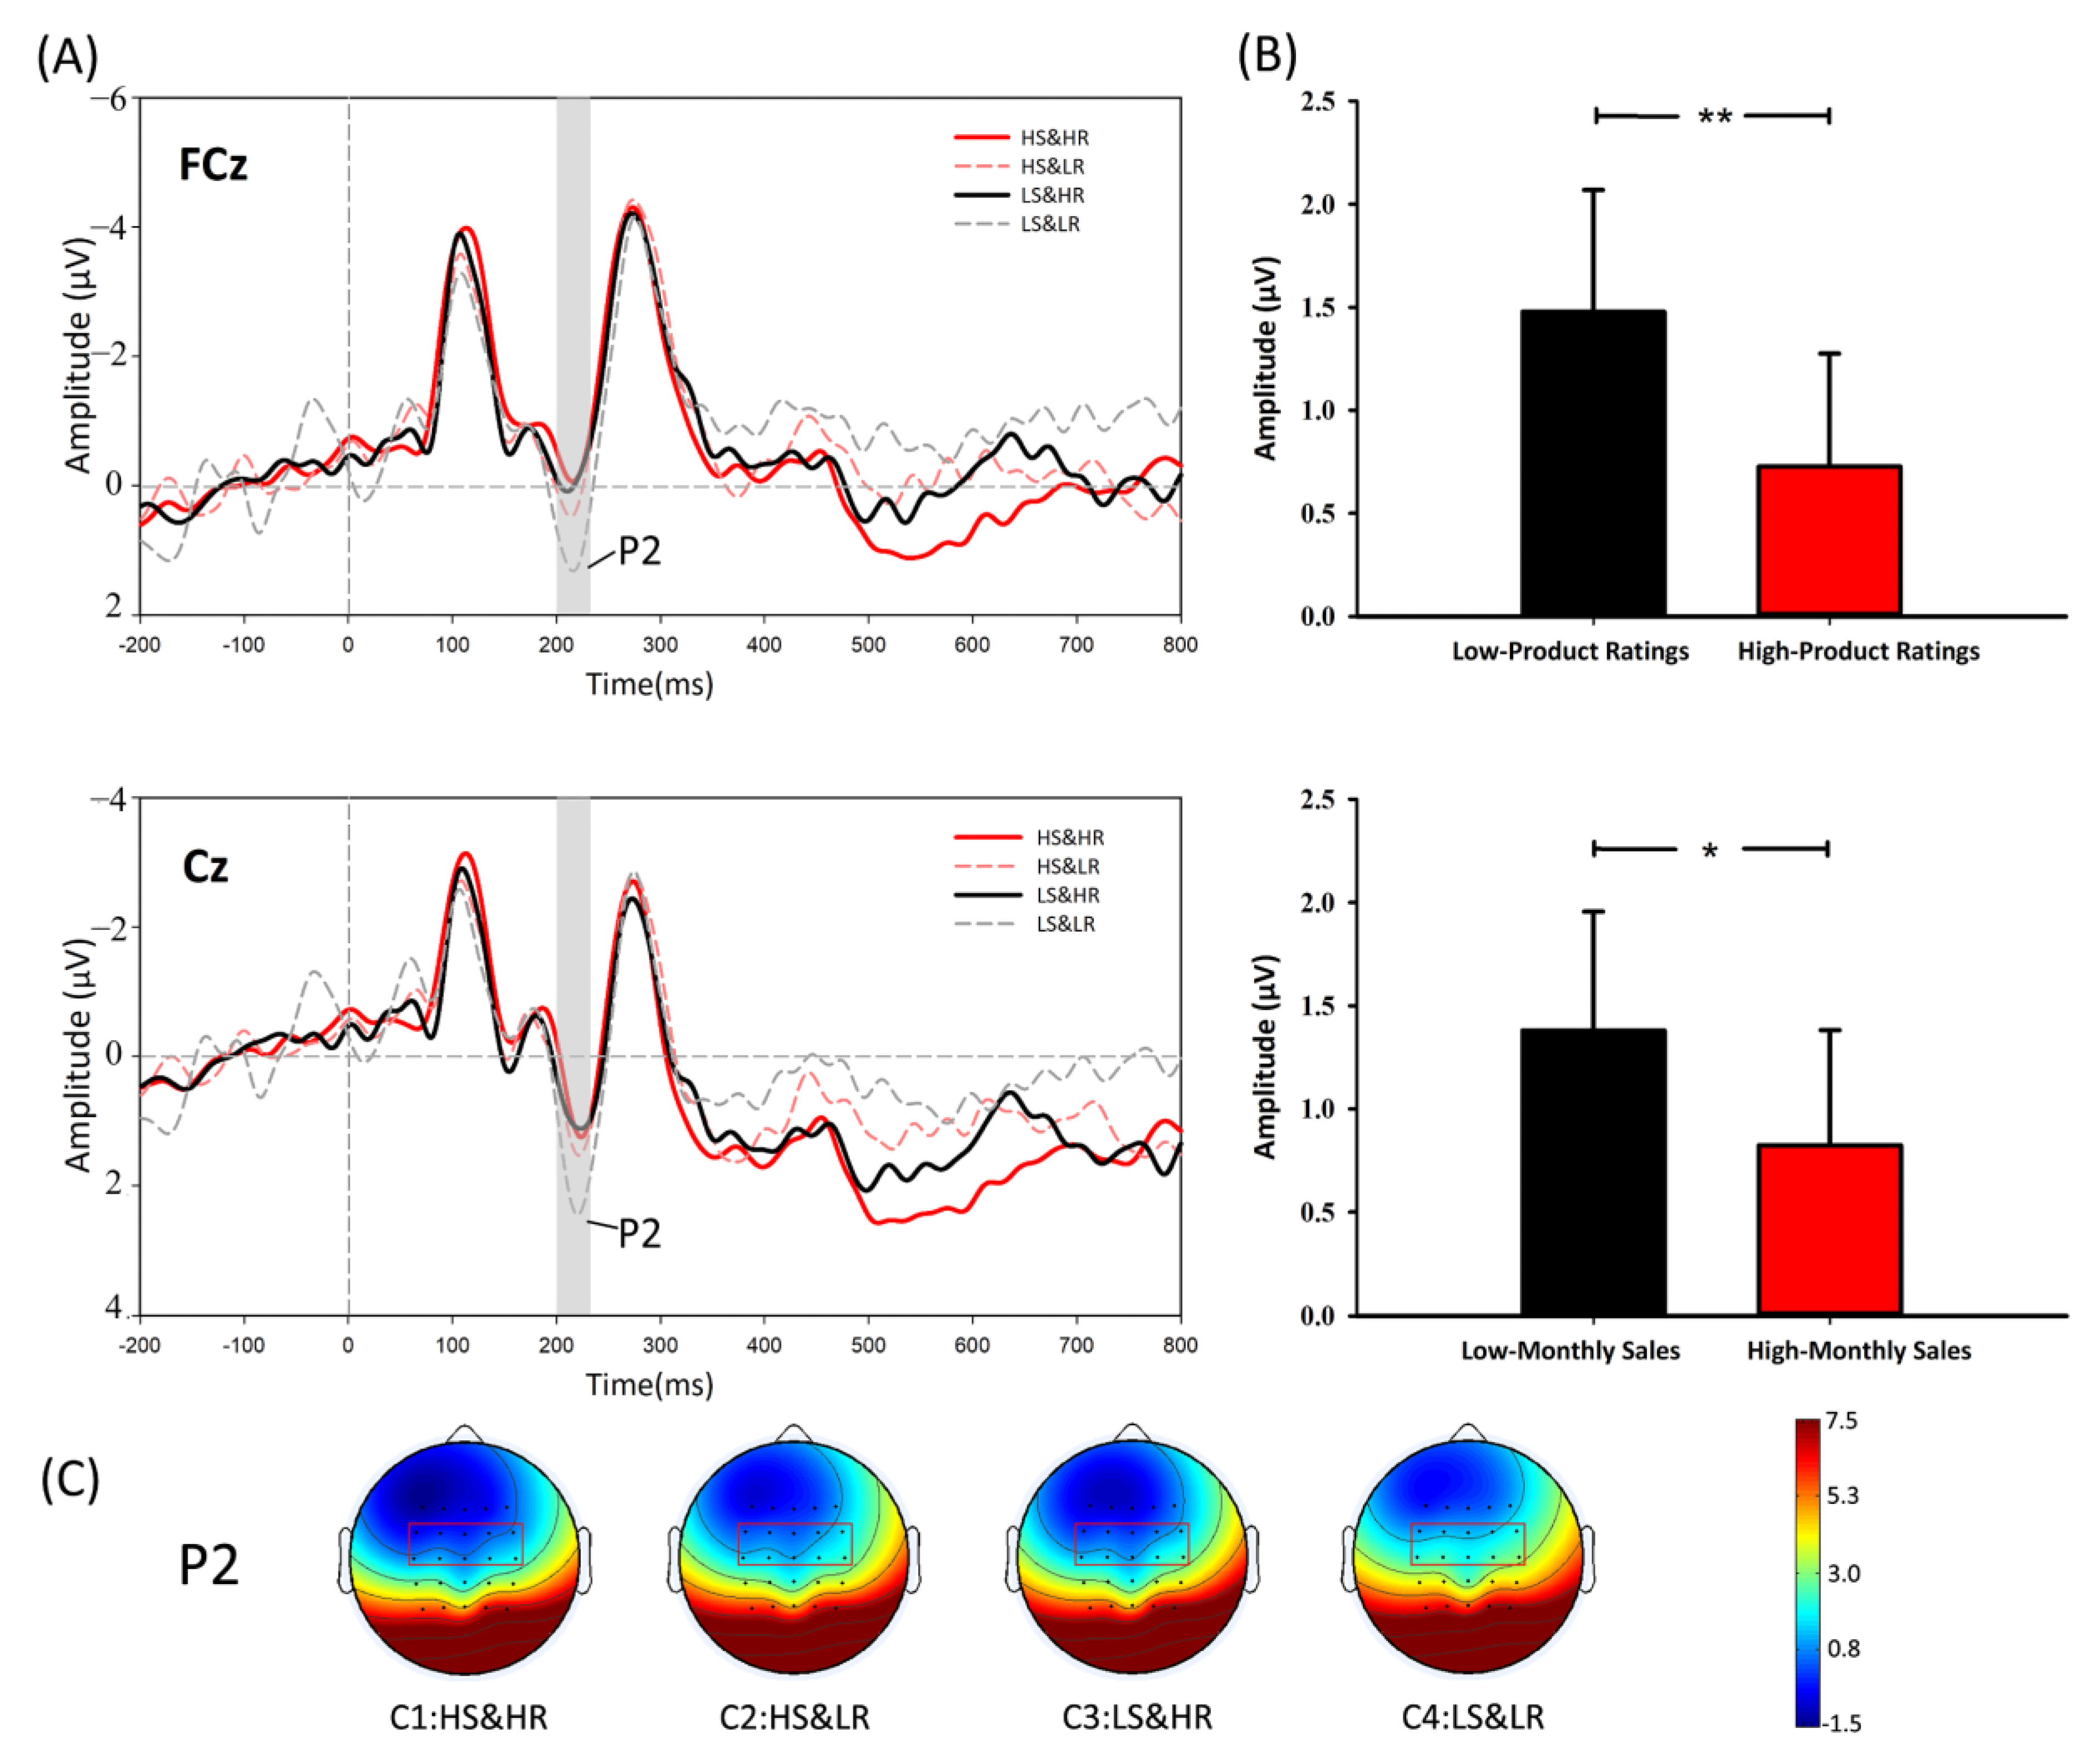
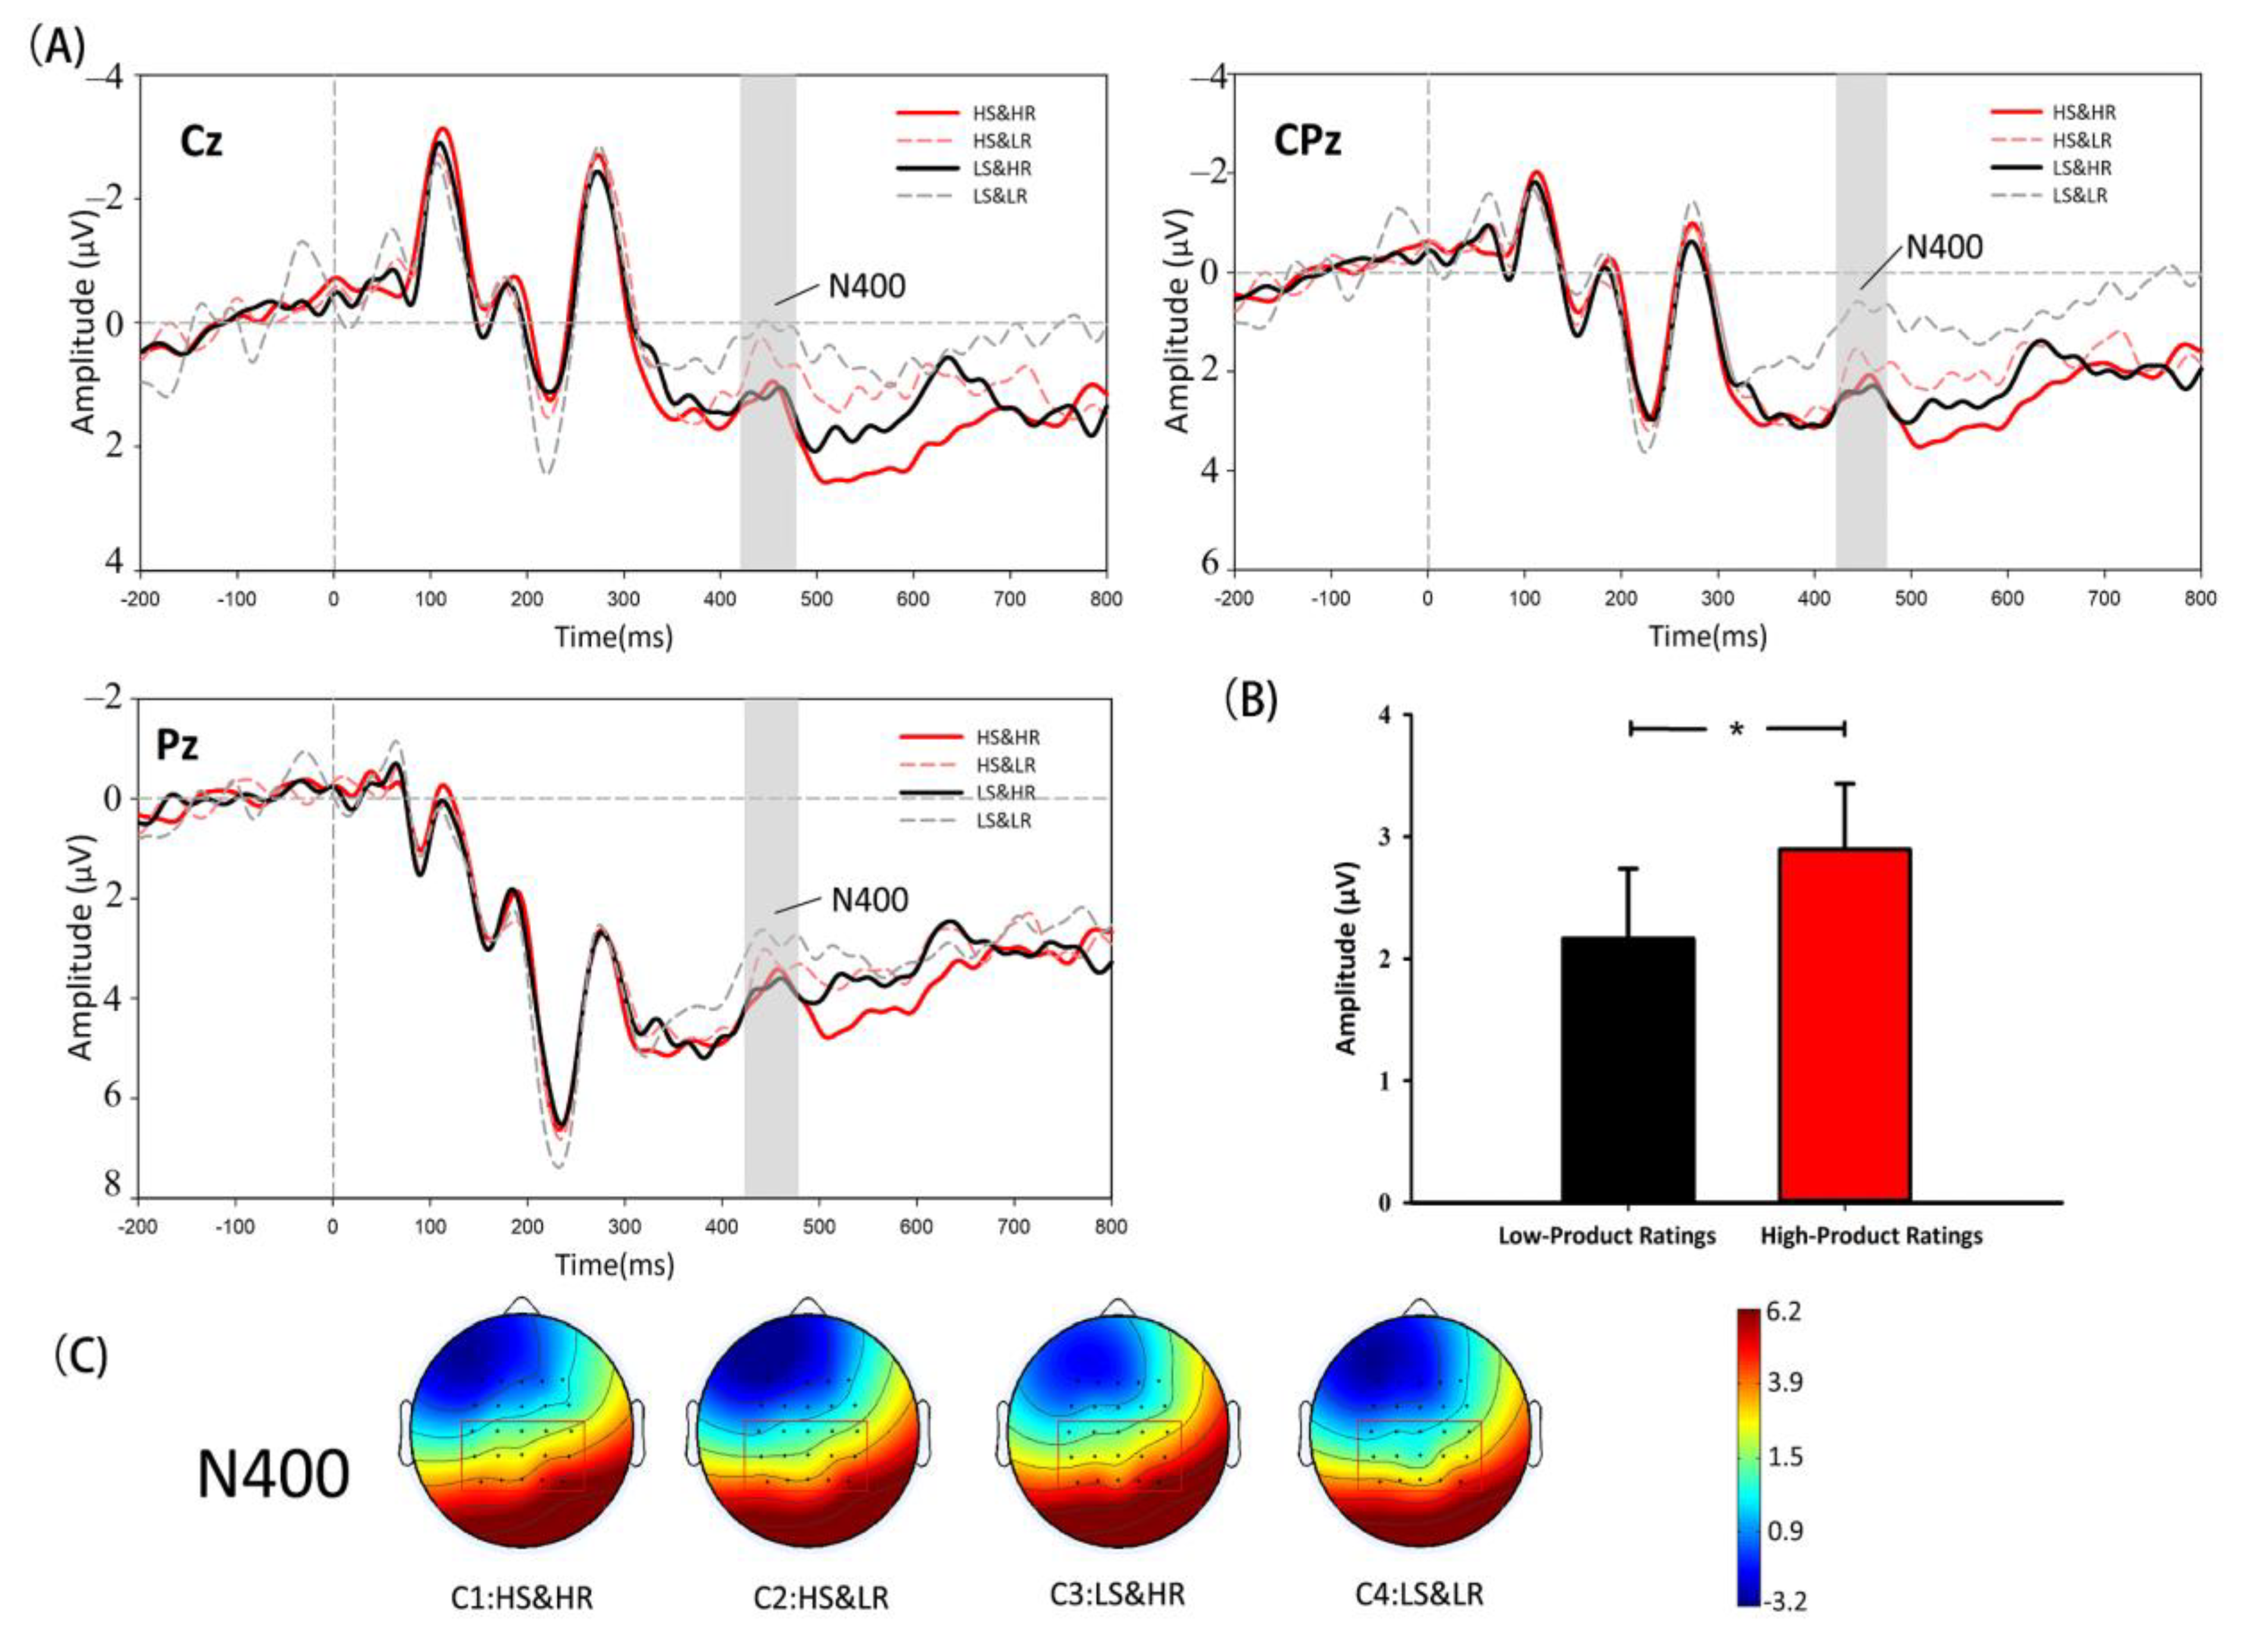
4.2. ERP Results
5. Discussion
5.1. Discussion on Behavioural Hypotheses
5.2. Discussion on ERP Hypotheses
5.2.1. P2 Hypothesis
5.2.2. N400 Hypothesis
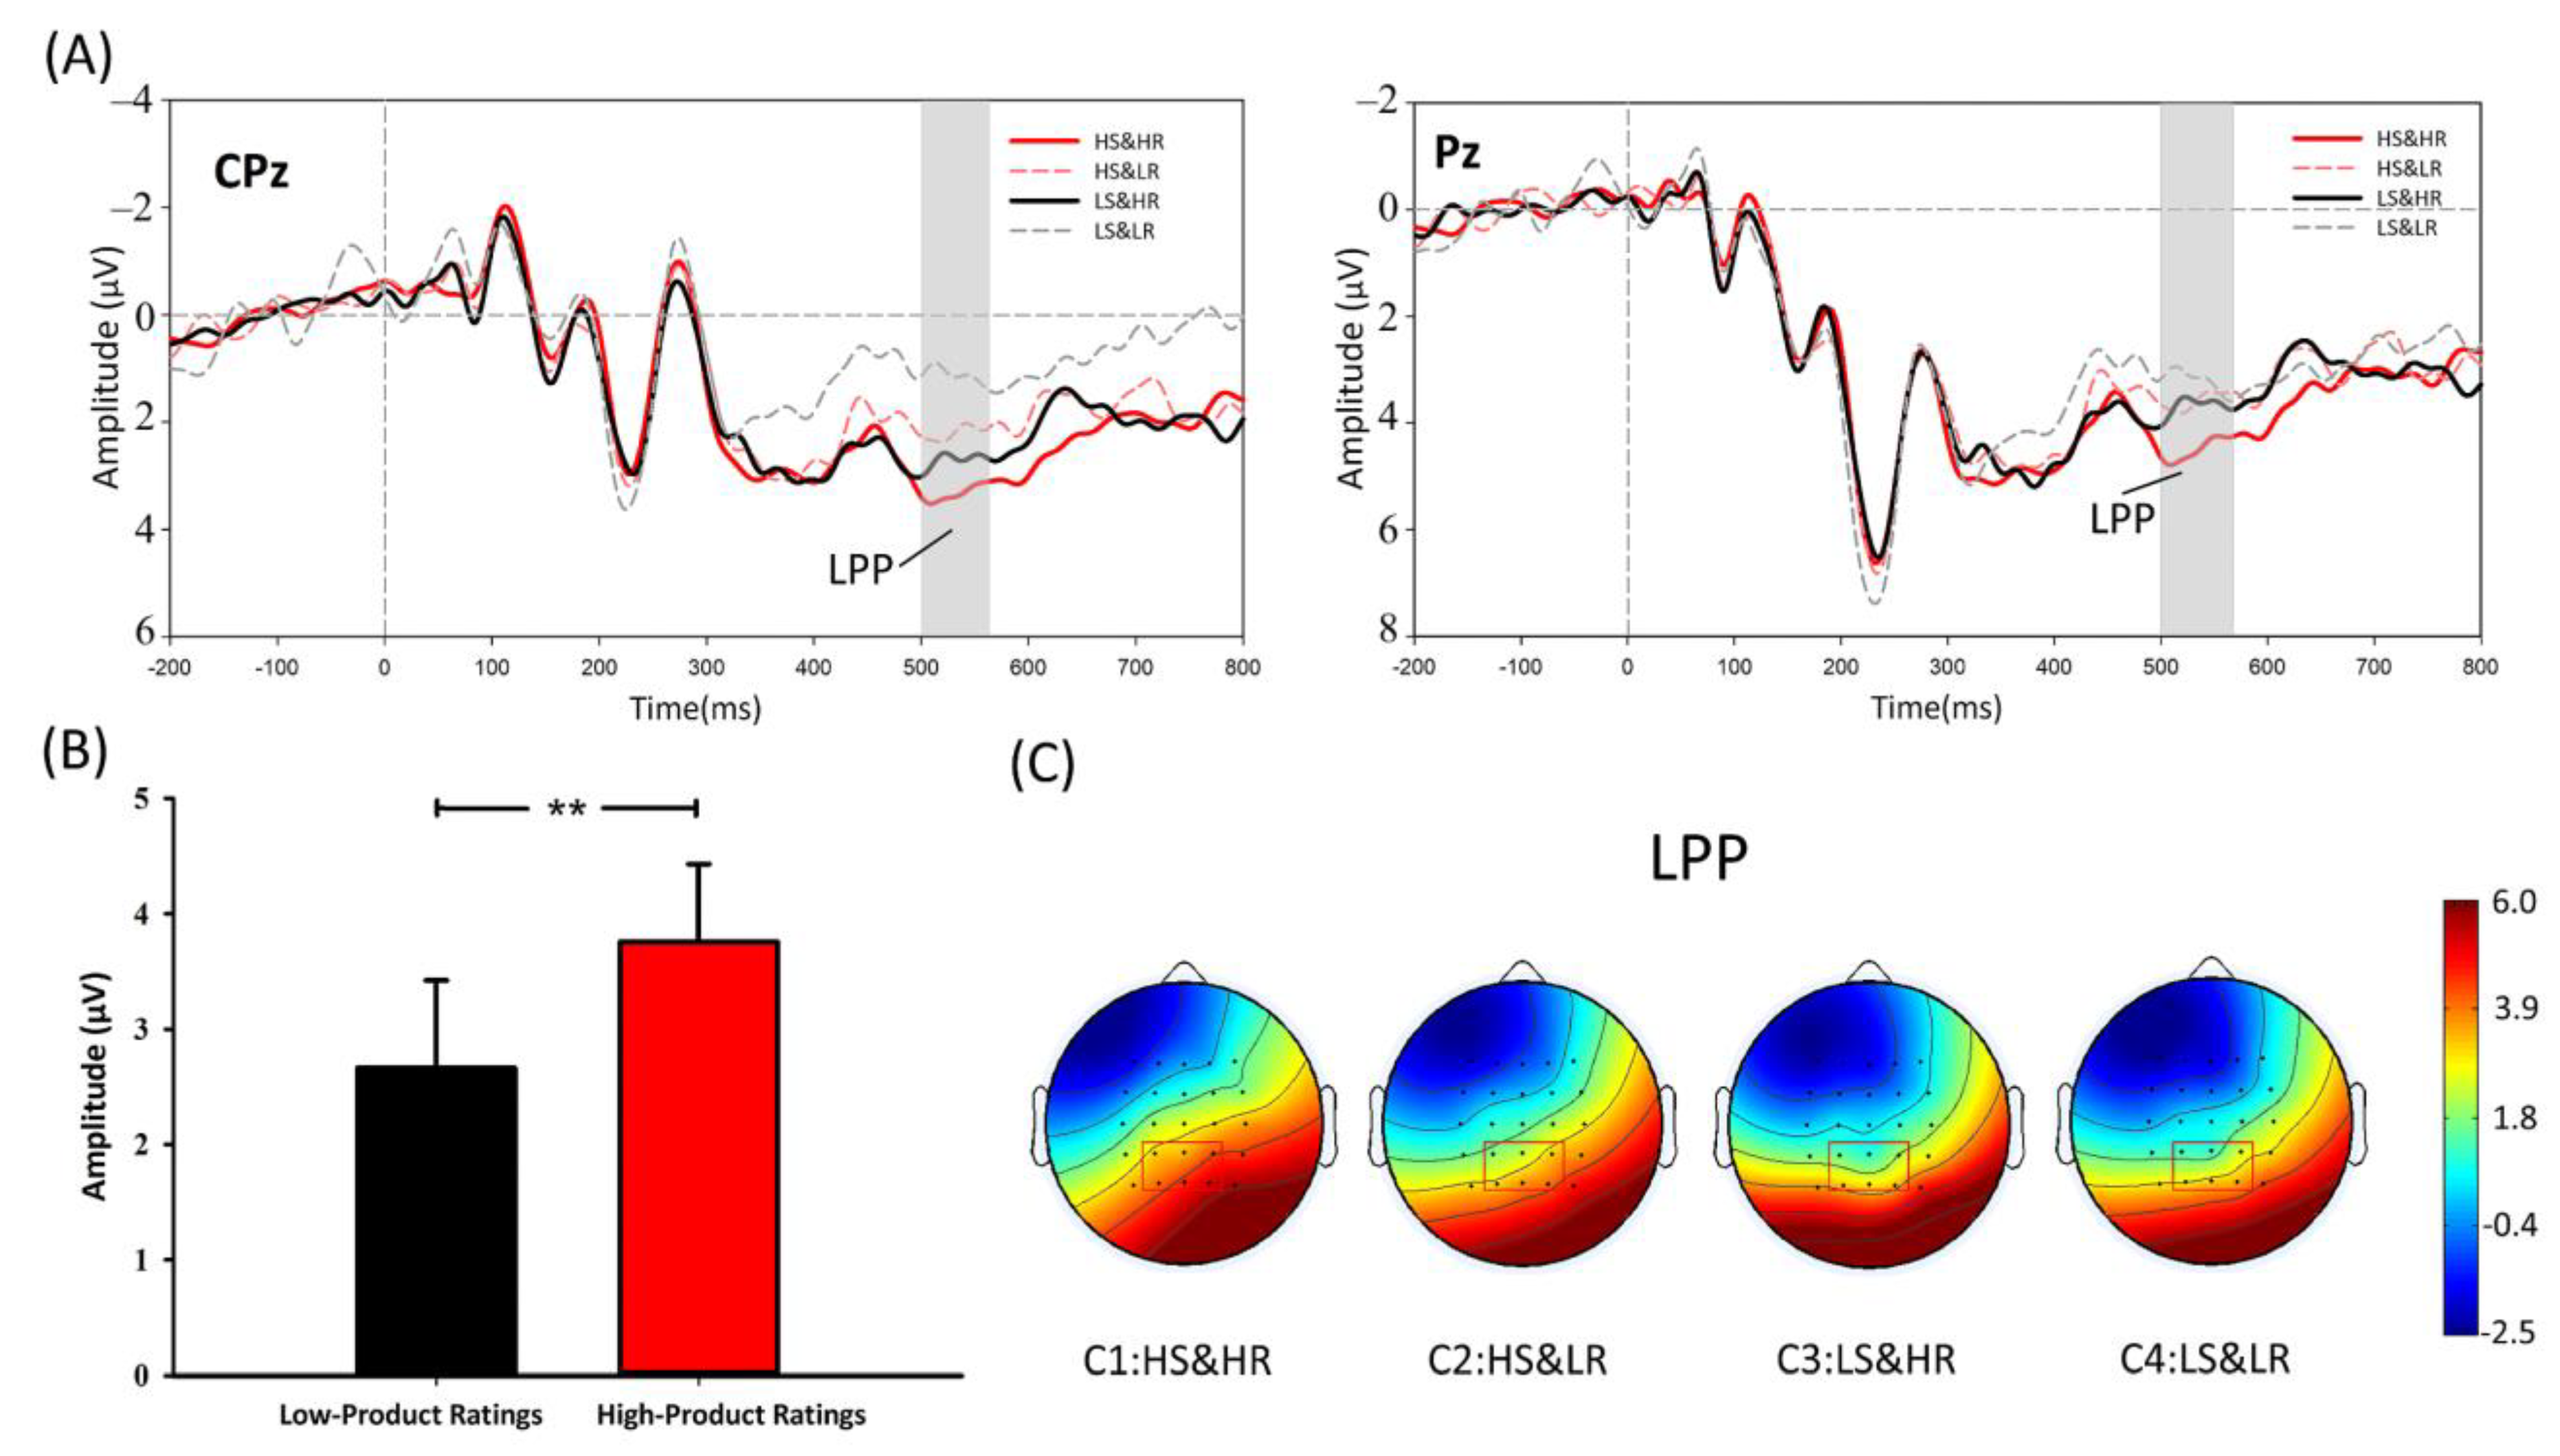
5.2.3. LPP Hypothesis
5.3. General Discussion
5.4. Theoretical Contributions and Managerial Implications
5.5. Limitations and Future Research
6. Conclusions
Author Contributions
Funding
Institutional Review Board Statement
Informed Consent Statement
Data Availability Statement
Acknowledgments
Conflicts of Interest
References
- UNCTAD. Estimates of Global E-Commerce 2019 and Preliminary Assessment of COVID-19 Impact on Online Retail 2020. Available online: https://unctad.org/press-material/global-e-commerce-jumps-267-trillion-covid-19-boosts-online-retail-sales (accessed on 14 March 2022).
- Mavlanova, T.; Benbunan-Fich, R.; Koufaris, M. Signaling theory and information asymmetry in online commerce. Inf. Manag. 2012, 49, 240–247. [Google Scholar] [CrossRef]
- Pavlou, P.A.; Liang, H.; Xue, Y. Understanding and mitigating uncertainty in online exchange relationships: A principal-agent perspective. MIS Q. 2007, 31, 105–136. [Google Scholar] [CrossRef]
- Wells, J.D.; Valacich, J.S.; Hess, T.J. What signal are you sending? How website quality influences perceptions of product quality and purchase intentions. MIS Q. 2011, 35, 373–396. [Google Scholar] [CrossRef]
- Roggeveen, A.L.; Goodstein, R.C.; Grewal, D. Improving the effect of guarantees: The role of a retailer’s reputation. J. Retail. 2014, 90, 27–39. [Google Scholar] [CrossRef]
- Olson, J.C.; Jacoby, J. Cue utilization in the quality perception process. In Proceedings of the Third Annual Conference of the Association for Consumer Research; The Association: College Park, MD, USA, 1972; pp. 167–179. [Google Scholar]
- Kuan, K.K.; Zhong, Y.; Chau, P.Y. Informational and normative social influence in group-buying: Evidence from self-reported and EEG data. J. Manag. Inf. Syst. 2014, 30, 151–178. [Google Scholar] [CrossRef]
- Huang, J.H.; Chen, Y.F. Herding in online product choice. Psychol. Mark. 2006, 23, 413–428. [Google Scholar] [CrossRef]
- Wang, Q.; Meng, L.; Liu, M.; Wang, Q.; Ma, Q. How do social-based cues influence consumers’ online purchase decisions? An event-related potential study. Electron. Commer. Res. 2016, 16, 1–26. [Google Scholar] [CrossRef]
- Berger, J.; Sorensen, A.T.; Rasmussen, S.J. Positive effects of negative publicity: When negative reviews increase sales. Mark. Sci. 2010, 29, 815–827. [Google Scholar] [CrossRef]
- Flanagin, A.J.; Metzger, M.J.; Pure, R.; Markov, A.; Hartsell, E. Mitigating risk in ecommerce transactions: Perceptions of information credibility and the role of user-generated ratings in product quality and purchase intention. Electron. Commer. Res. 2014, 14, 1–23. [Google Scholar] [CrossRef]
- Gatti, L.; Caruana, A.; Snehota, I. The role of corporate social responsibility, perceived quality and corporate reputation on purchase intention: Implications for brand management. J. Brand Manag. 2012, 20, 65–76. [Google Scholar] [CrossRef]
- Tsiotsou, R. The role of perceived product quality and overall satisfaction on purchase intentions. Int. J. Consum. Stud. 2006, 30, 207–217. [Google Scholar] [CrossRef]
- Nelson, P. Information and consumer behavior. J. Political Econ. 1970, 78, 311–329. [Google Scholar] [CrossRef]
- Nelson, P. Advertising as information. J. Political Econ. 1974, 82, 729–754. [Google Scholar] [CrossRef]
- Klein, L.R. Evaluating the potential of interactive media through a new lens: Search versus experience goods. J. Bus. Res. 1998, 41, 195–203. [Google Scholar] [CrossRef]
- Huang, P.; Lurie, N.H.; Mitra, S. Searching for experience on the web: An empirical examination of consumer behavior for search and experience goods. J. Mark. 2009, 73, 55–69. [Google Scholar] [CrossRef]
- Chua, A.Y.; Banerjee, S. Developing a theory of diagnosticity for online reviews. In Proceedings of the the International Multiconference of Engineers and Computer Scientists, Hong Kong, China, 12–14 March 2014. [Google Scholar]
- Purohit, D.; Srivastava, J. Effect of manufacturer reputation, retailer reputation, and product warranty on consumer judgments of product quality: A cue diagnosticity framework. J. Consum. Psychol. 2001, 10, 123–134. [Google Scholar] [CrossRef]
- Gidron, D.; Koehler, D.J.; Tversky, A. Implicit quantification of personality traits. Personal. Soc. Psychol. Bull. 1993, 19, 594–604. [Google Scholar] [CrossRef]
- Utz, S.; Kerkhof, P.; Van Den Bos, J. Consumers rule: How consumer reviews influence perceived trustworthiness of online stores. Electron. Commer. Res. Appl. 2012, 11, 49–58. [Google Scholar] [CrossRef]
- Hu, X.; Wu, G.; Wu, Y.; Zhang, H. The effects of Web assurance seals on consumers’ initial trust in an online vendor: A functional perspective. Decis. Support Syst. 2010, 48, 407–418. [Google Scholar] [CrossRef]
- Wilson, T.D.; Schooler, J.W. Thinking too much: Introspection can reduce the quality of preferences and decisions. J. Personal. Soc. Psychol. 1991, 60, 181. [Google Scholar] [CrossRef]
- Griffin, A.; Hauser, J.R. The voice of the customer. Mark. Sci. 1993, 12, 1–27. [Google Scholar] [CrossRef]
- Morwitz, V.G.; Fitzsimons, G.J. The mere-measurement effect: Why does measuring intentions change actual behavior? J. Consum. Psychol. 2004, 14, 64–74. [Google Scholar]
- Jin, J.; Zhang, W.; Chen, M. How consumers are affected by product descriptions in online shopping: Event-related potentials evidence of the attribute framing effect. Neurosci. Res. 2017, 125, 21–28. [Google Scholar] [CrossRef]
- Zhang, W.; Jin, J.; Wang, A.; Ma, Q.; Yu, H. Consumers’ implicit motivation of purchasing luxury brands: An EEG study. Psychol. Res. Behav. Manag. 2019, 12, 913. [Google Scholar] [CrossRef] [PubMed]
- Ariely, D.; Berns, G.S. Neuromarketing: The hope and hype of neuroimaging in business. Nat. Rev. Neurosci. 2010, 11, 284–292. [Google Scholar] [CrossRef]
- Boksem, M.A.; Smidts, A. Brain responses to movie trailers predict individual preferences for movies and their population-wide commercial success. J. Mark. Res. 2015, 52, 482–492. [Google Scholar] [CrossRef]
- Lee, E.-J.; Shin, S.Y. When do consumers buy online product reviews? Effects of review quality, product type, and reviewer’s photo. Comput. Hum. Behav. 2014, 31, 356–366. [Google Scholar] [CrossRef]
- Huang, A.H.; Chen, K.; Yen, D.C.; Tran, T.P. A study of factors that contribute to online review helpfulness. Comput. Hum. Behav. 2015, 48, 17–27. [Google Scholar] [CrossRef]
- Ali, M.; Amir, D.; Shamsi, D. Consumer herding behavior in online buying: A literature review. Int. Rev. Manag. Bus. Res. 2021, 10, 345–360. [Google Scholar] [CrossRef]
- Banerjee, A.V. A simple model of herd behavior. Q. J. Econ. 1992, 107, 797–817. [Google Scholar] [CrossRef]
- Muruganantham, G.; Bhakat, R.S. A review of impulse buying behavior. Int. J. Mark. Stud. 2013, 5, 149. [Google Scholar]
- Dhar, R.; Nowlis, S.M. The effect of time pressure on consumer choice deferral. J. Consum. Res. 1999, 25, 369–384. [Google Scholar] [CrossRef]
- De Figueiredo, J.M. Finding sustainable profitability in electronic commerce. MIT Sloan Manag. Rev. 2000, 41, 41. [Google Scholar]
- Kiang, M.Y.; Ye, Q.; Hao, Y.; Chen, M.; Li, Y. A service-oriented analysis of online product classification methods. Decis. Support Syst. 2011, 52, 28–39. [Google Scholar] [CrossRef]
- Weathers, D.; Sharma, S.; Wood, S.L. Effects of online communication practices on consumer perceptions of performance uncertainty for search and experience goods. J. Retail. 2007, 83, 393–401. [Google Scholar] [CrossRef]
- Chua, A.Y.; Banerjee, S. Helpfulness of user-generated reviews as a function of review sentiment, product type and information quality. Comput. Hum. Behav. 2016, 54, 547–554. [Google Scholar] [CrossRef]
- Saleem, A.; Ghafar, A.; Ibrahim, M.; Yousuf, M.; Ahmed, N. Product perceived quality and purchase intention with consumer satisfaction. Glob. J. Manag. Bus. Res. 2015, 15, 21–27. [Google Scholar]
- Ha, S.; Stoel, L. Consumer e-shopping acceptance: Antecedents in a technology acceptance model. J. Bus. Res. 2009, 62, 565–571. [Google Scholar] [CrossRef]
- Senecal, S.; Nantel, J. The influence of online product recommendations on consumers’ online choices. J. Retail. 2004, 80, 159–169. [Google Scholar] [CrossRef]
- Hirschman, E.C.; Holbrook, M.B. Hedonic consumption: Emerging concepts, methods and propositions. J. Mark. 1982, 46, 92–101. [Google Scholar] [CrossRef]
- Pan, Y.; Zhang, J.Q. Born unequal: A study of the helpfulness of user-generated product reviews. J. Retail. 2011, 87, 598–612. [Google Scholar] [CrossRef]
- Ma, Q.; Feng, Y.; Xu, Q.; Bian, J.; Tang, H. Brain potentials associated with the outcome processing in framing effects. Neurosci. Lett. 2012, 528, 110–113. [Google Scholar] [CrossRef] [PubMed]
- Schupp, H.T.; Cuthbert, B.N.; Bradley, M.M.; Cacioppo, J.T.; Ito, T.; Lang, P.J. Affective picture processing: The late positive potential is modulated by motivational relevance. Psychophysiology 2000, 37, 257–261. [Google Scholar] [CrossRef] [PubMed]
- Chen, M.; Ma, Q.; Li, M.; Dai, S.; Wang, X.; Shu, L. The neural and psychological basis of herding in purchasing books online: An event-related potential study. Cyberpsychol. Behav. Soc. Netw. 2010, 13, 321–328. [Google Scholar] [CrossRef]
- Polezzi, D.; Lotto, L.; Daum, I.; Sartori, G.; Rumiati, R. Predicting outcomes of decisions in the brain. Behav. Brain Res. 2008, 187, 116–122. [Google Scholar] [CrossRef]
- Bublatzky, F.; Schupp, H.T. Pictures cueing threat: Brain dynamics in viewing explicitly instructed danger cues. Soc. Cogn. Affect. Neurosci. 2012, 7, 611–622. [Google Scholar] [CrossRef]
- Wang, X.; Huang, Y.; Ma, Q.; Li, N. Event-related potential P2 correlates of implicit aesthetic experience. Neuroreport 2012, 23, 862–866. [Google Scholar] [CrossRef]
- Kutas, M.; Hillyard, S.A. Reading senseless sentences: Brain potentials reflect semantic incongruity. Science 1980, 207, 203–205. [Google Scholar] [CrossRef]
- Proverbio, A.M.; Riva, F. RP and N400 ERP components reflect semantic violations in visual processing of human actions. Neurosci. Lett. 2009, 459, 142–146. [Google Scholar] [CrossRef]
- Wang, X.; Ma, Q.; Wang, C. N400 as an index of uncontrolled categorization processing in brand extension. Neurosci. Lett. 2012, 525, 76–81. [Google Scholar] [CrossRef]
- Ma, Q.; Wang, C.; Wang, X. Two-stage categorization in brand extension evaluation: Electrophysiological time course evidence. PLoS ONE 2014, 9, e114150. [Google Scholar] [CrossRef] [PubMed]
- Taake, I.; Jaspers-Fayer, F.; Liotti, M. Early frontal responses elicited by physical threat words in an emotional Stroop task: Modulation by anxiety sensitivity. Biol. Psychol. 2009, 81, 48–57. [Google Scholar] [CrossRef] [PubMed]
- Chen, M.; Ma, Q.; Li, M.; Lai, H.; Wang, X.; Shu, L. Cognitive and emotional conflicts of counter-conformity choice in purchasing books online: An event-related potentials study. Biol. Psychol. 2010, 85, 437–445. [Google Scholar] [CrossRef] [PubMed]
- Jin, J.; Wang, C.; Yu, L.; Ma, Q. Extending or creating a new brand: Evidence from a study on event-related potentials. Neuroreport 2015, 26, 572–577. [Google Scholar] [CrossRef] [PubMed]
- Herring, D.R.; Taylor, J.H.; White, K.R.; Crites Jr, S.L. Electrophysiological responses to evaluative priming: The LPP is sensitive to incongruity. Emotion 2011, 11, 794. [Google Scholar] [CrossRef]
- Yen, N.-S.; Chen, K.-H.; Liu, E.H. Emotional modulation of the late positive potential (LPP) generalizes to Chinese individuals. Int. J. Psychophysiol. 2010, 75, 319–325. [Google Scholar] [CrossRef]
- Hajcak, G.; Moser, J.S.; Simons, R.F. Attending to affect: Appraisal strategies modulate the electrocortical response to arousing pictures. Emotion 2006, 6, 517. [Google Scholar] [CrossRef]
- Leite, J.; Carvalho, S.; Galdo-Alvarez, S.; Alves, J.; Sampaio, A.; Gonçalves, Ó.F. Affective picture modulation: Valence, arousal, attention allocation and motivational significance. Int. J. Psychophysiol. 2012, 83, 375–381. [Google Scholar] [CrossRef]
- van Hooff, J.C.; Crawford, H.; Van Vugt, M. The wandering mind of men: ERP evidence for gender differences in attention bias towards attractive opposite sex faces. Soc. Cogn. Affect. Neurosci. 2011, 6, 477–485. [Google Scholar] [CrossRef]
- Choi, N.-H.; Qiao, X.; Wang, L. Effects of multisensory cues, self-enhancing imagery and self goal-achievement emotion on purchase intention. J. Asian Financ. Econ. Bus. 2020, 7, 141–151. [Google Scholar] [CrossRef]
- Pekrun, R.; Elliot, A.J.; Maier, M.A. Achievement goals and discrete achievement emotions: A theoretical model and prospective test. J. Educ. Psychol. 2006, 98, 583. [Google Scholar] [CrossRef]
- Ito, T.A.; Cacioppo, J.T. Electrophysiological evidence of implicit and explicit categorization processes. J. Exp. Soc. Psychol. 2000, 36, 660–676. [Google Scholar] [CrossRef]
- Zhang, W.; Jiang, P.; Tong, P.; Xu, T.; Yuan, R.; Diao, L. The Influence of Industry Leaders’ Behavior on the Decisions of Common Enterprise Leaders in Enterprise Clustering: An Event-Related Potential Study. Psychol. Res. Behav. Manag. 2022, 15, 237. [Google Scholar] [CrossRef] [PubMed]
- Azizian, A.; Freitas, A.L.; Watson, T.D.; Squires, N.K. Electrophysiological correlates of categorization: P300 amplitude as index of target similarity. Biol. Psychol. 2006, 71, 278–288. [Google Scholar] [CrossRef] [PubMed]
- Langeslag, S.J.; Jansma, B.M.; Franken, I.H.; Van Strien, J.W. Event-related potential responses to love-related facial stimuli. Biol. Psychol. 2007, 76, 109–115. [Google Scholar] [CrossRef]
- Faul, F.; Erdfelder, E.; Buchner, A.; Lang, A.-G. Statistical power analyses using G* Power 3.1: Tests for correlation and regression analyses. Behav. Res. Methods 2009, 41, 1149–1160. [Google Scholar] [CrossRef]
- Vazire, S. Editorial. Soc. Psychol. Personal. Sci. 2016, 7, 3–7. [Google Scholar] [CrossRef]
- Cohen, J. Statistical Power Analysis for the Behavioral Sciences; Routledge: London, UK, 2013. [Google Scholar]
- Delorme, A.; Makeig, S. EEGLAB: An open source toolbox for analysis of single-trial EEG dynamics including independent component analysis. J. Neurosci. Methods 2004, 134, 9–21. [Google Scholar] [CrossRef]
- Picton, T.W.; Bentin, S.; Berg, P.; Donchin, E.; Hillyard, S.; Johnson, R.; Miller, G.; Ritter, W.; Ruchkin, D.; Rugg, M. Guidelines for using human event-related potentials to study cognition: Recording standards and publication criteria. Psychophysiology 2000, 37, 127–152. [Google Scholar] [CrossRef]
- Van den Brink, D.; Van Berkum, J.J.; Bastiaansen, M.C.; Tesink, C.M.; Kos, M.; Buitelaar, J.K.; Hagoort, P. Empathy matters: ERP evidence for inter-individual differences in social language processing. Soc. Cogn. Affect. Neurosci. 2012, 7, 173–183. [Google Scholar] [CrossRef]
- Ma, Q.; Hu, Y.; Jiang, S.; Meng, L. The undermining effect of facial attractiveness on brain responses to fairness in the Ultimatum Game: An ERP study. Front. Neurosci. 2015, 9, 77. [Google Scholar] [CrossRef] [PubMed]
- He, L.; Pelowski, M.; Yu, W.; Liu, T. Neural resonance in consumers’ right inferior frontal gyrus predicts attitudes toward advertising. Psychol. Mark. 2021, 38, 1538–1549. [Google Scholar] [CrossRef]
- Hajcak, G.; Olvet, D.M. The persistence of attention to emotion: Brain potentials during and after picture presentation. Emotion 2008, 8, 250. [Google Scholar] [CrossRef] [PubMed]
- Cacioppo, J.T.; Crites, S.L.; Gardner, W.L.; Berntson, G.G. Bioelectrical echoes from evaluative categorizations: I. A late positive brain potential that varies as a function of trait negativity and extremity. J. Personal. Soc. Psychol. 1994, 67, 115. [Google Scholar] [CrossRef]
- Funkhouser, C.J.; Auerbach, R.P.; Kujawa, A.; Morelli, S.A.; Phan, K.L.; Shankman, S.A. Social feedback valence differentially modulates the reward positivity, P300, and late positive potential. J. Psychophysiol. 2020, 34, 255–267. [Google Scholar] [CrossRef]
- Ye, Y.; Jiang, P.; Zhang, W. The Neural and Psychological Processes of Peer-Influenced Online Donation Decision: An Event-Related Potential Study. Front. Psychol. 2022, 13, 899233. [Google Scholar] [CrossRef]
- Pappas, I.O.; Kourouthanassis, P.E.; Giannakos, M.N.; Chrissikopoulos, V. Sense and sensibility in personalized e-commerce: How emotions rebalance the purchase intentions of persuaded customers. Psychol. Mark. 2017, 34, 972–986. [Google Scholar] [CrossRef]
- Pappas, I.O.; Kourouthanassis, P.E.; Giannakos, M.N.; Chrissikopoulos, V. Explaining online shopping behavior with fsQCA: The role of cognitive and affective perceptions. J. Bus. Res. 2016, 69, 794–803. [Google Scholar] [CrossRef]
- Verhagen, T.; Bloemers, D. Exploring the cognitive and affective bases of online purchase intentions: A hierarchical test across product types. Electron. Commer. Res. 2018, 18, 537–561. [Google Scholar] [CrossRef]
- Kimiagari, S.; Malafe, N.S.A. The role of cognitive and affective responses in the relationship between internal and external stimuli on online impulse buying behavior. J. Retail. Consum. Serv. 2021, 61, 102567. [Google Scholar] [CrossRef]


| Product Rating Condition | Monthly Sales Condition | Purchase Intention | S.D. of Purchase Intention | Mean Difference | p-Value |
|---|---|---|---|---|---|
| High | High | 5.383 | 0.803 | 1.326 | <0.001 |
| Low | 4.057 | 0.949 | |||
| Low | High | 2.773 | 0.819 | 0.450 | <0.001 |
| Low | 2.323 | 0.826 |
Publisher’s Note: MDPI stays neutral with regard to jurisdictional claims in published maps and institutional affiliations. |
© 2022 by the authors. Licensee MDPI, Basel, Switzerland. This article is an open access article distributed under the terms and conditions of the Creative Commons Attribution (CC BY) license (https://creativecommons.org/licenses/by/4.0/).
Share and Cite
Chen, K.; Zhang, W.; Jiang, P. Ratings or Sales? The Neural and Psychological Processes of Online Experience Product Purchase: Evidence from a Sample of Chinese University Students. Behav. Sci. 2022, 12, 499. https://doi.org/10.3390/bs12120499
Chen K, Zhang W, Jiang P. Ratings or Sales? The Neural and Psychological Processes of Online Experience Product Purchase: Evidence from a Sample of Chinese University Students. Behavioral Sciences. 2022; 12(12):499. https://doi.org/10.3390/bs12120499
Chicago/Turabian StyleChen, Keyu, Wuke Zhang, and Pengtao Jiang. 2022. "Ratings or Sales? The Neural and Psychological Processes of Online Experience Product Purchase: Evidence from a Sample of Chinese University Students" Behavioral Sciences 12, no. 12: 499. https://doi.org/10.3390/bs12120499
APA StyleChen, K., Zhang, W., & Jiang, P. (2022). Ratings or Sales? The Neural and Psychological Processes of Online Experience Product Purchase: Evidence from a Sample of Chinese University Students. Behavioral Sciences, 12(12), 499. https://doi.org/10.3390/bs12120499