Determinants of Self-Perceived Health: The Importance of Physical Well-Being but Also of Mental Health and Cognitive Functioning


Abstract
1. Introduction
2. Materials and Methods
2.1. Data
2.2. Self-Perceived Health (SPH)
2.3. Individual Characteristics, Physical and Mental Health, Cognitive Functioning
2.4. Statistical Analysis
3. Results
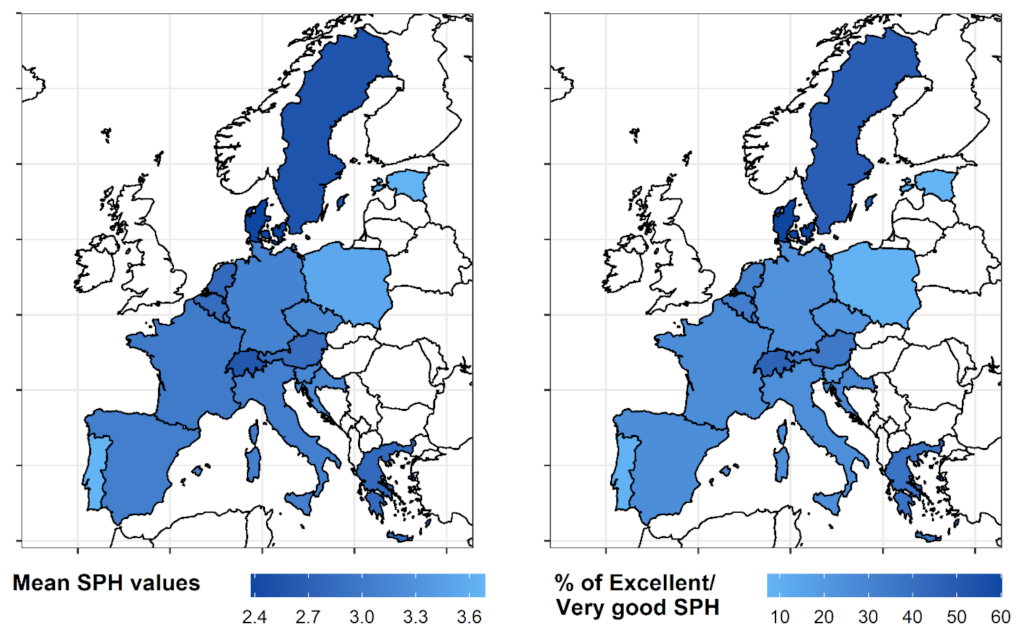
3.1. Mapping Self-Perceived Health
3.2. Linear Model
4. Discussion
5. Conclusions
Author Contributions
Funding
Institutional Review Board Statement
Informed Consent Statement
Data Availability Statement
Acknowledgments
Conflicts of Interest
References
- Bardage, C.; Pluijm, S.M.F.; Pedersen, N.L.; Deeg, D.J.H.; Jylhä, M.; Noale, M.; Blumstein, T.; Otero, Á. Self-rated health among older adults: A cross-national comparison. Eur. J. Ageing 2005, 2, 149–158. [Google Scholar] [CrossRef]
- Kaplan, G.A.; Goldberg, D.E.; Everson, S.A.; Cohen, R.D.; Salonen, R.; Tuomilehto, J.; Salonen, J. Perceived Health Status and Morbidity and Mortality: Evidence from the Kuopio Ischaemic Heart Disease Risk Factor Study. Int. J. Epidemiol. 1996, 25, 259–265. [Google Scholar] [CrossRef] [PubMed]
- Miilunpalo, S.; Vuori, I.; Oja, P.; Pasanen, M.; Urponen, H. Self-rated health status as a health measure: The predictive value of self-reported health status on the use of physician services and on mortality in the working-age population. J. Clin. Epidemiol. 1997, 50, 517–528. [Google Scholar] [CrossRef] [PubMed]
- Idler, E.L.; Benyamini, Y. Self-Rated Health and Mortality: A Review of Twenty-Seven Community Studies. J. Health Soc. Behav. 1997, 38, 21–37. [Google Scholar] [CrossRef] [PubMed]
- Lundberg, O.; Manderbacka, K. Assessing reliability of a measure of self-rated health. Scand. J. Soc. Med. 1996, 24, 218–224. [Google Scholar] [CrossRef] [PubMed]
- Ferraro, K.F.; Farmer, M.M.; Wybraniec, J.A. Health Trajectories: Long-Term Dynamics Among Black and White Adults. J. Health Soc. Behav. 1997, 38, 38–54. [Google Scholar] [CrossRef]
- Farmer, M.M.; Ferraro, K.F. Distress and Perceived Health: Mechanisms of Health Decline. J. Health Soc. Behav. 1997, 38, 298–311. [Google Scholar] [CrossRef]
- Mackenbach, J.P.; Bos, J.V.D.; Joung, I.M.A.; Van De Mheen, H.; Stronks, K. The Determinants of Excellent Health: Different from the Determinants of III-Health? Int. J. Epidemiol. 1994, 23, 1273–1281. [Google Scholar] [CrossRef]
- Idler, E.L.; Hudson, S.V.; Leventhal, H. The Meanings of Self-Ratings of Health: A Qualitative and Quantitative Approach. Res. Aging 1999, 21, 458–476. [Google Scholar] [CrossRef]
- Krause, N.M.; Jay, G.M. What Do Global Self-Rated Health Items Measure? Med. Care 1994, 32, 930–942. [Google Scholar] [CrossRef]
- World Health Organization. Basic Documents: Forty-Ninth Edition (Including Amendments Adopted up to 31 May 2019); World Health Organization: Geneva, Switzerland, 2020.
- Johnson, R.J.; Wolinsky, F.D. The Structure of Health Status Among Older Adults: Disease, Disability, Functional Limitation, and Perceived Health. J. Health Soc. Behav. 1993, 34, 105–121. [Google Scholar] [CrossRef] [PubMed]
- Shields, M.; Shooshtari, S. Determinants of self-perceived health. Health Rep. 2001, 13, 35–52. [Google Scholar] [PubMed]
- Kosloski, K.; Stull, D.E.; Kercher, K.; Van Dussen, D.J. Longitudinal Analysis of the Reciprocal Effects of Self-Assessed Global Health and Depressive Symptoms. J. Gerontol. Ser. B 2005, 60, P296–P303. [Google Scholar] [CrossRef] [PubMed]
- Barbosa, R.; Midão, L.; Almada, M.; Costa, E. Cognitive performance in older adults across Europe based on the SHARE database. Aging Neuropsychol. Cogn. 2021, 28, 584–599. [Google Scholar] [CrossRef] [PubMed]
- Börsch-Supan, A. Survey of Health, Ageing and Retirement in Europe (SHARE) Wave 5. Release Version: 7.1.0. SHARE-ERIC. Data Set. 2020. Available online: http://www.share-project.org/data-documentation/waves-overview/wave-5.html (accessed on 20 September 2022).
- Börsch-Supan, A. Survey of Health, Ageing and Retirement in Europe (SHARE) Wave 6. Release Version: 7.1.0. SHARE-ERIC. Data Set. 2020. Available online: http://www.share-project.org/data-documentation/waves-overview/wave-6.html (accessed on 20 September 2022).
- Börsch-Supan, A. Survey of Health, Ageing and Retirement in Europe (SHARE) Wave 7. Release Version: 7.1.0. SHARE-ERIC. Data Set. 2020. Available online: http://www.share-project.org/data-documentation/waves-overview/wave-7.html (accessed on 20 September 2022).
- Börsch-Supan, A.; Brandt, M.; Hunkler, C.; Kneip, T.; Korbmacher, J.; Malter, F.; Schaan, B.; Stuck, S.; Zuber, S.; on behalf of the SHARE Central Coordination Team. Data Resource Profile: The Survey of Health, Ageing and Retirement in Europe (SHARE). Int. J. Epidemiol. 2013, 42, 992–1001. [Google Scholar] [CrossRef] [PubMed]
- Börsch-Supan, A.; Kneip, T.; Litwin, H.; Myck, M.; Weber, G. Ageing in Europe—Supporting Policies for an Inclusive Society; De Gruyter: Berlin, Germany, 2015. [Google Scholar]
- Malter, F.; Börsch-Supan, A. SHARE Wave 5: Innovations & Methodology; MEA, Max Planck Institute for Social Law and Social Policy: Munich, Germany, 2015. [Google Scholar]
- Malter, F.; Börsch-Supan, A. SHARE Wave 6: Panel Innovations and Collecting Dried Blood Spots; Munich Center for the Economics of Aging (MEA): Munich, Germany, 2017. [Google Scholar]
- Bergmann, M.; Scherpenzeel, A.; Börsch-Supan, A. SHARE Wave 7 Methodology: Panel Innovations and Life Histories; Munich Center for the Economics of Aging (MEA): Munich, Germany, 2019. [Google Scholar]
- United Nations. Standard Country or Area Codes for Statistical Use; United Nations: Midtown Manhattan, NY, USA, 1999. [Google Scholar]
- Mehrbrodt, T.; Gruber, S.; Wagner, M. Scales and Multi-Item Indicators. Available online: http://www.share-project.org/fileadmin/pdf_documentation/ScalesManual_rel.8-0-0.pdf (accessed on 1 December 2022).
- R Core Team. R: A Language and Environment for Statistical Computing; R Core Team: Vienna, Austria, 2020. [Google Scholar]
- Machón, M.; Vergara, I.; Dorronsoro, M.; Vrotsou, K.; Larrañaga, I. Self-perceived health in functionally independent older people: Associated factors. BMC Geriatr. 2016, 16, 66. [Google Scholar] [CrossRef]
- Ko, Y.; Boo, S. Self-perceived health versus actual cardiovascular disease risks. Jpn. J. Nurs. Sci. 2016, 13, 65–74. [Google Scholar] [CrossRef]
- Benyamini, Y.; Leventhal, E.A.; Leventhal, H. Gender Differences in Processing Information for Making Self-Assessments of Health. Psychosom. Med. 2000, 62, 354–364. [Google Scholar] [CrossRef]
- Idler, E.L. Age Differences in Self–Assessments of Health: Age Changes, Cohort Differences, or Survivorship? J. Gerontol. 1993, 48, S289–S300. [Google Scholar] [CrossRef]
- Busutil, R.; Espallardo, O.; Torres, A.; Martínez-Galdeano, L.; Zozaya, N.; Hidalgo-Vega, Á. The impact of obesity on health-related quality of life in Spain. Health Qual. Life Outcomes 2017, 15, 197. [Google Scholar] [CrossRef]
- Oliva-Moreno, J.; Gil-Lacruz, A. Body weight and health-related quality of life in Catalonia, Spain. Eur. J. Health Econ. 2013, 14, 95–105. [Google Scholar] [CrossRef] [PubMed]
- Hassan, M.K.; Joshi, A.V.; Madhavan, S.S.; Amonkar, M.M. Obesity and health-related quality of life: A cross-sectional analysis of the US population. Int. J. Obes. 2003, 27, 1227–1232. [Google Scholar] [CrossRef] [PubMed]
- Ford, E.S.; Moriarty, D.G.; Zack, M.M.; Mokdad, A.H.; Chapman, D.P. Self-Reported Body Mass Index and Health-Related Quality of Life: Findings from the Behavioral Risk Factor Surveillance System. Obes. Res. 2001, 9, 21–31. [Google Scholar] [CrossRef] [PubMed]
- Williams, E.P.; Mesidor, M.; Winters, K.; Dubbert, P.M.; Wyatt, S.B. Overweight and Obesity: Prevalence, Consequences, and Causes of a Growing Public Health Problem. Curr. Obes. Rep. 2015, 4, 363–370. [Google Scholar] [CrossRef]
- Katz, D.A.; McHorney, C.A.; Atkinson, R.L. Impact of Obesity on Health-related Quality of Life in Patients with Chronic Illness. J. Gen. Intern. Med. 2000, 15, 789–796. [Google Scholar] [CrossRef]
- Myers, A.; Rosen, J.C. Obesity stigmatization and coping: Relation to mental health symptoms, body image, and self-esteem. Int. J. Obes. 1999, 23, 221–230. [Google Scholar] [CrossRef]
- Toci, E.; Burazeri, G.; Jerliu, N.; Sørensen, K.; Ramadani, N.; Hysa, B.; Brand, H. Health literacy, self-perceived health and self-reported chronic morbidity among older people in Kosovo. Health Promot. Int. 2015, 30, 667–674. [Google Scholar] [CrossRef]
- Haseen, F.; Adhikari, R.; Soonthorndhada, K. Self-assessed health among Thai elderly. BMC Geriatr. 2010, 10, 30. [Google Scholar] [CrossRef]
- Sun, W.; Watanabe, M.; Tanimoto, Y.; Shibutani, T.; Kono, R.; Saito, M.; Usuda, K.; Kono, K. Factors associated with good self-rated health of non-disabled elderly living alone in Japan: A cross-sectional study. BMC Public Health 2007, 7, 297. [Google Scholar] [CrossRef]
- Weinman, J.; Petrie, K.J.; Moss-morris, R.; Horne, R. The illness perception questionnaire: A new method for assessing the cognitive representation of illness. Psychol. Health 1996, 11, 431–445. [Google Scholar] [CrossRef]
- Wu, S.; Wang, R.; Zhao, Y.; Ma, X.; Wu, M.; Yan, X.; He, J. The relationship between self-rated health and objective health status: A population-based study. BMC Public Health 2013, 13, 320. [Google Scholar] [CrossRef] [PubMed]
- Masnoon, N.; Shakib, S.; Kalisch-Ellett, L.; Caughey, G.E. What is polypharmacy? A systematic review of definitions. BMC Geriatr. 2017, 17, 230. [Google Scholar] [CrossRef] [PubMed]
- Linjakumpu, T.; Hartikainen, S.; Klaukka, T.; Veijola, J.; Kivelä, S.-L.; Isoaho, R. Use of medications and polypharmacy are increasing among the elderly. J. Clin. Epidemiol. 2002, 55, 809–817. [Google Scholar] [CrossRef] [PubMed]
- Leong, D.P.; Teo, K.K.; Rangarajan, S.; Lopez-Jaramillo, P.; Avezum, A.; Orlandini, A.; Seron, P.; Ahmed, S.H.; Rosengren, A.; Kelishadi, R.; et al. Prognostic value of grip strength: Findings from the Prospective Urban Rural Epidemiology (PURE) study. Lancet 2015, 386, 266–273. [Google Scholar] [CrossRef] [PubMed]
- Zhao, J.; Chhetri, J.K.; Ji, S.; Ma, L.; Dan, X.; Chan, P. Poor self-perceived health is associated with frailty and prefrailty in urban living older adults: A cross-sectional analysis. Geriatr. Nurs. 2020, 41, 754–760. [Google Scholar] [CrossRef]
- Guralnik, J.M.; Ferrucci, L. Assessing the building blocks of function: Utilizing measures of functional limitation. Am. J. Prev. Med. 2003, 25, 112–121. [Google Scholar] [CrossRef]
- Hacihasanoğlu, R.; Yildirim, A.; Karakurt, P. Loneliness in elderly individuals, level of dependence in activities of daily living (ADL) and influential factors. Arch. Gerontol. Geriatr. 2012, 54, 61–66. [Google Scholar] [CrossRef]
- Portela, D.; Almada, M.; Midão, L.; Costa, E. Instrumental Activities of Daily Living (iADL) Limitations in Europe: An Assessment of SHARE Data. Int. J. Environ. Res. Public Health 2020, 17, 7387. [Google Scholar] [CrossRef]
- Spiers, N.; Jagger, C.; Clarke, M. Physical Function and Perceived Health: Cohort Differences and Interrelationships in Older People. J. Gerontol. Ser. B 1996, 51B, S226–S233. [Google Scholar] [CrossRef]
- Van Oyen, H.; Bogaert, P.; Yokota, R.T.C.; Berger, N. Measuring disability: A systematic review of the validity and reliability of the Global Activity Limitations Indicator (GALI). Arch. Public Health 2018, 76, 25. [Google Scholar] [CrossRef]
- Dale, B.; Sævareid, H.I.; Kirkevold, M.; Söderhamn, O. Formal and informal care in relation to activities of daily living and self-perceived health among older care-dependent individuals in Norway. Int. J. Older People Nurs. 2008, 3, 194–203. [Google Scholar] [CrossRef] [PubMed]
- Rantanen, T. Promoting Mobility in Older People. J. Prev. Med. Public Health 2013, 46, S50–S54. [Google Scholar] [CrossRef] [PubMed]
- Yeom, H.A.; Fleury, J.; Keller, C. Risk Factors for Mobility Limitation in Community-Dwelling Older Adults: A Social Ecological Perspective. Geriatr. Nurs. 2008, 29, 133–140. [Google Scholar] [CrossRef] [PubMed]
- Ribeiro, E.G.; Matozinhos, F.P.; Guimarães, G.d.L.; Couto, A.M.d.; Azevedo, R.S.; Mendoza, I.Y.Q. Self-perceived health and clinical-functional vulnerability of the elderly in Belo Horizonte/Minas Gerais. Rev. Bras. Enferm. 2018, 71, 860–867. [Google Scholar] [CrossRef]
- Ronchetti, J.; Terriau, A. Impact of unemployment on self-perceived health. Eur. J. Health Econ. 2019, 20, 879–889. [Google Scholar] [CrossRef]
- van den Berg, T.; Schuring, M.; Avendano, M.; Mackenbach, J.; Burdorf, A. The impact of ill health on exit from paid employment in Europe among older workers. Occup. Environ. Med. 2010, 67, 845. [Google Scholar] [CrossRef]
- Morris, C.E.; Goli, V. The Physiology and Biomedical Aspects of Chronic Pain in Later Life. J. Women Aging 1994, 6, 9–24. [Google Scholar] [CrossRef]
- Sengstaken, E.A.; King, S.A. The Problems of Pain and Its Detection among Geriatric Nursing Home Residents. J. Am. Geriatr. Soc. 1993, 41, 541–544. [Google Scholar] [CrossRef]
- Pickard, S. Health, illness and frailty in old age: A phenomenological exploration. J. Aging Stud. 2018, 47, 24–31. [Google Scholar] [CrossRef]
- Maniscalco, L.; Miceli, S.; Bono, F.; Matranga, D. Self-Perceived Health, Objective Health, and Quality of Life among People Aged 50 and Over: Interrelationship among Health Indicators in Italy, Spain, and Greece. Int. J. Environ. Res. Public Health 2020, 17, 2414. [Google Scholar] [CrossRef]
- Kiecolt-Glaser, J.K.; McGuire, L.; Robles, T.F.; Glaser, R. Emotions, Morbidity, and Mortality: New Perspectives from Psychoneuroimmunology. Annu. Rev. Psychol. 2002, 53, 83–107. [Google Scholar] [CrossRef] [PubMed]
- Glassman, A.H.; Shapiro, P.A. Depression and the Course of Coronary Artery Disease. Am. J. Psychiatry 1998, 155, 4–11. [Google Scholar] [CrossRef] [PubMed]
- Penninx, B.W.; Leveille, S.; Ferrucci, L.; van Eijk, J.T.; Guralnik, J.M. Exploring the effect of depression on physical disability: Longitudinal evidence from the established populations for epidemiologic studies of the elderly. Am. J. Public Health 1999, 89, 1346–1352. [Google Scholar] [CrossRef] [PubMed]
- Pino, L.; González-Vélez, A.E.; Prieto-Flores, M.-E.; Ayala, A.; Fernandez-Mayoralas, G.; Rojo-Perez, F.; Martinez-Martin, P.; Forjaz, M.J. Self-perceived health and quality of life by activity status in community-dwelling older adults. Geriatr. Gerontol. Int. 2014, 14, 464–473. [Google Scholar] [CrossRef] [PubMed]
- Richard, A.; Rohrmann, S.; Vandeleur, C.L.; Schmid, M.; Barth, J.; Eichholzer, M. Loneliness is adversely associated with physical and mental health and lifestyle factors: Results from a Swiss national survey. PLoS ONE 2017, 12, e0181442. [Google Scholar] [CrossRef] [PubMed]
- Almeida, M.L.d.; Dalpubel, D.; Ribeiro, E.B.; Oliveira, E.S.B.d.; Ansai, J.H.; Vale, F.A.C. Subjective cognitive impairment, cognitive disorders and self-perceived health: The importance of the informant. Dement. Neuropsychol. 2019, 13, 335–342. [Google Scholar] [CrossRef] [PubMed]
- Combalbert, N.; Pennequin, V.; Ferrand, C.; Armand, M.; Anselme, M.; Geffray, B. Cognitive impairment, self-perceived health and quality of life of older prisoners. Crim. Behav. Ment. Health 2018, 28, 36–49. [Google Scholar] [CrossRef]


| UNGeo | Country | Total Participants | Male Participants | Female Participants | ||||||
|---|---|---|---|---|---|---|---|---|---|---|
| n | % | Mean Age | SD Age | n | % | Mean Age | SD Age | |||
| Eastern Europe | Czech Rep. | 7594 | 3147 | 41.44 | 64.55 | 6.12 | 4447 | 58.56 | 64.55 | 6.12 |
| Poland | 2038 | 885 | 43.42 | 64.09 | 6.09 | 1153 | 56.58 | 64.09 | 6.09 | |
| Northern Europe | Denmark | 6917 | 3260 | 47.13 | 62.72 | 6.88 | 3657 | 52.87 | 62.72 | 6.88 |
| Estonia | 6972 | 2716 | 38.96 | 63.21 | 6.84 | 4256 | 61.04 | 63.21 | 6.84 | |
| Sweden | 6409 | 2953 | 46.08 | 65.53 | 6.10 | 3456 | 53.92 | 65.53 | 6.10 | |
| Southern Europe | Croatia | 1876 | 861 | 45.9 | 62.65 | 6.53 | 1015 | 54.10 | 62.65 | 6.53 |
| Greece | 4591 | 2009 | 43.76 | 64.42 | 6.50 | 2582 | 56.24 | 64.42 | 6.50 | |
| Italy | 7633 | 3452 | 45.22 | 64.04 | 6.96 | 4181 | 54.78 | 64.04 | 6.96 | |
| Portugal | 1109 | 491 | 44.27 | 64.61 | 5.93 | 618 | 55.73 | 64.61 | 5.93 | |
| Slovenia | 4945 | 2180 | 44.08 | 63.04 | 6.44 | 2765 | 55.92 | 63.04 | 6.44 | |
| Spain | 7729 | 3661 | 47.37 | 63.82 | 6.48 | 4068 | 52.63 | 63.82 | 6.48 | |
| Western Europe | Austria | 5460 | 2309 | 42.29 | 64.48 | 6.56 | 3151 | 57.71 | 64.48 | 6.56 |
| Belgium | 8951 | 4142 | 46.27 | 62.34 | 6.83 | 4809 | 53.73 | 62.34 | 6.83 | |
| France | 6487 | 2920 | 45.01 | 63.18 | 6.37 | 3567 | 54.99 | 63.18 | 6.37 | |
| Germany | 8078 | 3846 | 47.61 | 62.98 | 7.25 | 4232 | 52.39 | 62.98 | 7.25 | |
| Luxembourg | 2333 | 1118 | 47.92 | 62.17 | 6.56 | 1215 | 52.08 | 62.17 | 6.56 | |
| Netherlands | 3090 | 1414 | 45.76 | 63.03 | 6.56 | 1676 | 54.24 | 63.03 | 6.56 | |
| Switzerland | 4690 | 2153 | 45.91 | 64.33 | 6.36 | 2537 | 54.09 | 64.33 | 6.36 | |
| Category | Parameter | Scale | Description |
|---|---|---|---|
| Mental health | EURO-D scale | Numeric [1,12] 1 = Not depressed 12 = very depressed | 12-item depression scale |
| CASP-12 | Numeric [12,48] 12 = Low quality of life 48 = High quality of life | Revised 12-item version of the 19-item CASP-19 for the measure of the quality of life | |
| Loneliness | Numeric [3,9] 3 = Not lonely 9 = Very lonely | 3-item loneliness scale based on the R-UCLA Loneliness Scale | |
| Physical health | GALI | Categorical 1 = Severely limited 2= Limited, but not severely 3 = Not limited | Global Activity Limitation Index—indicator measuring long-standing activity limitations linked to general health problems |
| ADL | Numeric [0,6] 0 = No difficulties 6 = Higher limitations | Activities of Daily Living—number of limitations with everyday self-care activities referring to the maintenance of independence | |
| IADL | Numeric [0,7] 0 = No difficulties 7 = Higher limitations | Instrumental Activities of Daily Living—Modified 7-item index describing the number of limitations with instrumental activities of everyday life | |
| Pain | Categorical 0 = Yes 1 = No | Single value indicating if the participant is troubled with pain. | |
| BMI | Numeric | Body Mass Index—measure for evaluating body weight in relation to height (kg/m2) | |
| Maximum grip strength | Numeric | Maximum value of the grip measurements of both hands (kg). It is considered an indicator of skeletal muscle function | |
| Number of chronic diseases | Numeric | Number of chronic diseases | |
| Mobility | Numeric [0,10] 0 = No difficulties 10 = Higher limitations | Mobility, arm function, and fine motor limitations | |
| Number of drugs | Numeric | Number of drugs taken at least once a week | |
| Long term illness | Categorical 0 = Yes 1 = No | Presence of long-term illness | |
| Work limitation | Categorical 0 = Yes 1 = No | Health problems that limit paid work | |
| Frailty | Categorical 0 = Yes 1 = No | Bothered by frailty | |
| Cognitive functioning | Immediate recall | Numeric [0,10] | Number of words that the respondent is able to recall immediately after the encoding phase during the 10-word recall test |
| Delayed recall | Numeric [0,10] | Number of words that the respondent is able to recall after a delay time during the 10-word recall test | |
| Verbal fluency | Numeric [0,100] | Number of correct words from a semantic category that the respondent says in 60 s |
| Variables | Excellent/Very Good SPH | % | Total |
|---|---|---|---|
| Sex | |||
| Male | 13,389 | 30.77 | 43,517 (44.91%) |
| Female | 15,521 | 29.07 | 53,385 (55.09%) |
| GALI1 | |||
| Not limited | 25,582 | 43.22 | 59,193 (61.09%) |
| Limited | 3328 | 8.83 | 37,709 (38.91%) |
| Pain | |||
| Yes | 5144 | 13.01 | 39,541 (40.81%) |
| No | 23,766 | 41.43 | 57,361 (59.19%) |
| Long-term illness | |||
| Yes | 5742 | 12.71 | 45,179 (46.62%) |
| No | 23,168 | 44.79 | 51,723 (53.38%) |
| Work limitation | |||
| Yes | 1290 | 6.57 | 19,640 (20.27%) |
| No | 27,620 | 35.75 | 77,262 (79.73%) |
| Frailty | |||
| Not selected | 3342 | 11.64 | 28,718 (29.64%) |
| Selected | 25,568 | 37.5 | 68,184 (70.36%) |
| Very Good | Less than Very Good | |||
|---|---|---|---|---|
| Mean | SD | Mean | SD | |
| Age | 61.81 | 6.71 | 63.83 | 6.71 |
| EURO-D 1 | 1.35 | 1.55 | 2.53 | 2.22 |
| CASP 2 | 41.13 | 4.82 | 37.13 | 5.99 |
| Loneliness | 3.45 | 0.93 | 3.87 | 1.33 |
| ADL 3 | 0.02 | 0.19 | 0.16 | 0.6 |
| IADL 4 | 0.03 | 0.26 | 0.23 | 0.78 |
| BMI 5 | 25.79 | 3.86 | 27.57 | 4.83 |
| Maximum grip strength | 37.54 | 11.29 | 34.32 | 11.53 |
| Number of chronic diseases | 0.79 | 0.97 | 1.9 | 1.52 |
| Mobility | 0.28 | 0.77 | 1.51 | 2.06 |
| Drugs | 0.79 | 0.99 | 1.94 | 1.64 |
| Immediate recall | 6.07 | 1.55 | 5.48 | 1.62 |
| Delayed recall | 4.91 | 1.97 | 4.12 | 2.07 |
| Verbal fluency | 23.49 | 7.68 | 20.79 | 7.38 |
| Category | Parameter | B (SE) | 95% CI | p |
|---|---|---|---|---|
| (Intercept) | 0.784 (0.007) | [0.77 0.8] | <0.001 | |
| Individual characteristics | Age | 0.02 (0.002) | [0.02 0.03] | <0.001 |
| Sex | −0.036 (0.002) | [−0.04 −0.03] | <0.001 | |
| Mental health | EURO-D scale 1 | 0.102 (0.004) | [0.09 0.11] | <0.001 |
| CASP-12 2 | −0.248 (0.005) | [−0.26 −0.24] | <0.001 | |
| Loneliness | −0.022 (0.003) | [−0.03 −0.02] | <0.001 | |
| Physical health | GALI 3 | 0.08 (0.002) | [0.08 0.08] | <0.001 |
| IADL 4 | −0.024 (0.01) | [−0.04 −0.01] | 0.011 | |
| Pain | −0.04 (0.001) | [−0.04 −0.04] | <0.001 | |
| BMI 5 | 0.262 (0.012) | [0.24 0.29] | <0.001 | |
| Maximum grip strength | −0.131 (0.009) | [−0.15 −0.11] | <0.001 | |
| Number of chronic diseases | 0.191 (0.008) | [0.17 0.21] | <0.001 | |
| Mobility | 0.121 (0.005) | [0.11 0.13] | <0.001 | |
| Number of drugs | 0.133 (0.007) | [0.12 0.15] | <0.001 | |
| Long term illness | −0.073 (0.002) | [−0.08 −0.07] | <0.001 | |
| Work limitation | −0.046 (0.002) | [−0.05 −0.04] | <0.001 | |
| Frailty | −0.031 (0.002) | [−0.03 −0.03] | <0.001 | |
| Cognitive functioning | Immediate recall | −0.03 (0.005) | [−0.04 −0.02] | <0.001 |
| Delayed recall | −0.066 (0.004) | [−0.07 −0.06] | <0.001 | |
| Verbal fluency | −0.129 (0.009) | [−0.15 −0.11] | <0.001 |
Publisher’s Note: MDPI stays neutral with regard to jurisdictional claims in published maps and institutional affiliations. |
© 2022 by the authors. Licensee MDPI, Basel, Switzerland. This article is an open access article distributed under the terms and conditions of the Creative Commons Attribution (CC BY) license (https://creativecommons.org/licenses/by/4.0/).
Share and Cite
Caramenti, M.; Castiglioni, I. Determinants of Self-Perceived Health: The Importance of Physical Well-Being but Also of Mental Health and Cognitive Functioning. Behav. Sci. 2022, 12, 498. https://doi.org/10.3390/bs12120498
Caramenti M, Castiglioni I. Determinants of Self-Perceived Health: The Importance of Physical Well-Being but Also of Mental Health and Cognitive Functioning. Behavioral Sciences. 2022; 12(12):498. https://doi.org/10.3390/bs12120498
Chicago/Turabian StyleCaramenti, Martina, and Isabella Castiglioni. 2022. "Determinants of Self-Perceived Health: The Importance of Physical Well-Being but Also of Mental Health and Cognitive Functioning" Behavioral Sciences 12, no. 12: 498. https://doi.org/10.3390/bs12120498
APA StyleCaramenti, M., & Castiglioni, I. (2022). Determinants of Self-Perceived Health: The Importance of Physical Well-Being but Also of Mental Health and Cognitive Functioning. Behavioral Sciences, 12(12), 498. https://doi.org/10.3390/bs12120498