Article

Tropical Cyclone-Induced Hazards Caused by Storm Surges and Large Waves on the Coast of China

1
Institute of Ports and Coastal Disaster Mitigation, Ludong University, Yantai 264025, China
2
School of Civil Engineering, University of Queensland, Brisbane, QLD 4072, Australia
Geosciences 2019, 9(3), 131; https://doi.org/10.3390/geosciences9030131
Submission received: 20 January 2019 / Revised: 11 March 2019 / Accepted: 13 March 2019 / Published: 18 March 2019
(This article belongs to the Special Issue Marine Geohazards: New Insights and Perspectives)

Abstract

:
The mainland coast of China is about 18,000 km long and houses about 70% of China’s largest cities and 50% of its population. For the last few decades, the rapid growth of the Chinese economy has resulted in extensive development of the coastal infrastructure and property, large-scale expansion of coastal ports, excessive reclamation of coastal land, and a significant increase in the coastal population. Previous studies have indicated that tropical cyclones (TCs) have struck the coast of China at a higher frequency and intensity, and TC-induced coastal hazards have resulted in heavy human losses and huge losses to the Chinese coastal economy. In analyzing the long-term and most recent coastal hazard data collected on the coast of China, this study has found that TC-induced storm surges are responsible for 88% of the direct coastal economic losses, while TC-induced large coastal waves have caused heavy loss of human lives, and that the hazard-caused losses are shown to increase spatially from the north to south, peak in the southern coastal sector, and well correlate to storm wave energy flux. The frequency and intensity of coastal hazards on the coast of China are expected to increase in response to future changing TC conditions and rising sea levels. A simple two-parameter conceptual model is also presented for the assessment of coastal inundation and erosion hazards on the coast of China.

1. Introduction

There is about 50% of the Chinese national population living and working along the 18,000 km mainland coast of China. Although the coastal land area is less than 14% of the territory of China, it creates more than 50% of the national wealth, 45% of the state-owned assets, 64% of the township enterprise assets, and 60% of the national social wealth [1]. For the last few decades, the rapid economic growth in China has resulted in extensive development of the coastal infrastructure and property, excessive reclamation of coastal land, huge expansion of coastal ports, and a significant increase in the coastal population. Furthermore, there are also increasing pressures to further develop Chinese coastal areas for residential, commercial, tourism, and recreational purposes.
Tropical cyclones (TCs) strike with higher frequency and intensity in China than any other country in the world [2]. There are about 6–10 landfall TCs in a typical year on the coast of China. TCs that strike East and South-East Asia have intensified by 12–15%, with the proportion of storm categories 4 and 5 having doubled or even tripled [3,4]. The high landfall frequency and intensity of TCs is due to the facts that the coastline of China is oriented in the west of the northwest Pacific Basin, which has a high frequency and intensity of TCs, and furthermore the coastline is quite long and is oriented in a north–south direction thus exposing to the dominant direction of TCs. The Meteorological Administration of China maintains the Tropical Cyclone Data, including typhoon track data, satellite reanalysis data, typhoon landfall data, wind data, and rainfall data. The globally averaged intensity of TCs is projected to continue to shift toward stronger storms with an expected increase of 2% to 11% by 2100 [5].
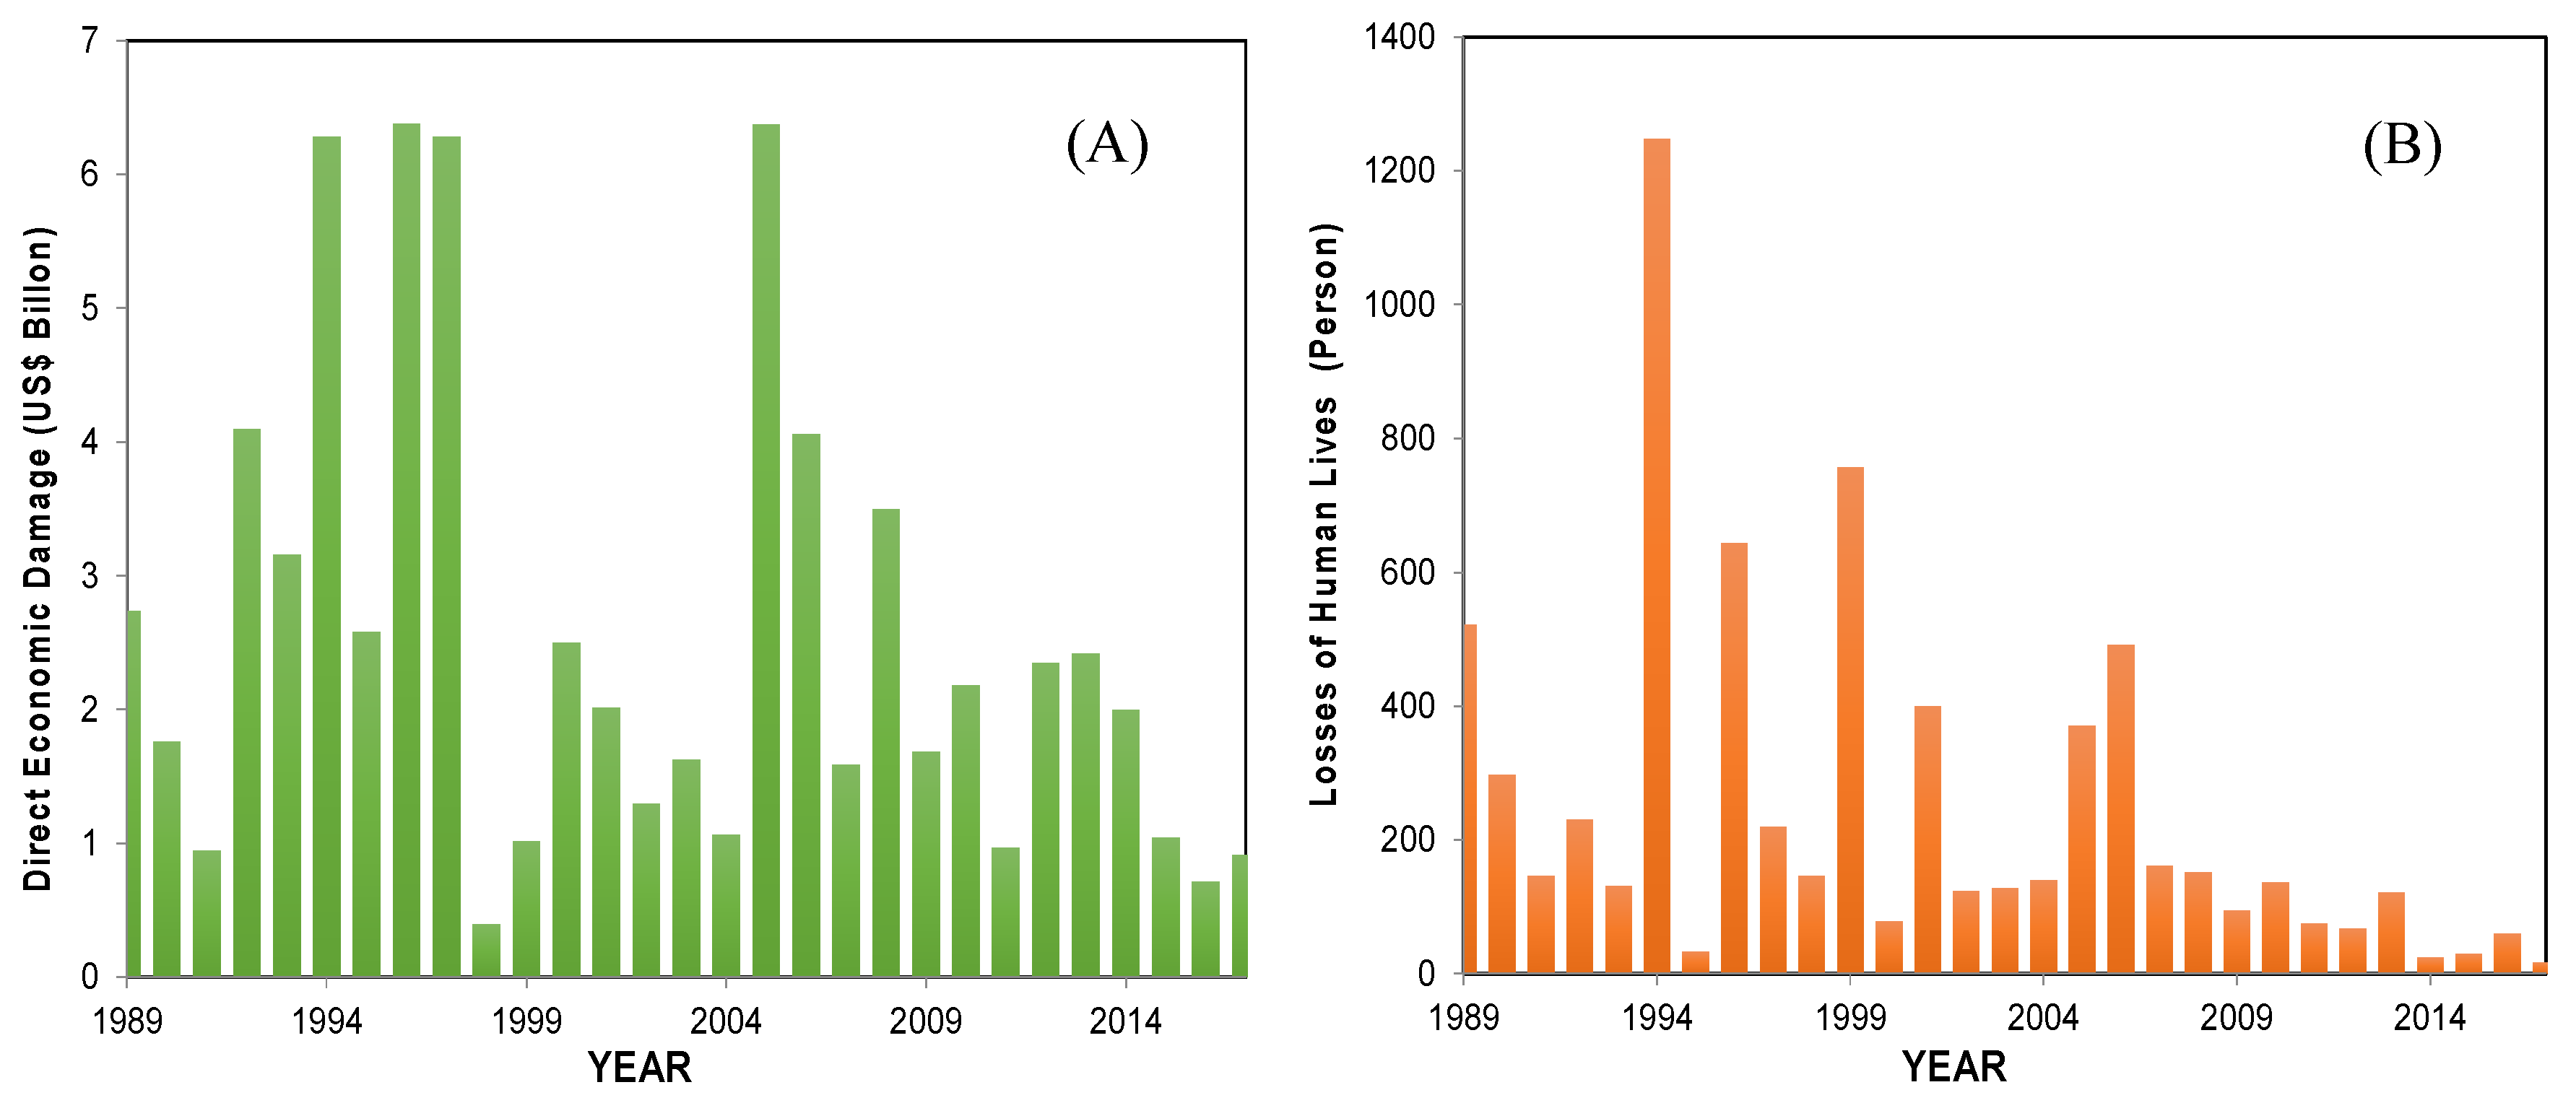
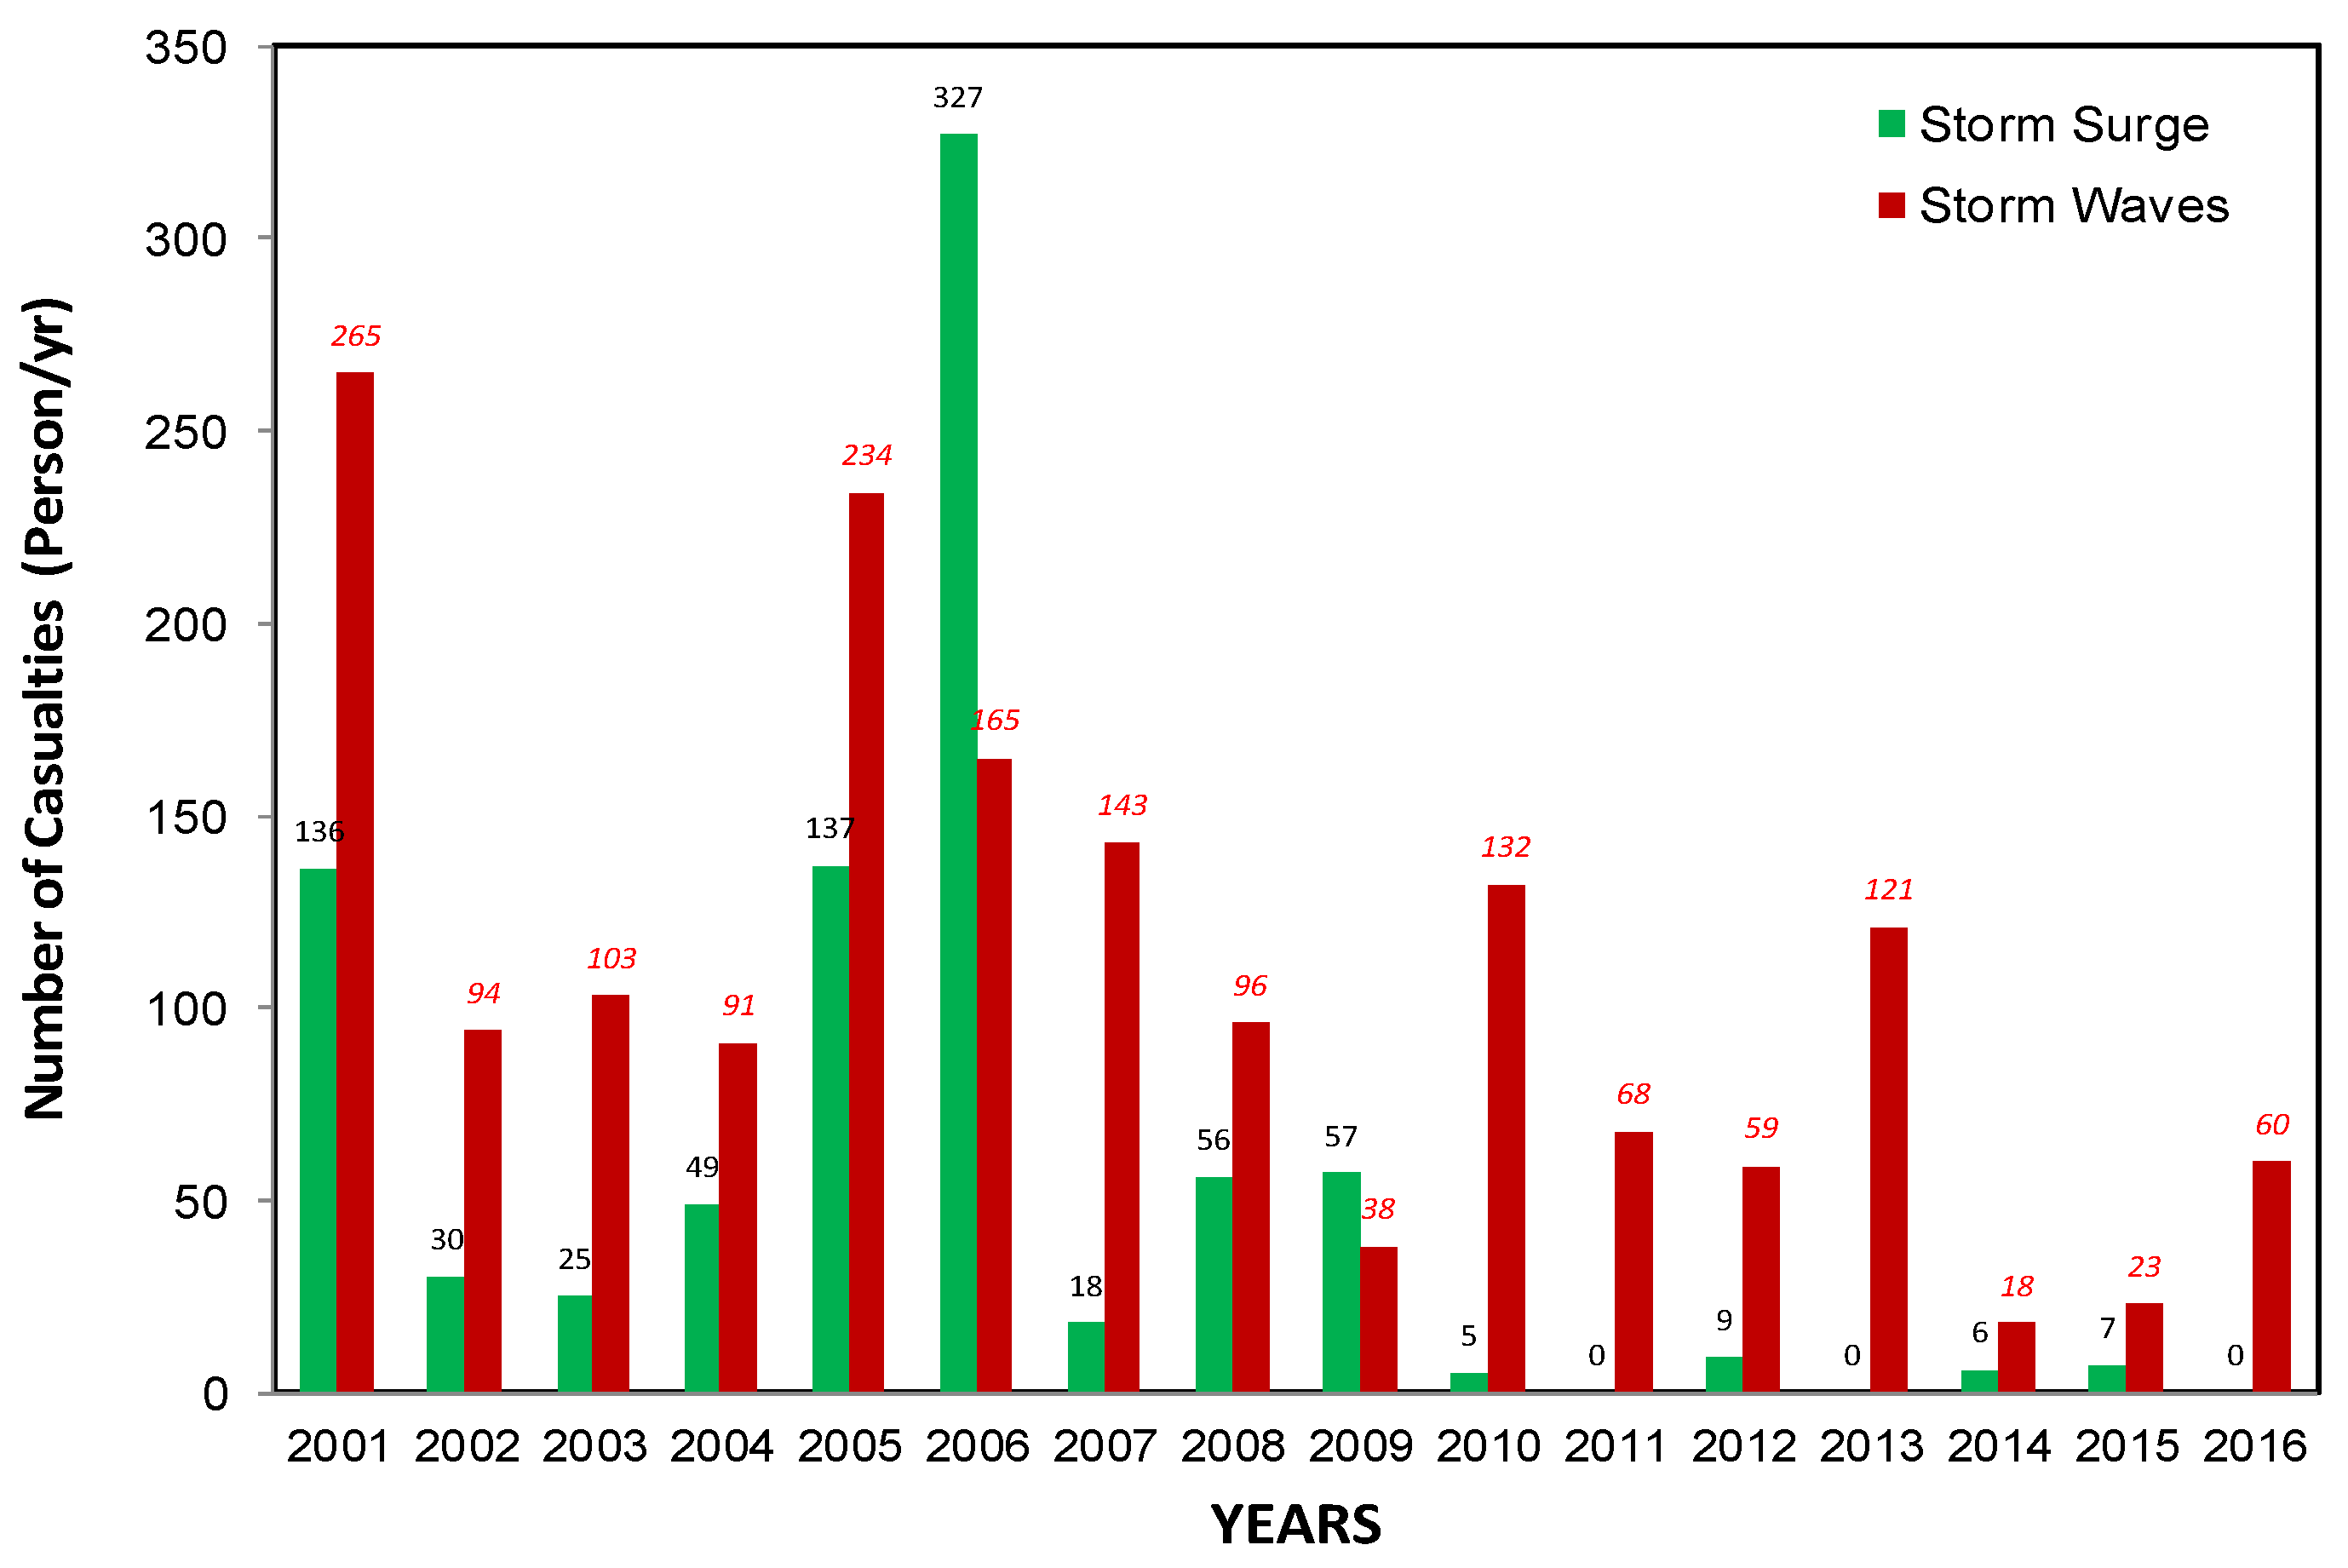
TC-induced storm surges are a major coastal hazard, especially in the three provincial sectors of Zhejiang, Fujian, and Guangdong all situated on the southern coast of China. The storm surge hazard on the coast of China is a regional paroxysmal one that can cause enormous loss of human lives, property, and infrastructure. The highest rate of low-magnitude surges is observed in the western North Pacific, as the coast of China has 54 surges larger than 1 m per decade [6], and the prominent consequences from the large storm events could remain for many years. In 2014, the China Sea Level Bulletin stated that from 2004 to 2006, more frequent and higher intensity storm surges were responsible for the greatest losses of coastal property in the provincial coastal sectors of Zhejiang and Fujian, and the losses were more serious than those in the historical records. The increasing economic losses on the coast of China are also found to be associated with the rapid socio-economic development of the coastal areas; global climate change and sea level rise may also play an important role [7,8]. The storm surge hazard has resulted in severe damage to the Chinese coastal economy and heavy human losses. For example, on 21 August 1994, TC (No. 9417) hit the coast of Zhejiang Province, resulting in 1248 deaths, the flooding of 189 coastal towns, affecting 22.8 million people, and causing a direct economic loss of US $2.5 billion [9]. In the East Asia and Pacific region, the coast of China is expected to be a high-risk area due to the future storm surge hazard. Even though numerous studies were undertaken to investigate TC-induced storm surges on the coast of China, the great impacts of storm waves and their elevated mean water levels were often not considered in the modeling of coastal inundation [10].
TC-induced coastal erosion is another major hazard on the coast of China. About 46% of the Bohai Sea coastline, 49% of the Yellow Sea coastline, 44% of the East China Sea coastline, and 21% of the South China Sea coastline have severe erosion problems [11]. The shoreline retreat in low-lying areas around the Shandong Peninsula is greatly accelerated, and a maximum shoreline retreat of 300 m/year is found around the mouth of the Yellow River. This has resulted in Chinese national land losses of 14.3 ha and economic losses of US $50 million per year [12]. Even though several types of physical processes-based numerical models, such as X-Beach, have been used to estimate coastal storm erosion rates on the coast of China [13], how to predict long-term shoreline changes especially for some of the muddy coastal regions remains unsolved.
On the basis of the long-term and most recent coastal hazard data collected by the State Oceanic Administration of China (SOA) from 1989 to 2017, this study is undertaken to systematically investigate the major coastal hazards and their unique drivers, determine the impact of storm waves and different timescales of mean water levels on the coast of China, and finally present a simple two-parameter conceptual model for the assessment of coastal inundation and erosion hazards on the coast of Yantai, China.

2. Study Area

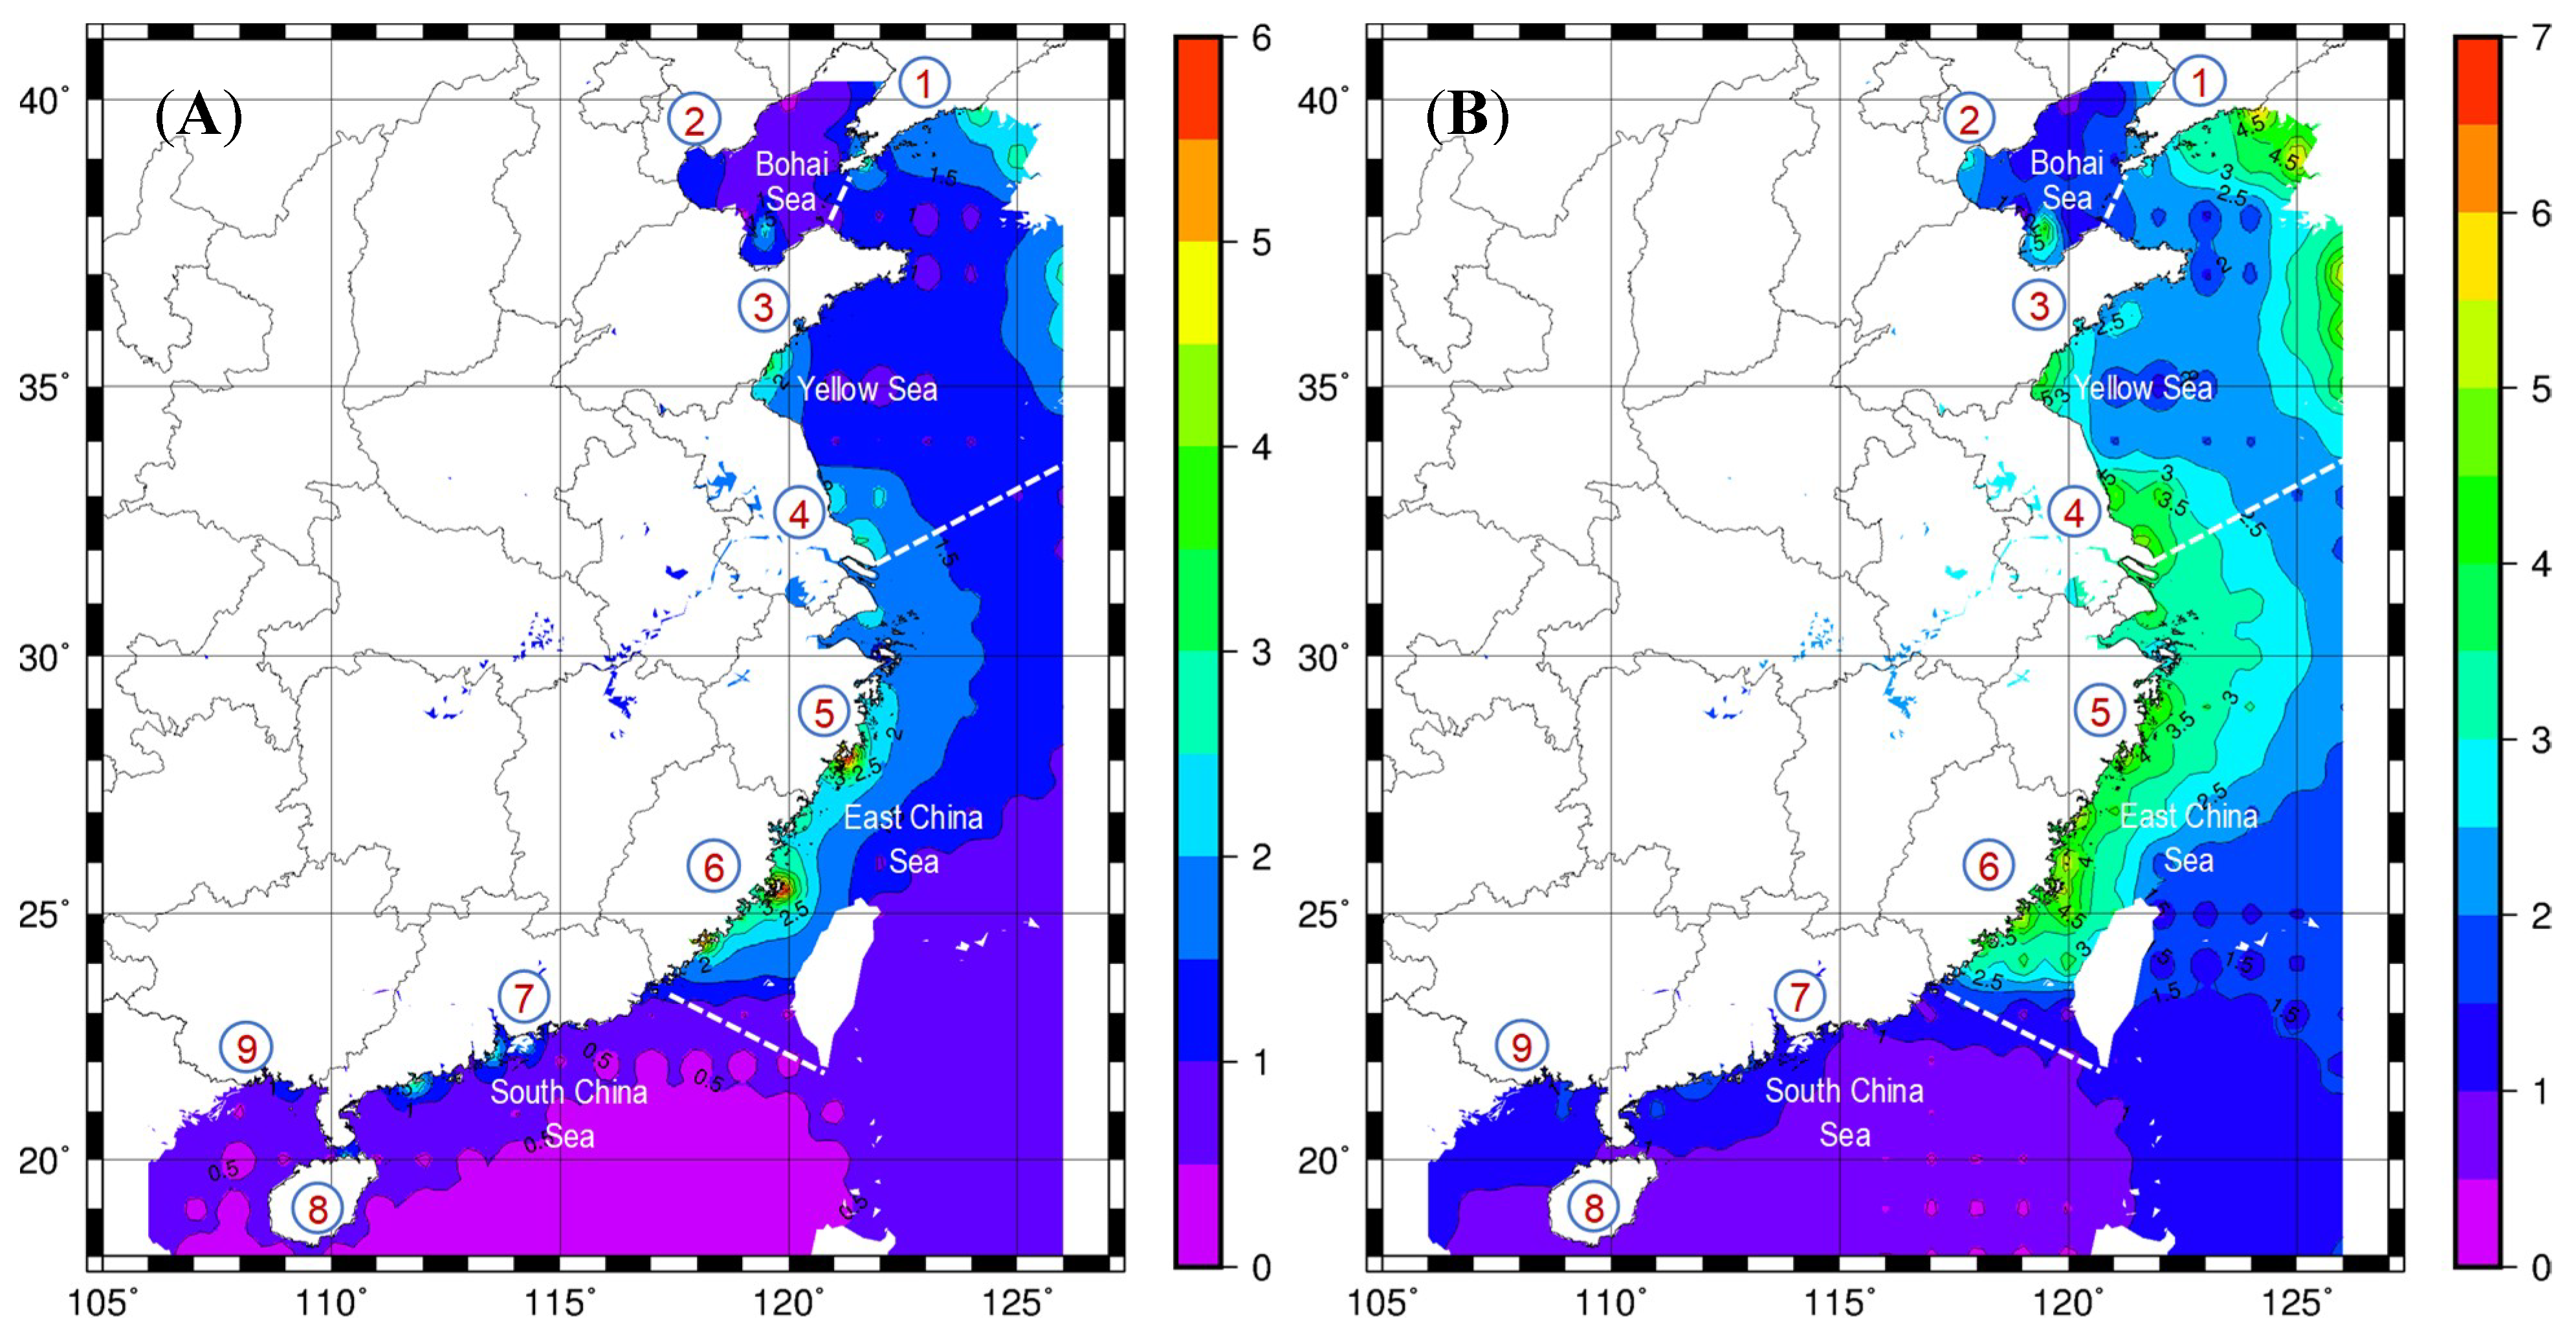
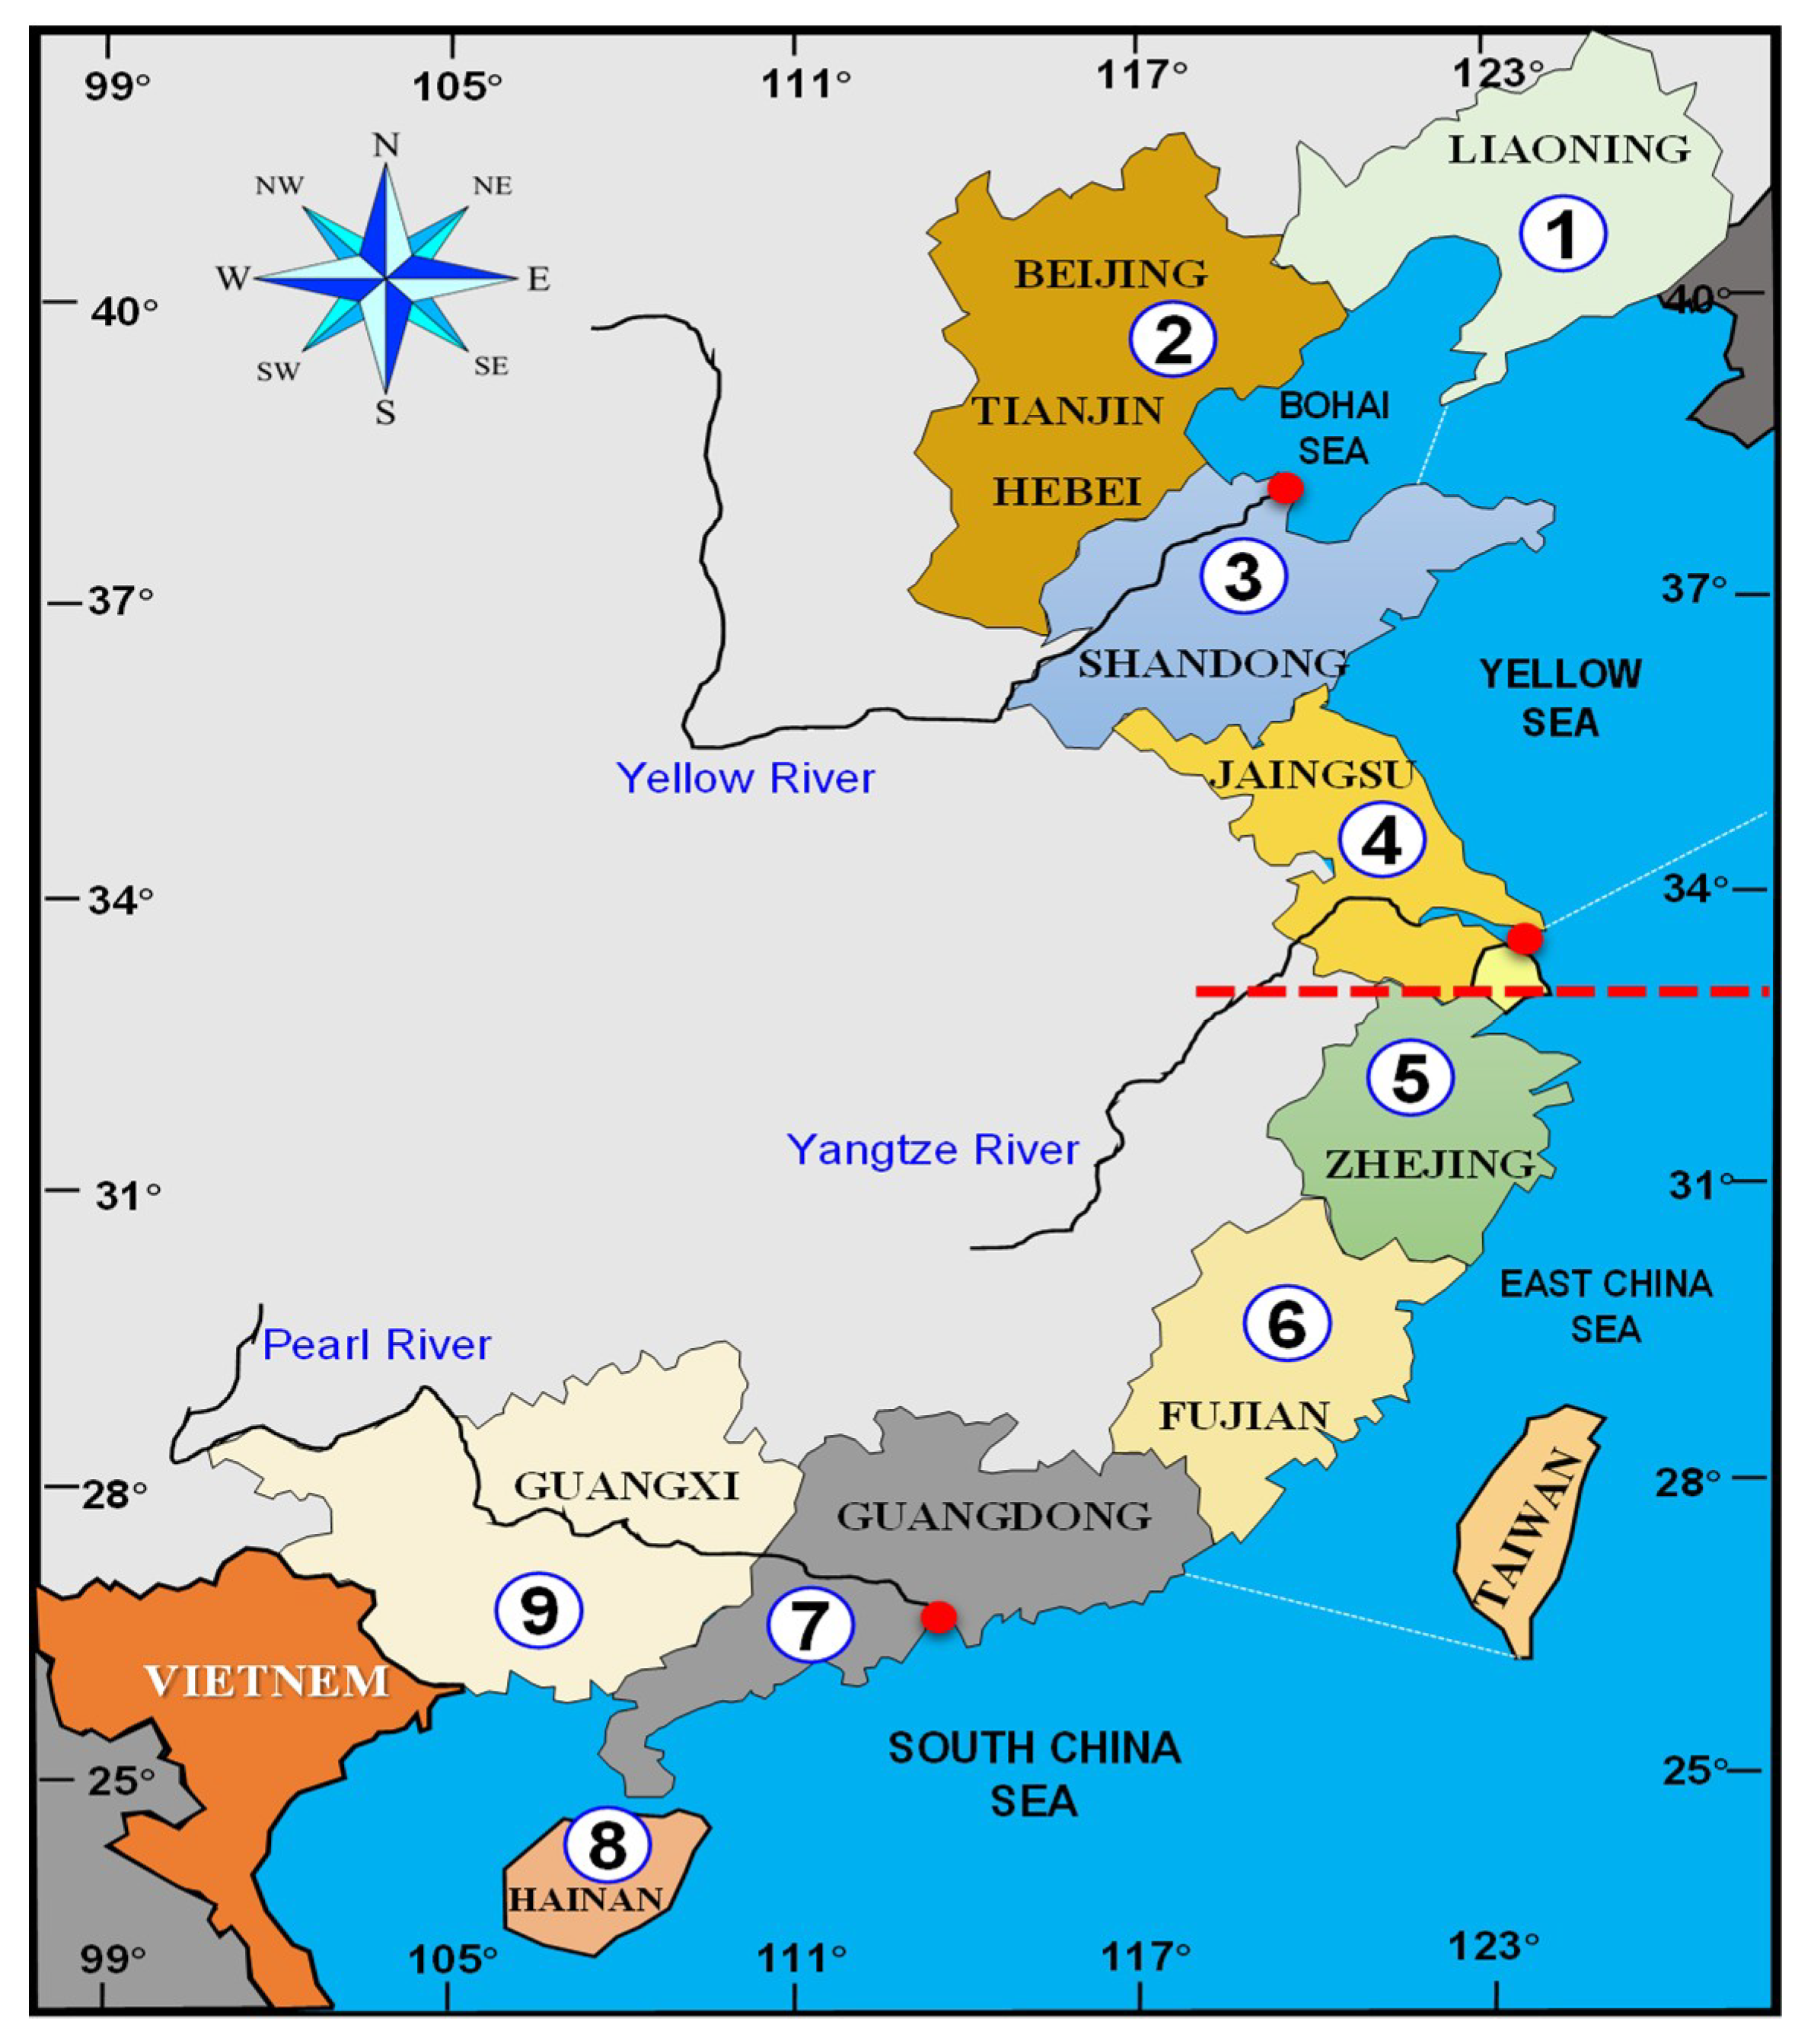
The study area is the mainland coast of China, which consists of eight provincial coastal sectors in the Bohai Sea, Yellow Sea, East China Sea, and South China Sea (see Figure 1). In addition, one provincial Island of Hainan (8) is also included in this study. In considering the geomorphic characteristics of the coastline, Hangzhou Bay, which is located on the dashed red line in Figure 1, divides the mainland coastline into two geomorphic regions: southern and northern. In the northern region of the coast, some of the high mountains and hills and the Shandong Peninsula extend to the coastal zone, but most of them are very flat and low-lying (e.g., the Yangtze River Delta region) with an average level of 2–5 m above mean sea level (MSL) and are protected by seawalls or embankments. In the southern region of the coast, the coastline is more irregular, rocky and steep, more than half of the southern coastline being predominantly rocky, and most of the remainder is sandy and muddy. The provincial coastal sector of Shandong (3) has more sandy beaches than the other coastal sectors.
Astronomic tides on the coast of China are variable in type and amplitude [14]. Tides in the Bohai Sea are predominantly semidiurnal although they are also irregular semidiurnal or irregular diurnal in several coastal regions, while tides in the Yellow Sea and East China Sea are mainly semidiurnal with a large and variable tidal range. In the South China Sea, tides are more complex, varying from diurnal to semidiurnal. The spring tidal ranges (Ω = 2.5–5 m) in the middle coastal sectors of (4)–(6) are higher than those (Ω < 2 m) in the other coastal sectors of (1)–(3) and (7)–(9) [15].
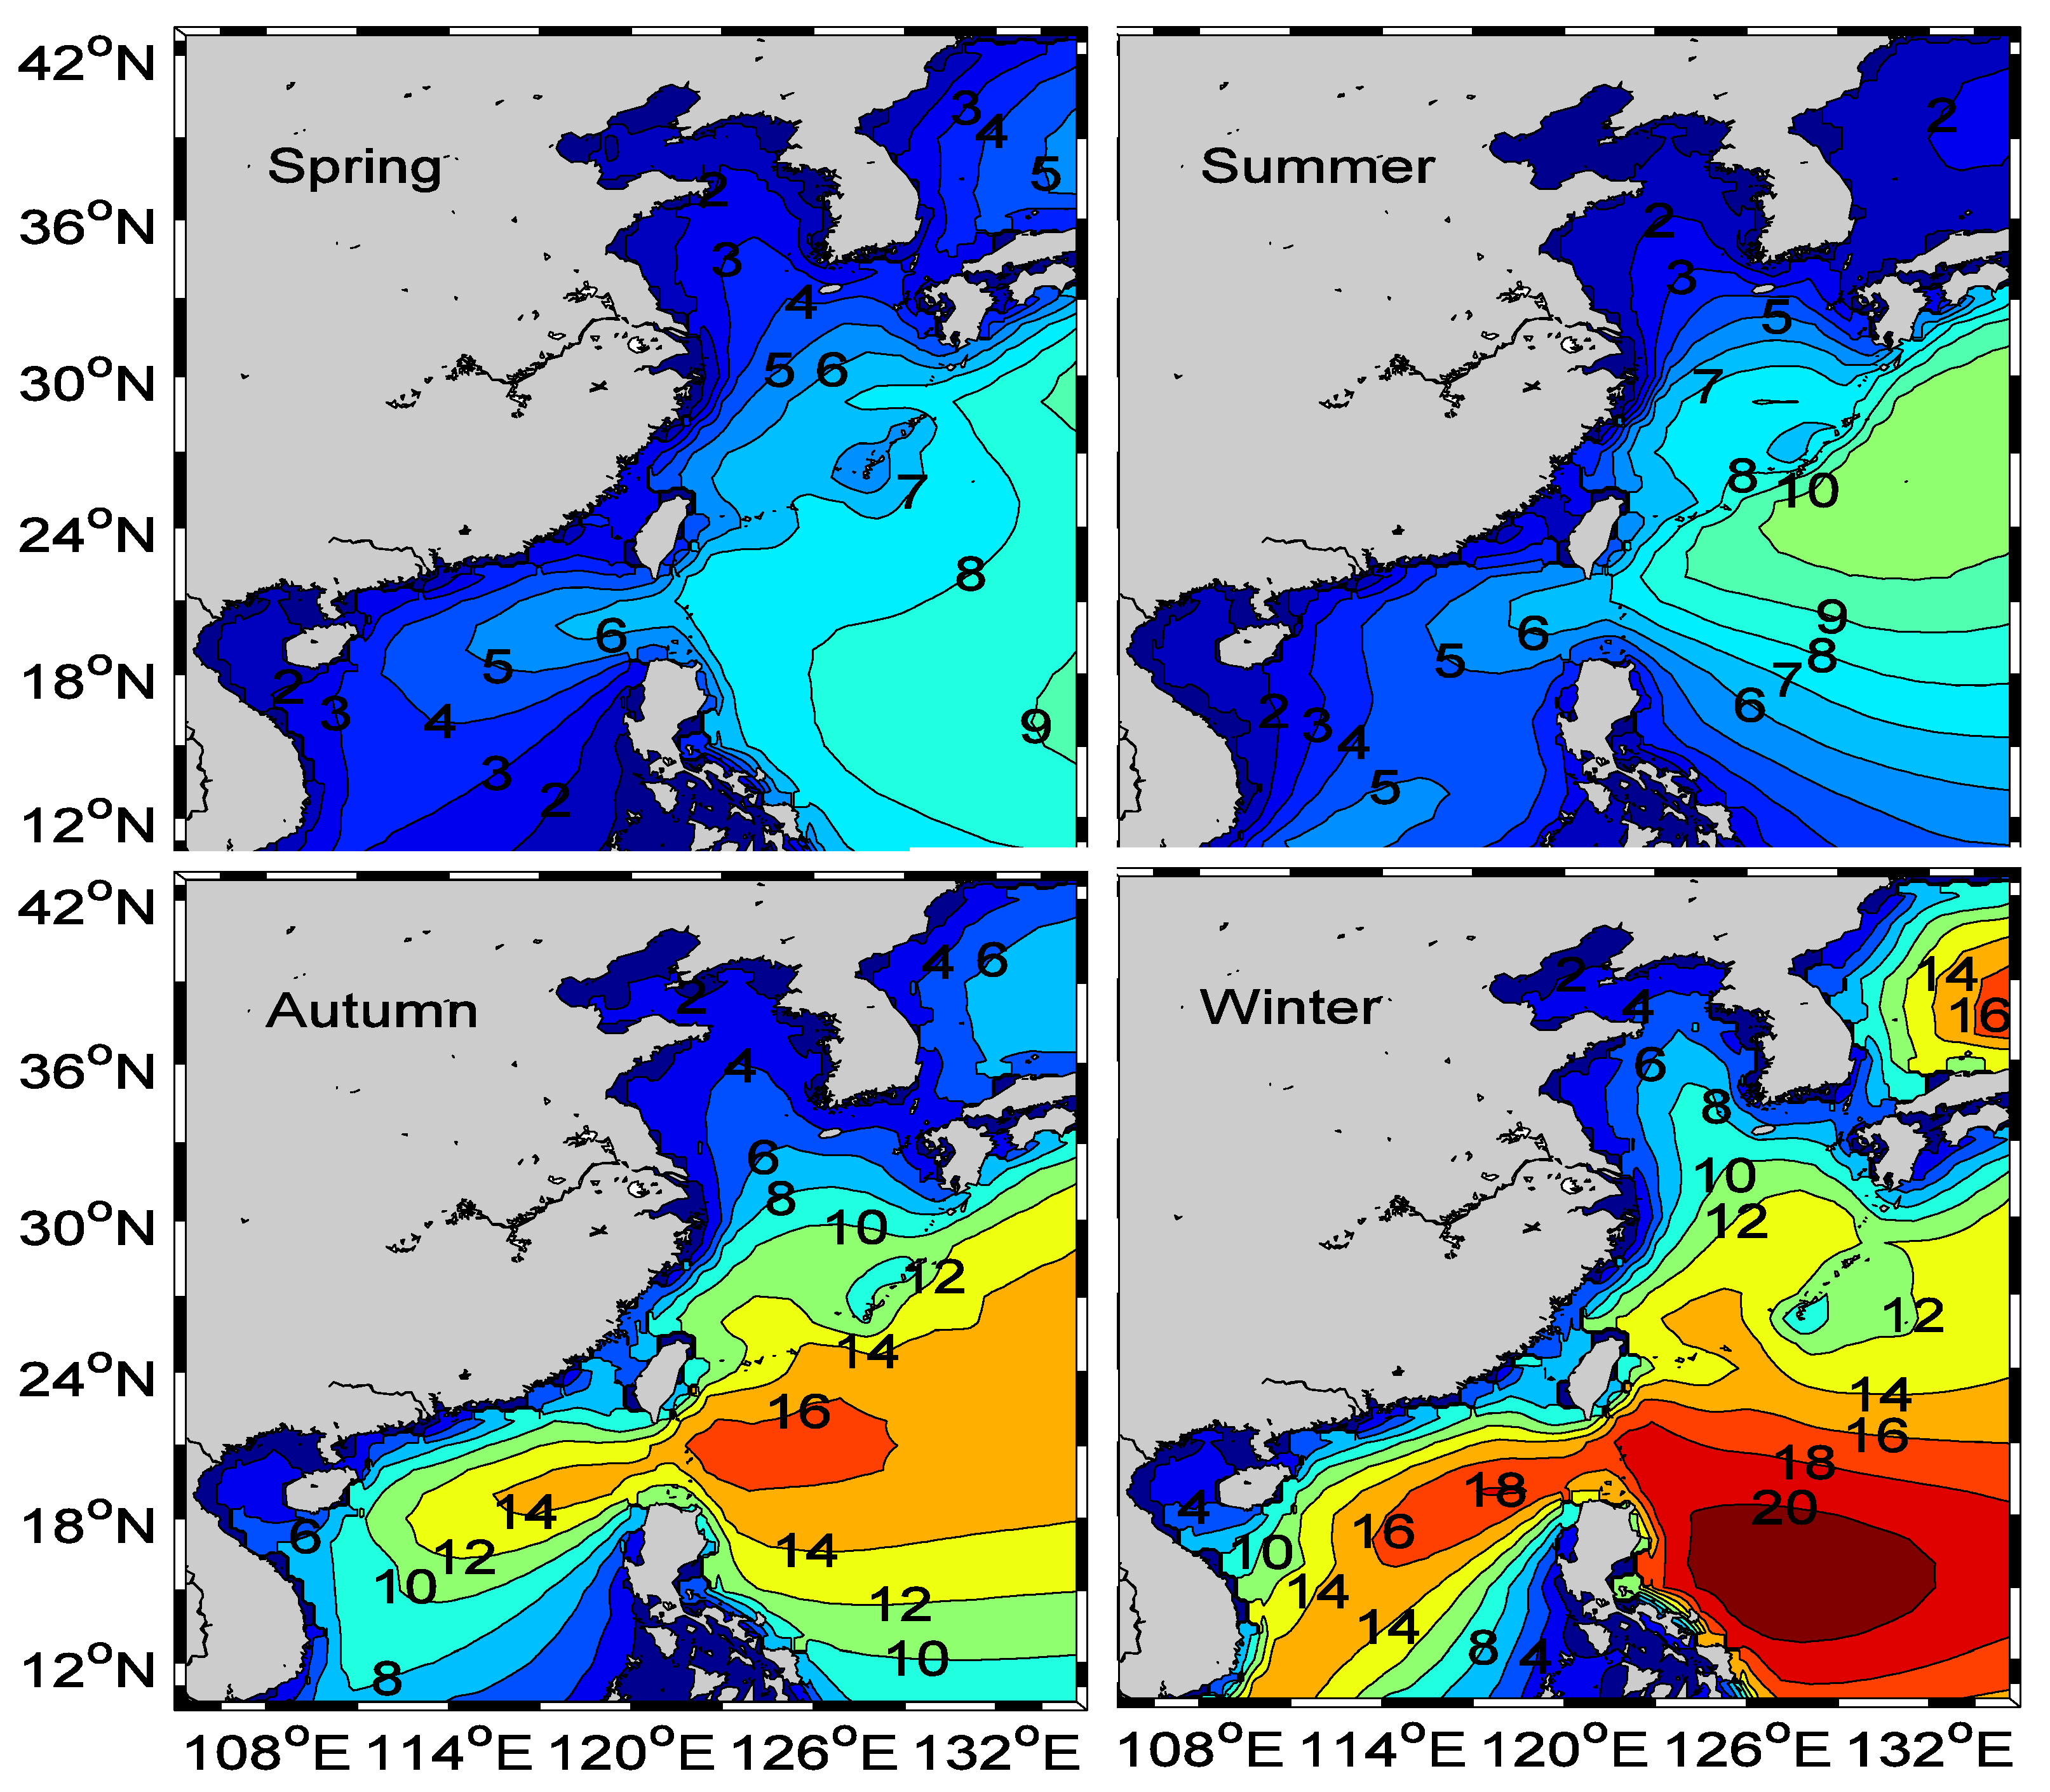
Wave patterns on the coast of China are determined by monsoon wind patterns, wind blowing fetch, and swell penetration. In general, northerly coastal waves prevail in the winter, moving progressively southwards from the Yellow Sea and spanning the entire mainland coast of China; southerly coastal waves are dominant in the summer, moving northward from the South China Sea, and there are no prevailing waves when wind directions are variable during monsoon transitional periods [14]. Significant wave heights and periods (Hs = 1.0–1.2 m, Ts = 5–7 s) in the southern coastal sectors of (5)–(8) are generally larger than those (Hs < 1 m, Ts < 4 s) in the other coastal sectors of (1)–(4) and (9) [16].
TCs on the coast of China generally develop from the north-western Pacific, and there are about 6–10 landfall TCs in a typical year, with one to two additional bypassing storms coming close enough to the coast of China to cause significant damage [17], e.g., three extreme storms in 1956, 1969, and 1994 resulted in more than 7400 human casualties. The historical best-track typhoon datasets are maintained by the Tropical Cyclone Data Centre in the China Meteorological Administration, which provides six-hourly typhoon locations and intensities [18].

3. Main Coastal Hazards and Analysis

3.1. Coastal Hazard Data

The coastal hazard data have been collected on the coast of China by the State Oceanic Administration of China (SOA) since 1989. There are six types of main coastal hazards investigated, namely storm surges, large waves, algal blooms, sea ice, oil spill, and coastal erosion. The hazard data are about hazard-caused losses to the coastal economy and the loss of human lives on the coast of China from 1989 to 2017.
There are four sets of the more recent coastal hazard data used for this study collected by SOA: (1) historical data on annual losses to the national coastal economy and human losses (1989–2017); (2) spatial data on annual losses to the provincial coastal economy and human losses (2008–2016); (3) historical data on annual losses to the national coastal economy caused by different types of coastal hazards (2001–2014); and (4) historical data on annual losses of human lives due to storm surges and large waves (2001–2016). These datasets are published annually in the Oceanic Disaster Bulletin Annual Report by SOA. In the coastal hazard data used in this study, the direct losses to the coastal economy and human losses are caused only by the first five coastal hazards discussed above, while the direct economic losses caused by coastal erosion can’t be assessed in this study as there are no long-term data available.

3.2. Historical Variation of National Economic Losses

The long-term variation of annual direct economic losses for the entire coast of China, which was caused by all five types of coastal hazards, is shown in Figure 2A, where historical inflation has been considered. The inflation rate in China is taken from the National Bureau of Statistics of China, and all hazard-caused economic losses in different years of the hazard data are converted to the values relative to the most recent year 2017. The long-term average of annual direct economic losses is about US $2.6 billion/year from 1989 to 2017. Four most severe economic losses greater than US $5 billion occurred in 1994, 1996, 1997, and 2005, of which three of them occurred in a four-year period. Although the hazard-caused economic losses have been shown to decrease since 2005, they remain quite high, i.e., above US $700 million every year.
The long-term variation of annual human casualties caused by all five types of coastal hazards is also presented in Figure 2B. The loss of human lives, which is averaged from 1989 to 2017, is about 240 persons per year. The highest number of human casualties, which is more than 500 human deaths, occurs in 1989, 1994, 1996, and 1999. Especially in 1994, when there were 1248 human casualties caused by TCs. Since 2006, the number of annual human casualties is shown to have reduced greatly, but still remains quite high, i.e., above 20 deaths per year.

3.3. Spatial Variation of Provincial Economic Losses

The mainland coast of China consists of eight provincial coastal sectors (see Figure 1); one provincial island of Hainan (8) is also considered in this study. On the basis of the available coastal hazard data (2008–2016) on the annual provincial coastal economic losses, Figure 3A shows the spatial variation of annual provincial coastal economic losses from the first coastal sector of Liaoning (1) in the far north to the last coastal sector of Guangxi (9) in the far south. The direct economic losses in Figure 3A are seen to increase from the north to south and peak in the southern coastal sector (7). The coastal sector of Guangxi (9) is well protected by Hainan Island (8). The most severely affected coastal provinces are identified and ranked as Guangzhou (7), Fujian (6), Zhejiang (5), Jiangsu (4), and Hainan (9) based on the criterion of economic losses.
Similarly, the spatial variation of annual provincial human casualties from the north to south is shown in Figure 3B, which is consistent with the distribution of annual direct economic losses in Figure 3A. The coastal sector of Hainan Island (8), which is more exposed to TCs, has more human casualties, but Hainan Island, which is less developed than the eight mainland coastal provinces, is expected to have lower hazard-caused economic losses. The coastal sector of Guangxi (9) is well protected by Hainan Island, resulting in much lower human casualties in comparison with the other coastal sectors.
On the basis of both Figure 3A,B, the most severely affected coastal provinces may be ranked as Guangzhou (7), Fujian (6), Zhejiang (5), Hainan (9), and Jiangsu (4) in terms of both the losses of coastal economy and human lives. The hazard-induced losses on the coast of China are shown to generally increase from the north to south and peak in the coastal sector (7).

3.4. Analysis of Economic Losses due to Storm Surges

The coastal hazard data on economic losses have also been collected for each type of five coastal hazards, namely, storm surges, sea ice, algal blooms, large waves, and oil spills from 2001 to 2014. The sea ice hazard was found only in the Bohai Sea of the coastal sectors (1)–(2), while the algal bloom hazard generally occurred off all eight mainland coastal sectors. Figure 4 shows the hazard impact intensity (HII) of the five coastal hazards, which is defined as the ratio of economic loss by one hazard to total economic losses by all the five hazards, see Figure 4.
It can be seen from Figure 4 that the storm surge hazard has the highest HII value, resulting in 88% of the total hazard-caused economic losses, while the other four coastal hazards only account for a small portion of 12%, i.e., sea ice 7.3%, algal blooms 2.7%, large waves 2%, and oil spill 0.1%. Therefore, the storm surge hazard is the most dominant one on the coast of China.
The direct losses to the coastal economy caused by storm surges are also significantly affected by astronomic tides. A storm tide R s t , which is the combination of a storm surge and an astronomic tide, is expected to have a greater impact on the coast of China when a storm surge coincides with a high tide rather than a low tide. Figure 5 shows the spatial variations of high spring tidal levels and spring tidal ranges, which were averaged from a wide range of tidal data that were collected by numerous coastal tide gauges deployed along the coast of China [15]. The mean spring tidal range in the middle coastal sectors of Jiangsu (4), Zhejiang (5), and Fujian (6) are shown to be larger (Ω = 2.5–5 m) than in the other coastal sectors; the storm tide hazard is expected to cause more damage to these coastal sectors with higher tidal ranges than those with smaller tidal ranges.

3.5. Analysis of Human Casualties Due to Storm Waves

The number of human casualties caused by storm surges is also compared with those caused by storm waves in Figure 6, based on the hazard data collected from 2001 to 2016. The large wave hazard is shown to be much more hazardous than the storm surge hazard in terms of the number of human casualties, even though only 2% of the total economic losses were caused by the storm wave hazard (see Figure 4). Since 2009, the number of human casualties caused by the storm surge hazard has been shown to have reduced significantly, but the human casualties caused by large waves remain high, i.e., above 18~132 deaths per year before 2016.
As already shown in Figure 3, the losses to the coastal economy and the loss of human lives in the coastal sector of Guangdong (7), which has the smaller tidal range of Ω < 1.5 m, are seen to be much greater than those on the adjacent coastal sector of Fujian (6), which has the much larger tidal range of 2.5 m ≤ Ω < 4.5 m. This implies that in addition to the storm tide hazard, there must exist another main coastal hazard responsible for such heavy losses in the coastal sector of Guangdong. Wave energy flux P [20] is used to describe wave power and estimated as
P = ρ g 2 64 π ( H s 2 T ¯ ) 1 2 H s 2 T ¯ ,
where P is measured in kw/m, H s is the significant wave height (m), and T ¯ is the mean wave period (s). Equation (1) is also derived analytically by [16] with a new wave analysis method of wave power and zero-crossing.
The seasonal variation of wave power P on the coast of China is shown in Figure 7, where the wave data used are the 36-year ERA-Interim reanalysis wave data (1980–2015) from the European Centre for Medium-Range Weather Forecasts (ECMWF). Even though the grid resolution (0.125° × 0.125°) of the ERA-Interim wave data is coarse, the distribution trend of wave power on the coast of China can be determined [16]. In Figure 7, the wave power is shown to increase spatially from the north to south and peak in the southern coastal sector of Guangdong (7) in all seasons, but vary significantly seasonally, e.g., the wave power in winter and autumn is generally higher than in summer and spring. The wave power in the coastal sector (7) is shown to be larger than in its neighboring coastal sector of Fujian (6) with a much larger tidal range. This indicates that TC-induced high wave power on the coast of Guangdong (7) is another main driver responsible for the heavier economic and human losses.
Large storm waves can cause significant damage to the coast as they can generate huge wave forces, large oscillatory fluid velocity, and high mean water levels, while storm tides can cause coastal damage only by raising the mean water level. This may explain why storm waves have caused more human casualties than storm surges, as is partially shown in Figure 6. It is noted that the economic and human losses in Figure 5 are also affected by other factors such as provincial coastal assets, population density, coastline length, coastal bathymetry. For example, the coastal sector of Guangdong (7), which is much more developed and populated than those of Hainan Island (8) and Guangxi (9), is expected to have more economic losses even under the same coastal hazard conditions.

4. Inundation-Erosion Model

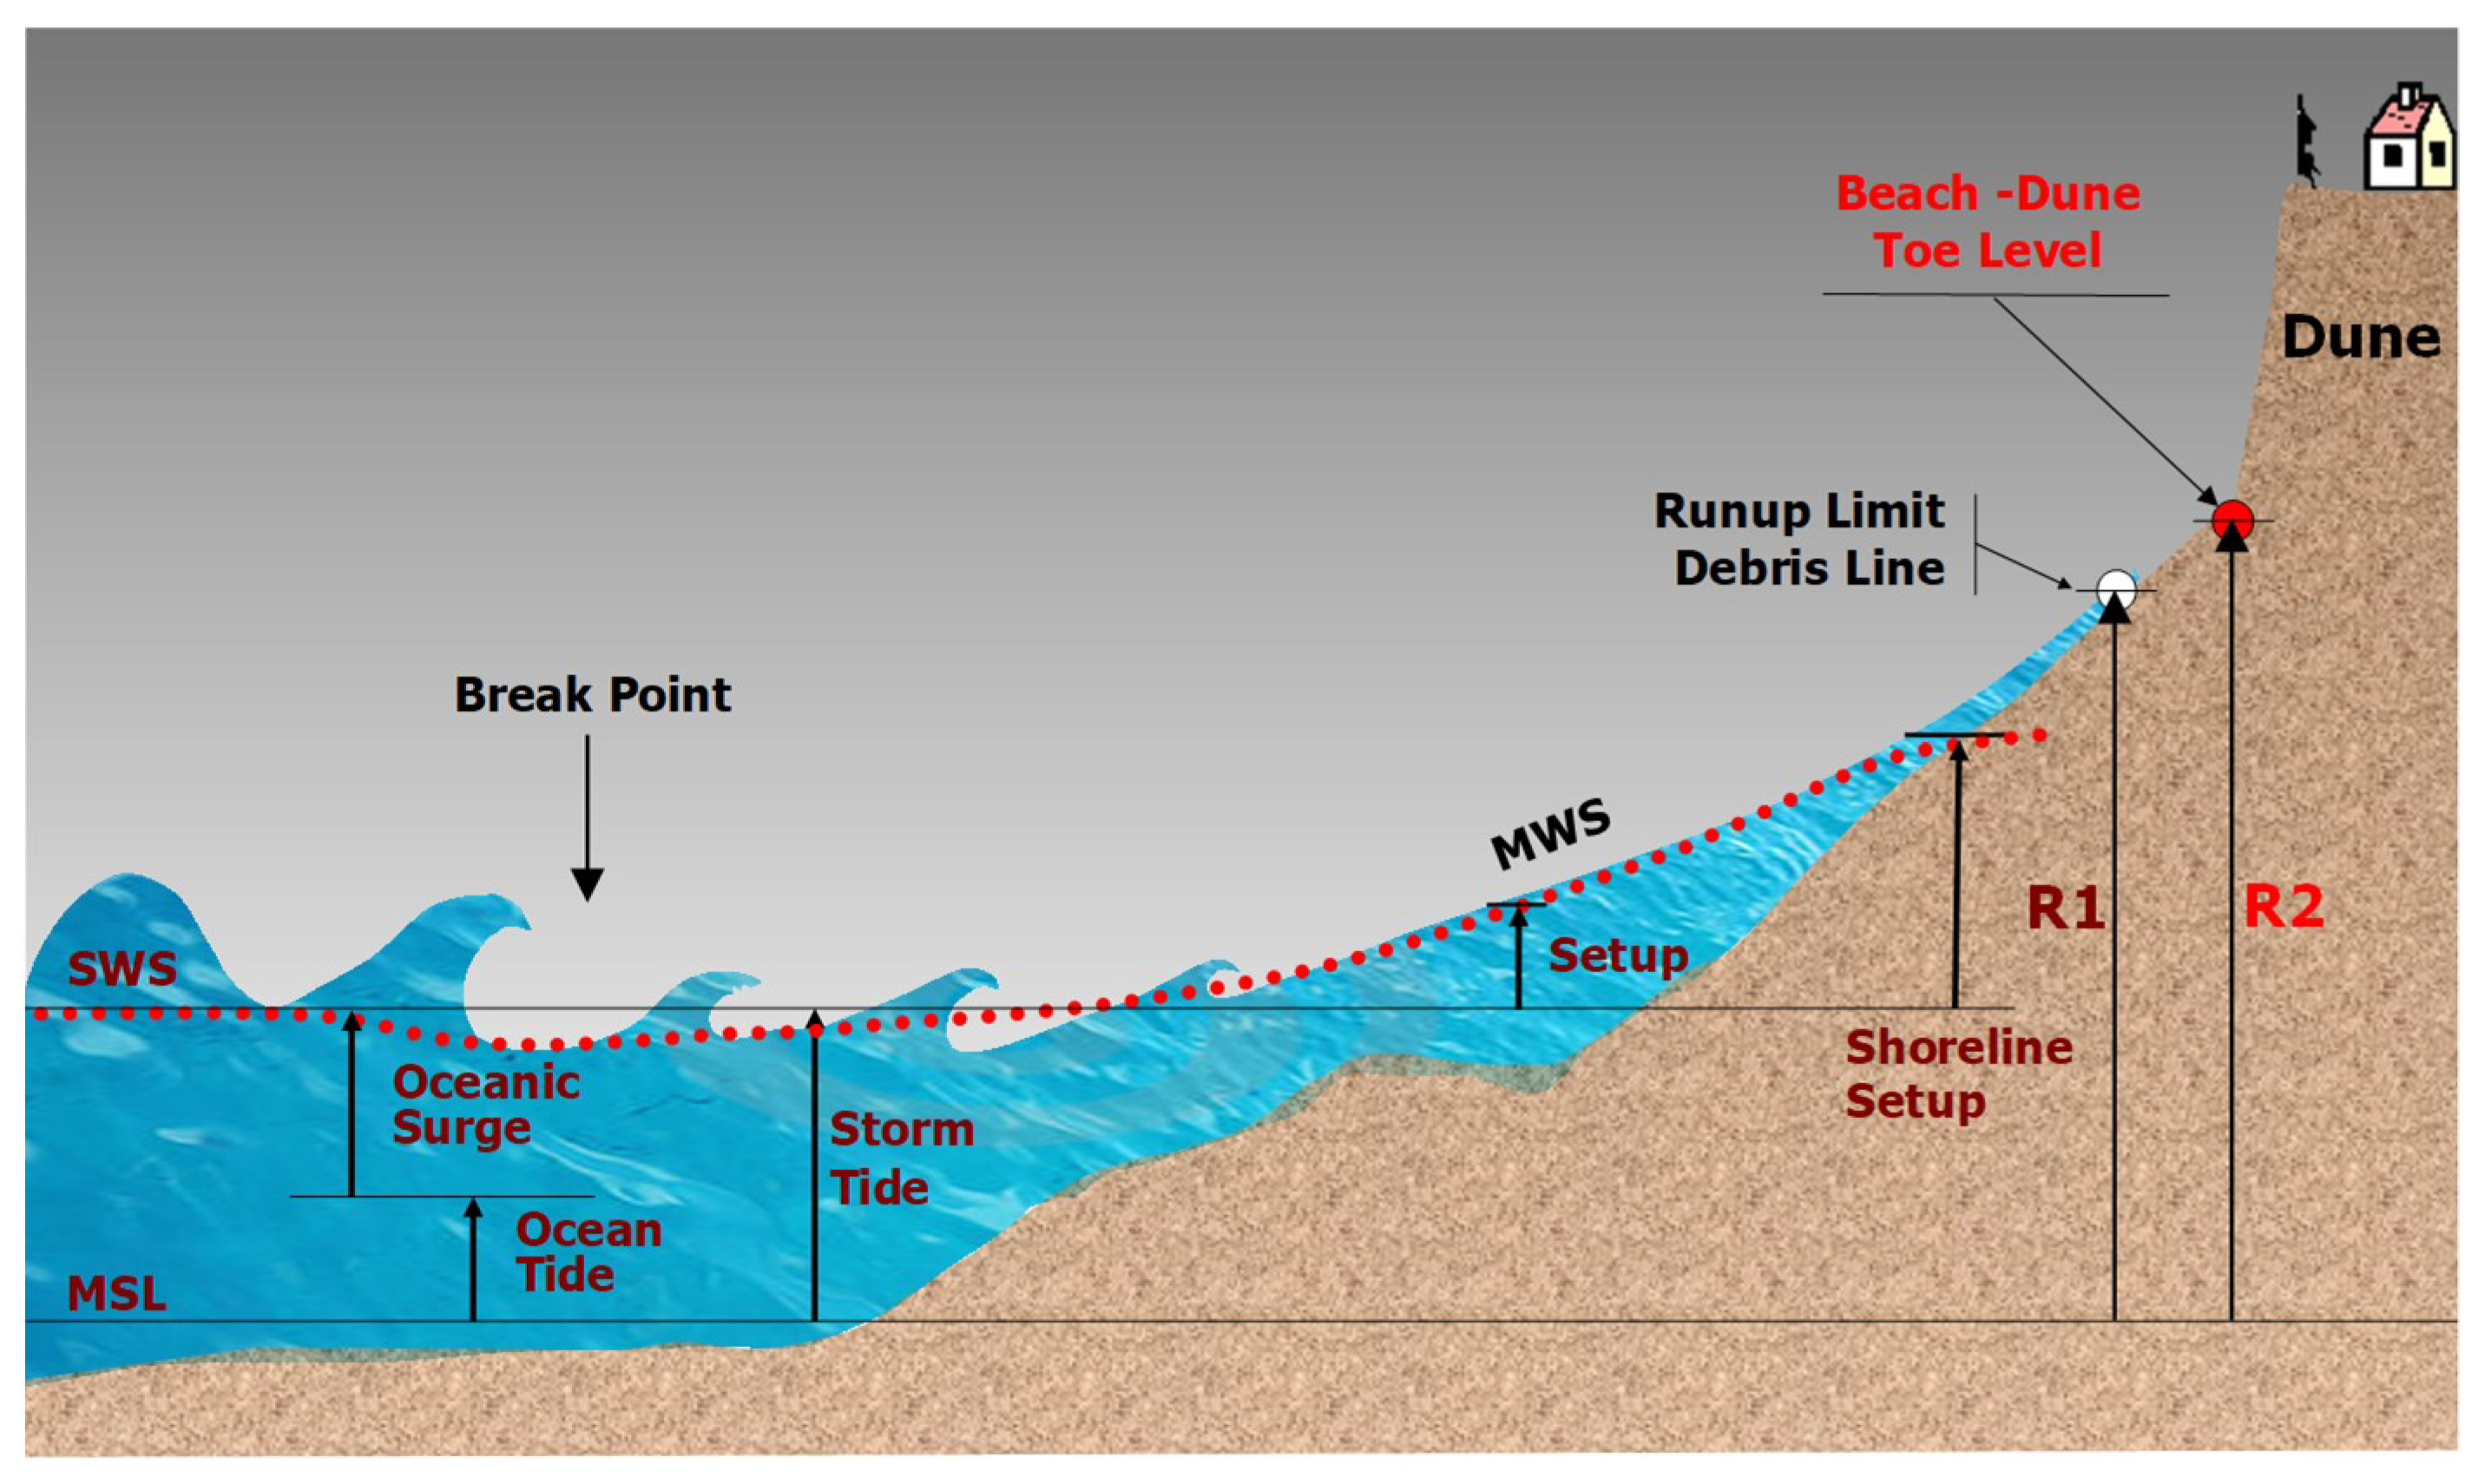
Coastal inundation and erosion hazards often occur at high storm tides during coastal storms. Storm-induced large breaking waves arrive at the beach and generate large volumes of high kinematic water that runs up onto the beach high enough to attack the beach berm and dune toe. This causes sand to be taken from the dune toe because of the down-rush mechanism in the swash zone. When the eroding dune slope becomes larger than the equilibrium dune slope, the dune front collapses and lumps of the dune sand are transported into the surf zone by the high-speed down-rush water. These physical processes continue to further erode or inundate the dune–beach system until the storm waves become smaller and the storm tides lower.
A wide range of coastal field data on beach–dune profiles and sediment grain-size distributions of more than 200 sandy beaches in Australia were collected by You et al [21]. They found that the sand dunes of their surveyed beaches were generally eroded when the dune toe elevations were less than 3.0 m above MSL. Their finding was further confirmed by the convincing field data that were collected in a 500 m test section of the long and straight Lighthouse Beach on the coast of New South Wales. The high sand dune sat on a rock platform at both the north end and the middle of the test section, while the sand dune sat on sand bed at the south end. It was observed that the dune toe at 3.16 m above MSL at the north end was well protected by dune vegetation and no erosive evidence was found, but the dune toe at 2.32 m above MSL in the middle section and the dune toe at 2.64 m above MSL at the south end of the test section were all eroded.
In this study, the simple conceptual model [21] was applied to assess both coastal inundation and erosion hazards on the coast of China:
Φ = R2 − (Rt + Rs + Rw + Rr + Rh) = R2R1,
where R2 is the dune or seawall toe level for the assessment of coastal erosion hazard or R2 is the dune or seawall top level for the assessment of coastal inundation hazard, Rt is the tidal level, Rs is the storm surge height, Rw is the wave setup height, Rr is the wave run-up height, Rh is the mean sea level (MSL), and R1 = (Rt + Rs + Rw +Rr + Rh). All parameters in Equation (2) are defined and illustrated in Figure 8. Rather than indirectly measuring different mean water level components in Equation (2) [22,23], R1 and R2 can be directly measured in the field [21,22].
The two-parameter conceptual model in Equation (2) may be used to assess: (1) coastal inundation levels R1 with different return periods, e.g., dune–beach will be inundated when the dune or seawall top level R2 is lower than the wave run-up elevation R1; (2) dune–beach stability, e.g., dune–beach system will be unstable when R1 > R2; and (3) shoreline setback horizontal distance ∆X when R1 > R2, and ∆X can be directly derived from Equation (3) as
Δ X = Δ Z t a n β = R 1 R 2 t a n β ,
where ∆z = (R1R2) and tanβ is the mean beach slope above mean water level. Equation (3) is similar to the Buun Rule [25], but it also considers small timescales of mean water level components such as storm tide and wave-elevated mean water levels. Therefore, Equation (3) may be considered as a more general model than the Buun Rule for the estimation of shoreline setback distance.
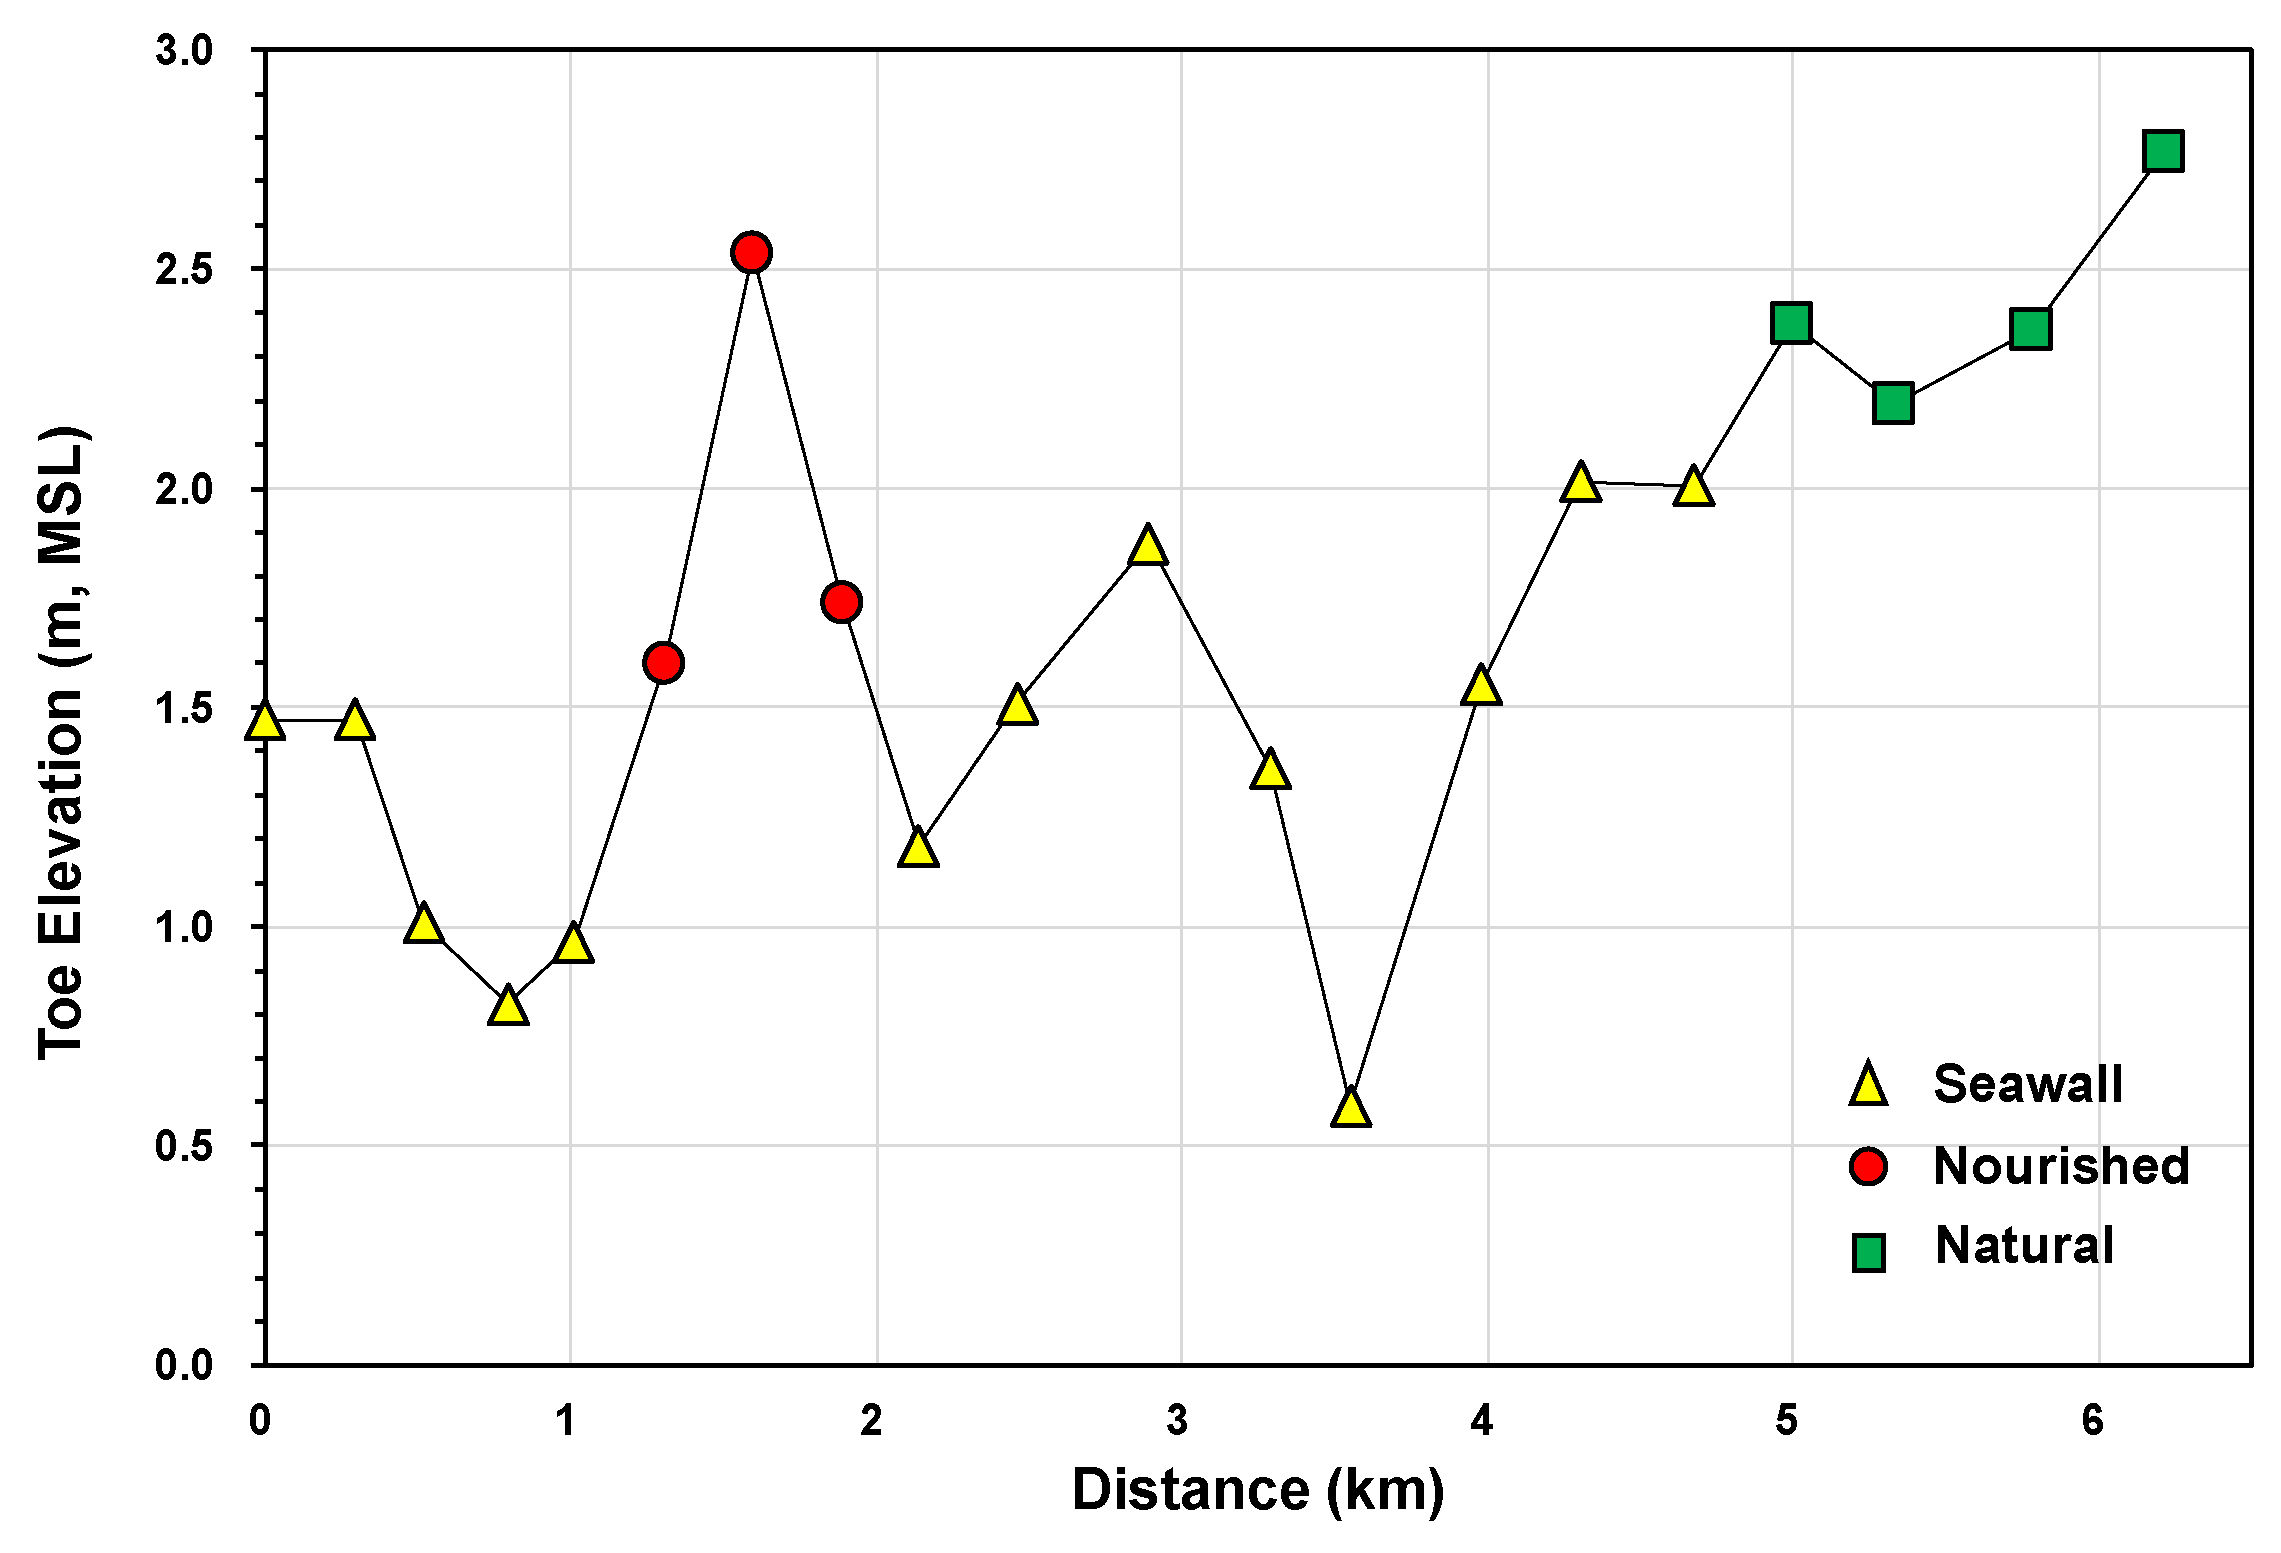
As an example, the conceptual model in Equation (2) was applied to assess the dune–beach stability of Yantai Beach in the coastal sector of Shandong (3). Yantai Beach is a 7 km long popular swimming beach, with sediment grain size of d50 = 0.2–0.25 mm. Most of Yantai Beach is protected by vertical seawalls, one swimming section is artificially nourished to overcome beach erosion problems, and the last beach section is generally stable with a natural sand dune. The nearshore tides are regular semidiurnal with a tidal range of 1.64 m. Figure 9 shows the spatial variation of dune or seawall toe elevation along the 7 km beach, which is averaged from the field data collected monthly from December 2017 to December 2018. The seawall toe elevations are shown to be R2 ≤ 2 m, and some are even lower than the high tide levels resulting in beach inundation. The nourished beach section with dune toe elevations of 1.6 m ≤ R2 < 2.6 m was found to have some erosion problems, while the stable beach section has the dune toe elevations of 2.3 m ≤ R2 < 2.8 m. The mean dune toe elevation of the stable beach section is estimated to be R2 = 2.7 m, which is averaged from all data points collected monthly from December 2017 to December 2018. The estimated value of R2 = 2.7 m in this study is slightly lower than R2 = 3.0–3.5 m proposed [21]. This difference may have resulted from inaccurate MSL datum, the limited field data used, or different dynamical drivers.

5. Conclusions

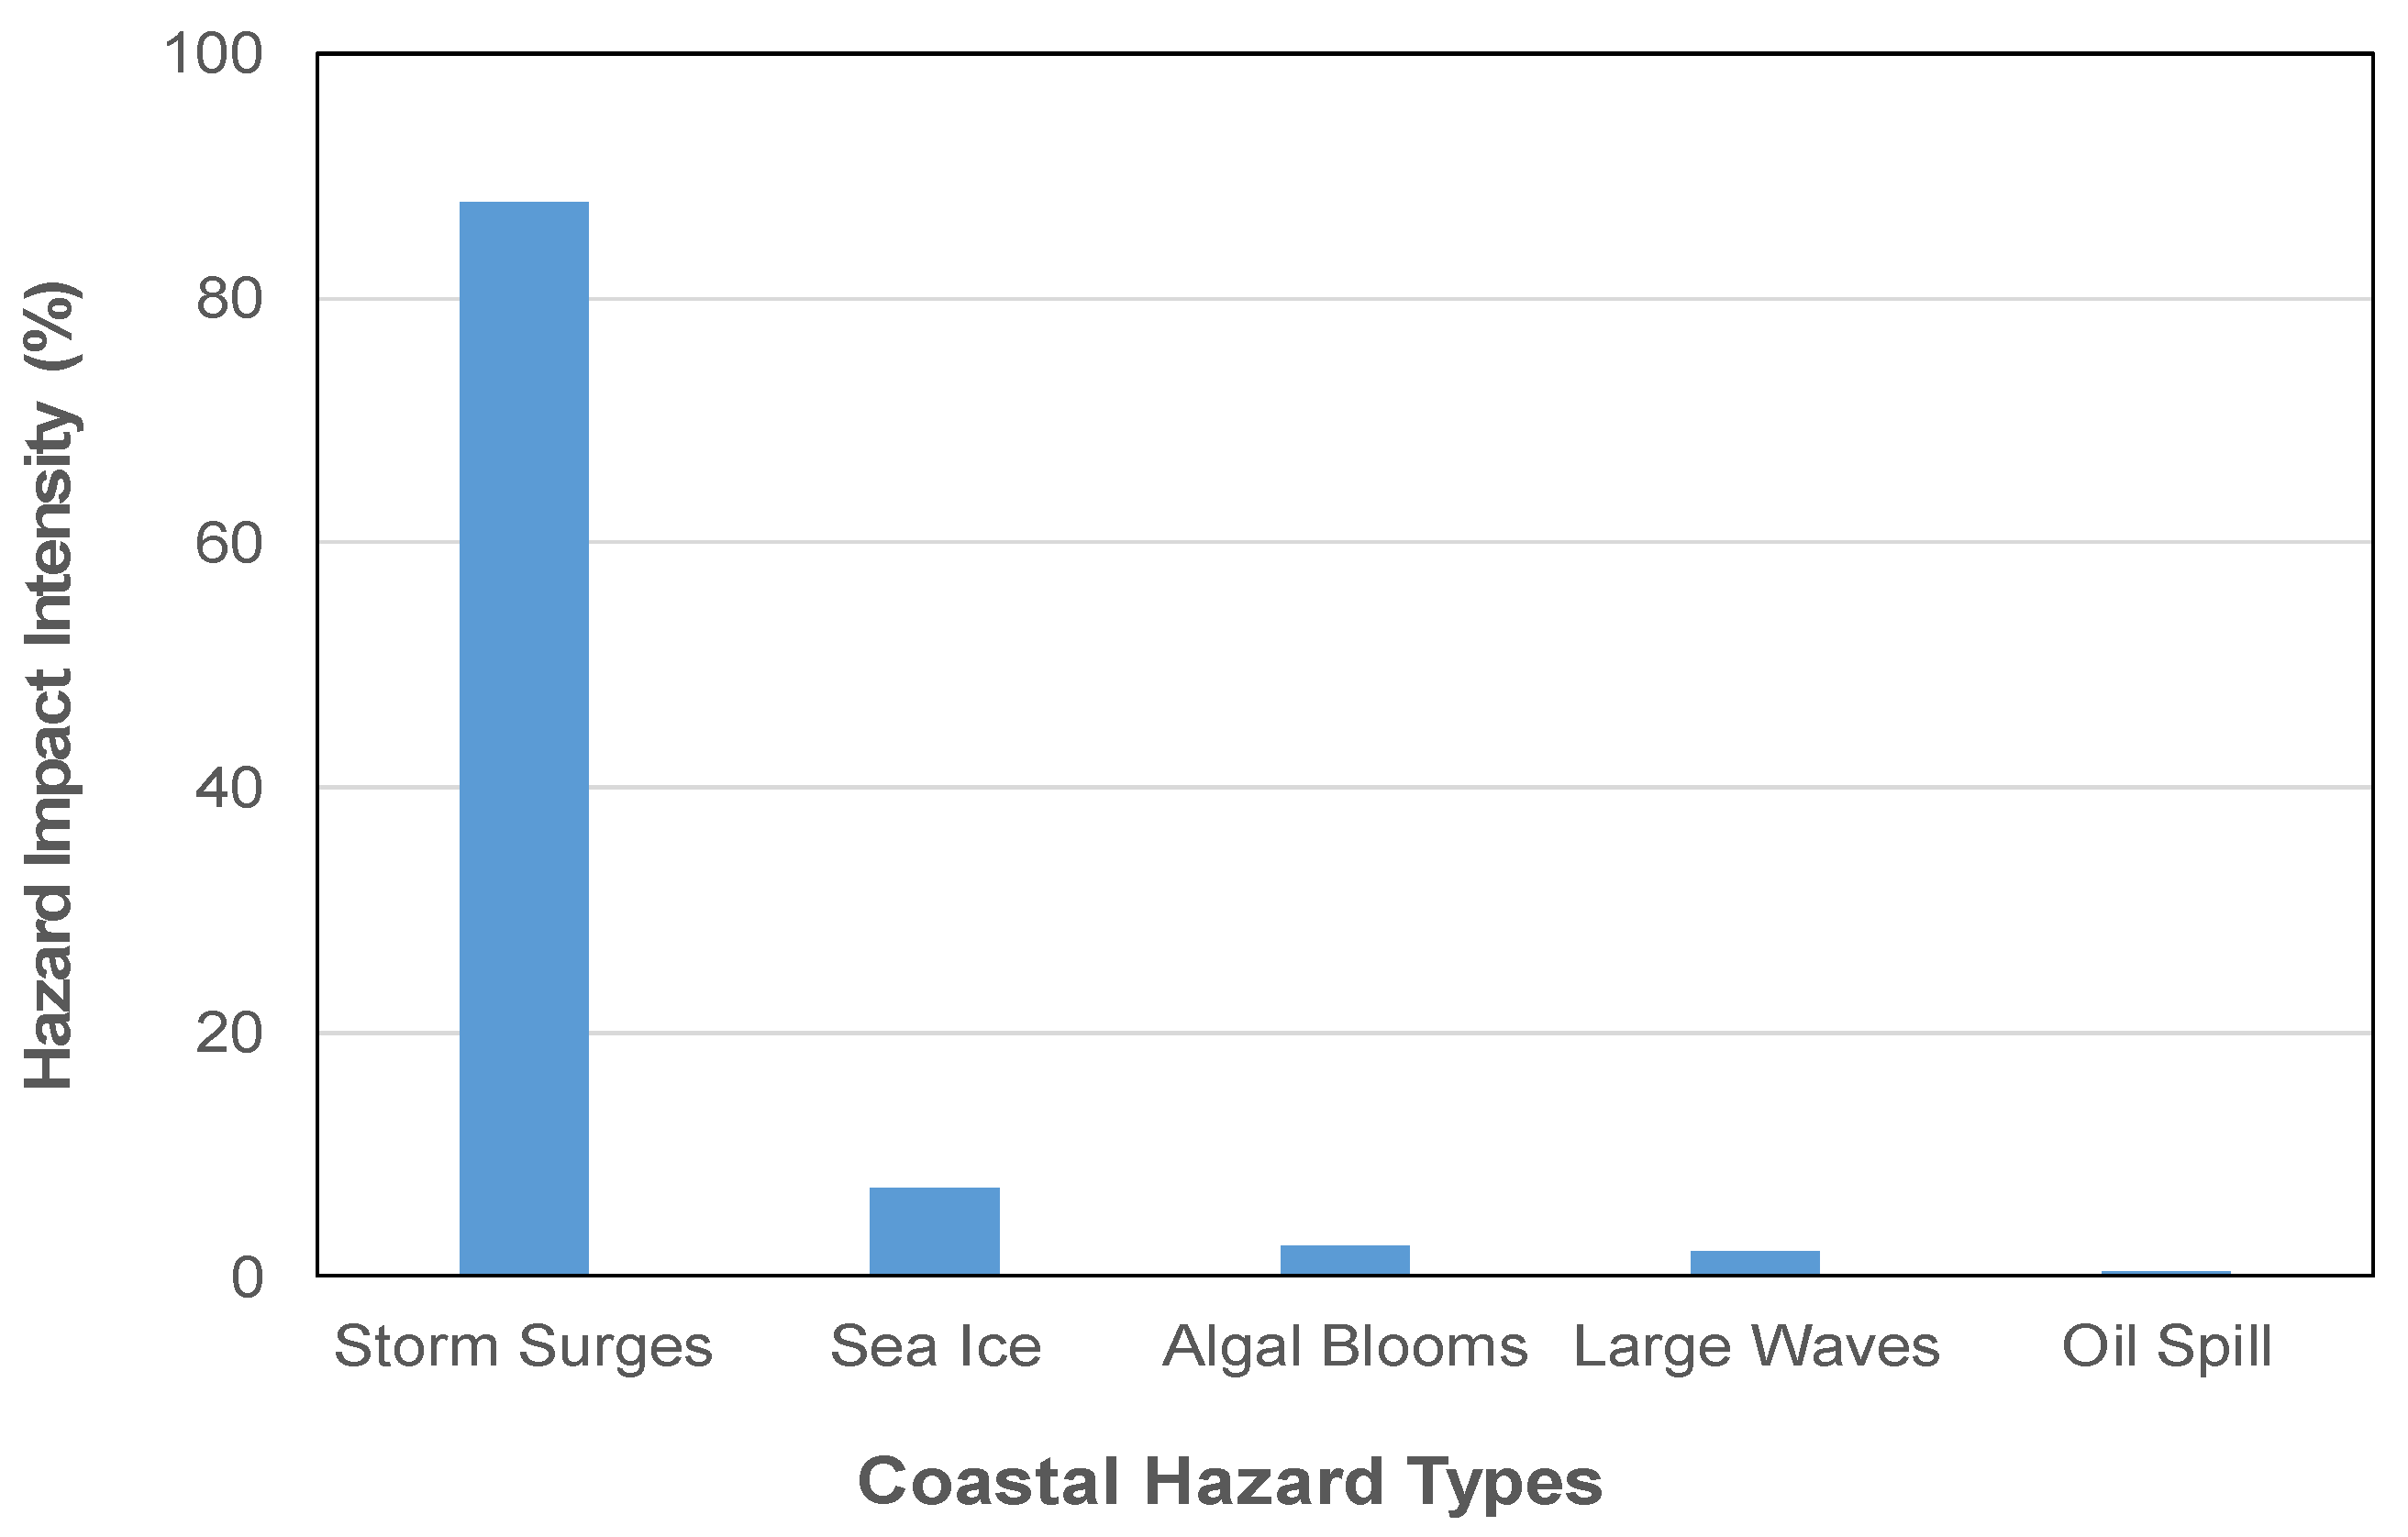
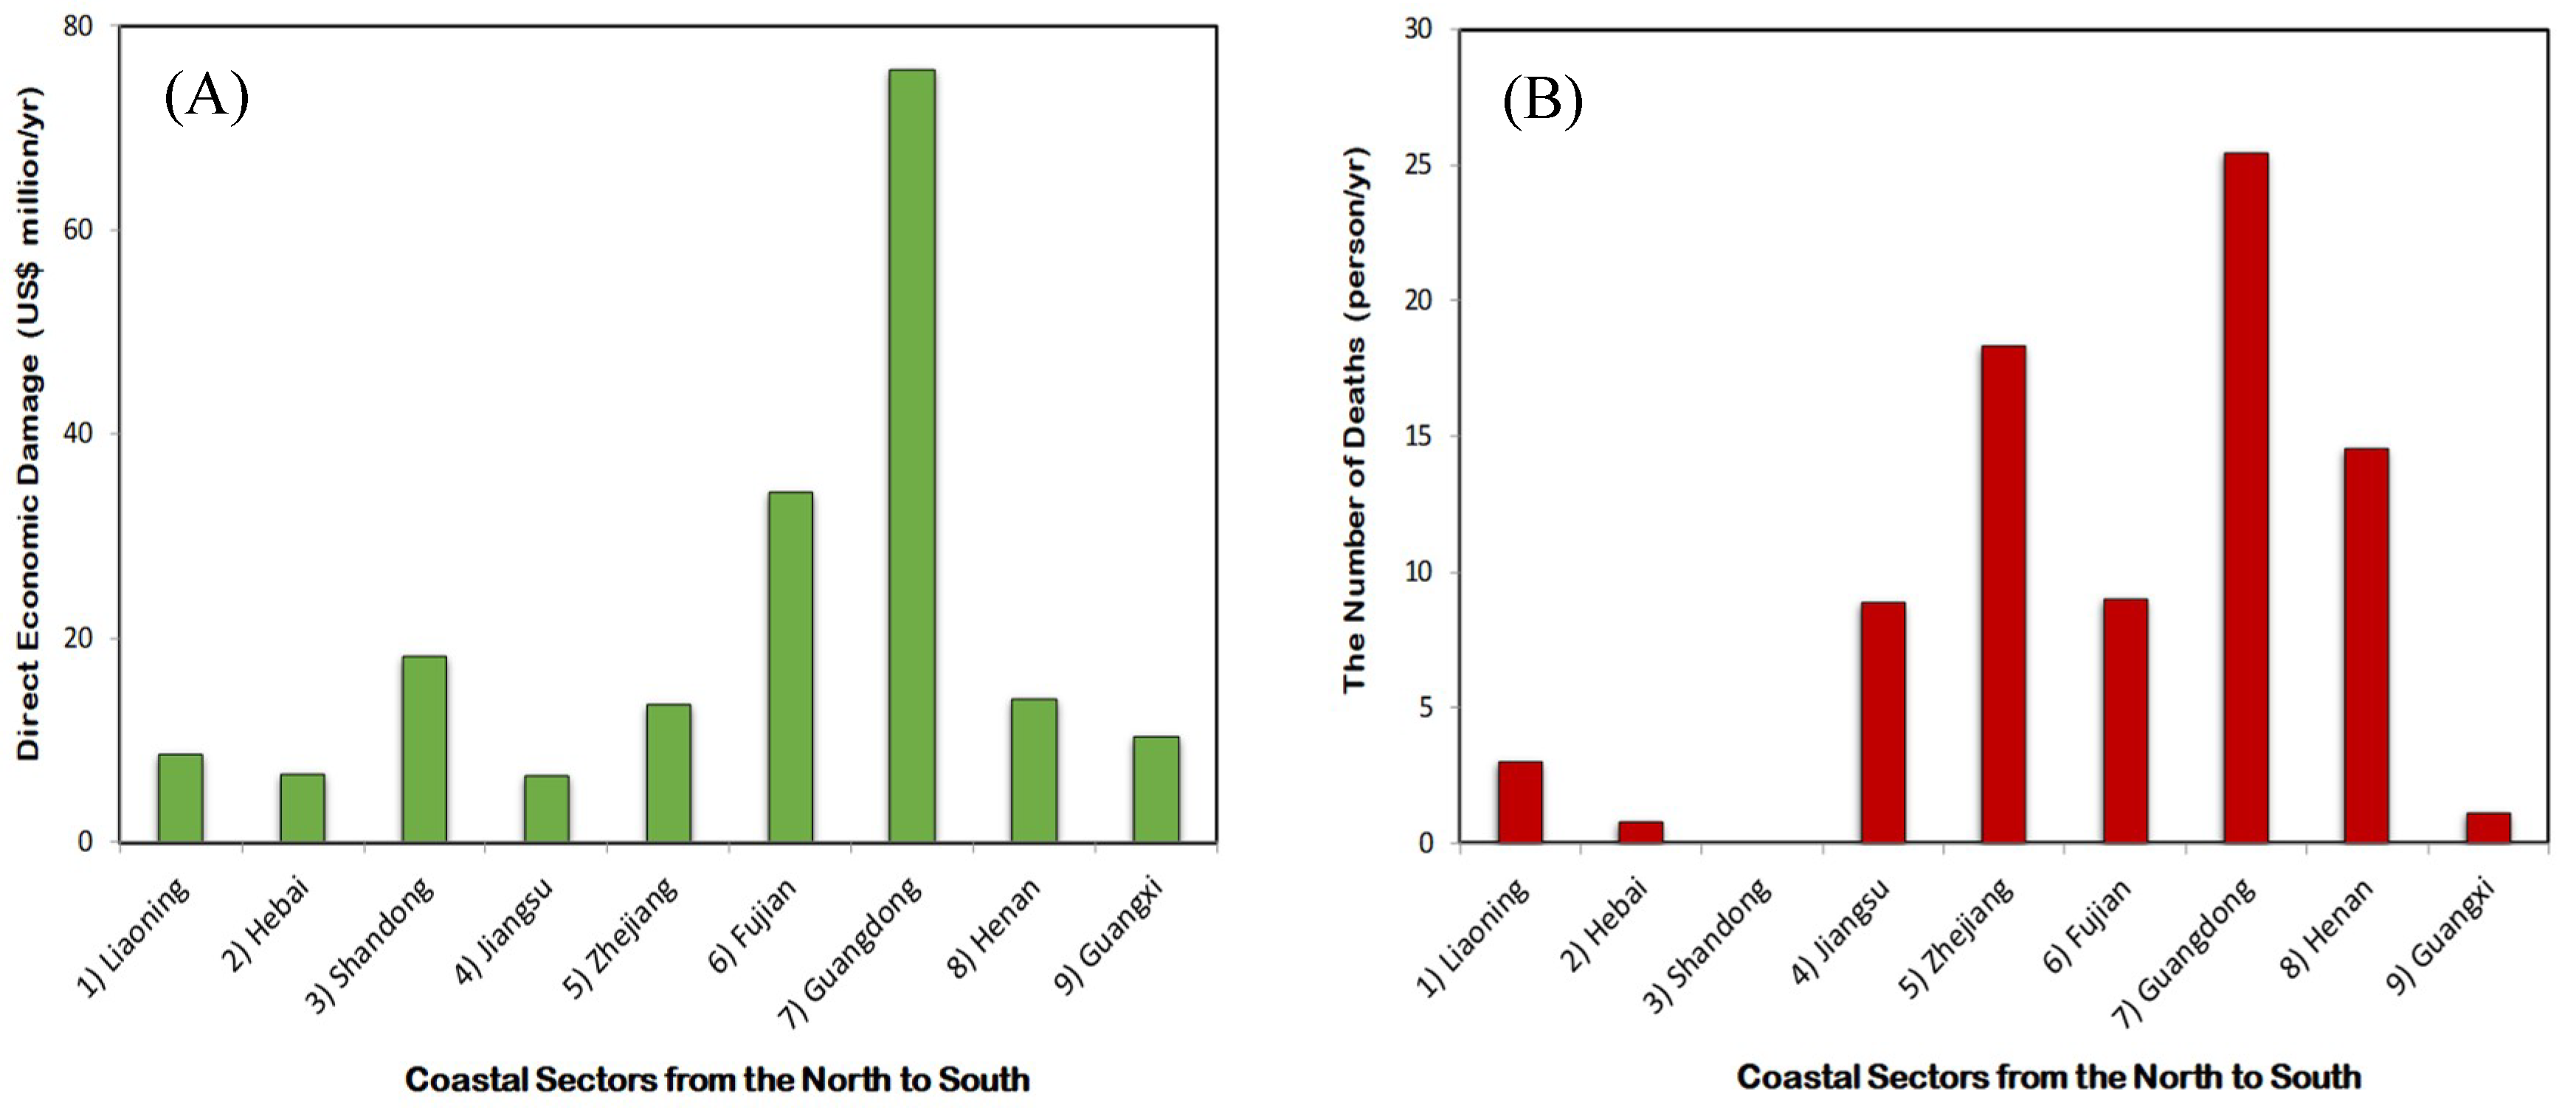
Over recent years, the coast of China has been periodically struck by tropical cyclones at a higher intensity; the globally averaged intensity of TCs is projected to continue to shift toward stronger storms with an expected increase of 2% to 11% by 2100. TC-induced coastal hazards on the coast of China have resulted in heavy human losses and large losses to the Chinese coastal economy. TC-induced storm surges are found to be responsible for 88% of the total hazard-caused coastal economic losses (US $2.6 billion/year) on the mainland coast of China, while TC-induced large coastal waves together with storm surges have caused heavy human losses (264 deaths/year). The hazard-caused losses to the coastal economy and the human losses are shown to spatially increase from the north to south, peak at the coastal sector of Guangdong (7), and well correlate to coastal wave power especially in the southern coastal sectors of Zhejiang (5), Fujian (6), and Guangdong (7). The hazard-caused losses to the coastal economy and the human casualties estimated in this study with the most recent hazard data are generally consistent with those of You et al [19]. The simple two-parameter conceptual model (Equation (2) together with Equation (3)), which has not yet been testified by You et al [19] with available field data, generally agrees with the R2 field data collected on the beach of Yantai in China, and therefore may be considered as a more general model than Bruun Rule for the assessment of coastal inundation and erosion hazards with different return periods. Further field studies on the parameters R1 and R2 are urgently needed.

Funding

This study has been financially supported by the Major Research Grant (Ref No: U1806227) from the Natural Science Foundation of China (NSFC) and the Provincial Natural Science Foundation of Shandong.

Conflicts of Interest

The founding body has no role in the design of the study, in the collection, analyses, or interpretation of the data used for this study, in the writing of the manuscript, and in the decision to publish the results. The author declares no conflict of interest.

References

  1. Chen, J.Y. The impact of sea level rise on China’s coastal areas and its disaster hazard evaluation. J. Coast. Res. 1997, 13, 925–930. [Google Scholar]
  2. Sousounis, P.J.; He, H.; Healy, M.L.; Jain, V.K.; Jung, G.; Qu, Y.; Shen, T.B. A Typhoon Loss Estimation Model for China. In Proceedings of the 88th Annual American Meteorological Society Meeting, New Orleans, LA, USA, 20–24 January 2008. [Google Scholar]
  3. Elsner, J.B.; Kossin, J.P.; Jagger, T.H. The increasing intensity of the strongest tropical cyclones. Nature 2008, 455, 92–95. [Google Scholar] [CrossRef] [PubMed]
  4. Mei, W.; Xie, S.P. Intensification of landfalling typhoons over the northwest Pacific since the late 1970s. Nat. Geosci. 2016, 9, 753–757. [Google Scholar] [CrossRef]
  5. Knutson, T.R.; McBride, J.L.; Chan, J.; Emanuel, K.; Holland, G.; Landsea, C.; Held, I.; Kossin, J.P.; Srivastava, A.K.; Sugi, M. Tropical cyclones and climate change. Nat. Geosci. 2010, 3. [Google Scholar] [CrossRef]
  6. Needham, H.F.; Keim, B.D.; Sathiaraj, D. A review of tropical cyclone-generated storm surges: Global data sources, observations, and impacts. Rev. Geophys. 2015, 53, 545–591. [Google Scholar] [CrossRef] [Green Version]
  7. Yin, J.; Yin, Z.; Wang, J.; Xu, S. National assessment of coastal vulnerability to sea-level rise for the Chinese coast. J. Coast. Conserv. 2012, 16, 123–133. [Google Scholar] [CrossRef]
  8. Feng, X.; Tsimplis, M.N. Sea level extremes at the coasts of China. J. Geophys. Res. Oceans 2014, 119, 1593–1608. [Google Scholar] [CrossRef] [Green Version]
  9. Le, K. An Analysis of the Recent Severe Storm Surge Disaster Events in China. In Natural Hazard; Papadopoulos, G.A., Murty, T., Venkatesh, S., Blong, R., Eds.; Springer: Dordrecht, The Netherlands, 2000. [Google Scholar]
  10. You, Z.J. Assessment of coastal inundation and erosion hazards along the coast of China. In Proceedings of the International Ocean and Polar Engineering Conference, San Francisco, CA, USA, 25–30 June 2017. [Google Scholar]
  11. Ji, Z.X. The characteristics of coastal erosion and cause of erosion. J. Nat. Disaster 1996, 5, 65–75. [Google Scholar]
  12. SOA. China Maritime Disaster Bulletin; China Ocean Press: Beijing, China, 2017. [Google Scholar]
  13. You, Z.J.; Chen, C. Physics, Biology and their Interactions. In Sediment Dynamics of Chinese Muddy Coasts and Estuaries; Wang, X., Ed.; Chapter 7: Coastal Dynamics and Sediment Resuspension in Laizhou Bay; Academic Press: Cambridge, MA, USA, 2019; pp. 123–142. ISBN 9780128119778. [Google Scholar]
  14. Wang, Y.; Aubrey, D.G. The characteristics of the China coastline. Cont. Shelf Res. 1987, 7, 329–349. [Google Scholar] [CrossRef]
  15. Fu, Y.G.; Shen, H.; Sun, W.K.; Ji, X. Computation and analysis of the non-harmonic constants of tides in China’s Sea areas. J. Ocean. Technol. 2016, 35, 79–83. [Google Scholar]
  16. You, Z.J.; Shi, H.Y.; Hu, C.; Wang, H.X. Assessment of Renewable Wave Energy Resources for a Typical Coastal Region; Technical Report No: 20160916; Ludong University: Yantai, China, 2016; p. 131. [Google Scholar]
  17. Gao, Y.; Wang, H.; Liu, G.M.; Sun, X.Y.; Fei, X.Y.; Wang, P.T.; Lv, T.T.; Xue, Z.S.; He, Y.W. Risk assessment of tropical storm surges for coastal regions of China. J. Geophys. Res. Atmos. 2014, 119, 5364–5374. [Google Scholar] [CrossRef] [Green Version]
  18. Ying, M.; Zhang, W.; Yu, H.; Lu, X.; Feng, J.; Fan, Y.; Zhu, Y.; Chen, D. An overview of the China Meteorological Administration tropical cyclone database. J. Atmos. Oceanic Technol. 2014, 31, 287–301. [Google Scholar] [CrossRef]
  19. You, Z.J.; Ji, Z.Z.; Bai, Y.C. Impacts of Storm Wave-induced Coastal Hazards on the Coast of China. J. Coast. Res. 2018, 85, 826–830. [Google Scholar] [CrossRef]
  20. Dean, R.G.; Dalrymple, R.A. Water wave mechanics for engineers and scientists. In Advanced Series on Ocean Engineering; World Scientific: Singapore, 1991; Volume 2. [Google Scholar]
  21. You, Z.J.; Laine, R.; Wiece, D.; Hanslow, D.; Baldock, T. Field measurements of beach-dune dynamic profiles and grain-size distributions to assess coastal erosion along NSW coast of Australia. In Proceedings of the 34th Conference on Coastal Engineering, Seoul, Korea, 15–20 June 2014. [Google Scholar]
  22. Hanslow, D.; Nielsen, P.; Hibbert, K. Wave setup at river entrances. In Proceedings of the International Conference on Coastal Engineering, Orlando, FL, USA, 2–6 September 1996; pp. 2244–2257. [Google Scholar]
  23. Holman, R.A.; Sallenger, A.H. Setup and swash on a natural beach. J. Geophys. Res. 1985, 90, 945–953. [Google Scholar] [CrossRef]
  24. You, Z.J.; Nielsen, P. Extreme coastal waves, ocean surges and wave runup. In Coastal Hazard Book; Charles, W.F., Ed.; Coastal Research Library 6; Springer Publisher: Berlin, Germany, 2013. [Google Scholar]
  25. Li, C.X.; Wang, P.; Fan, D.D.; Deng, B. Bruun Rule and its application to coastal zone of China. Mar. Geol. Quat. Geol. 2000, 20, 87–91. [Google Scholar]
Figure 1. The study area includes eight mainland provincial coastal sectors (1)–(7) and (9) and one island provincial coastal sector (8) in the Bohai Sea, Yellow Sea, East China Sea, and South China Sea.
Geosciences 09 00131 g001
Figure 2. Historical coastal hazard data on: (A) annual direct economic losses; and (B) human casualties caused by all coastal hazards on the entire coast of China (1989–2017).
Geosciences 09 00131 g002
Figure 3. Spatial coastal hazard data on: (A) annual direct economic losses; and (B) annual human casualties caused by all coastal hazards on the coast of China.
Geosciences 09 00131 g003
Figure 4. Hazard impact intensity of coastal hazard-caused economic losses on China’s coast.
Geosciences 09 00131 g004
Figure 5. (A) High spring tidal levels, and (B) spring tidal ranges analyzed from a number of tide gauge station datasets on the coast of China (modified from [15]).
Geosciences 09 00131 g005
Figure 6. Annual human casualties caused by storm surges compared with those caused by large storm waves on the coast of China (modified from [19]).
Geosciences 09 00131 g006
Figure 7. Spatial and seasonal variations of wave power (kw/m) on the coast of China averaged from 36-year ERA-Interim reanalysis wave data (1980–2015).
Geosciences 09 00131 g007
Figure 8. Storm tide and wave-elevated mean water levels associated with coastal inundation and erosion hazards (modified from [24]).
Geosciences 09 00131 g008
Figure 9. The spatial variation of dune or seawall toe elevation measured from December 2017 to December 2018 on Yantai Beach on the coastal sector of Shandong (3) in China.
Geosciences 09 00131 g009

