Abstract
We applied a real-time tsunami inundation forecast system to a disaster response plan. We developed a standard operating procedure (SOP) for a tsunami disaster response based on a Plan, Do, Check, Action cycle to effectively use tsunami observation and prediction information provided by a real-time tsunami inundation forecast system during an initial response to a tsunami disaster. In the Plan stage, we ran a workshop on the tsunami disaster response to confirm the current tsunami disaster response plan and develop a timeline plan for a tsunami disaster. In the Do stage, we conducted a tabletop exercise (TTX) for a tsunami disaster using a real-time tsunami prediction system. In the Check stage, we ran a workshop on an after-action review of the TTX. In the Action stage, we applied the SOPs of the real-time tsunami prediction system to the tsunami disaster management plan and conducted a second TTX. As a result, we verified the information provided by a real-time tsunami prediction system to apply the system to a tsunami disaster management plan for real municipalities. It was confirmed that the SOP that we developed allows a real-time tsunami inundation forecast system to enable government staff to safely and effectively respond during a disaster.
1. Introduction
Many casualties and severe damage in East Japan occurred due to a tsunami caused by the Great East Japan Earthquake on 11 March 2011. The main factor that increased the severity of the damage of this earthquake was that the tsunami impacts were greater than forecasted by the disaster plans [1]. Three issues were raised following the disaster response. First, the tsunami impact due to the Great East Japan Earthquake was greater than what a hazard map forecasted would result from an earthquake. Second, the local government staff in charge of disaster prevention could not gather disaster information for the tsunami inundation area, road damage, lifeline damage, and rescue signals. Third, the rescue staff involved in the rescuing effort were hit by the tsunami.
Thus, based on the lessons learned in the Great East Japan Earthquake, the government and the local governments increased the forecasting scale of the tsunami, formulated an evacuation plan, and established rules for rescue activity times in the forecasted tsunami inundation area. The Ministry of Education, Culture, Sports, Science, and Technology developed a seafloor earthquake tsunami observation network in Japan [2] to enable early detection of major earthquakes and tsunamis along the Japan Trench, Chishima Trench, and offshore areas of the Boso Peninsula, and to alarm the people who live near the coast. The Japan Agency for Marine-Earth Science and Technology (JAMSTEC) and the Wakayama Prefecture Government developed the Real-time Tsunami Prediction System using the seafloor earthquake tsunami observation network called Dense Oceanfloor Network System for Earthquakes and Tsunamis (DONET) to mitigate the effects of tsunami disasters [3].
When a major earthquake and tsunami occur in Japan, the local government staff in charge of disaster prevention respond to the disaster by following their local disaster management plan [4]. However, because a tsunami disaster is a low-frequency event, and because staff often transfer to other divisions after about three years, they may lack disaster response expertise and may not be able to effectively use the observation and prediction information provided by the above systems during a major earthquake and tsunami. While municipal staff in charge of disaster prevention conduct disaster evacuation drills for the residents, they do not conduct disaster response exercises, such as a tabletop exercise (TTX) [5]. Although local governments develop local disaster management plans, they are not structured and standardized, as are the Incident Command System (ICS) [6,7] and the Standard Operating Procedure (SOP) [8] of the Federal Emergency Management Agency (FEMA). The prefectures have a disaster management system, but the system only gathers disaster information from the municipalities, such as the number of damaged houses, the number of injured and evacuated, and damage to roads [9,10]. Thus, the prefectures and the municipalities are not able to use and understand the observation and prediction information about the disaster for the initial response.
Therefore, to effectively use tsunami observation and prediction information provided by a real-time tsunami prediction system during the initial response of a tsunami disaster, we applied the real-time tsunami prediction system of the disaster response plan and developed a standard operating procedure (SOP) for a tsunami disaster response based on a Plan, Do, Check, Action (PDCA) cycle. This is important because the local government staff do not update their current plan unless they realize that there are some conflicting or dangerous actions in their plan. In the Plan stage, the local government staff in charge of the disaster response confirmed the current tsunami disaster response plan, comparing it with other disaster response plans. In the Do stage, we conducted the first TTX using the real-time tsunami prediction system. As an after-action review (AAR), the staff discuss issues from the first TTX and develop the SOP for the initial tsunami disaster response in the Check stage. Finally, we conducted a second TTX, and the SOP was verified in the Action stage.
2. Real-Time Tsunami Prediction System and Test Region
In this study, we applied a real-time tsunami prediction system to four municipalities of the Chiba Prefecture in Japan and developed the SOP for a tsunami disaster. While several real-time tsunami prediction systems have been developed [3,11,12,13,14,15], we used the Real-Time Tsunami Inundation Forecast System [11] because we needed to use the seafloor observation network that estimates the tsunami inundation area for earthquakes and tsunamis along the Japan Trench, called Seafloor Observation Network for Earthquakes and Tsunamis along the Japan Trench (S-net) [2] and Offshore Areas of the Boso Peninsula (Figure 1). Figure 2 shows the window of the Real-Time Tsunami Inundation Forecast System: the upper left is the Japan Meteorological Agency (JMA) warning, because the JMA warning is the trigger for the emergency operation in every municipality. The upper right window in Figure 2 shows the real-time observation data from S-net, and the lower area shows the tsunami prediction information that is estimated for coastal tsunami heights, arrival times for each municipality, and estimated tsunami inundation area and depth. In Japan, when a major earthquake occurs, JMA issues a tsunami warning within three minutes, consulting its database based on the estimated tsunami data from a point source [16]. However, the warning zone includes only 66 zones for the entire Japan coast, and the tsunami information includes only the tsunami height on the coast for each zone. Miyagi Prefecture, for example, is categorized as a single zone, even though it includes the Ria coast (for example, Ishinomaki-shi and Kesennuma-shi) and the plains area (for example, Sendai-shi and Natori-shi) [16].
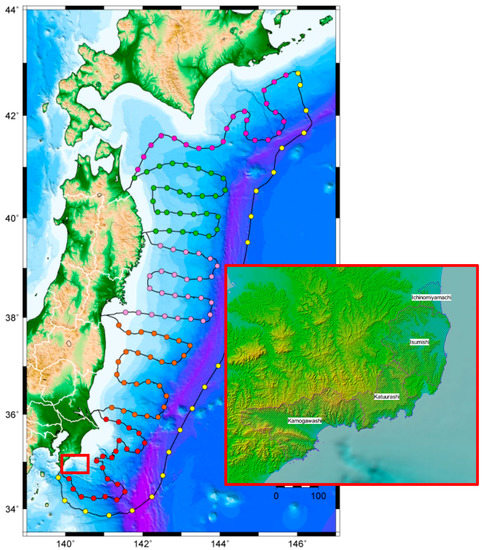
Figure 1.
Map of Eastern Japan along the Pacific Ocean and Seafloor Observation Network for Earthquakes and Tsunamis along the Japan Trench (S-net) [2]. Red and yellow circles denote S-net stations, which are linked by cables with landing stations. The red rectangle denotes the target region of this study.
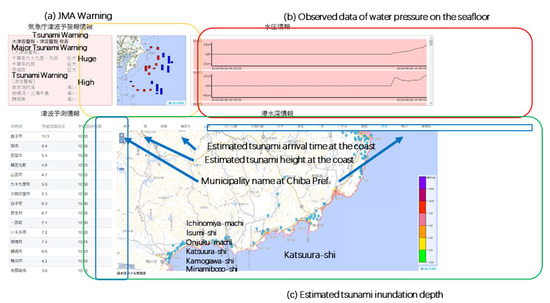
Figure 2.
The Real-Time Tsunami Forecast Information System. The yellow rectangle depicts Japan Meteorological Agency (JMA) warning information (a). The red rectangle is the real-time observation information from S-net; the red bar to the left in the figure is the spilling wave, and the blue bar is the down wave (b). The green rectangle is the estimated information (c).
Thus, the Real-Time Tsunami Inundation Forecast System provides more detailed information for each municipality than the JMA warning information because the local government staff in charge of disaster prevention and mitigation need inland disaster information for their municipality.
Our test regions included Kamogawa-shi, Katsuura-shi, Isumi-shi, and Ichinomiya-machi in Chiba Prefecture, which are located in the Southeast Boso Peninsula (the red rectangle in Figure 1). Chiba Prefecture has various landforms, including the Kamogawa-shi, Katsuura-shi, and Isumi-shi, which are on the Ria coast; and Ichinomiya-machi, which is located at the southern edge of the Kujukuri plain, which will be the surfing venue for the 2020 Tokyo Olympics. Therefore, Ichinomiya-machi and the Chiba prefecture government would use a real-time tsunami prediction system to evacuate the tourists and the residents in the event of a tsunami disaster.
3. Application of the Real-Time Tsunami Inundation Forecast System to the Disaster Response
When using the Real-Time Tsunami Inundation Forecast System for a current disaster response plan, it is important to apply their disaster management plan system based on the PDCA cycle [17], because the users do not know how to use the information provided by the system. Municipalities’ staff in charge of disaster prevention generally do not update the response plan because they believe that the current management plan is sufficient.
Therefore, in the Plan stage, we ran a workshop on the tsunami disaster management involving four municipalities’ staff in charge of disaster prevention to develop the timelines for their current tsunami disaster management plan, compare the forecast system with the plan, and update the plan. In the Do stage, we conducted a first TTX about a tsunami disaster using the Real-Time Tsunami Inundation Forecast System for verifying the application of the system to the current disaster management plan. In the Check stage, we ran an AAR workshop on the first TTX to understand the issues about the tsunami disaster response. We developed the SOP for the tsunami disaster response using the Real-Time Tsunami Inundation Forecast System on the AAR. In the Action stage, we conducted a second TTX and applied the SOP of the Real-Time Tsunami Inundation Forecast System to the tsunami disaster management plan. Figure 3 shows the work flow of this study.
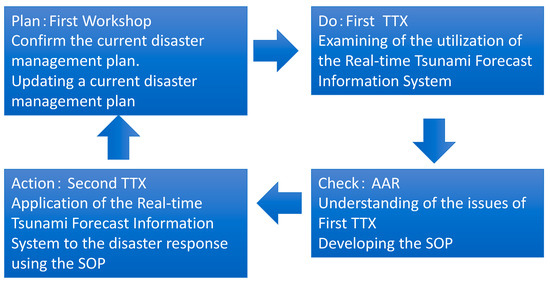
Figure 3.
The Plan, Do, Check, Action (PDCA) cycle in this study. TTX: tabletop exercise; AAR: after-action review; SOP: standard operating procedure.
3.1. Confirming the Current Disaster Response Plan
In the Plan phase, the four municipalities created a timeline following the current disaster management plan. Figure 4 shows the timeline for Kamogawa-shi and Ichinomiya-machi during a tsunami disaster. In this figure, the timelines are not mutually exclusive and collectively exhaustive (MECE) because the action cards (the blue box) were fewer. Some of the action cards included dangerous actions, such as monitoring the sea level near the coast (Katsuura-shi), closing the floodgates (Isumi-city), and patrolling near the coast (Ichinomiya-machi). After developing the timelines, the four municipalities confirmed the difference and the omission by the discussion on each timeline (Figure 5). As a result of the discussion, we recommended that the four municipalities alter the dangerous action cards to using the information provided by the system, and delete the “closing the floodgates” card, because these actions were the causes of mortality of the disaster response staff during the Great East Japan Earthquake.
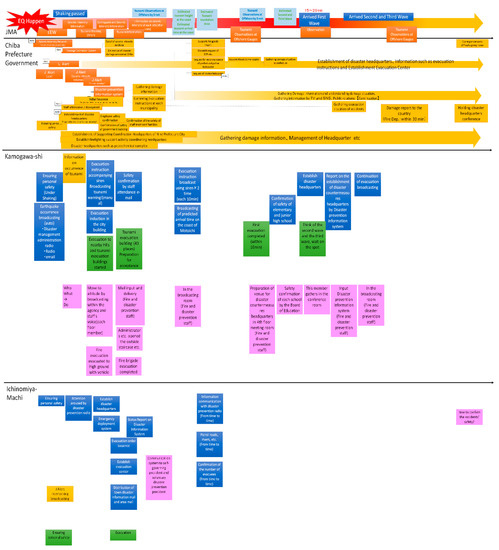
Figure 4.
An example of a timeline of Kamogawa-shi and Ichinomiya-machi during a tsunami disaster. The upper part is the JMA information, the middle part is the flow of Chiba Prefecture’s response, the bottom part is the timeline created by the disaster response staff of Kamogawa-shi and Ichinomiya-machi. The blue rectangle shows the disaster response of Kamogawa-shi and Ichinomiya-machi, such as calling for evacuations throughout the city and establishing the disaster response headquarters. The green rectangle shows the residents’ actions. The pink rectangle shows who acts and what act is undertaken. EQ: Earthquake, EEW: Earthquake Early Warning, SDF: Japan Self-Defense Forces TV: Television, SNS: Social Networking Service.
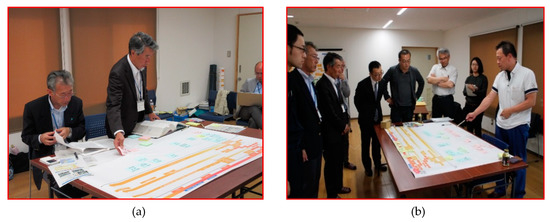
Figure 5.
The workshop confirming a current disaster management plan. (a) This photograph shows the creation of the timeline for Isumi-shi; (b) This photograph shows discussion on the timeline of Kamogawa-shi.
3.2. Use of the Real-Time Tsunami Inundation Forecast System on the First TTX
First, we created a tsunami disaster scenario following the reports of the municipalities in the disaster area due to the Great East Japan Earthquake, such as Ishinomaki-shi, Natori-shi, and Sendai-shi [18,19,20]. The scope of the first TTX was verification of the tsunami disaster response process and the use of the Real-Time Tsunami Inundation Forecast System. We compiled the information from inquiries from within the inundation area, including calls for help from residents and reports of damage. Figure 6 shows the information that we received: 80 inquiries in one hour. The blue line in Figure 6 shows inquiries or rescue requests due to the tsunami disaster. The players responded according to the nature of each inquiry, such as using the Real-Time Tsunami Inundation Forecast System or requesting rescue from the Japan Self-Defense Forces (JSDF). The red line in Figure 6 shows the requests for support for firefighting activities. The orange line in Figure 6 shows the JMA information in Figure 4, and the gray line in Figure 6 shows the Chiba Prefecture response.
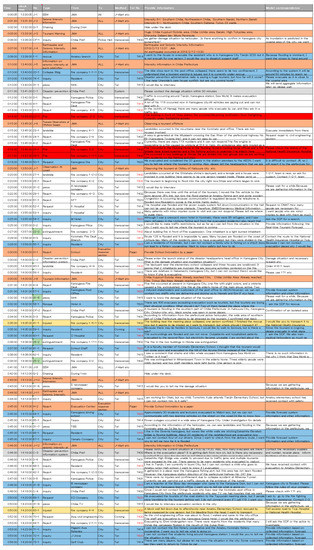
Figure 6.
The information list of the TTX. The location of events is shown in Figure 7. The blue line shows inquiries or rescue requests due to the tsunami disaster. The red line shows the requests for support for firefighting activities. The yellow line shows the injured information. The orange line shows the JMA information. The gray line shows the Chiba Prefecture response. NHK: Japan Broadcasting Corporation, NTT: Nippon Telegraph and Telephone Corporation, DMAT: Disaster Medical Assistance Team.
The first TTX was conducted by nine facilitators, who were the researchers and Chiba Prefecture Government staff, and 16 players who were part of the four municipalities’ disaster response staff and other municipalities’ disaster response staff in Chiba Prefecture. The test region in this TTX was Kamogawa-shi; the players played the role of Kamogawa city workers. The disaster response plan in Japan did not follow ICS, which was recommended by FEMA, but was established based on business routines. Therefore, the disaster response organization consisted of a disaster management section, a general affairs section, a communication and liaison section, a medical support section, a receiving information section, an evacuation response section, and a civil engineering section because these sections were a major section during the initial disaster response and followed the regional disaster prevention plan of Kamogawa-shi. Figure 7 shows the location of the information provided around the center of Kamogawa-shi. The red reverse triangles in Figure 7 show the information provided in Figure 6. The red and pink areas around the coast show a tsunami inundation area in this scenario; the red is the depth of over 2 m and the pink is depths of 1 to 2 m. The following are the players’ roles of each section during the initial response phase:
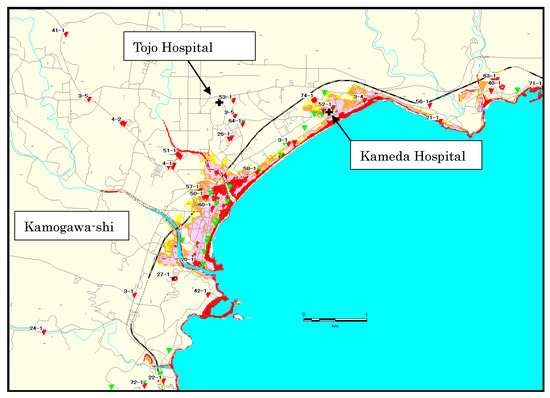
Figure 7.
The map of the scenario information in Kamogawa-shi. The red reverse triangles show the location of a hypothetical event, and the number shows the providing information in Figure 6. The green reverse triangles denote the evacuation facilities. The red and pink areas show tsunami inundation areas in this scenario.
- Disaster management section: The members oversee and manage the disaster headquarters as a whole. The members use the Real-Time Tsunami Inundation Forecast System and command each section.
- General affairs section: The members assist and coordinate the related organizations and the headquarters’ members.
- Communication and liaison section: The members respond to the mass communication and publicize disaster information.
- Medical support section: The members gather the damage situation of medical facilities and support the transport of injured people.
- Receiving information section: The members gather and receive the damage information of the whole city and communicate the information to the disaster management section.
- Evacuation response section: The members gather the information and the situation of the evacuation centers and the shelters (the green reverse triangles in Figure 7) and coordinate them.
- Civil engineering section: The members gather the damage situation information of the roadway infrastructure and respond to landslide damage.
Figure 8 shows the organization of the disaster headquarters in Kamogawa-shi, and Figure 9 shows the layout of the first TTX at the Chiba Prefecture government.
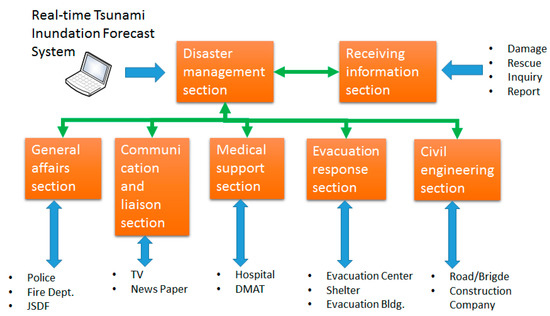
Figure 8.
The organization of the disaster headquarters in the first TTX and the flow or order of information. DMAT: Disaster Medical Assistance Team, JSDF: Japan Self-Defense Forces.
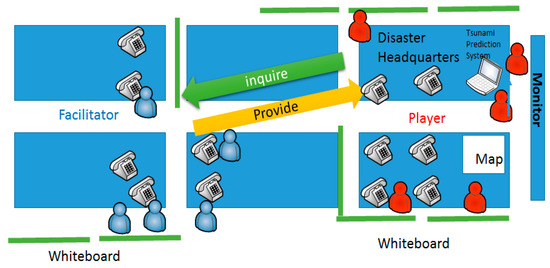
Figure 9.
The layout of this TTX at Chiba Prefecture Government. The staff used the Real-Time Tsunami Prediction system using a laptop and a main monitor. The facilitators provide the information in Figure 5 to the players and reply to the inquiries from the players. The facilitators and the players write each situation or information on the whiteboard.
The players used the Real-Time Tsunami Inundation Forecast System using a laptop and a main monitor. Figure 10 shows the first TTX. As a result of the first TTX, we understood the issues of the tsunami disaster response and how to effectively use the information from the system. The players were able to order the rescue staff to stop rescuing and evacuate from the tsunami inundation area based on the information provided by the system, and responded to inquiries about the tsunami inundation area from the local businesses, such as a transport firm and a post office. However, the players were not able to assess the affected area due to the tsunami inundation, landslides, and damaged roads using the Real-Time Tsunami Inundation Forecast System and the information provided by the facilitators. The players requested the Japan Self-Defense Forces or the prefecture government to rescue the evacuees.
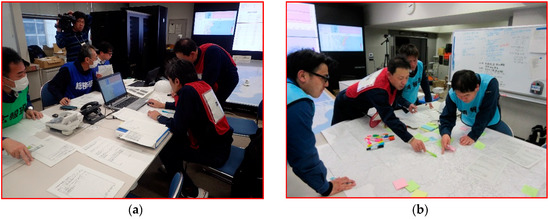
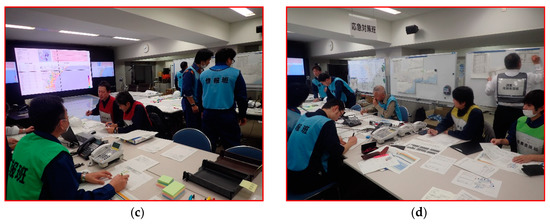
Figure 10.
Photographs of the first TTX: (a) shows use of the Real-Time Tsunami Prediction system; (b) shows the gathering of the information on the map; (c) shows discussion of the disaster response and the main monitor; (d) shows writing information on the white board.
3.3. After-Action Review of TTX
In the check stage, we conducted an after-action review (AAR) of the first TTX. In this AAR, the disaster management staff of the four municipalities discussed the action, notice, and issues in the first TTX. We developed and explained the SOP of the Real-Time Tsunami Inundation Forecast System (Figure 11). Figure 11 shows the SOP that we developed based on the results of the first workshop and the lessons learned from the Great East Japan Earthquake for using the Real-Time Tsunami Inundation Forecast System. In Figure 11, the red circles are the action cards of the tsunami disaster response using the Real-Time Tsunami Inundation Forecast System.
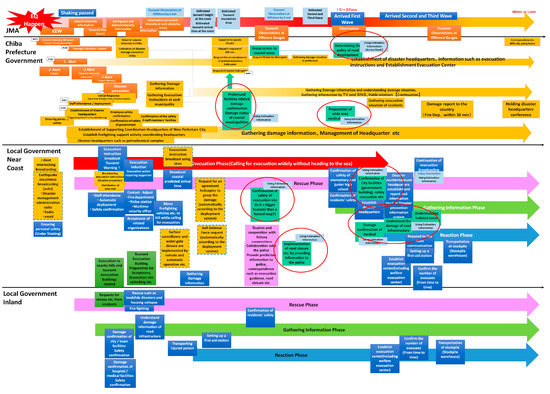
Figure 11.
SOP that we developed based on the results of this AAR and the lessons from the 2011 Great East Japan Earthquake for the users of the Real-Time Tsunami Inundation Forecast System. The red circles are the action cards of the tsunami disaster response using the Real-Time Tsunami Inundation Forecast System for local government staff.
The following are the disaster responses (action cards) on the SOP using the information provided by the Real-Time Tsunami Inundation Forecast System for the municipalities:
- (1)
- Before arrival of the first tsunami wave:
- (a)
- Report the tsunami inundation area and arrival time of the tsunami to every person in the tsunami inundation area. Since the local governments must have every person in the tsunami inundation area evacuated, stop each action, such as rescuing and gathering information.
- (b)
- Compare the hazard map with the tsunami inundation area provided by the system because, if the tsunami inundation area provided by the system is greater than predicted by the hazard map, the local government staff must report the information to the residents.
- (c)
- Share the tsunami inundation area provided by the system with the relevant departments, such as the fire departments, police departments, and JSDF, because the relevant bodies control and rescue the residents and each stakeholder.
- (2)
- After a tsunami inundation.Since the disaster commander cannot enter the tsunami inundation area,
- (a)
- Estimate the damages to medical facilities, important facilities for disaster response, and infrastructure due to the tsunami inundation.
- (b)
- Rescue the injured and the residents in the isolated areas due to the tsunami inundation.
As such, we obtained agreement on this SOP and conducted the next TTX in the action stage.
3.4. Second TTX in the Action Stage
We conducted a second TTX to verify the SOP we developed in the action stage. In the second TTX, we prepared a check list for the tsunami disaster response on the SOP, as shown in Figure 11. The information provided was the same as in the first TTX, but we changed the target region on the second TTX to Isumi-shi. Thus, we made a small change in the layout of the headquarters of the disaster control and the disaster response organization because we allowed the four municipalities’ staff to add their disaster response experience.
The result of the second TTX (Figure 12) was that the players were able to use the Real-Time Tsunami Inundation Forecast System following the SOP that we developed. Through the second TTX, the participants requested information about the second and the third tsunami waves because they needed to anticipate a disaster situation.
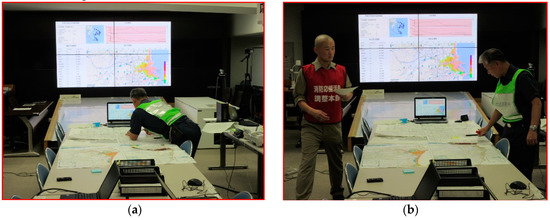
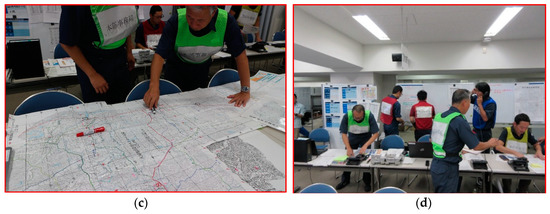
Figure 12.
Photographs of the second TTX: (a) shows staff using the Real-Time Tsunami Prediction system and drawing the tsunami inundation area on the map; (b) shows staff confirming the hazard map area by comparing it with the tsunami inundation area provided by the Real-Time Tsunami Prediction system; (c) shows staff gathering the information on the map; (d) shows staff requesting a disaster response from the participants.
4. Discussion
In this study, we examined the application of the Real-Time Tsunami Inundation Forecast System to the disaster response based on the PDCA cycle. The result is that local government staff need to modify the current disaster management plan based on the SOP that we developed in the check stage (Figure 11). The staff will be able to safely and effectively respond with disaster management during a major tsunami disaster.
The following is the information required for the Real-Time Tsunami Prediction System to be applied to a tsunami disaster management plan of the municipalities.
- (1)
- Arrival time of the tsunami at the coast, for activity time and evacuation.
- (2)
- Tsunami height at the coast, for triggering the disaster operation.
- (3)
- Tsunami inundation area, for the disaster response to operate safely and effectively.
- (4)
- The location of the medical facility, evacuation facility, the road, and important Web Geographic Information System (Web GIS) facilities for the disaster response: for estimating the damage and rescuing.
- (5)
- The inundation area of the hazard map on Web GIS, for notifying residents to evacuate if the predicted inundation area is greater than shown on the hazard map.
- (6)
- The number of the estimated damaged buildings and affected people in each Oaza district for calling for cooperation from the relevant legal agency.
- (7)
- Information about subsequent waves so the disaster situation can be anticipated.
5. Conclusions
We applied the Real-Time Tsunami Inundation Forecast System to the current disaster management plan of Japanese coastal municipalities based on the PDCA cycle. We confirmed that the SOP that we developed for local government staff allows the Real-Time Tsunami Inundation Forecast System to be safely and effectively used for disaster response. We confirmed that the system enables the disaster management staff to respond to three issues identified from the Great East Japan Earthquake.
- (1)
- The tsunami inundation area of the Great East Japan Earthquake was greater than what a hazard map predicted from an earthquake; before tsunami arrival, the local government staff in charge of the disaster response must confirm whether the predicted tsunami inundation area is greater than that shown on a hazard map.
- (2)
- The local government staff in charge of the disaster prevention could not gather the necessary disaster information such as the tsunami inundation area, lifeline damage, and rescue signals; local government staff in charge of the disaster response should retrieve damage information about medical facilities, evacuation facilities, infrastructure damage, and isolated areas as indicated from GIS data and the predicted tsunami inundation area provided by the system.
- (3)
- Rescue staff were hit by the tsunami during rescue work; the local government staff in charge of the disaster response should order the rescue staff and the residents to evacuate from the tsunami inundation area predicted by the system until the arrival of the tsunami.
We will install the Real-Time Tsunami Prediction system and the SOP in four municipalities, and Chiba Prefecture government will expand the system to other municipalities with the SOP. Finally, we will update the SOP, because it is important for disaster mitigation to continue to carry on the PDCA cycle.
Author Contributions
Conceptualization, T.K. and K.A.; Methodology, T.K.; Validation, K.A. and N.T.; Resources, W.S., M.O., and K.Y.; Writing—Original Draft Preparation, T.K.; Writing—Review & Editing, W.S., K.A., and N.T.; Visualization T.K.; Supervision, W.S., K.A., and N.T.
Funding
This research was funded by the Council for Science, Technology, and Innovation (CSTI), Cross-Ministerial Strategic Innovation Promotion Program (SIP), “Enhancement of societal resiliency against natural disasters” (Funding agency: JST).
Acknowledgments
We thank Takayuki Miyoshi, Noboru Nakura, and the other participants for research and development under the SIP project. We thank the Chiba Prefectural Government for their cooperation to promote this study.
Conflicts of Interest
The founding sponsors had no role in the design of the study; in the collection, analyses, or interpretation of data; in the writing of the manuscript, and in the decision to publish the results.
References
- Cabinet Office in Japan, Central Disaster Management Council. Report of the Committee for Technical Investigation on Countermeasures for Earthquakes and Tsunamis Based on the Lessons Learned from the “2011 off the Pacific coast of Tohoku Earthquake”. 2011. Available online: http://www.bousai.go.jp/kaigirep/chousakai/tohokukyokun/pdf/Report.pdf (accessed on 1 December 2018).
- Kanazawa, T.; Uehira, K.; Mochizuki, M.; Shinbo, T.; Fujimoto, H.; Noguchi, S.; Kunugi, T.; Shiomi, K.; Aoi, S.; Matsumoto, T.; et al. S-net project, cabled observation network for earthquakes and tsunamis. In Proceedings of the SubOptic 2016, Dubai, UAE, 18–21 April 2016. Abstract WE2B-3. [Google Scholar]
- Takahashi, N.; Imai, K.; Ishibashi, M.; Sueki, K.; Obayashi, R.; Tanabe, T.; Tamazawa, F.; Baba, T.; Kaneda, Y. Real-time tsunami prediction system using DONET. J. Disaster Res. 2017, 12, 766–774. [Google Scholar] [CrossRef]
- Cabinet Office in Japan. Disaster Management in Japan. Available online: http://www.bousai.go.jp/1info/pdf/saigaipamphlet_je.pdf (accessed on 1 December 2018).
- FEMA. Emergency Planning Exercises. Available online: https://www.fema.gov/emergency-planning-exercises (accessed on 1 December 2018).
- FEMA. ICS Resource Center. Available online: https://training.fema.gov/emiweb/is/icsresource/index.htm (accessed on 1 December 2018).
- FEMA. NIMS Intelligence/Investigations Function Guidance and Field Operations Guide. Available online: https://www.fema.gov/media-library/assets/documents/84807 (accessed on 1 December 2018).
- FEMA. Emergency Support Function 15: Standard Operating Procedures. Available online: https://www.fema.gov/media-library/assets/documents/34369 (accessed on 1 December 2018).
- Ise, T.; Takahashi, T.; Sato, R.; Sano, H.; Isono, T.; Hanashima, M.; Usuda, Y. Consideration on Utilization of Information in Disaster Response Site—Based on Information Support for 2016 Kumamoto Earthquakes—. J. Disaster Res. 2017, 12, 1028–1038. [Google Scholar] [CrossRef]
- Ise, T.; Isono, T.; Usuda, Y.; Fujiwara, H.; Yamori, K. Study of the Method of Disaster Information Sharing System Considering the Diversity of the Municipalities. Inst. Soc. Saf. Sci. 2017, 30, 25–34. Available online: http://isss.jp.net/isss-site/wp-content/uploads/2017/03/2016-047.pdf (accessed on 1 December 2018). (In Japanese).
- Aoi, S.; Yamamoto, N.; Suzuki, W.; Hirata, K.; Kunugi, T.; Nakamura, H.; Kubo, T.; Maeda, T.; Suzuki, S. Real-time Tsunami Inundation Forecast System Using S-net Data. In Proceedings of the 16th World Conference Earthquake Engineering, Santiago, Chile, 9–13 January 2017; p. 517. [Google Scholar]
- Gusman, A.R.; Tanioka, Y.; Maclnnes, B.T.; Tsushima, H. A methodology for near-field tsunami inundation forecasting: Application to the 2011 Tohoku tsunami. J. Geophys. Res. 2014, 119, 8186–8206. [Google Scholar] [CrossRef]
- Tanioka, Y.; Gusman, A.R.; Ioki, K.; Nakamura, Y. Real-time tsunami inundation forecast for a recurrence of 17th century Great Hokkaido Earthquake in Japan. J. Disaster Res. 2014, 9, 358–364. [Google Scholar] [CrossRef]
- Titov, V.V.; Gonzalez, F.I.; Bernard, E.N.; Eble, M.C.; Mofjeld, H.O.; Newman, J.C.; Venturato, A.J. Real-time tsunami forecasting: Challenges and solutions. Nat. Hazards 2005, 35, 41–58. [Google Scholar] [CrossRef]
- Tsushima, H.; Hino, R.; Tanioka, Y.; Imamura, F.; Fujimoto, H. Tsunami waveform inversion incorporating permanent seafloor deformation and its application to tsunami forecasting. J. Geophys. Res. 2012, 117, B03311. [Google Scholar] [CrossRef]
- Japan Meteorological Agency. Lessons learned from the tsunami disaster caused by the 2011 Great East Japan Earthquake and improvements in JMA’s tsunami warning system. 2013. Available online: https://www.jma.go.jp/jma/en/Publications/publications.html (accessed on 1 December 2018).
- Kubo, T.; Hisada, Y.; Murakami, M.; Kosuge, F.; Hamano, K. Application of an earthquake early warning system and a real-time strong motion monitoring system in emergency response in a high-rise building. Soil Dyn. Earthq. Eng. 2011, 31, 231–239. [Google Scholar] [CrossRef]
- Ishinomaki City. The Report of the Disaster Response about 2011 Great East Japan Earthquake. 2012. Available online: http://www.city.ishinomaki.lg.jp/cont/10106000/8284/20131213153754.html (accessed on 1 December 2018). (In Japanese).
- Natori City. The Record of 2011 Great East Japan Earthquake in Natori City. 2013. Available online: http://www.city.natori.miyagi.jp/soshiki/soumu/311kiroku/index (accessed on 1 December 2018). (In Japanese).
- Sendai City. The Report of 2011 Great East Japan Earthquake in Sendai City. Available online: http://www.city.sendai.jp/shinsaifukko/shise/daishinsai/fukko/hassai.html (accessed on 1 December 2018). (In Japanese).
© 2019 by the authors. Licensee MDPI, Basel, Switzerland. This article is an open access article distributed under the terms and conditions of the Creative Commons Attribution (CC BY) license (http://creativecommons.org/licenses/by/4.0/).