1. Introduction
Coastal areas are dynamic and complex multi-functional systems, with a large number of often conflicting socioeconomic activities, ecological and natural values, and high habitat and biological diversity. These aspects are all fundamental for sustainable coastal management and for providing ecosystem services, which are essential for human well-being [
1]. Continental and marine processes along coastal areas change the landscape [
2], and climate change adds additional pressure to European coastal systems by increasing the vulnerability of already highly vulnerable areas. The main impacts of climate change in coastal zones are related to meteorological changes, primarily sea-level rise [
3].
Current methodologies for coastal vulnerability analyses use index-based methods [
4,
5,
6,
7,
8,
9,
10,
11], an indicator-based approach, GIS-based decision support systems [
12], and dynamic computer models [
13]. The assessment of the coastal vulnerability is a complex process that is usually simplified and approximated because it includes a great number of parameters, where some may interact resulting in various outcomes. The main parameters usually considered in vulnerability assessments are: geomorphology, coastal slope, shoreline erosion/accretion rates, emerged beach width, dune width, relative sea-level change, mean significant wave height, mean tide range, and the width of vegetation behind the beach [
14]. In addition to these natural or geophysical factors, some methodologies also include socioeconomic or anthropological influences quantified by such parameters as land-use, manmade structures and interventions, and water management, and finally by calculating the Integrated Coastal Vulnerability Index [
15]. A rating of the vulnerability analysis’s key parameters is often based on the Analytic Hierarchy Process [
9,
16].
Unlike most European Union countries, mapping of the coastal vulnerability, assessments of geological hazards, and coastal zone management are completely unknown concepts in Croatia [
1,
17]. Coastal geohazard strategies on the Croatian Eastern Adriatic Coast (CEAC) are currently implemented only by means of reconstruction and remediation works after the coastal retreat and occurrence of local instabilities. Problems of coastal vulnerability induced by marine erosion in the Kvarner area have been described in several previous studies, and are therefore better understood and documented than in other coastal parts of Croatia. The results of the recent research have shown vulnerability in the southeastern coast of Krk Island, near Stara Baška (
Figure 1) [
18,
19,
20,
21,
22,
23,
24]. Marine erosion and problems of coastal vulnerability in the wider area of Stara Baška have been described in several recent studies [
20,
21,
25]. However, a Coastal Vulnerability Index (CVI) has never been calculated for the Croatian coast. In contrast, the coastal vulnerability of the nearby northern Italian coast has been covered by many investigations [
12]. Coastal vulnerability studies in the Mediterranean are relatively rare in relation to the coastal length and socioeconomic importance [
14,
26,
27,
28,
29].
CEAC is predominantly steep, rocky coast, mostly formed of karstified carbonate rocks. For this reason, the geomorphology of this coastal area is more complex and diverse, comprising of different coastal forms on a small scale [
30]. Intensive morphogenetic processes caused by tectonic movements and rapid sea-level changes, as well as climatic changes, resulted in the present shape of the Kvarner area, as well as the shape of the Krk Island (
Figure 1). A larger segment of the Kvarner coast is submerged karst relief [
31]. Relatively resistant sedimentary Cretaceous and Palaeogene carbonate rocks (limestone, carbonate limestone, and carbonate breccias) prevail, whereas outcrops of less-resistant Paleogene siliciclastic rocks (marls and flysch) are rare. Pleistocene and Holocene deposits partially cover this bedrock substrate. Due to the geological setting, hydrogeological conditions, and direct exposure to the waves, the investigated coastal zone is in a fragile geodynamic equilibrium. Over the past few decades, the expansion of urbanization (mainly for tourism purposes), and a lack of appropriate infrastructure (drainage system), caused an increase of erosion processes and local instabilities.
The aim of this paper is to propose a suitable methodology for calculating the CVI considering the previously mentioned specific characteristics of the CEAC. In the preliminary analysis, several existing methodologies were considered on a selected segment of the coast near Stara Baška (
Figure 1). The vulnerability was analyzed on the basis of the available data sets, which include the most relevant parameters directly or indirectly influencing the vulnerability of the coastal system in the research area: geological setting, wave height, wind, tide, sediment transport, sediment supply from rivers to the sea, hydrogeological setting, relative sea-level change, land use, present infrastructure (buildings, ports, barriers), surface flow regulation, and land cover. In contrast to existing methodologies, which are based on assignment of vulnerability values to the costal segments, the analysis presented in this paper is based on the calculations of vulnerability at individual coastal points, which is more suitable for complex coastal environments. The existing methodology was adapted emphasizing the influence of the geological factor and giving accent to the novel approach in the parametric analysis, applicable at the international level: (i) a detailed calculation of the coastal slope, defined as a maximal slope within the 50 m segment, due to the coastal slope variability, (ii) a new approach for the beach width calculation at a single coastal point, and (iii) a definition of the significant wave height at a single coastal point based on Simulating WAves Nearshore (SWAN) numerical model results.
2. Study Area
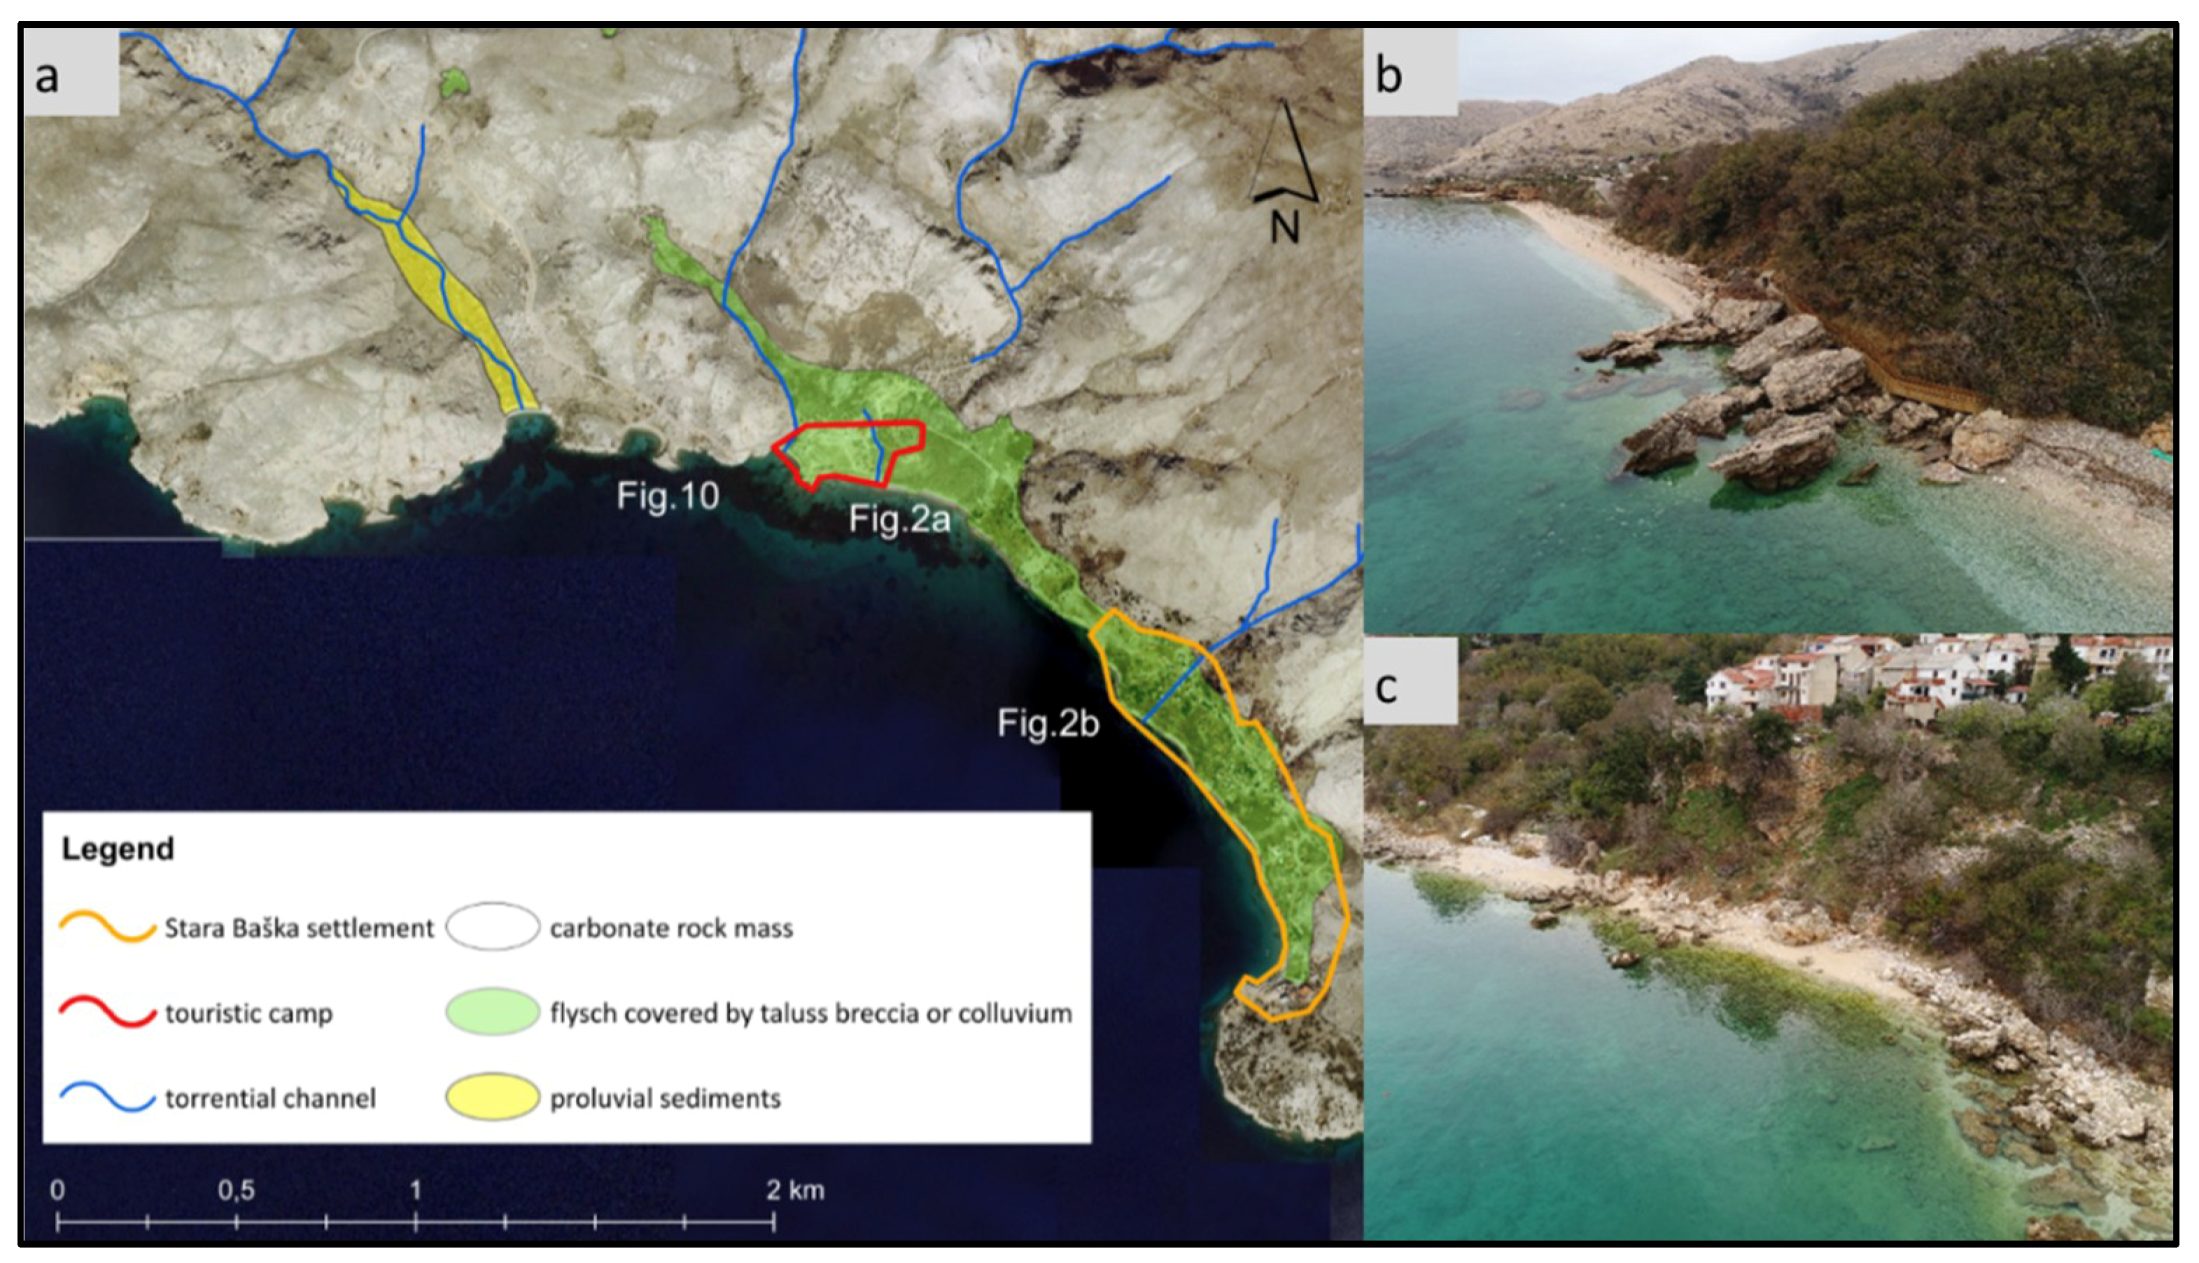
The research area is Stara Baška on the Krk Island located in the Kvarnerić Bay in the northern Adriatic. Kvarnerić Bay is a relatively enclosed northeastern channel part of the Adriatic Sea, with limited fetch areas (
Figure 1). The study area is exposed to wind-generated waves from the southwest (SW), south (S) and southeast (SE) directions, with a largest significant wave height of 3 m, as reported from the measurements taken in the Rijeka Bay [
32]. The highest waves from the SE direction are usually accompanied by storm surges. This is a micro-tidal environment, with a tidal range between 20 and 50 cm. Numerical wave simulations in the Kvarner area, with a constant SE wind direction, have shown that Rab Island protects the coastal area of the Krk Island from the SE wind waves.
The terrain elevations around Stara Baška are formed in Upper Cretaceous and Paleogene limestone, dolomitic limestone, and dolomitic breccias. This carbonate rock mass has a different degree of fissuring and karstification and forms the typical bare karstic landscape. Paleogene siliciclastic rocks are situated in a relatively narrow tectonically squeezed coastal zone. This rock mass consists of marls and flysch (siltstones and thin beds of sandstones). Despite bare karst in surrounding altitudes, a large part of this rock mass is covered by Quaternary sediments: the western part of the investigated area is covered by talus breccias and the eastern part by breccia and colluvial deposits (a mixture of silty clay and carbonate rock fragments) (
Figure 2). Outcrops of siliciclastic rock mass are visible sporadically in the narrow coastal zone [
20,
21,
33].
Coastal cliffs formed in talus breccias have an average height of 5 to 6 meters. The top layer at the subsurface, of about 1 m thickness, is completely weathered and has properties of residual soil. The erosional processes have reduced surrounding elevations and formed gravelly beaches with grain sizes between 2 and 20 mm. The karstified carbonate rock mass has a high permeability. On the other hand, the siliciclastic rock mass is impermeable and subsurface (hypodermic) groundwater flows are formed through permeable talus breccia toward the sea. Reflecting this complex geological setting, the investigated coastline has pocket beaches, headlands, cliffs, cliff undercuts, rock piles, and landslides in a small area. A rockfall, which happened during a calm summer night on 18 July 2009, caused a tragic loss of life of a tourist at this site [
34].
Stagnation of the sea level rise occurred in the last 5000 years, after the rapid Late Pleistocene–Holocene rise in the Adriatic Sea [
35,
36]. Erosional processes were reduced, marine erosion/abrasion increased, and gravely alluvial fans have been formed along the coast. The combination of these geomorphologic factors enabled the formation of a relatively wide marina terrace in the investigated area.
The Stara Baška settlement dates from the 14th century. It has a population of 113 people, which expands more than 10 times during the touristic season. Due to the tourism development in Stara Baška, many houses have been built during the last half-century. This settlement expansion was not followed by adequate infrastructure and land-use planning. Many houses were built in potentially unstable zones.
3. Methodology
In this study, the vulnerability analysis of the narrow coastal area implies the potential degree of change that some coastal segment can sustain due to the presence or impact of different natural influences defined by considered parameters. Index-based approaches express coastal vulnerability by means of a one-dimensional CVI proposed by Gornitz [
4,
37]. The method is based on a segmentation of a coastline, and assignment of vulnerability values to each coastal segment. The CVI may be defined as the square root of the product of the ranking factors divided by the number of parameters [
38], the geometric average of the ranking factors [
39], the sum of the value of each variable divided by the number of variables [
40], or by taking the sum of the considered variables with the rank of each multiplied by their corresponding weights [
41].
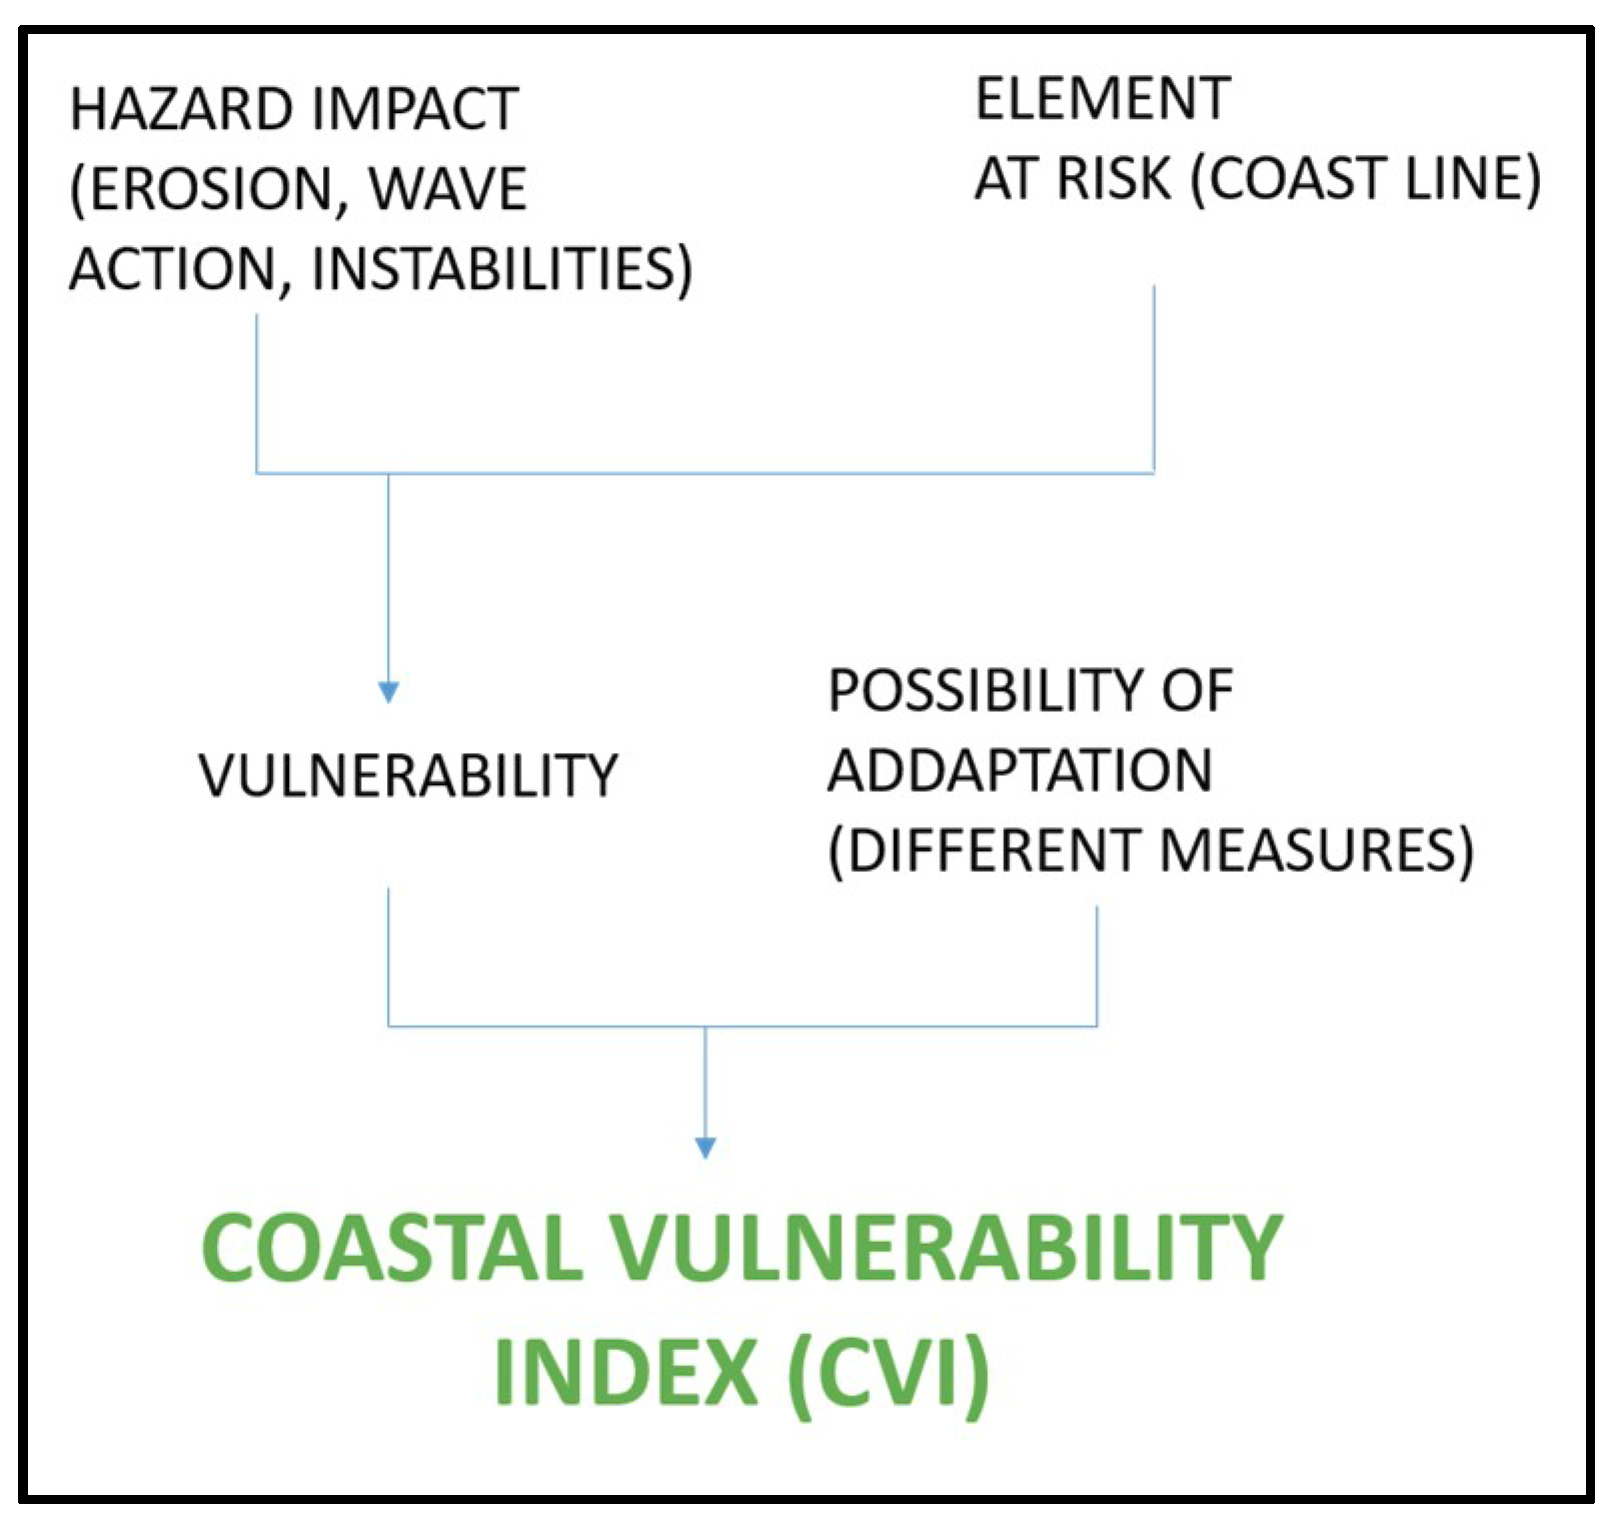
A segment of the coastline can be vulnerable considering different parameters, but only if exposed to a certain hazardous phenomenon or impact. On the other side, different anthropogenic measures can provide a certain vulnerability reduction (e.g., coastline structures, natural offshore cliffs or islets), and should be considered in the resulting CVI (
Figure 3).
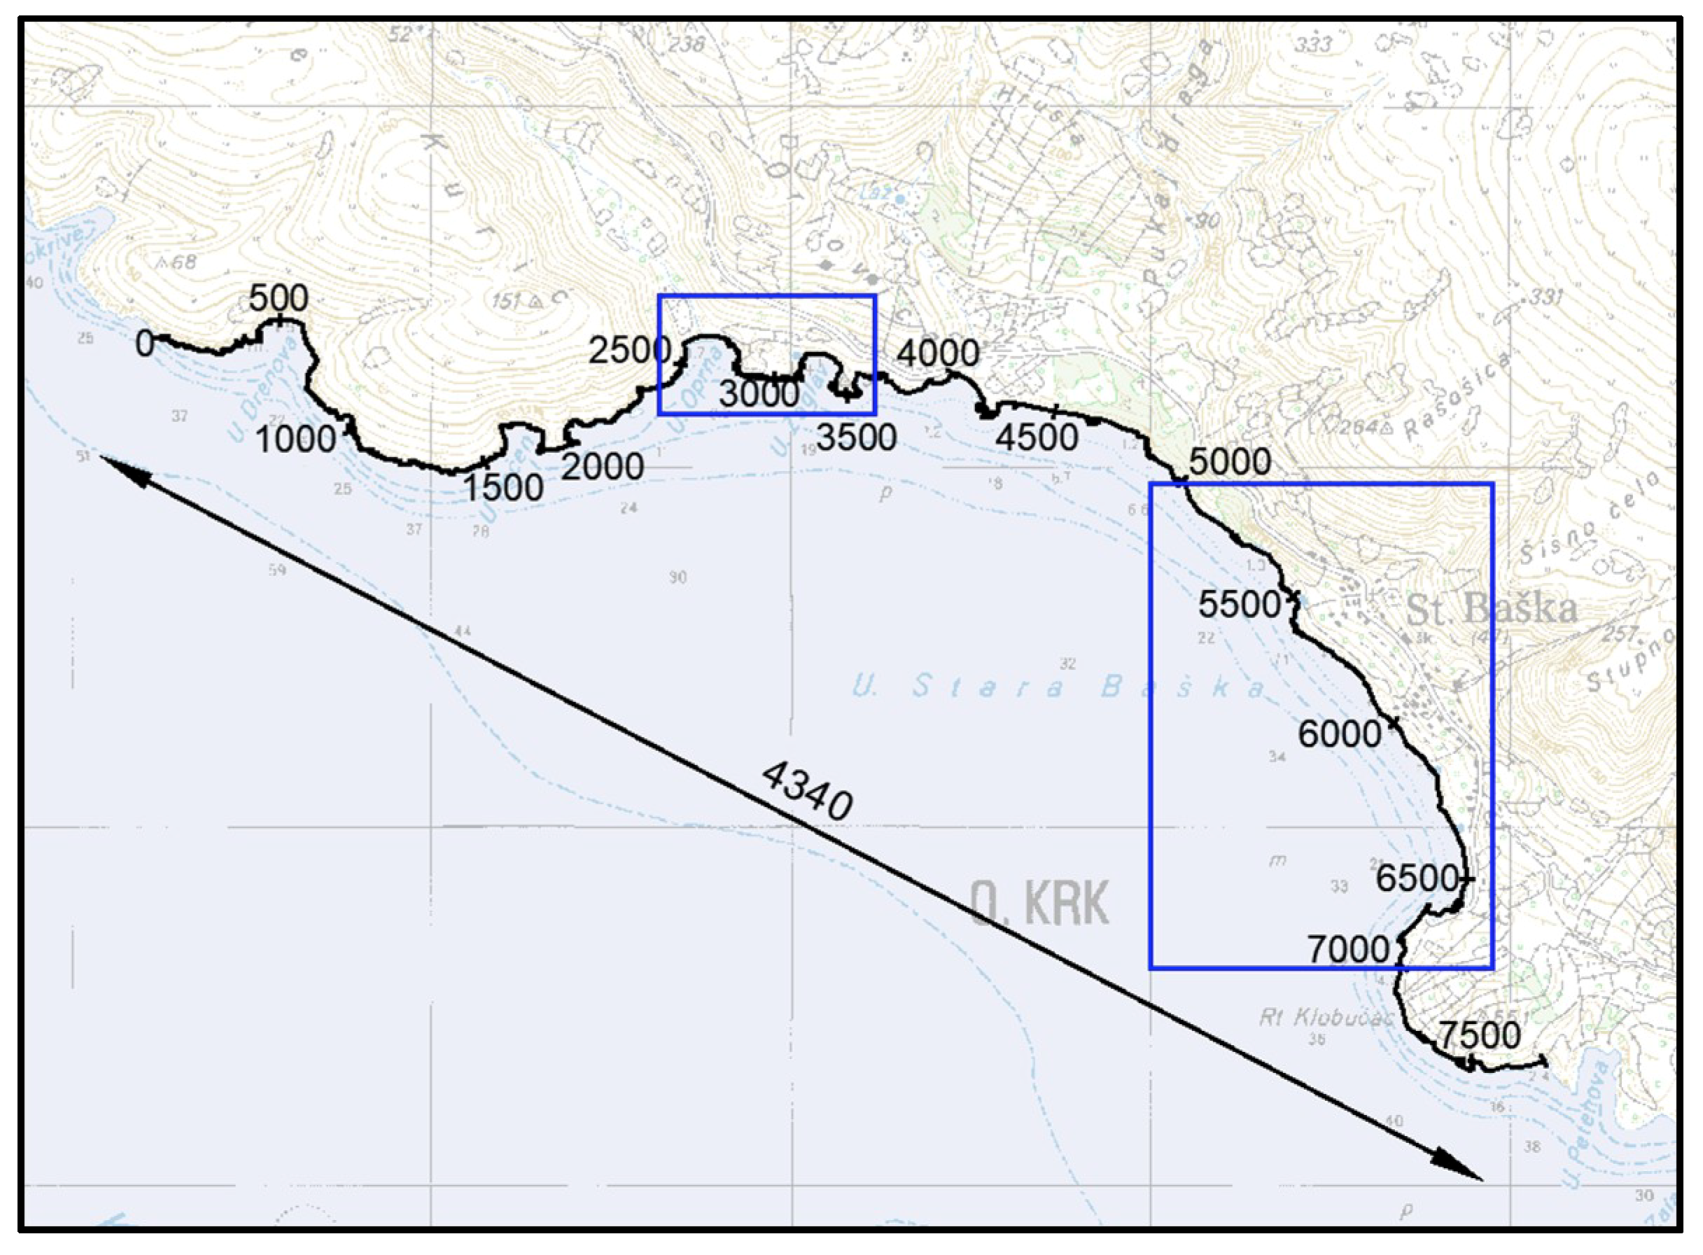
The CVI calculated for the wider area of Stara Baška covers a linear coastal transect of 4342 m, and a total coastline of 7720 m, with a respective coastal ratio of 1.78. A stretch of the coast is divided into 1545 5-m wide segments, represented by a single point (
Figure 4). CVI analyses based on cross-sectional profiles are not suitable in this case because of the complex morphology with numerous pocket beaches, headlands, and cliffs. Furthermore, cross-sectional analyses would take much more time and effort, with questionable results. The coastal units that behave similarly were not applicable due to significant variations in CVI variables. Therefore, a procedure for the CVI analysis of a series of individual coastal points was developed in Matlab. AutoCadMap 2018 was used to define the specified areas (e.g., beach area polygons, geological fabric polygons, etc.), and CloudCompare was used for the visualization of the results.
CVI represents a combined result of the parameters influencing coastal vulnerability in this area. The selected physical and anthropogenic parameters contributing to the coastal vulnerability around Stara Baška consider the following variables (
Table 1):
a: Geological fabric
b: Coastal slope
c: Emerged beach width
d: Significant wave height
e: Land use
Sea-level rise and tidal range, which are usually considered to be important parameters in other coastal vulnerability studies, were not considered, since their influence in the analyzed area is uniform. Additionally, tide influence is negligible due to the steep coast and a micro-tidal regime. Shoreline erosion/accretion rates were not defined because the coastal changes are lower than the precision of the available maps [
42]. The only significant changes were evidenced on the camping resort’s coastline, defined through the geological fabric parameter.
Data used in the analysis included available aerial photographs, topographic and orthophoto maps on a scale of 1:5000, and geological maps of different scales. However, a detailed cognition of the cost, several site visits, and geomorphological field mapping were crucial in assigning the rating values for the coastline segments. A rating of the five key parameters is generally based on a semi-quantitative score, described in five levels, from very low to very high. Finally, the key parameters are integrated into one single CVI, which represents the general vulnerability of the coastal area. The CVI has been computed using a modified formulation by Gornitz [
4,
37] as the square root of the vulnerability scores assigned to each variable product divided by the total number of variables, emphasizing the geological fabric’s importance:
The accuracy and reliability of the vulnerability assessment results were verified in the field and compared with the present conditions and previous research results at several locations. The research area was surveyed with an unmanned aerial vehicle (UAV) and photographs at specific locations are presented and discussed in the paper.
The first parameter considered in the calculation of the Coastal Vulnerability Index is geological fabric (a) in relation to the geomorphological processes and rock mass strength parameters. Geomorphological characteristics express the relative erodibility of different landform types and require information on the spatial distribution and their stability. Geomorphological features were defined from the orthophoto maps (2003–2014) combined with the digital elevation model data (DEM, 5 × 5 m), available geological maps, a recent field investigation, and data from the professional and scientific papers [
20,
21,
25,
33]. Different vulnerability levels were defined inside the five geological zones of the research area: proluvial sediments, resistant carbonate rocks, crushed carbonate rocks, talus breccia, flysch rock, and colluvium.
Proluvial sediments present a complex, friable, deltaic sediment accumulated at the foot of a slope as a result of an occasional torrential washing of fragmental material. They consist of rounded grains, of dimensions between 3 and 20 cm (coarse gravel and cobble), which originate from Palaeogene and Upper Cretaceous limestone. The vulnerability level in these zones is very low due to low geomorphological activity. Processes of erosion and/or accumulation are visible only in the narrow coastal zone due to the wave influence. Geomorphological processes (sediment transport) from inland are possible only by rare torrential flow through a dry karstic valley. Resistant carbonate rock mass, consisting of Paleogene foraminiferal limestone, presents tectonically very deformed, fissured, and sporadically crushed sedimentary rock. Rock mass in this zone is strongly karstified, with an estimated Geological Strength Index GSI = 40–60 [
43,
44,
45]. Bioerosion is a dominant geomorphological process. This part of the coast is generally stable and resistant to wave attacks, and vulnerability to coastal processes can be categorized as low. Crushed carbonate rock mass in some parts of the research area corresponds to the third level of vulnerability, as tectonically very deformed, fissured, crushed, and strongly karstified carbonate colluvium, with an estimated Geological Strength Index GSI = 20–30. The destructive effect of a wave attack is visible and rock falls occur periodically. This geological unit was categorized as moderately vulnerable. Talus breccia consists of angular fragments from a few millimetres in diameter to blocks greater than 50 cm, with prevailing fragments of 4 cm in size. This rock mass has pronounced subhorizontal stratification and the joints are not visible. The matrix is a reddish silt-sandy cement with different degrees of calcification, which has a great influence on the erodibility and resistance to wave attacks as well as on breccias’ strength properties. The estimated Geological Strength Index is GSI = 20–30. The destructive effect of a wave attack is obvious, and wave-cut notches provoke frequent rock fall and slump phenomena, so the described locations are highly vulnerable. Paleogene flysch rock mass consists of marls and siltstone with thin layers of sandstone. It is tectonically very deformed, fissured, and strongly weathered rock mass in the surface zone. The bedrock is covered by colluvium formed of coarse-grained fragments and blocks originating from higher-elevation carbonate slopes, mixed with silty clay from the weathered flysch zone. The thickness of the colluvium is approximately several meters. The estimated Geological Strength Index of the flysch rock mass is GSI = 25–35. Flysch rock mass has low resistance to wave attacks, and rock falls are frequent in these areas. Further on, in a few locations, active erosion, rock falls, and dormant landslides can be found, assigning these zones with the very high vulnerability grade.
The second parameter considered in the analysis is a coastal slope (b), as an indicator of the relative vulnerability to inundation, coastal stability, and the potential coastline retreat. The coastal slope has been determined from the DEM obtained from the orthophoto scale of 1:5000 [
42]. It was defined as a maximal slope from the coastline up to 50 m inland, and calculated every 5 meters because of the coastal slope’s variability. The coastal slope varies from a few degrees on beaches to very steep or vertical on cliffs and carbonate rocks. The standard geomorphological classification for slope inclination was used and adapted according to the author’s previous experience in the Kvarner area. Very low vulnerability was determined on slopes to be <5%, low vulnerability on slopes 5–12%, moderate vulnerability on slopes 12–20%, high vulnerability on slopes 20–32%, and very high vulnerability on slopes >32%, where extreme erosion or rock falls are possible.
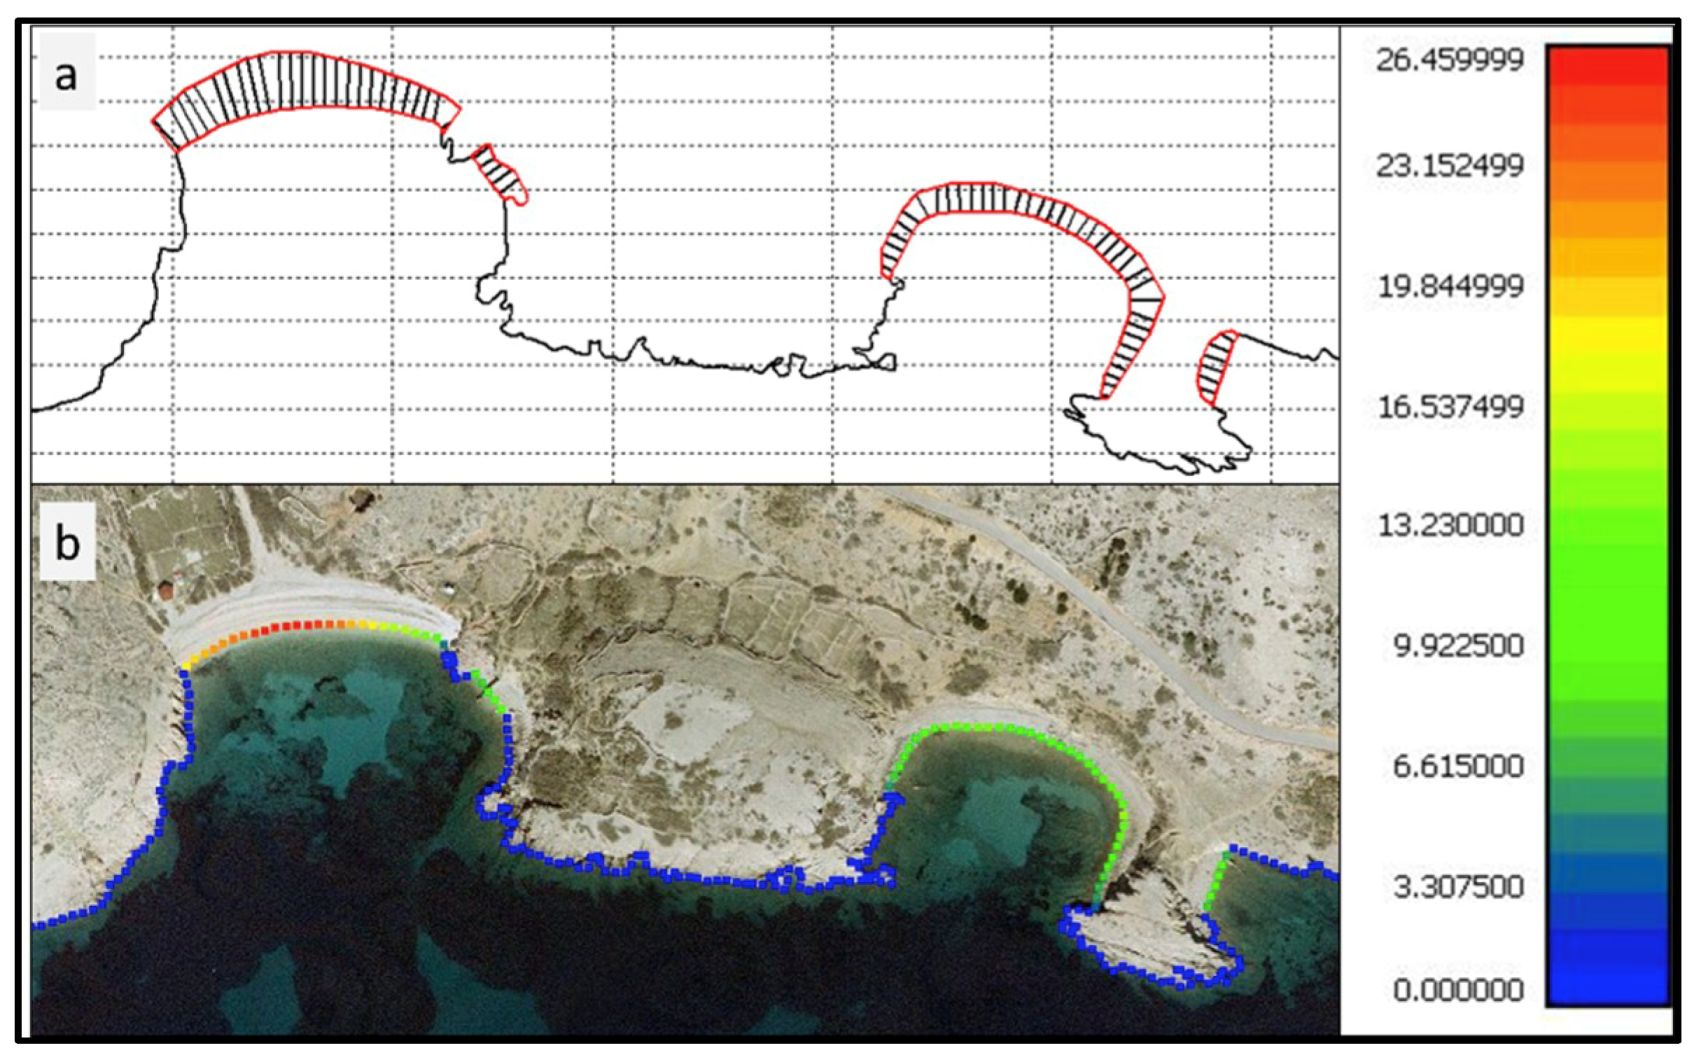
Emerged beach width (c) is a parameter related to the ability to dissipate wave energy. Beach areas were defined and marked with polygons (
Figure 5). A code in Matlab was developed to calculate the beach width every 5 m, for each analyzed polygon. It calculates the perpendicular distance from the defined coastline to the beach inland boundary at the defined coastline station. A wider beach has a greater ability to dissipate the wave energy and to reduce the impact of the extreme events (e.g., storm surges); therefore, the vulnerability of beach bodies >15 m wide is very low. Beaches from 10–15 m present low vulnerability, 5–10 m moderate vulnerability, 2.5–5 m high vulnerability, and 0–2.5 m very high vulnerability to coastal changes.
Significant wave height H
S (d) has been simulated with the SWAN numeric model, which is the third generation model for application in coastal areas, based on Euler’s equilibrium equation of a spectral waveform [
46]. A JONSWAP wave spectrum with the parameter γ = 3.3 was used. A numerical simulation of waves was carried out in the wider area of Kvarnerić Bay, for waves from the NW (“tramuntana”) and SE (“jugo”) directions, for the 50-year return period. Relevant wind strengths for the numerical simulation (SE: 27.4 m/s, NW: 22.2 m/s) were taken from the wind climate study of the nearby Vinodol channel [
47].
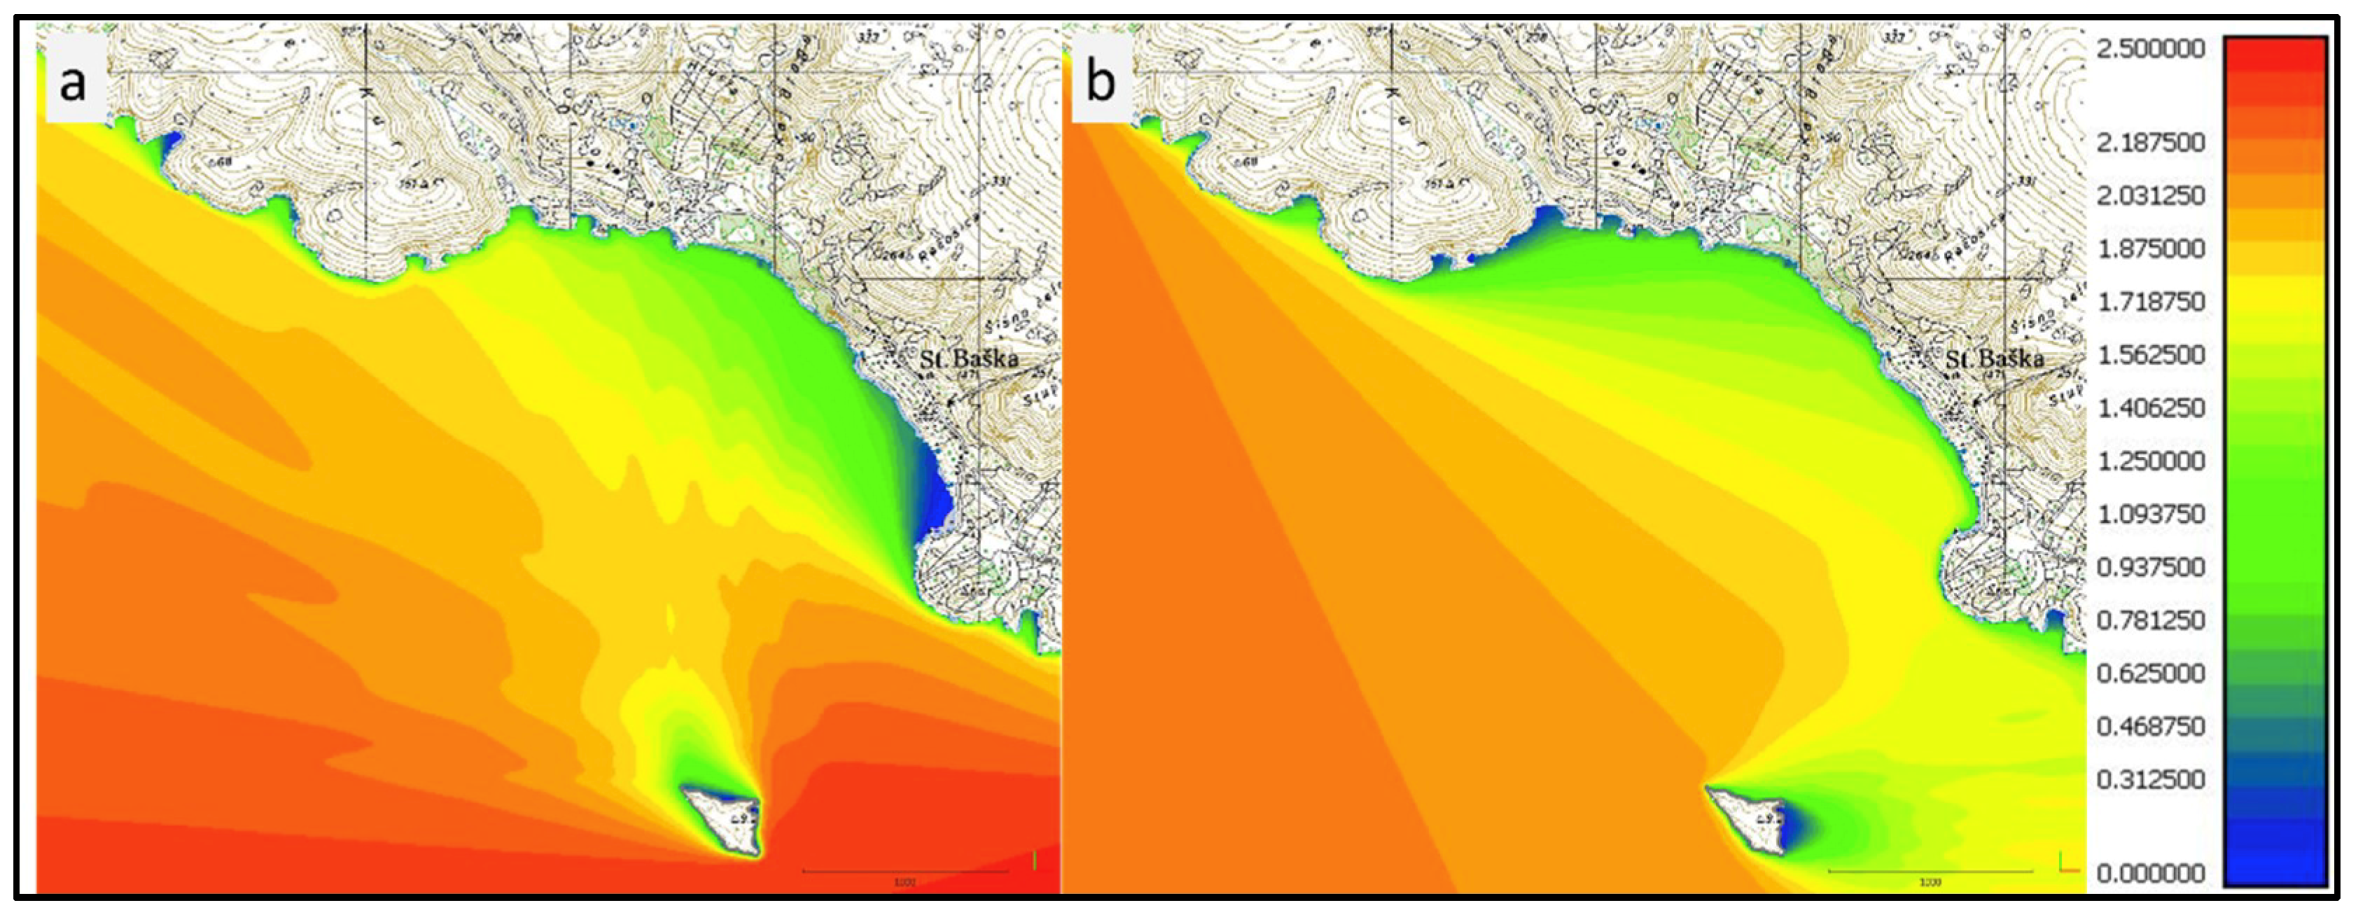
Figure 6 shows a significant wave height for a 50-year return period H
S50 from the SE and NW directions. Numerical simulations were carried out on two different scales, on a larger scale for a deep-water wave prediction (45 × 50 km, numerical cell 50 × 50 m) and for a local nearshore wave prediction (520 × 335 m, 10 × 10 m) on a smaller scale. This study used significant wave height because the major impact on the investigated coastline has high-impact, low-probability events [
48], and the measured wave data were unavailable.
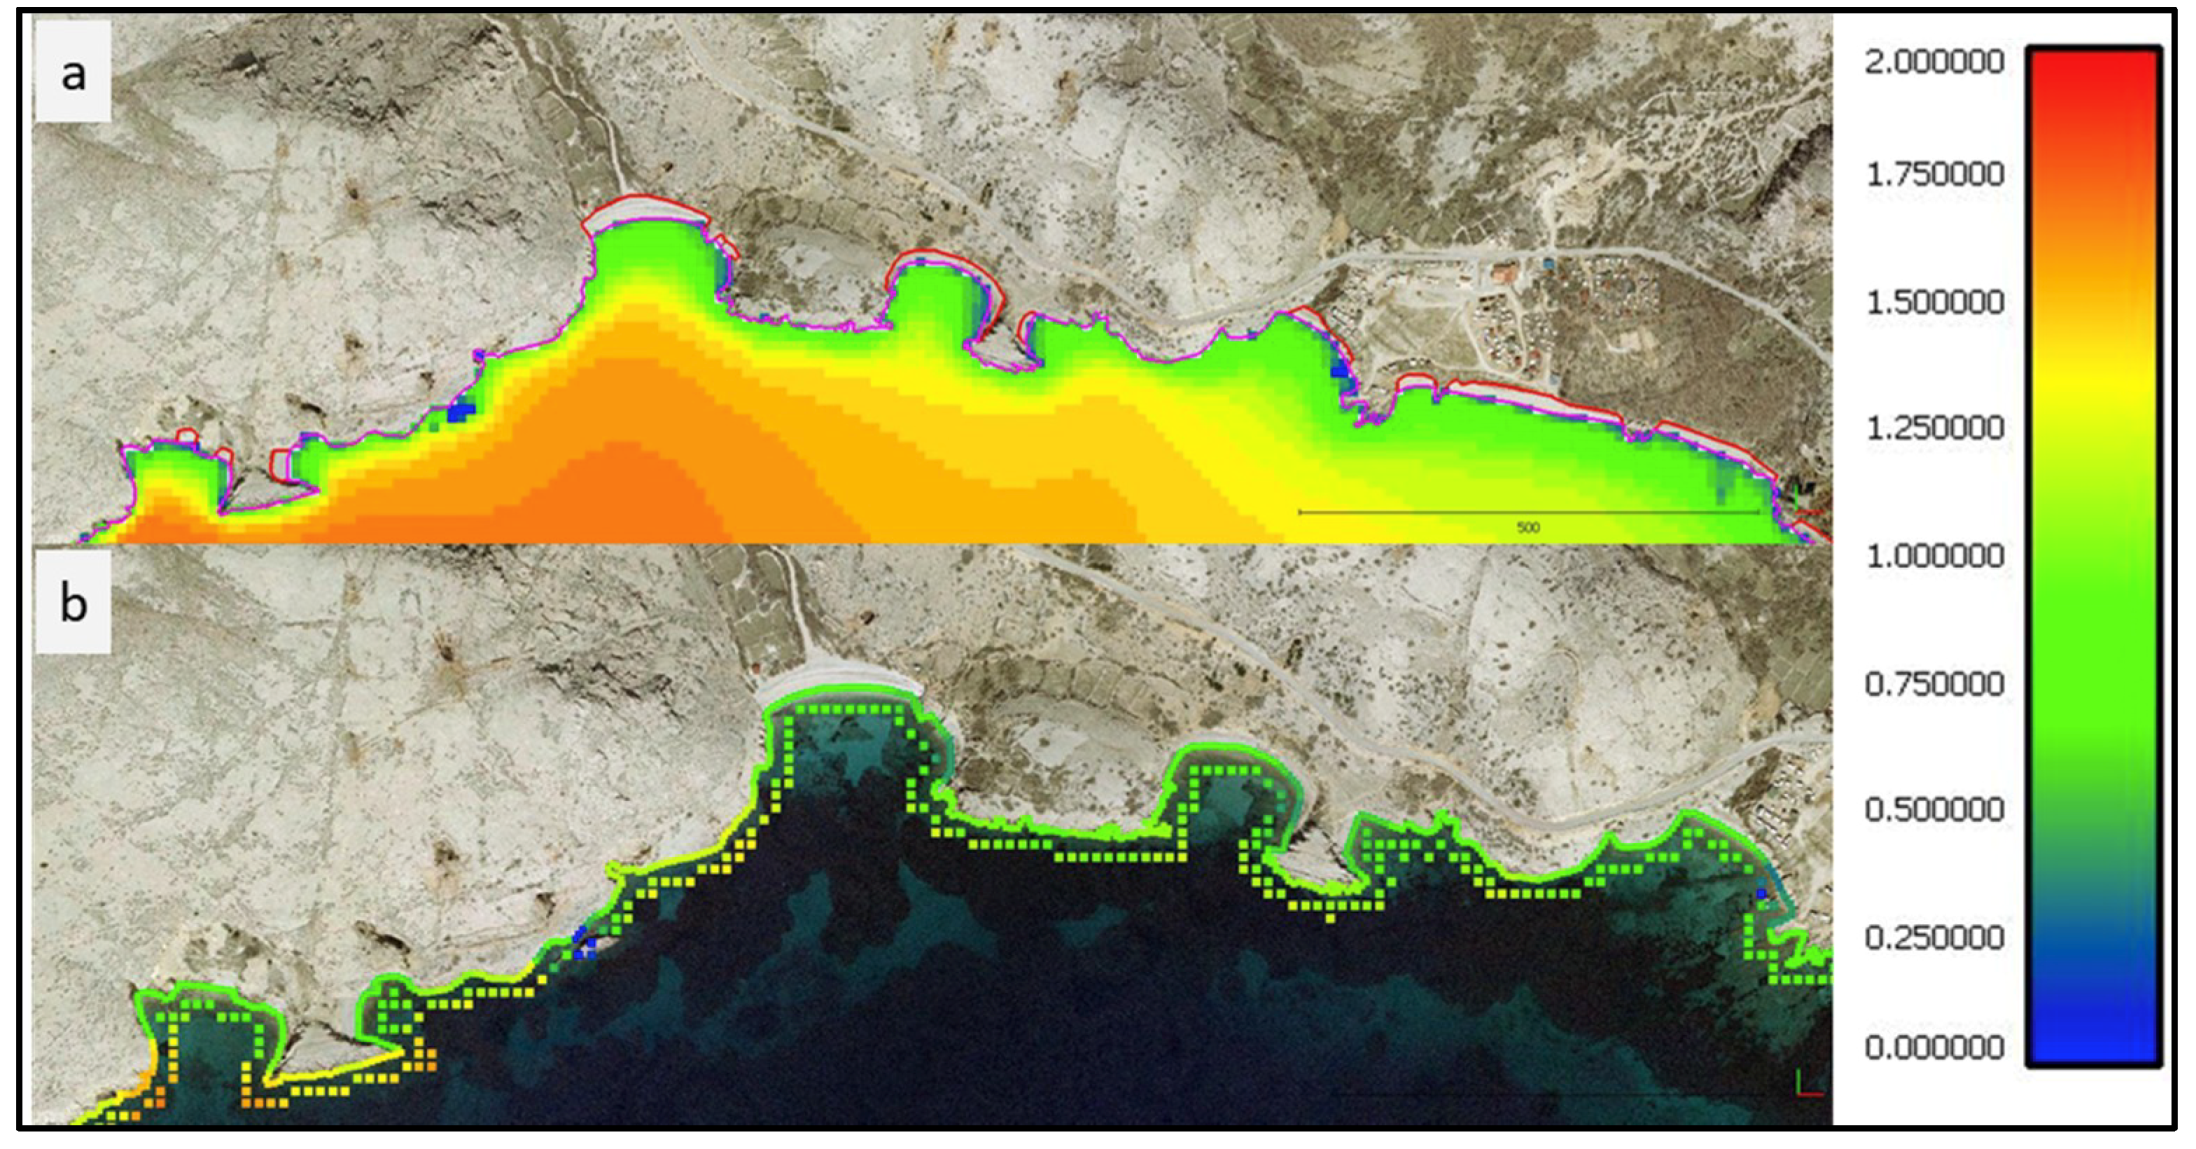
The relevant H
S for the estimation of the CVI is defined from the numerical wave simulations at a distance of 15 m from the defined coastline (
Figure 7). At the same point, the largest of the two wave heights from different directions (SE and NW) was taken into the further CVI assessment (
Figure 7b). Based on these calculations, the significant wave height’s influence on the coastal vulnerability was divided into five levels of vulnerability: very low (0–0.35 m), low (0.35–0.70 m), moderate (0.7–1.05 m), high (1.05–1.40 m), and very high (above 1.40 m).
Human intervention affects the coastal vulnerability, unfortunately mostly in a negative sense. Urbanization often includes poor construction, poor storm water drainage and wastewater disposal, traffic load, the load of different facilities, unplanned terrain and vegetation cutting, an increase of surface runoff along artificial materials, etc. This all increases the coastal vulnerability and makes this anthropological parameter the most difficult to assess. The land use parameter (e) was considered inside five levels of vulnerability to present anthropological factors influencing the coastal vulnerability. The classes were divided into: urban areas, touristic zones (i.e., a camping resort), beaches, areas covered by the Mediterranean vegetation type, and bare karst. Considering that the degree of vulnerability increases with the presence of an unfavourable human influence, the highest rate of vulnerability is in urban areas, decreasing to the bare karst areas. Bare karst areas are accompanied by islets and cliffs as measures of natural vulnerability adaptation, which decreases the influence of wave attacks on the coastline.
4. Results and Discussion
The degree of coastal erosion and, therefore, coastal retreat depends on different parameters related to the complex geological condition, coastal zone dynamics, anthropogenic influences, and extreme events, such as storms and storm surges. A separate analysis of each parameter on a point raster every 5 m enables an understanding of their importance for the narrow coastal zone as well as their joint influence on the overall coastal vulnerability.
The classes of the total CVI values have been determined as five vulnerability categories (
Table 2): “very low” (blue), “low” (green), “moderate” (yellow), “high” (orange), and “very high” (red). The minimum calculated CVI value for the investigated area is 1.41, the maximum is 31.62, the mean is 11.48, and the median is 8.22.
Table 3 shows the specific relative vulnerability variable inside the defined categories. These value ranges are not fixed and can be adapted to individual field conditions.
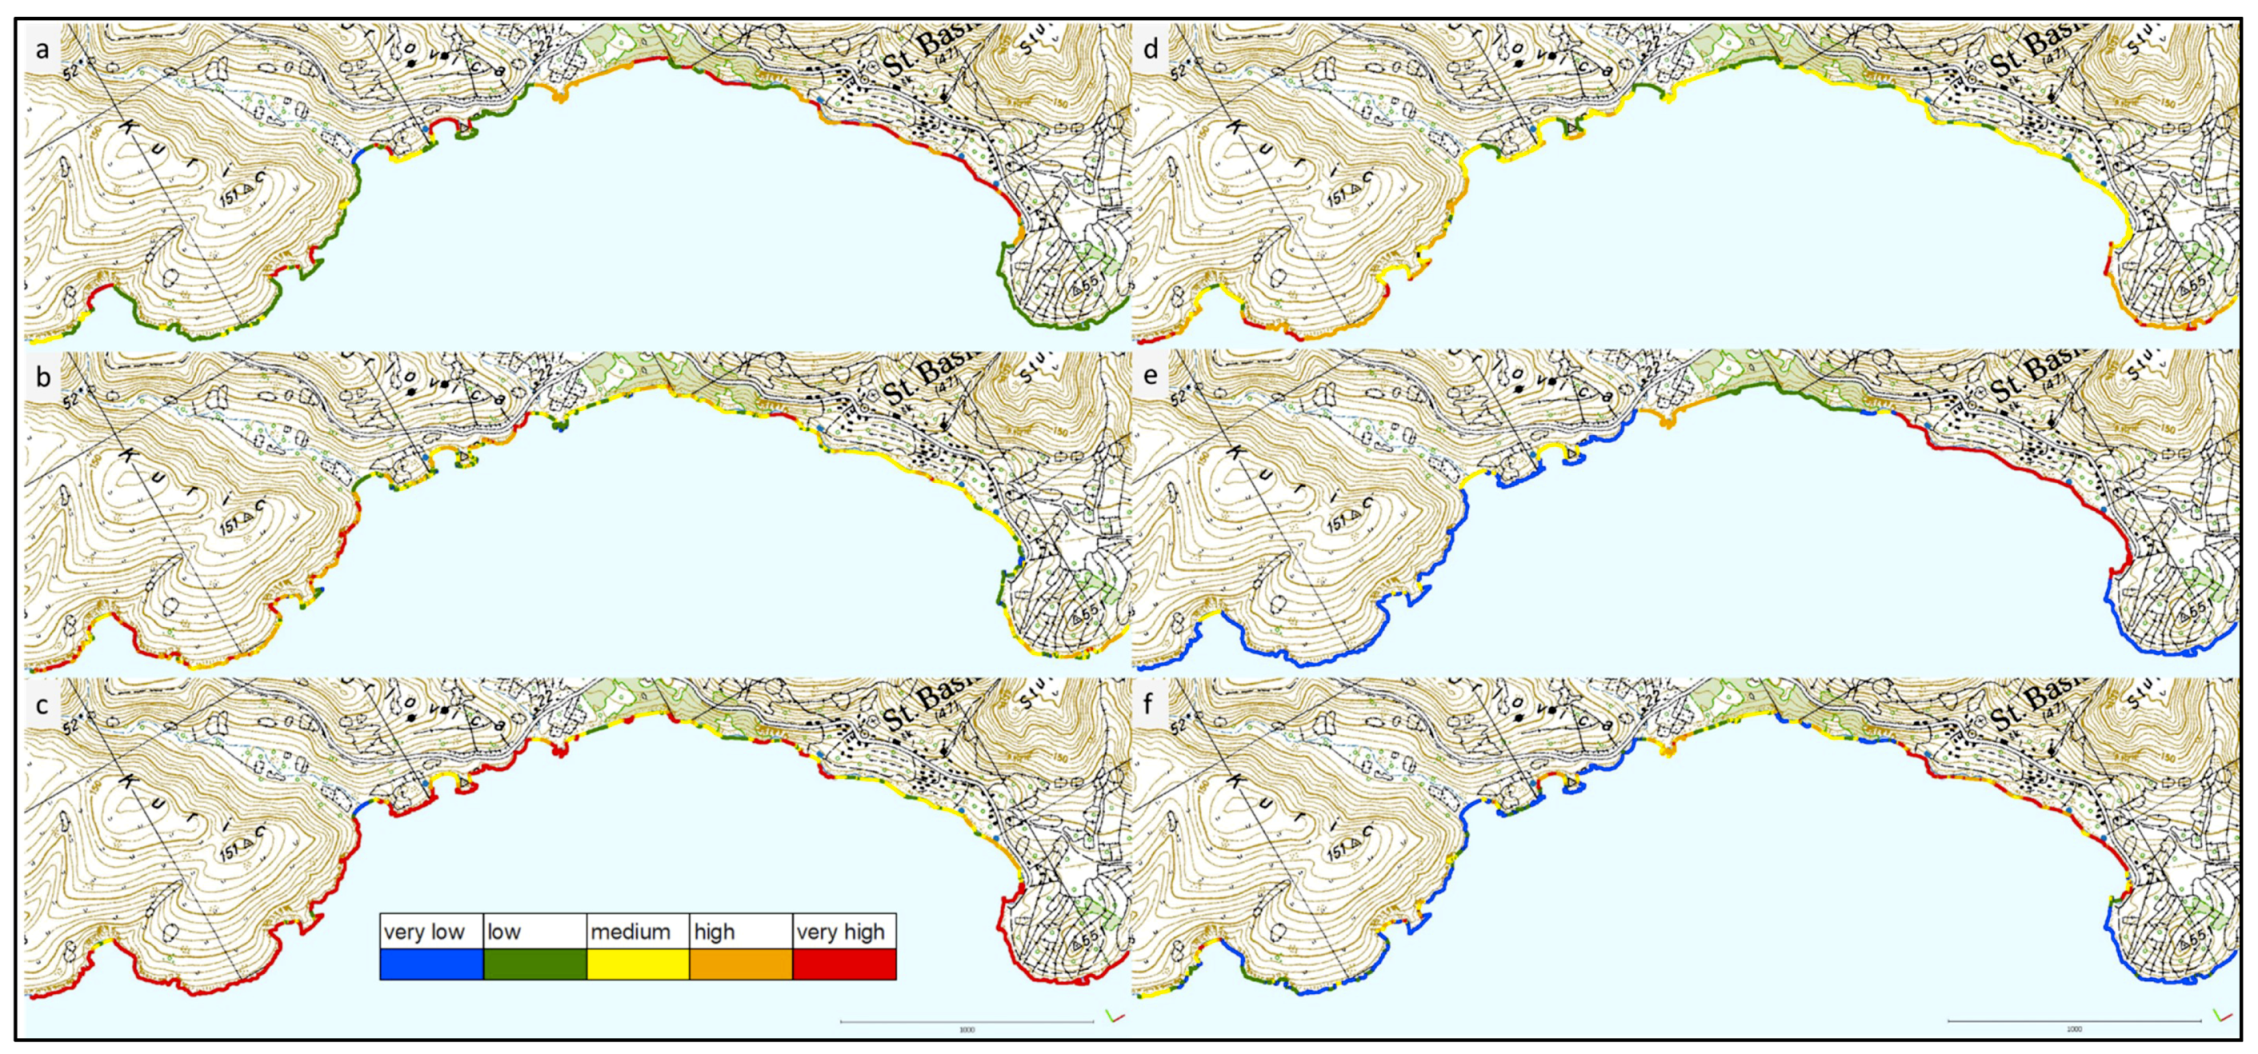
Figure 8 shows the vulnerability value associated with each of the five variables and the total calculated CVI values. The presented results show significant vulnerability variation. More than 50% of the geological fabric parameter includes low and very low vulnerability because bare karst covers the majority (58%) of the research area. Karst is characterized by a high GSI index of carbonate rocks and low runoff. Coastal slope values vary between 0.5° and 90°; the calculated mean coastal slope is 34.4%, while most coastal slopes (61%) have moderate to high vulnerability. The simulated significant wave height 15 m from the coastline varies from 0 to 1.70 m. The majority of the significant wave variable includes high and moderate vulnerability. Most of the research area has no emerged beaches; therefore, most of the beach width (70%) has a very high vulnerability. More than 18% of the investigated coastline is populated, and is assigned the very high vulnerability.
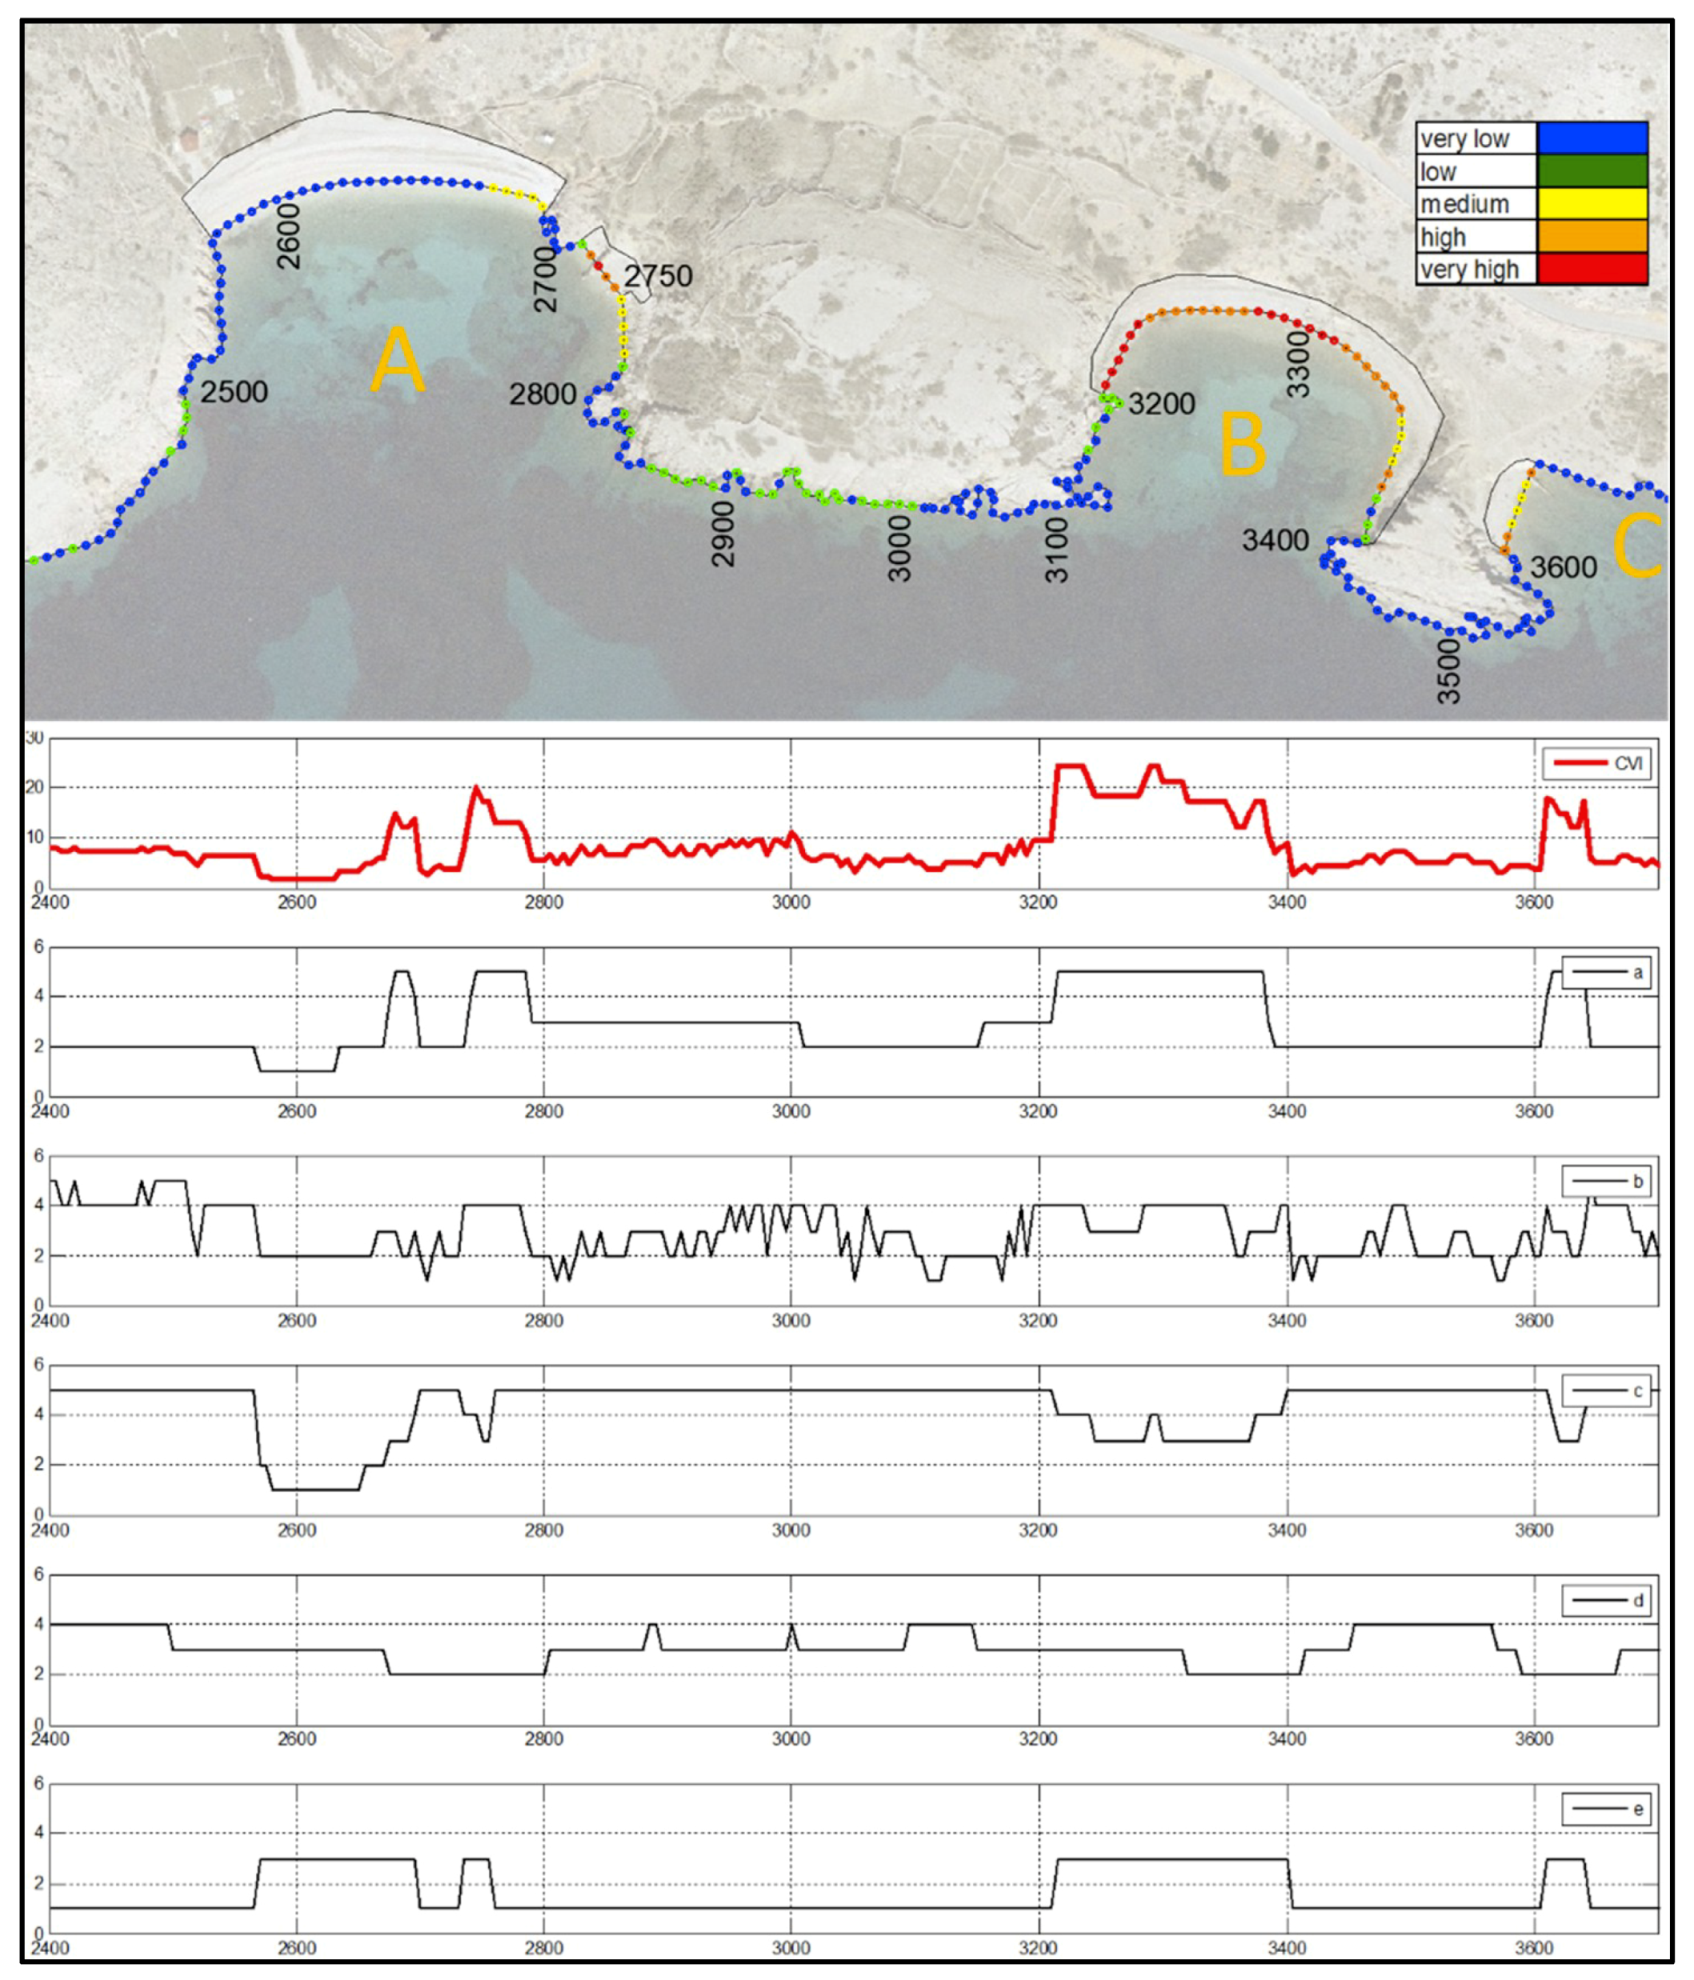
The influence of the local geological fabric and coastal relief on the CVI values is described at the location in the northwestern part of the research area (
Figure 4 and
Figure 9). High CVI values are calculated around coastal station 2750, where flysch bedrock is present. Beaches located in this part of the cove (
Figure 9a) protect the coast from the SE waves, but their positive influence is negligible around the highly weathered flysch rock mass susceptible to instabilities. The majority of cove B (
Figure 9 and
Figure 10) has a high and very high CVI. Although this part of the coast is sheltered, most of the wave energy dissipates on a shallow coast in front of the beach. The poor geological characteristics and high coastal slopes make this part very vulnerable. The scale of the available data, with segmental description, is not adequate for such complex and variable conditions.
Figure 10 shows the complexity of the research area, where significant differences in geological and morphological features can be found at one single micro-location. The vulnerability ranges from very low to very high inside a distance of 100 m. This makes a vulnerability analysis extremely complex, and also explains the need for a novel CVI analysis approach.
A high-resolution point cloud delivered from a UAV should significantly improve coastal vulnerability assessments. It would provide more precise data of the beach width and slopes, geology, shallow water bathymetry, coastal slopes, etc. [
49,
50,
51,
52,
53,
54,
55,
56]. Such precise data have sufficient sensitivity to simulate waves for different sea levels, and, furthermore, to calculate the corresponding coastal vulnerability for the possible sea-level rise, or beach body erosion. The CVI value is also high in cove C, where the rock mass is highly disintegrated and includes zones of crushed limestone and flysch rock mass (
Figure 10).
The highest CVI index was found in the urban area around Stara Baška (
Figure 8 and
Figure 11) where flysch rock mass (very high vulnerability) prevails in combination with an unfavourable anthropological influence. These results are in line with the previous research performed in this area, which instills confidence in the validity of the CVI map proposed here. Waves around that part of the coast are generally moderate (
Figure 6). The gravel beach, which absorbs most of the wave’s mechanical energy under normal conditions, has a positive influence on the CVI. Erosion of the emerged beaches would significantly increase the CVI, and the populated area in Stara Baška may become vulnerable to possible instabilities. Furthermore, during extremely high water levels, waves reach the slope’s toes and can contribute to local instabilities. This is an additional argument for the systematic monitoring of natural and artificial beaches on the CEAC as a basis for the integrated coastal zone management in Croatia, as emphasized by Pikelj [
17].
At the camping resort location, between coastal stations 4000 and 4500, the calculated CVI ranges from high to very high. These results only partially agree with previous research, based on the three-dimensional (3D) point cloud delivered from Structure from motion (SfM) photogrammetry [
21,
25]. Point cloud data enabled detailed analysis of a single cliff’s stability based on its undercut geometry and geology. This paper is based on data and a methodology that are not adequate to analyze such problems. Such potentially dangerous coastal segments should be analyzed through a complex geological engineering analysis based on a detailed point cloud data. Torresan et al. (2008) also pointed out the need to describe coastal systems and coastal dynamics in detail, and to use more complex and data-intensive models, and more site-specific metrics and indicators in coastal vulnerability assessments at the regional scale. However, results presented through this paper evidence the necessity of the awareness and need to improve data availability and to develop an adequate methodology to monitor relevant parameters, in order to define adequate risk management strategies and to consider their advancement with time.
5. Conclusions
This paper proposed a methodology for CVI formulation at the CEAC, which is characterized by a complex geomorphology. Due to data availability, it considers only five variables. The presented methodology detected the most vulnerable coastal segments, which is essential to implementation of appropriate spatial and temporal monitoring. Furthermore, novel elements for the parametric analysis (shoreline slopes, emerged beach width, and significant wave height) were presented for the coastal environment of CEAC, with possible applications to similar complex rocky slopes all over the world.
Complex geological features, coastal morphology, and active marine erosion in some parts of the investigated area called for adaptation of the existing approaches. The presented CVI calculation gives priority to the geological fabric as the most important driver of negative coastal changes. The proposed formulation takes the square of the geological fabric, enabling us to split it into two vulnerability factors (e.g., cliff and slope stability conditioned on the mechanical parameters of the rock and shoreline erosion/accretion rates) in a more detailed analysis. However, the presented results point out the importance of the joint effect of all considered parameters in an analysis of their single importance on the coastal vulnerability. This research also emphasizes the lack of wave measurements and precise geological and coastal data.
In the investigated area, higher coastal slopes were found to be more vulnerable than the lower ones, which was evidenced in previous studies of the investigated location. The vulnerability of coastal areas lower than 1.5 m is negligible. These are mostly gravel beaches that have good hydraulic resistance to wave action. Because of that fact, the predicted sea level rise will not have a significant impact on coastal flooding. A sea-level rise and an increase in the rainfall intensity might destabilize coastal slopes and make the coastal area more vulnerable, especially the steep and weathered flysch rock mass and unstable breccias.
The presented CVI map’s reliability was tested by comparing the results to previous field investigations. In the majority of the investigated area, the results are in line with observed field conditions, as shown in the presented areal images of the selected locations. The CVI map’s uncertainty was detected on a coastal segment with notched cliffs. Additional investigations based on a 3D point cloud are needed in such locations.
The presented methodology for CVI assessment was adapted to the specific natural conditions of the research area on the southeastern coast of Krk Island and presents a valuable contribution to the development of a strategy for coastal zone management, which will be especially important due to expected climate changes. The results suggest that there is a need to establish coastal monitoring of the urbanized zone of the Stara Baška settlement where landslides may occur as a result of a progressive coastal erosion.


