Article

Nanoindentation Studies of Plasticity and Dislocation Creep in Halite

by
Christopher A. Thom
* and
David L. Goldsby
Department of Earth and Environmental Science, University of Pennsylvania, Philadelphia, PA 19104, USA
*
Author to whom correspondence should be addressed.
Geosciences 2019, 9(2), 79; https://doi.org/10.3390/geosciences9020079
Submission received: 31 December 2018 / Revised: 1 February 2019 / Accepted: 3 February 2019 / Published: 6 February 2019
(This article belongs to the Special Issue Micromechanics of Reservoir and Cap Rocks)

Abstract

:
Previous deformation experiments on halite have collectively explored different creep mechanisms, including dislocation creep and pressure solution. Here, we use an alternative to conventional uniaxial or triaxial deformation experiments—nanoindentation tests—to measure the hardness and creep behavior of single crystals of halite at room temperature. The hardness tests reveal two key phenomena: (1) strain rate-dependent hardness characterized by a value of the stress exponent of ~25, and (2) an indentation size effect, whereby hardness decreases with increasing size of the indents. Indentation creep tests were performed for hold times ranging from 3600 to 106 s, with a constant load of 100 mN. For hold times longer than 3 × 10⁴ s, a transition from plasticity to power-law creep is observed as the stress decreases during the hold, with the latter characterized by a value of the stress exponent of 4.87 ± 0.91. An existing theoretical analysis allows us to directly compare our indentation creep data with dislocation creep flow laws for halite derived from triaxial experiments on polycrystalline samples. Using this analysis, we show an excellent agreement between our data and the flow laws, with the strain rate at a given stress varying by less than 5% for a commonly used flow law. Our results underscore the utility of using nanoindentation as an alternative to more conventional methods to measure the creep behavior of geological materials.

1. Introduction

Quantifying the deformation behavior of halite has been an active area of study for several decades, due largely to interest in nuclear waste storage and hydrocarbon exploration. While the goal of many authors has been to understand the large-scale behavior of salt bodies in the Earth [1,2,3], others have aimed at understanding the fundamental microphysical mechanisms that give rise to creep, plasticity, and frictional sliding of halite [4,5,6,7,8,9,10,11,12,13,14,15,16,17,18,19,20,21,22,23,24,25,26]. The development of flow laws for various creep mechanisms in halite, and characterization of their associated microstructures, allows for reliable extrapolation of laboratory-derived behavior to natural conditions.
Many studies have explored dislocation creep in polycrystalline halite [4,5,6,7,8,9,10,11,12]. The rate-limiting process in the dislocation creep regime, up to temperatures of 200 °C, is believed to be either dislocation climb [4,5,13] or cross-slip of screw dislocations [6,10,14,15,16], but definitive evidence has not been obtained for either mechanism [2,10]. The dislocation creep rate can be described by an equation of the form
ε ˙ = A σ n exp ( Q R T ) ,
where ε ˙ is the strain rate, A is a constant, σ is differential stress, n is the stress exponent, Q the activation energy, R the gas constant, and T absolute temperature. Dislocation creep in polycrystalline halite is characterized by n = 5–7 (typically n ≈ 5) and Q = 50-130 kJ/mol (typically Q is in the range of 50–70 kJ/mol) [4,5,6,7,8,9,10,11,12,17,18]. Dislocation-creep experiments have been typically conducted at elevated temperatures in the range 60–400 °C, and confining pressures up to 200 MPa to avoid fracturing the samples.
Although dislocation creep has been studied extensively, it is not the only mechanism by which halite can deform in the laboratory or in nature. Several studies have investigated pressure solution in the laboratory and argued that it is the dominant creep mechanism at natural geologic conditions [19,20,21,22,23]. Pressure-solution creep is grain size-sensitive, and can be described using a flow law of the form
ε ˙ = A σ n d p exp ( Q R T ) ,
where d is grain size and p is the grain size exponent, equal to 3. All other parameters in Equation (2) are the same as defined previously, but with different parameter values corresponding to the pressure solution mechanism. Pressure solution is observed experimentally at relatively low stresses and elevated temperatures with a characteristic value of n = 1. Pressure solution may dominate the deformation of halite in nature when fluids are present at low stresses and elevated temperatures.
At relatively large differential stresses, plasticity becomes the dominant deformation mechanism. A number of studies have investigated the transition from ductile deformation of halite at low shearing velocities to frictional sliding at higher slip speeds [24,25,26]. At low shearing velocities, Shimamoto reported a stress exponent of approximately 17 [25], a value indicative of deformation limited by dislocation glide.
Most studies of creep and plasticity of halite have employed uniaxial or triaxial apparatuses to deform macroscopic samples. While the data from such experiments are relatively simple to interpret, significant effort is required to prepare relatively large samples with uniform microstructures, maintain high temperature and high confining pressure to suppress fracture of the sample, and apply the large differential stresses and high strain rates required to measure plasticity. In this study, we explored the rheological behavior of halite at room temperature using nanoindentation. As demonstrated below, the relatively easy-to-perform indentation experiments yield data for halite that are comparable to those obtained using more conventional apparatuses.

2. Methods

To measure the hardness and creep behavior of halite single crystals, we performed a variety of nanoindentation tests at low relative humidity (<15%). Although not often used to study geological materials, nanoindentation is a well-established technique in engineering and materials science for measuring the hardness of metals and ceramics [27,28]. Several indenter geometries are commonly used; we employed two different diamond Berkovich (three-sided pyramidal) indenter tips to measure indentation hardness, which is proportional to the yield stress [29,30,31,32]. By measuring the maximum applied load Pmax, the maximum indentation depth hmax, and the contact stiffness S from the unloading curve, the contact depth hc can be determined using the Oliver‒Pharr method [27,28]
h c = h m a x ε b P m a x S ,
where εb is a constant associated with the geometry of the indenter (equal to 0.75 for a Berkovich indenter). The projected contact area Ac of the indenter is a function of hc, which is calibrated using a fused-silica standard prior to the experiments. The hardness H is defined as the maximum applied load divided by the projected contact area of the indenter:
H = P m a x A c .
We can also compute the effective Young’s modulus of the tip-sample contact (Eeff) from
E e f f = π S 2 β A c ,
where β is a constant with a value close to unity. To determine the Young’s modulus Es of the sample, we employ the relation
1 E e f f = 1 ν s 2 E s + 1 ν i 2 E i ,
where ν is Poisson’s ratio and the subscripts s and i refer to the sample and indenter, respectively. Thus, we determine the Young’s modulus of the sample using the known elastic constants of the diamond indenter and an assumed Poisson’s ratio of 0.25 for the sample.
The Oliver‒Pharr method described above produces only one measurement of the hardness and elastic modulus per test, which is determined from the slope of the unloading curve at peak load, at the maximum contact depth. Thus, measuring the depth-dependent hardness and modulus of the material requires numerous experiments or additional testing techniques. Using the so-called continuous stiffness method (CSM), we determined the hardness and modulus continuously at all depths in a single indent [28,33]. For hardness tests using the CSM, we apply a 100-Hz sinusoidal oscillation of the tip displacement (with a typical amplitude of 2 nm) and measure the resulting sinusoidal force response and the phase lag between displacement and force, allowing the contact stiffness, and thus the contact area, hardness, and elastic modulus, to be determined continuously a single test. In our nanoindentation creep tests, we used the CSM to impose a constant sinusoidal oscillation of the load of typically 2 mN about a nominally constant applied load of 100 mN and measured the resulting displacement and phase lag. Using the CSM, the contact stiffness is determined over time scales (<0.01 s) too small for significant thermal drift to occur, allowing long-duration creep tests (up to 106 s in this study) to be conducted.
We performed nanoindentation hardness tests by loading the sample at constant P P ˙ , where P is the applied load and P ˙ its time derivative. Several different values of P P ˙ were used in this study to determine the effect of loading rate and strain rate on the measured hardness.
For both the hardness and creep tests, we define the indentation strain rate ε i   ˙ as
ε i ˙ = 1 h c d h c d t ,
where d h c d t is the time-derivative of the contact depth. For the hardness tests and the initial stages of the creep tests, the strain rate can be calculated directly from the measured contact depth using Equation (3). However, for longer hold times, thermal drift of the instrument is problematic, and hc must be determined in a different manner. Using the known modulus of the sample measured in the hardness experiments, we can rearrange Equation (5) to solve for the contact area as a function of stiffness.
A c = π S 2 4 β 2 E e f f 2
For these experiments, we use an area function of the form
A c = C 1 h c 2 + C 2 h c + C 3 h c 1 2 +   ... +   C 7 h c 1 32 ,
where C1, C2, C3C7 are constants determined from calibrations obtained from indentations on fused silica. This method allows us to directly determine the contact depth, hc, and therefore the strain rate, from the continuous stiffness measurements made during long-duration creep tests.
We also determine the stress applied to the sample during the hold using a similar method. The hardness (stress) on the sample is the applied load divided by the projected contact area of the indenter tip. Thus, we also determine the stress using the contact area calculated from Equation (8).

3. Results

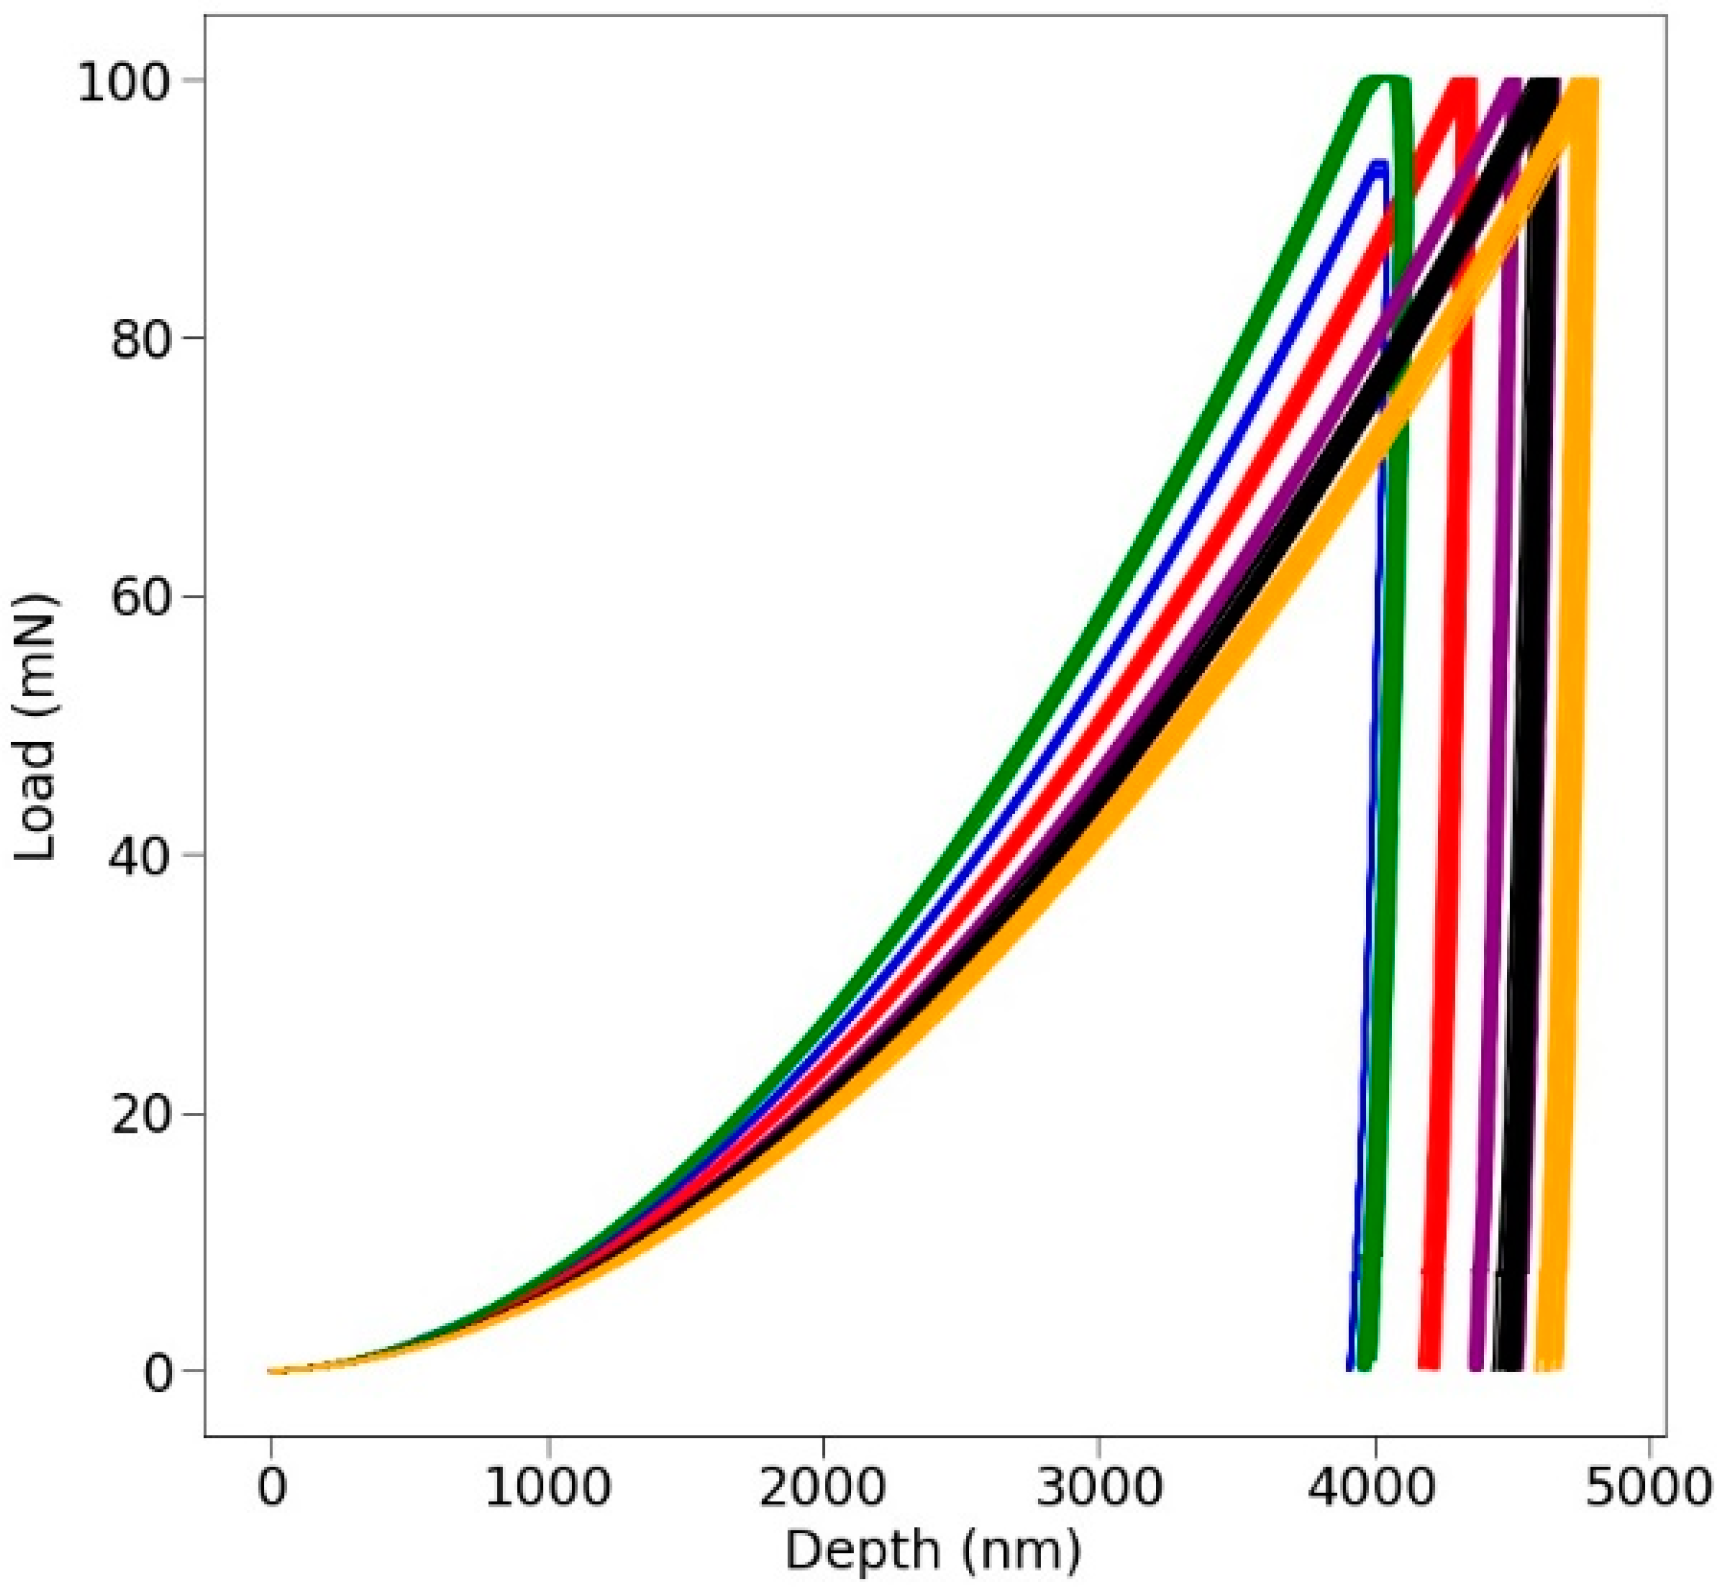
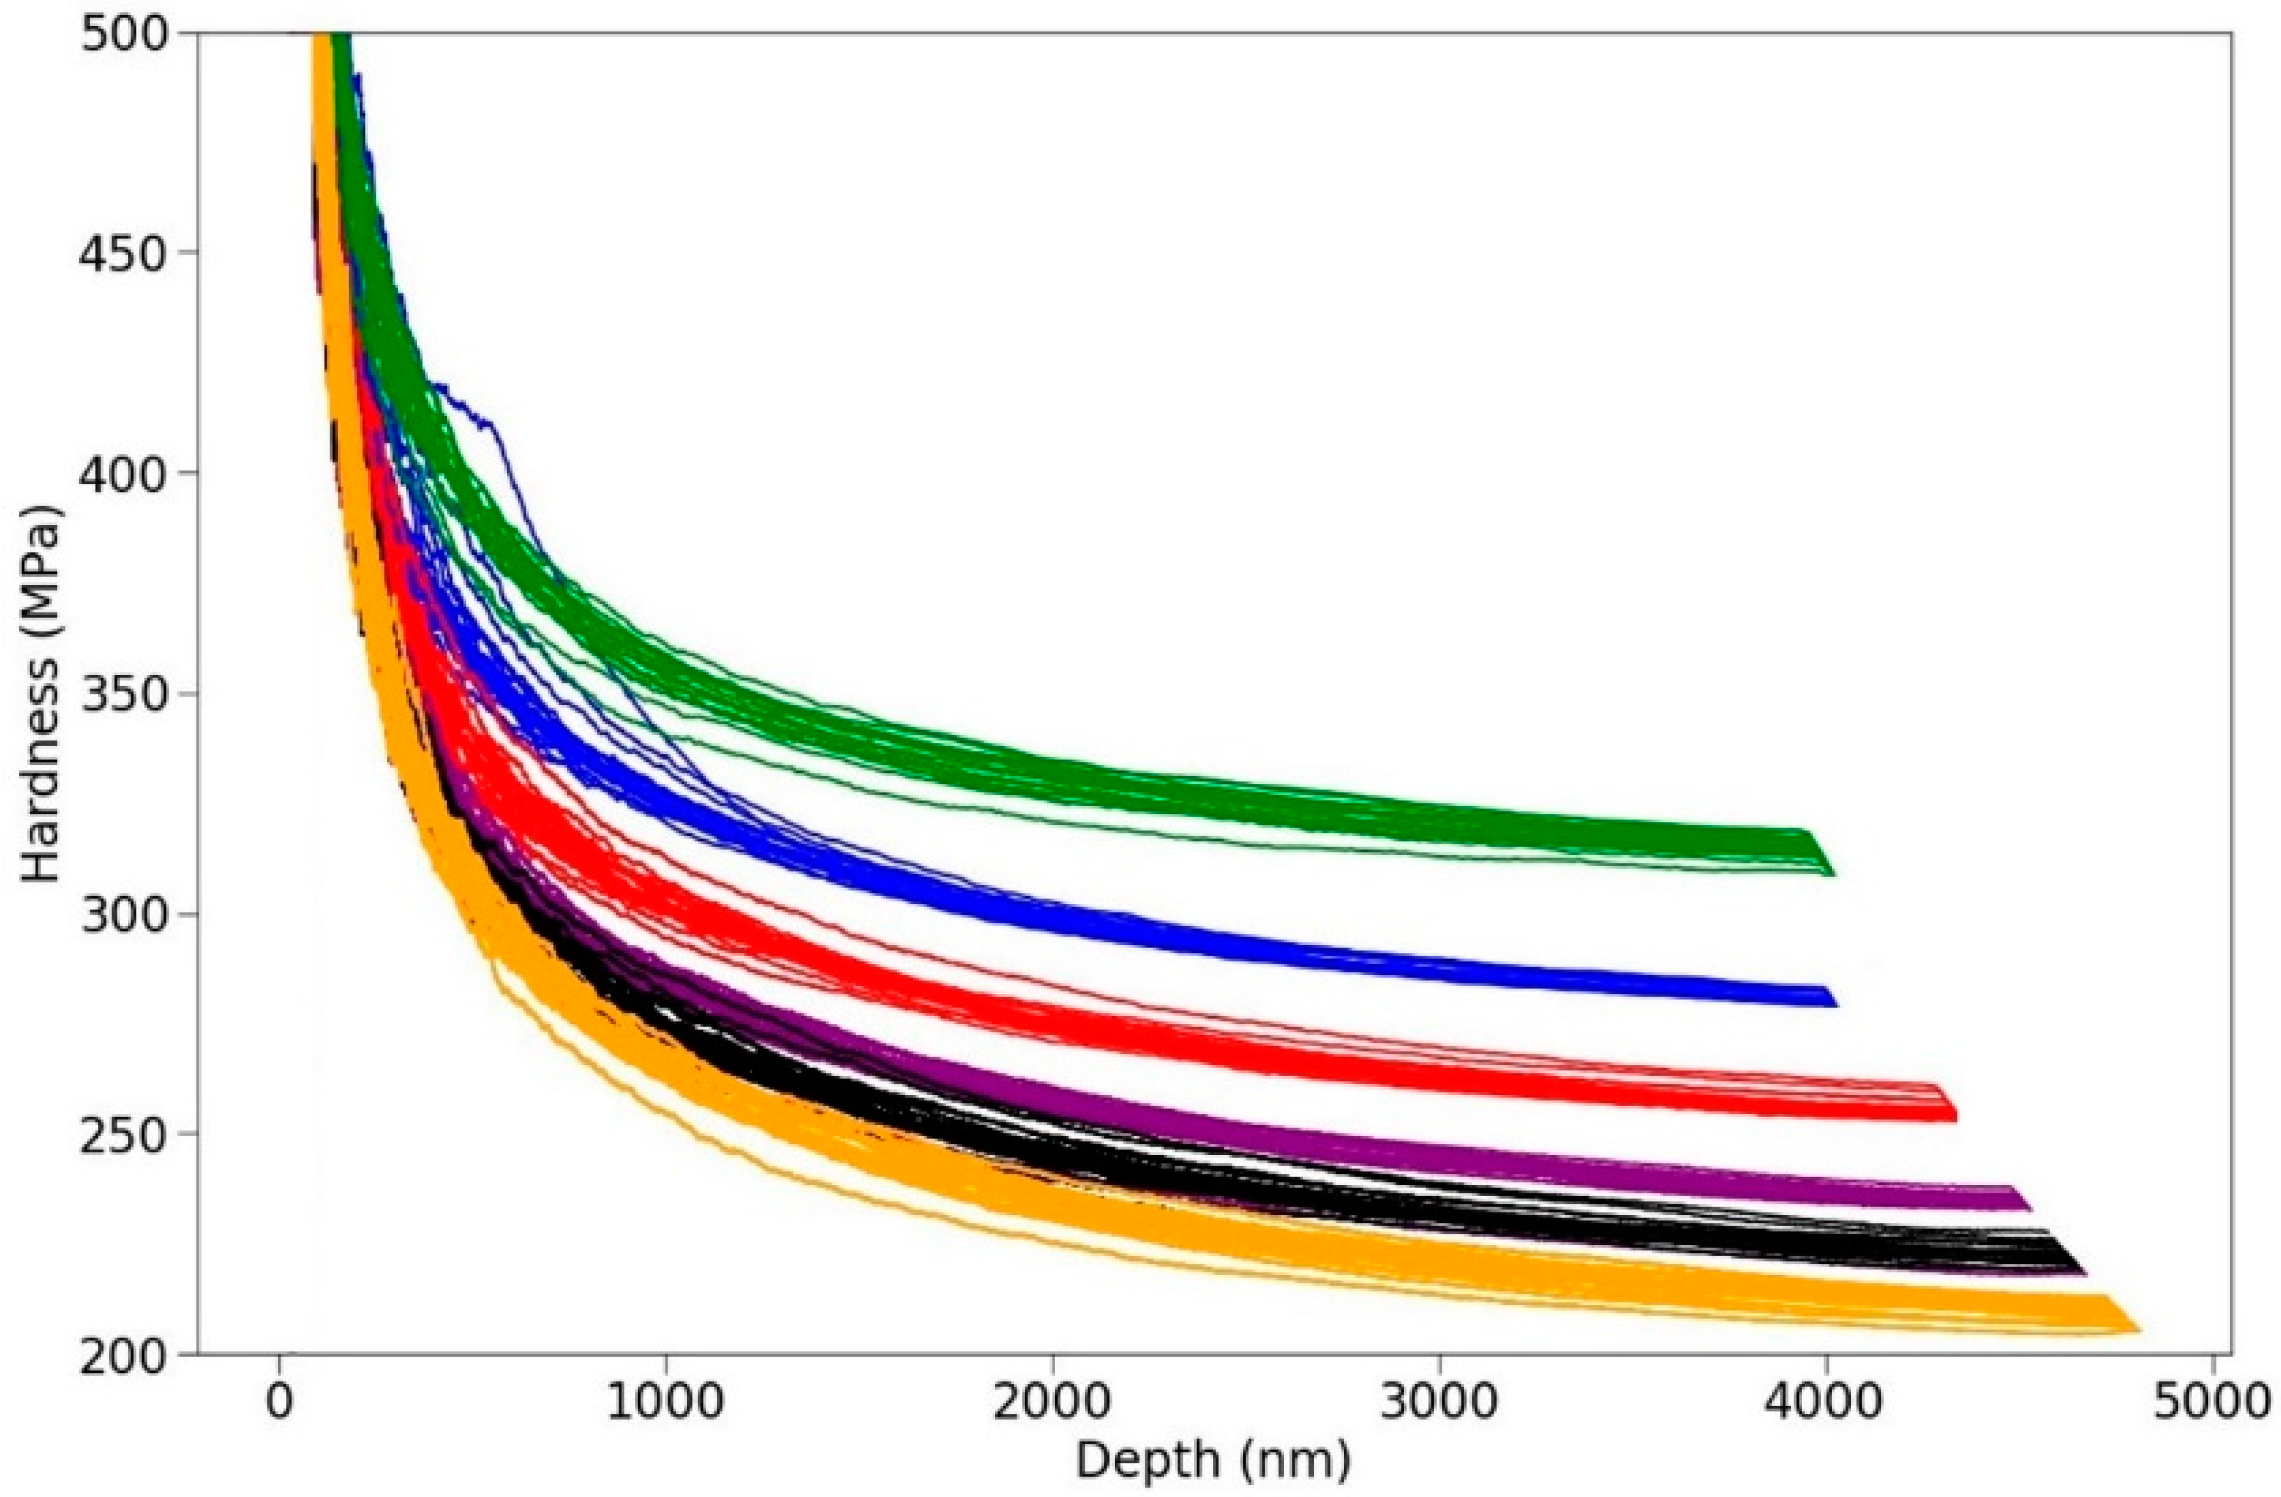
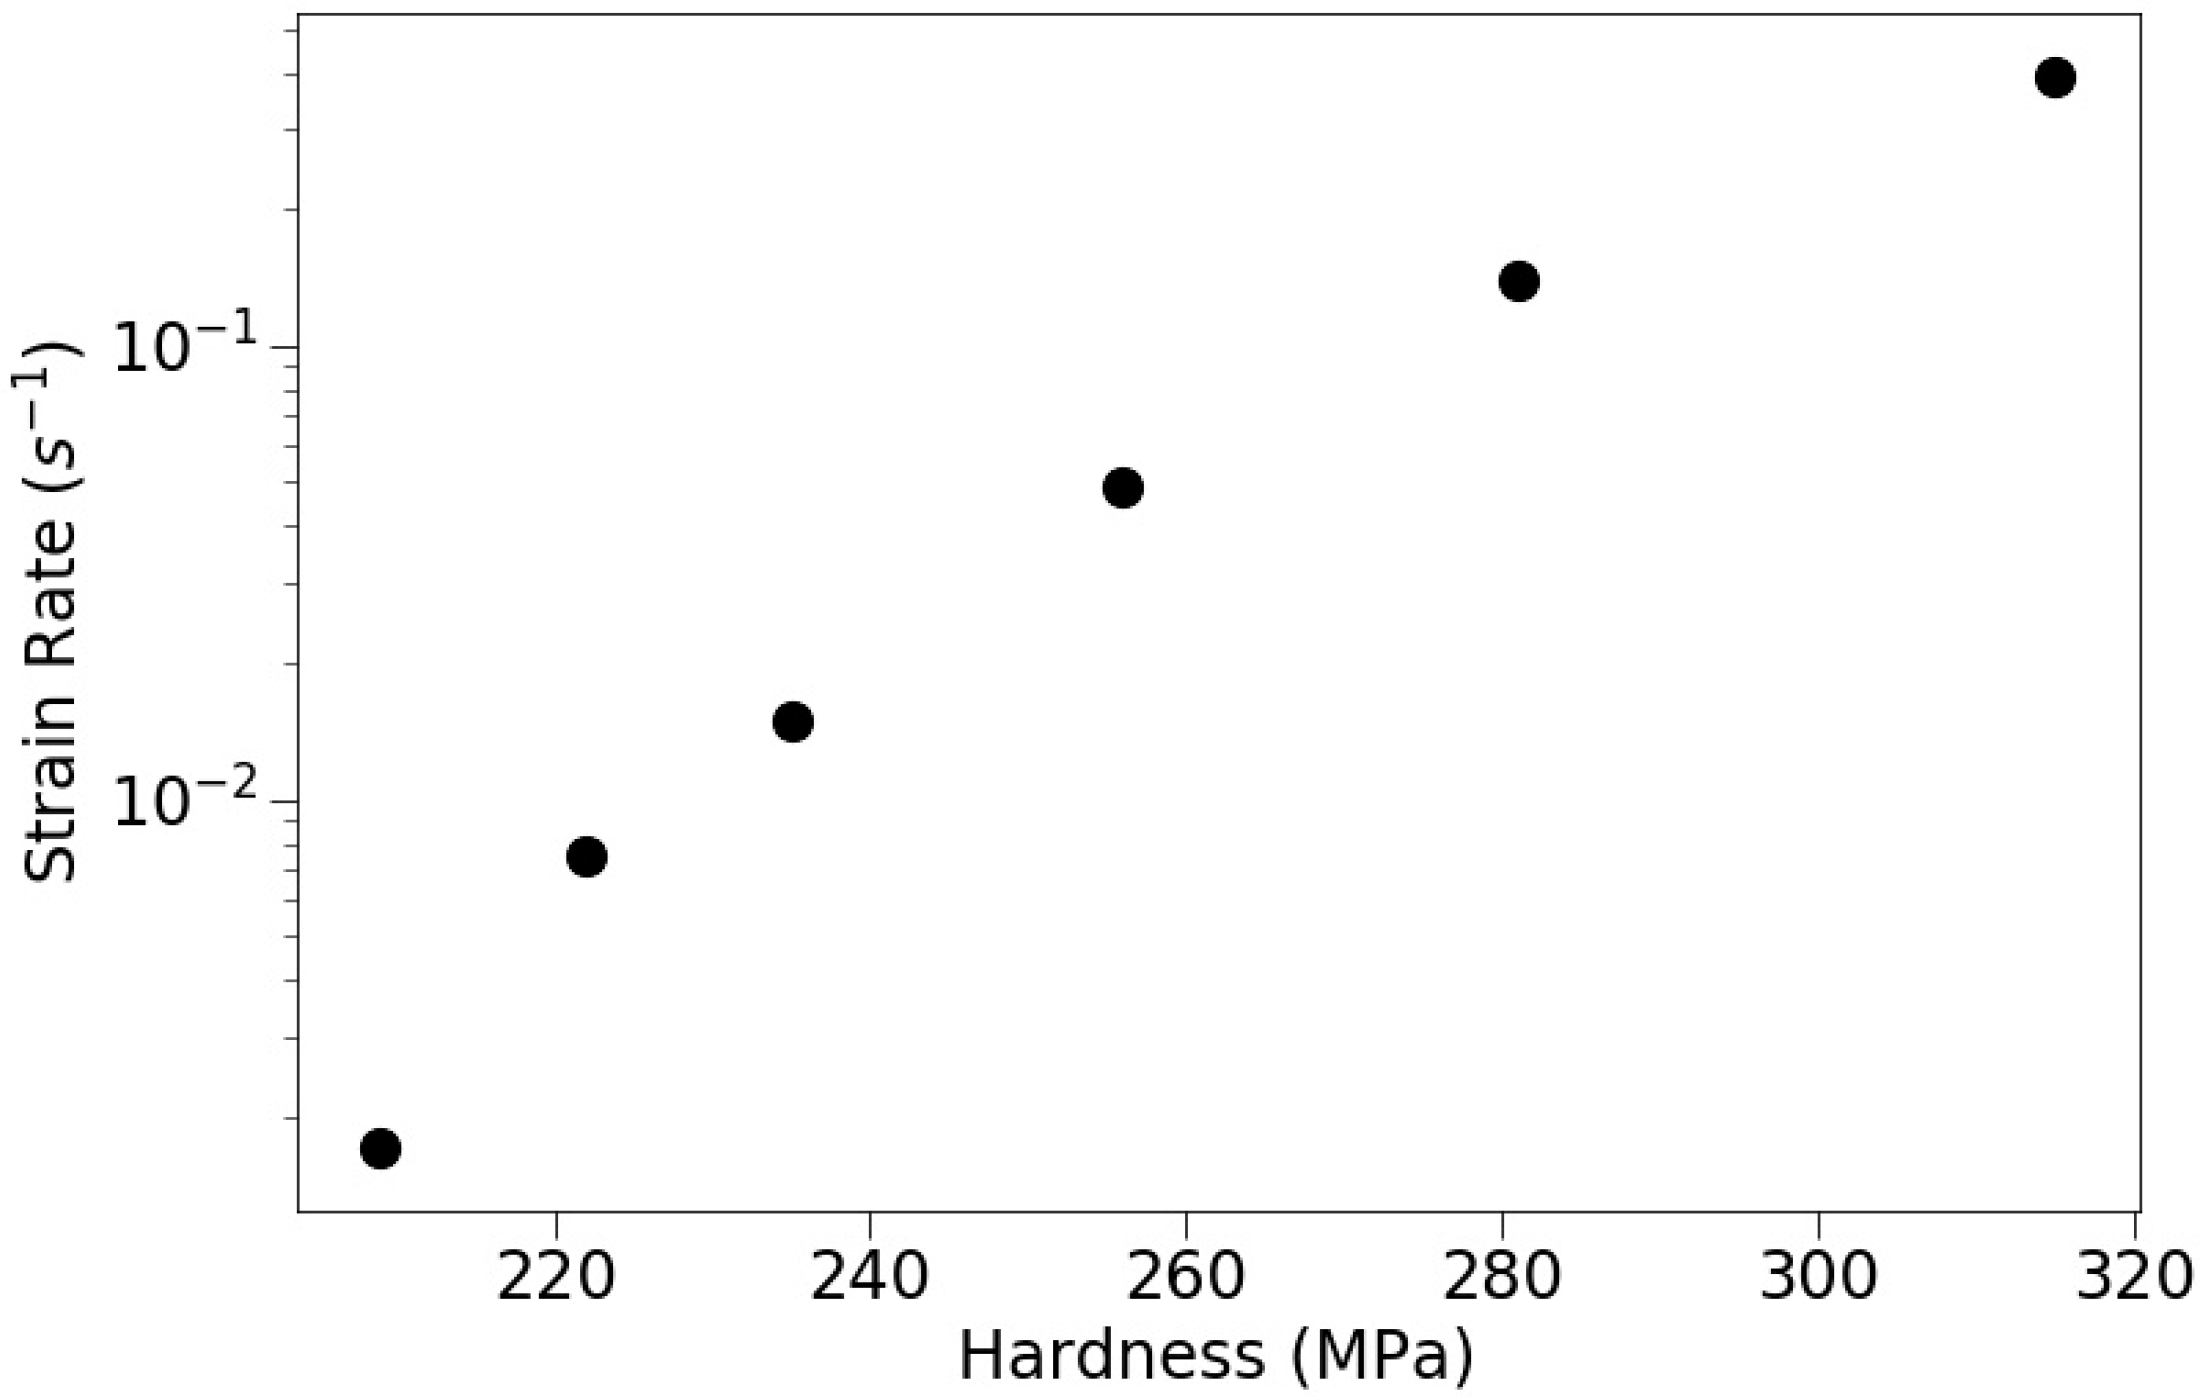
3.1. Constant Strain Rate Experiments

Constant strain rate tests were performed at a range of strain rates varying over two orders of magnitude. Figure 1 shows the load vs. depth curves for a total of 116 hardness tests performed using 6 different target values of P P ˙ . Six distinct clusters of curves, each with a different color, reflect the results obtained at different target strain rates. The hardness as a function of depth is shown in Figure 2 for all the tests, color-coded by the target strain rate. A significant indentation-size effect is observed for all experiments, wherein the measured hardness decreases with the increasing size of the indents. This is a well-established phenomenon in engineering materials [34] and has been observed for a number of geologic materials [31,32,35]. We determined the hardness at a depth of 4000 nm, at which all tests reached a steady-state strain rate, and the indents are deep enough that the indentation-size effect is negligible. In Figure 3, we plot the average indentation hardness at a given strain rate at depth of 4000 nm against the steady-state indentation strain rate. The data clearly show a strain-rate dependence of the hardness, similar to materials such as indium and selenium [36,37], with a stress exponent of ~25.

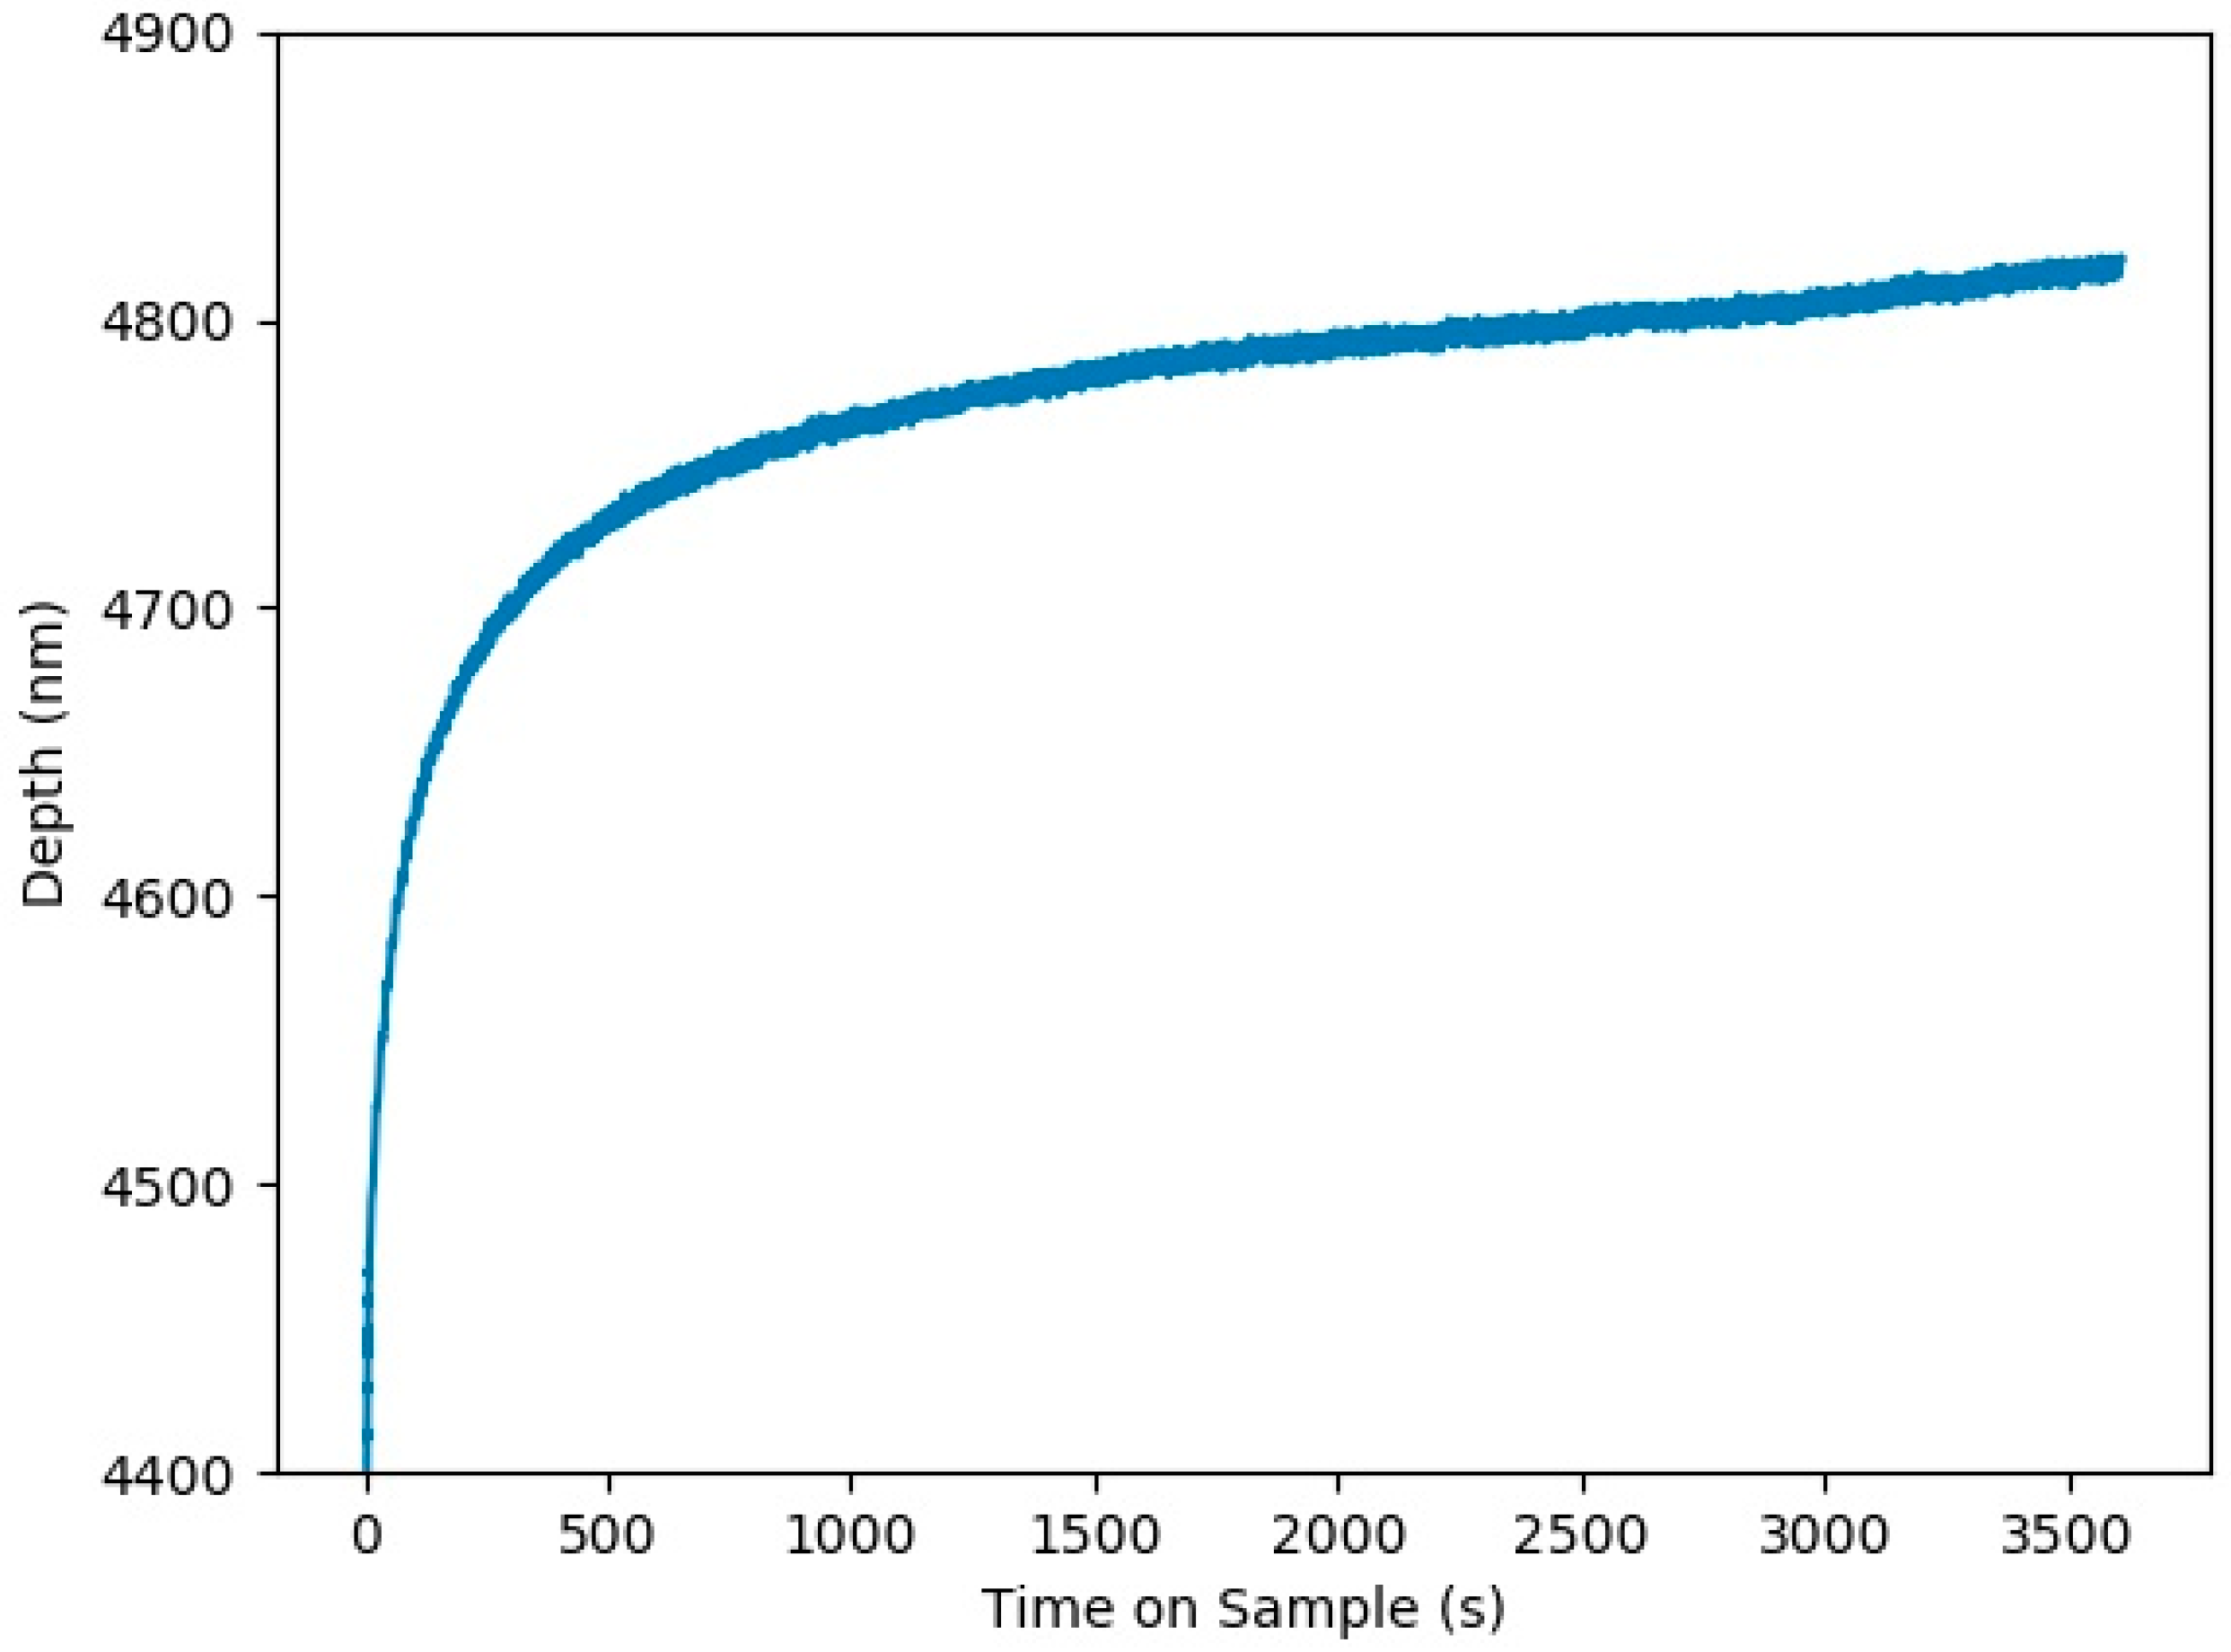
3.2. Constant Load and Hold Creep Experiments

Examples of contact depth vs. time and contact stiffness vs. time data for a 3600-s hold are shown in Figure 4 and 5. In Figure 4, thermal drift of the tip displacement is noticeable at long hold times, where the apparent depth increases roughly linearly with time. However, the continuous stiffness data shown in Figure 5, for which thermal drift is negligible, demonstrates that the creep rate decreases continuously during the test. Typical hardness vs. strain rate data from a constant load and hold (CLH) test with a peak load of 100 mN and a loading rate of 100 mN/s are shown in Figure 6. During the initial part of the test, stress and strain rate are derived using the Oliver‒Pharr method and Equation (7), respectively (shown in blue). At longer times (typically beyond ~10–15 s), we turn on the tip oscillation to determine the stress and strain rate for the remainder of the test using the CSM (data shown in red). At the point where the tip oscillation is turned on, we assume that the hardness of the sample determined from both methods is identical. Only minor adjustments (<1%) to the effective modulus are needed to match the two data sets at that point, using Equation (8).

3.3. Effect of Loading Rate

We performed 20 CLH creep tests to specifically determine the effect of loading rate on deformation. Four tests each were conducted at five different loading rates, for hold times of one hour, the results of which are shown in Figure 7. In Figure 7, we only show the data derived from the displacement data obtained during the initial stages of the test, because all the tests showed the same behavior during the hour-long hold. During initial loading, data from all tests appear to be qualitatively and quantitatively similar over the range of loading rates. Tests with a larger loading rate yield initially higher values of both hardness and strain rate, but data acquired later in the tests overlap with data from tests conducted at slower loading rates. Thus, there does not appear to be a significant effect of loading rate on hardness and strain rate in the CLH tests.

3.4. Effect of Peak Load

We also performed 16 CLH creep tests to determine if there is an effect of peak load on deformation. We did not conduct tests at very small loads, due to the known presence of an indentation size effect, as demonstrated in Figure 2. However, we performed tests at larger loads to explore other potential effects. Our results are shown in Figure 8, which demonstrates that there is no effect of peak load on creep behavior over the range tested. All CLH creep tests yield data in quantitative agreement with each other during the hour-long hold.

3.5. Very Long Hold Creep Tests

In addition to the 1-hr CLH creep tests, we also performed 2 creep tests of much longer duration, up to 106 s. In these very long hold tests, the data from the first ~3 × 10⁴ s of the tests were quantitatively similar to data from experiments for hold times of 1 h. However, for longer hold times, creep appears to periodically accelerate during the test, as demonstrated by the contact stiffness data in Figure 9. After each creep acceleration, long periods of time with a lower creep rate are observed. This unsteady creep behavior was not seen in our other CLH creep tests, nor has it been reported for any material in the nanoindentation literature to the best of our knowledge.
We fit the contact stiffness vs. log time data as shown in Figure 10. Two straight lines can be fit to the data, as shown in the figure. In Figure 11, we plot the stresses and strain rates derived from the contact stiffness data from the very long hold tests. Clearly, there is a change in the stress exponent at a hardness (stress) of ~180 MPa. At high stresses, a best-fit to the data yields a value of the stress exponent similar to that obtained in the other experiments, ~25, but the data at lower stress yield a value of the stress exponent of 4.87 ± 0.91, suggesting a change in the dominant deformation mechanism from plasticity to power-law creep, the latter with a typical value of n ≈ 5 for halite.

4. Discussion

Compared to a uniaxial or triaxial deformation experiment, the stress state in the sample beneath a Berkovich indenter tip is complex, without any analytical solutions for the stress field. Therefore, it is not straightforward to compare data collected from macroscopic samples tested in a uniaxial or triaxial testing geometry to data acquired in nanoindentation tests. Additionally, comparing the deformation induced by an indenter in a single crystal to deformation of a polycrystalline sample is also not straightforward. However, due to the complex stress state under an indenter, multiple slip systems must be activated, approximating the deformation of a polycrystalline aggregate [30].
Recently, efforts have been made to understand and compare the creep parameters that result from nanoindentation testing with parameters derived from more conventional experiments [37,38]. A theoretical treatment of the problem by Bower et al. [39] has recently been applied to a few materials. For a full description of the analysis and a review of direct comparisons between data from macroscopic tests and nanoindentation tests, see [38]. Here, we summarize a few major points. For a power-law creeping material in a nanoindentation test, the relationship between the indentation strain rate ( ε i ˙ ) and hardness (H) can be written as
ε i ˙ = β i H m ,
where βi is a constant that captures the Arrhenius dependence of the creep rate and a material parameter akin to A in Equation (1), and m is the stress exponent measured in a nanoindentation creep test. A similar form can be written for conventional compression tests. By simplifying Equation (1), we can write
ε ˙ = α σ n   ,
where α encompasses all of the terms besides the stress σ and the stress exponent n in Equation (1). Bower et al. [39] show that m and n are equal to each other, so the conversion between conventional and nanoindentation creep parameters is entirely captured by the functional relationship between the pre-factors βi and α. Two quantities are needed to determine this conversion, the “pile-up/sink-in parameter” (c) and the “reduced contact pressure” (F). Values of these parameters are strongly dependent on the value of the stress exponent and the geometry of the indenter tip [37,38,39]. To directly convert between βi and α, we use the relationship
α = β i F n c 2 n 1 tan θ   ,
where θ is the angle of the conical indenter tip and all other parameters are described above [38]. For this analysis, we treat the Berkovich tip as a cone with an angle of 70 degrees, allowing us to use finite element results from Su et al. [37] to determine values of F and c. Using the measured stress exponent, n, and the value of βi determined from the nanoindentation data, we directly convert nanoindentation creep data to equivalent conventional creep data. As the stress exponent becomes larger, the conversion factor between the stress in conventional creep tests and nanoindentation creep tests approaches a limiting value of 3, similar to the constraint factor described by Johnson [29]. For our data where n = 4.87, the conversion factor for stress has a value of 2.86. Alternatively, we can adjust the strain rate at a fixed stress. In this case, the nanoindentation creep rate must be multiplied by a factor of ~146. Both of these conversions are shown in Figure 12, where we plot both the original nanoindentation creep data and the “Bower-shifted” data. Also shown in Figure 12 is the extrapolation of three different dislocation creep flow laws commonly used for polycrystalline halite. Remarkably, our Bower-shifted indentation creep data show very close quantitative agreement with the flow laws derived from “macroscopic” experiments, suggesting that our nanoindentation creep tests interrogate the same creep mechanisms as conventional creep tests performed at modestly elevated temperature and elevated confining pressure. In fact, for a given stress, our converted strain rates are within 5% of the value predicted from the Wawersik and Zeuch flow law [6].

5. Conclusions

We have performed an extensive set of nanoindentation hardness and nanoindentation creep experiments to determine the high-stress, room-temperature rheological behavior of single crystals of halite. Our results demonstrate that the hardness of halite is sensitive to strain rate, with a stress exponent of ~25 at hardness (stress) values larger than ~190 MPa. We also observe a significant indentation size effect, whereby hardness decreases with increasing size of the indents. The measured rheological behavior is independent of loading rate and peak load over the range of test conditions. Nanoindentation creep tests corroborate the hardness-derived data and reveal a distinct change in the dominant deformation mechanism with decreasing stress. We interpret this transition to n = 4.87 behavior at lower stresses as a transition from plasticity to dislocation creep, the latter typically characterized by a value of n ≈ 5. Accounting for differences in the stress state in nanoindentation tests compared to conventional tests, we demonstrate that our nanoindentation data are in excellent agreement with flow laws for dislocation creep of halite derived from triaxial tests on polycrystalline samples. Our results underscore the utility of using nanoindentation in addition to more conventional methods to measure the creep behavior of geological materials at ambient and, in the future, elevated temperatures.

Author Contributions

C.A.T. prepared samples, performed experiments, and analyzed data. C.A.T. drafted the manuscript, and both authors edited the manuscript.

Conflicts of Interest

The authors declare no conflicts of interest.

References

  1. Jackson, M.P.A.; Talbot, C.J. External shapes, strain rates, and dynamics of fault structures. GSA Bull. 1986, 97, 305–323. [Google Scholar] [CrossRef]
  2. van Keken, P.E.; Spiers, C.J.; van den Berg, A.P.; Muyzert, E.J. The effective viscosity of rocksalt: Implementation of steady-state creep laws in numerical models of salt diapirism. Tectonophysics 1993, 225, 457–476. [Google Scholar] [CrossRef]
  3. Li, S.; Abe, S.; Reuning, L.; Becker, S.; Urai, J.L.; Kukla, P.A. Numerical modelling of the displacement and deformation of embedded rock bodies during salt tectonics: A case study from the South Oman Salt Basin. Geol. Soc. Lond. 2012, 363, 503–520. [Google Scholar] [CrossRef]
  4. Heard, H.C. Steady-state flow in polycrystalline halite at pressure of 2 kilobars. Flow Fract. Rocks 1972, 16, 191–209. [Google Scholar]
  5. Heard, H.C.; Ryerson, F.J. Effect of cation impurities on steady-state flow of salt. Miner. Rock Def. Lab. Stud. 1986, 36, 99–115. [Google Scholar]
  6. Wawersik, W.R.; Zeuch, D.H. Modeling and mechanistic interpretation of creep of rock salt below 200 °C. Tectonophysics 1986, 121, 125–152. [Google Scholar] [CrossRef]
  7. Carter, N.L.; Horseman, S.T.; Russell, J.E.; Handin, J. Rheology of rocksalt. J. Struct. Geol. 1993, 15, 1257–1271. [Google Scholar] [CrossRef]
  8. Frannsen, R.C.M.W. The rheology of synthetic rocksalt in uniaxial compression. Tectonophysics 1994, 233, 1–40. [Google Scholar] [CrossRef]
  9. Hunsche, U.; Hampel, A. Rock salt—The mechanical properties of the host rock material for a radioactive waste repository. Eng. Geol. 1999, 52, 271–291. [Google Scholar] [CrossRef]
  10. Ter Heege, J.H.; De Bresser, J.H.; Spiers, C.J. Dynamic recrystallization of wet synthetic polycrystalline halite: Dependence of grain size distribution on flow stress, temperature and strain. Tectonophysics 2005, 396, 35–57. [Google Scholar] [CrossRef]
  11. Schoenherr, J.; Schleder, Z.; Urai, J.L.; Fokker, P.A.; Schulze, O. Deformation mechanisms and rheology of Pre-cambrian rocksalt from the South Oman Salt Basin. In Proceedings of the 6th Conference on the Mechanical Behavior of Salt: Understanding of THMC Processes in Salt Rocks, Hannover, Germany, 22–25 May 2007; pp. 167–173. [Google Scholar]
  12. Linckens, J.; Zulauf, G.; Hammer, J. Experimental deformation of course-grained rock salt to high strain. J. Geophys. Res. Solid Earth 2016, 121, 6150–6171. [Google Scholar] [CrossRef]
  13. Carter, N.L.; Hansen, F.D. Creep of rocksalt. Tectonophysics 1983, 92, 275–333. [Google Scholar] [CrossRef]
  14. Skrotzki, W.; Liu, Z.G. Analysis of the cross slip process in alkali halides. Phys. Stat. Sol. 1982, 73, K225–K229. [Google Scholar] [CrossRef]
  15. Skrotzki, W.; Haasen, P. The influence of texture on the creep of salt. In Proceedings of the 2nd Conference of Mechanical Behavior of Salt, Hannover, Germany, 24–28 September 1984; pp. 83–88. [Google Scholar]
  16. Senseny, P.E.; Hansen, F.D.; Russell, J.E.; Carter, N.L.; Handin, J.W. Mechanical behavior of rock salt: Phenomenology and micromechanisms. Int. J. Rock Mech. Mining Sci. Geomech. Abstr. 1992, 29, 363–378. [Google Scholar] [CrossRef]
  17. Berest, P.; Brouard, B. A tentative classification of salts according to their creep properties. In Proceedings of the SMRI spring meeting, New Orleans, LA, USA, 19–22 April 1998; pp. 19–22. [Google Scholar]
  18. Fossum, A.F.; Friedrich, J.T. Salt Mechanics Primer for Near-Salt and Sub-Salt Deepwater Gulf of Mexico Field Developments; Sandia Report 2063; Sandia National Laboratories: Albuquerque, NM, USA, 2002.
  19. Spiers, C.J.; Urai, J.L.; Lister, G.S.; Boland, J.N.; Zwart, H.J. The Influence of Fluid-Rock Interaction on the Rheology of Salt Rock; Bâtiment Jean Monnet: Luxembourg, 1986. [Google Scholar]
  20. Urai, J.L.; Spiers, C.J.; Zwart, H.J.; Lister, G.S. Weakening of rock salt by water during long-term creep. Nature 1986, 324, 554–557. [Google Scholar] [CrossRef] [PubMed]
  21. Spiers, C.J.; Urai, J.L.; Lister, G.S. The effect of brine (inherent or added) on rheology and deformation mechanisms in salt rock. In Proceedings of the 2nd Conference of Mechanical Behavior of Salt, Hannover, Germany, 24–28 September 1984; pp. 89–102. [Google Scholar]
  22. Spiers, C.J.; Schutiens, P.M.; Brzesowsky, R.H.; Peach, C.J.; Liezenberg, J.L.; Zwart, H.J. Experimental determination of constitutive parameters governing creep of rocksalt by pressure solution. Geol. Soc. Lond. Spec. Publ. 1990, 54, 215–227. [Google Scholar] [CrossRef]
  23. Urai, J.L.; Spiers, C.J. The effect of grain boundary water on deformation mechanisms and rheology of rocksalt during long-term deformation. In Proceedings of the 6th Conference on the Mechanical Behavior of Salt: Understanding of THMC Processes in Salt Rocks, Hannover, Germany, 22–25 May 2007; pp. 149–158. [Google Scholar]
  24. Shimamoto, T.; Logan, J.M. Velocity dependent behavior of simulated halite shear zones: An analog for silicates. In Earthquake Source Mechanics, 1st ed.; American Geophysical Union: Washington, DC, USA, 1986; Volume 37, pp. 49–63. [Google Scholar]
  25. Shimamoto, T. Transition between frictional slip and ductile flow for halite shear zones at room temperature. Science 1986, 231, 711–714. [Google Scholar] [CrossRef] [PubMed]
  26. Chester, F.M. The brittle-ductile transition in a deformation-mechanism map for halite. Tectonophysics 1988, 154, 125–136. [Google Scholar] [CrossRef]
  27. Oliver, W.C.; Pharr, G.M. An improved technique for determining hardness and elastic modulus using load and displacement sensing indentation experiments. J. Mater. Res. 1992, 7, 1564–1583. [Google Scholar] [CrossRef]
  28. Oliver, W.C.; Pharr, G.M. Measurement of hardness and elastic modulus by instrumented indentation: Advances in understanding and refinements to methodology. J. Mater. Res. 2004, 19, 3–20. [Google Scholar] [CrossRef]
  29. Johnson, K.L. The correlation of indentation experiments. J. Mech. Phys. Solids 1970, 18, 115–126. [Google Scholar] [CrossRef]
  30. Evans, B.; Goetze, C. The temperature variation of hardness of olivine and its implication for polycrystalline yield stress. J. Geophys. Res. Solid Earth 1979, 84, 5505–5524. [Google Scholar] [CrossRef]
  31. Thom, C.A.; Brodsky, E.E.; Carpick, R.W.; Pharr, G.M.; Oliver, W.C.; Goldsby, D.L. Nanoscale roughness of natural fault surfaces controlled by scale-dependent yield strength. Geophys. Res. Let. 2017, 44, 9299–9307. [Google Scholar] [CrossRef]
  32. Kumamoto, K.M.; Thom, C.A.; Wallis, D.; Hansen, L.N.; Armstrong, D.E.; Warren, J.M.; Goldsby, D.L.; Wilkinson, A.J. Size effects resolve discrepancies in 40 years of work on low-temperature plasticity in olivine. Sci. Adv. 2017, 3, e1701338. [Google Scholar] [CrossRef] [PubMed]
  33. Li, X.; Bhushan, B. A review of nanoindentation continuous stiffness technique and its applications. Mater. Charact. 2002, 48, 11–36. [Google Scholar] [CrossRef]
  34. Pharr, G.M.; Herbert, E.G.; Gao, Y. The indentation size effect: A critical examination of experimental observations and mechanistic interpretations. Ann. Rev. Mater. Res. 2010, 40, 271–292. [Google Scholar] [CrossRef]
  35. Thom, C.A.; Carpick, R.W.; Goldsby, D.L. Constraints on the physical mechanism of frictional aging from nanoindentation. Geophys. Res. Let. 2018, 45, 306–311. [Google Scholar] [CrossRef]
  36. Lucas, B.N.; Oliver, W.C. Indentation power-law creep of high-purity indium. Metall. Mater. Trans. A 1999, 30, 601–610. [Google Scholar] [CrossRef]
  37. Su, C.; Herbert, E.G.; Sohn, S.; LaManna, J.A.; Oliver, W.C.; Pharr, G.M. Measurement of power-law creep parameters by instrumented indentation methods. J. Mech. Phys. Solids 2013, 61, 517–536. [Google Scholar] [CrossRef]
  38. Ginder, R.S.; Nix, W.D.; Pharr, G.M. A simple model for indentation creep. J. Mech. Phys. Solids 2018, 112, 552–562. [Google Scholar] [CrossRef]
  39. Bower, A.F.; Fleck, N.A.; Needleman, A.; Ogbonna, N. Indentation of a power law creeping solid. Proc. R. Soc. Lond. 1993, 441, 97–124. [Google Scholar] [CrossRef]
Figure 1. Load vs. depth curves for all 116 nanoindentation hardness tests performed on halite. Each color represents ~20 tests at target strain rates of 0.40 (green), 0.14 (blue), 0.05 (red), 0.015 (purple), 0.0075 (black), and 0.0015 (orange) s−1. The nearly vertical unloading portion of the data indicates that plasticity dominates the deformation and that very little elastic recovery occurs at the end of the test.
Geosciences 09 00079 g001
Figure 2. Plot of indentation hardness as a function of depth. The color vs. target strain rate scheme is the same as used in Figure 1. At shallow indentation depths (<1000 nm), a significant size effect can be observed, whereby hardness increases dramatically with decreasing indentation depth, for all target strain rates. At larger indentation depths, the size effect is small, and the hardness approaches a steady-state value corresponding to the given target strain rate.
Geosciences 09 00079 g002
Figure 3. Plot of steady-state hardness vs. indentation strain rate for 6 target strain rates. Each data point was selected for a depth of 4000 nm, where the indentation-size effect, prominent at shallower depths, is negligible. Error bars representing the variation between all experiments at a given strain rate are smaller than the data points. The stress exponent, i.e., the slope of a line approximately through the data points in the figure, is ~25, indicating that plasticity is the dominant deformation mechanism at these conditions.
Geosciences 09 00079 g003
Figure 4. Plot of the variation of indentation depth with time in a 3600-s creep test. At the beginning of the hold, the displacement rate is larger because the stress on the sample is higher. As the contact area increases due to creep of the sample, the stress and thus the displacement rate decreases. Towards the end of the test, the apparent acceleration in the creep rate (the increase in slope of the curve) is caused by thermal drift of the instrument.
Geosciences 09 00079 g004
Figure 5. Plot of contact stiffness vs. time for the same test as shown in Figure 4. The contact stiffness data obtained using the CSM are shown in blue. Although these data appear to be noisy and ocsillatory, they are a more accurate measure of the deformation than the displacement data, because of their insensitivity to thermal drift. A smoothed fit to the data is shown in black, but we use the unsmoothed data in all subsequent analyses.
Geosciences 09 00079 g005
Figure 6. Plot of indentation strain rate vs. hardness for a 3600-s test (derived from the data shown in Figure 4 and Figure 5). The hardness and strain rate for the blue data are determined from the displacement data from the first 10 s of the test, a time scale too short for significant thermal drift. For the remainder of the test, the hardness and strain rate are determined from the contact stiffness, shown in red, which is independent of thermal drift.
Geosciences 09 00079 g006
Figure 7. Plot of hardness vs. strain rate, derived from displacement data, for all experiments with a peak load of 100 mN. Each color corresponds to a different loading rate. No systematic differences are observed in the data, indicating that loading rate does not influence creep behavior during the hold at constant load.
Geosciences 09 00079 g007
Figure 8. Plot of hardness vs. strain rate for all experiments performed at a loading rate of 100 mN/s. Data are derived from both displacement measurements (the high-stress portions of the curve) and contact stiffness measurements (the low-stress portions). Each color corresponds to a different maximum load during the hold. All experiments reveal similar behavior over the range of conditions tested.
Geosciences 09 00079 g008
Figure 9. Plot of contact stiffness obtained via the CSM vs. time for two very long hold creep tests. Data in the first ~30,000 s are quantitatively similar to those from other experiments of shorter durations, but marked accelerations and decelerations in the creep rate are observed in both of these experiments at longer hold times.
Geosciences 09 00079 g009
Figure 10. Plot of the same data as in Figure 9 but with time plotted on a logarithmic scale. A steady increase in the contact stiffness is observed for the first ~30,000 s of the test, as observed by the linear fit through the data. However, at longer times, there is a sharp change in the rate of increase of contact stiffness, and deformation is unsteady.
Geosciences 09 00079 g010
Figure 11. Hardness vs. strain rate data for the two very long hold experiments, which yielded the data shown in Figure 9 and Figure 10. The black line is a best fit to the data at low stress, yielding a slope of 4.87 ± 0.91.
Geosciences 09 00079 g011
Figure 12. Plot of stress vs. strain rate illustrating the “Bower shift.” The raw data corresponding to the low-stress portions of the long-hold creep tests (where n = 4.87) are shown. Three different dislocation creep flow laws extrapolated to room temperature are shown for comparison. The black line, a fit to the raw data, is shifted according to Equation (12), either in the vertical or, equivalently, the horizontal direction. The two shifted black curves agree well with the predictions of the flow laws, particularly that of Wawersik and Zeuch [6].
Geosciences 09 00079 g012

