Landslide Hazard and Risk Assessment for a Natural Gas Pipeline Project: The Case of the Trans Adriatic Pipeline, Albania Section


Abstract
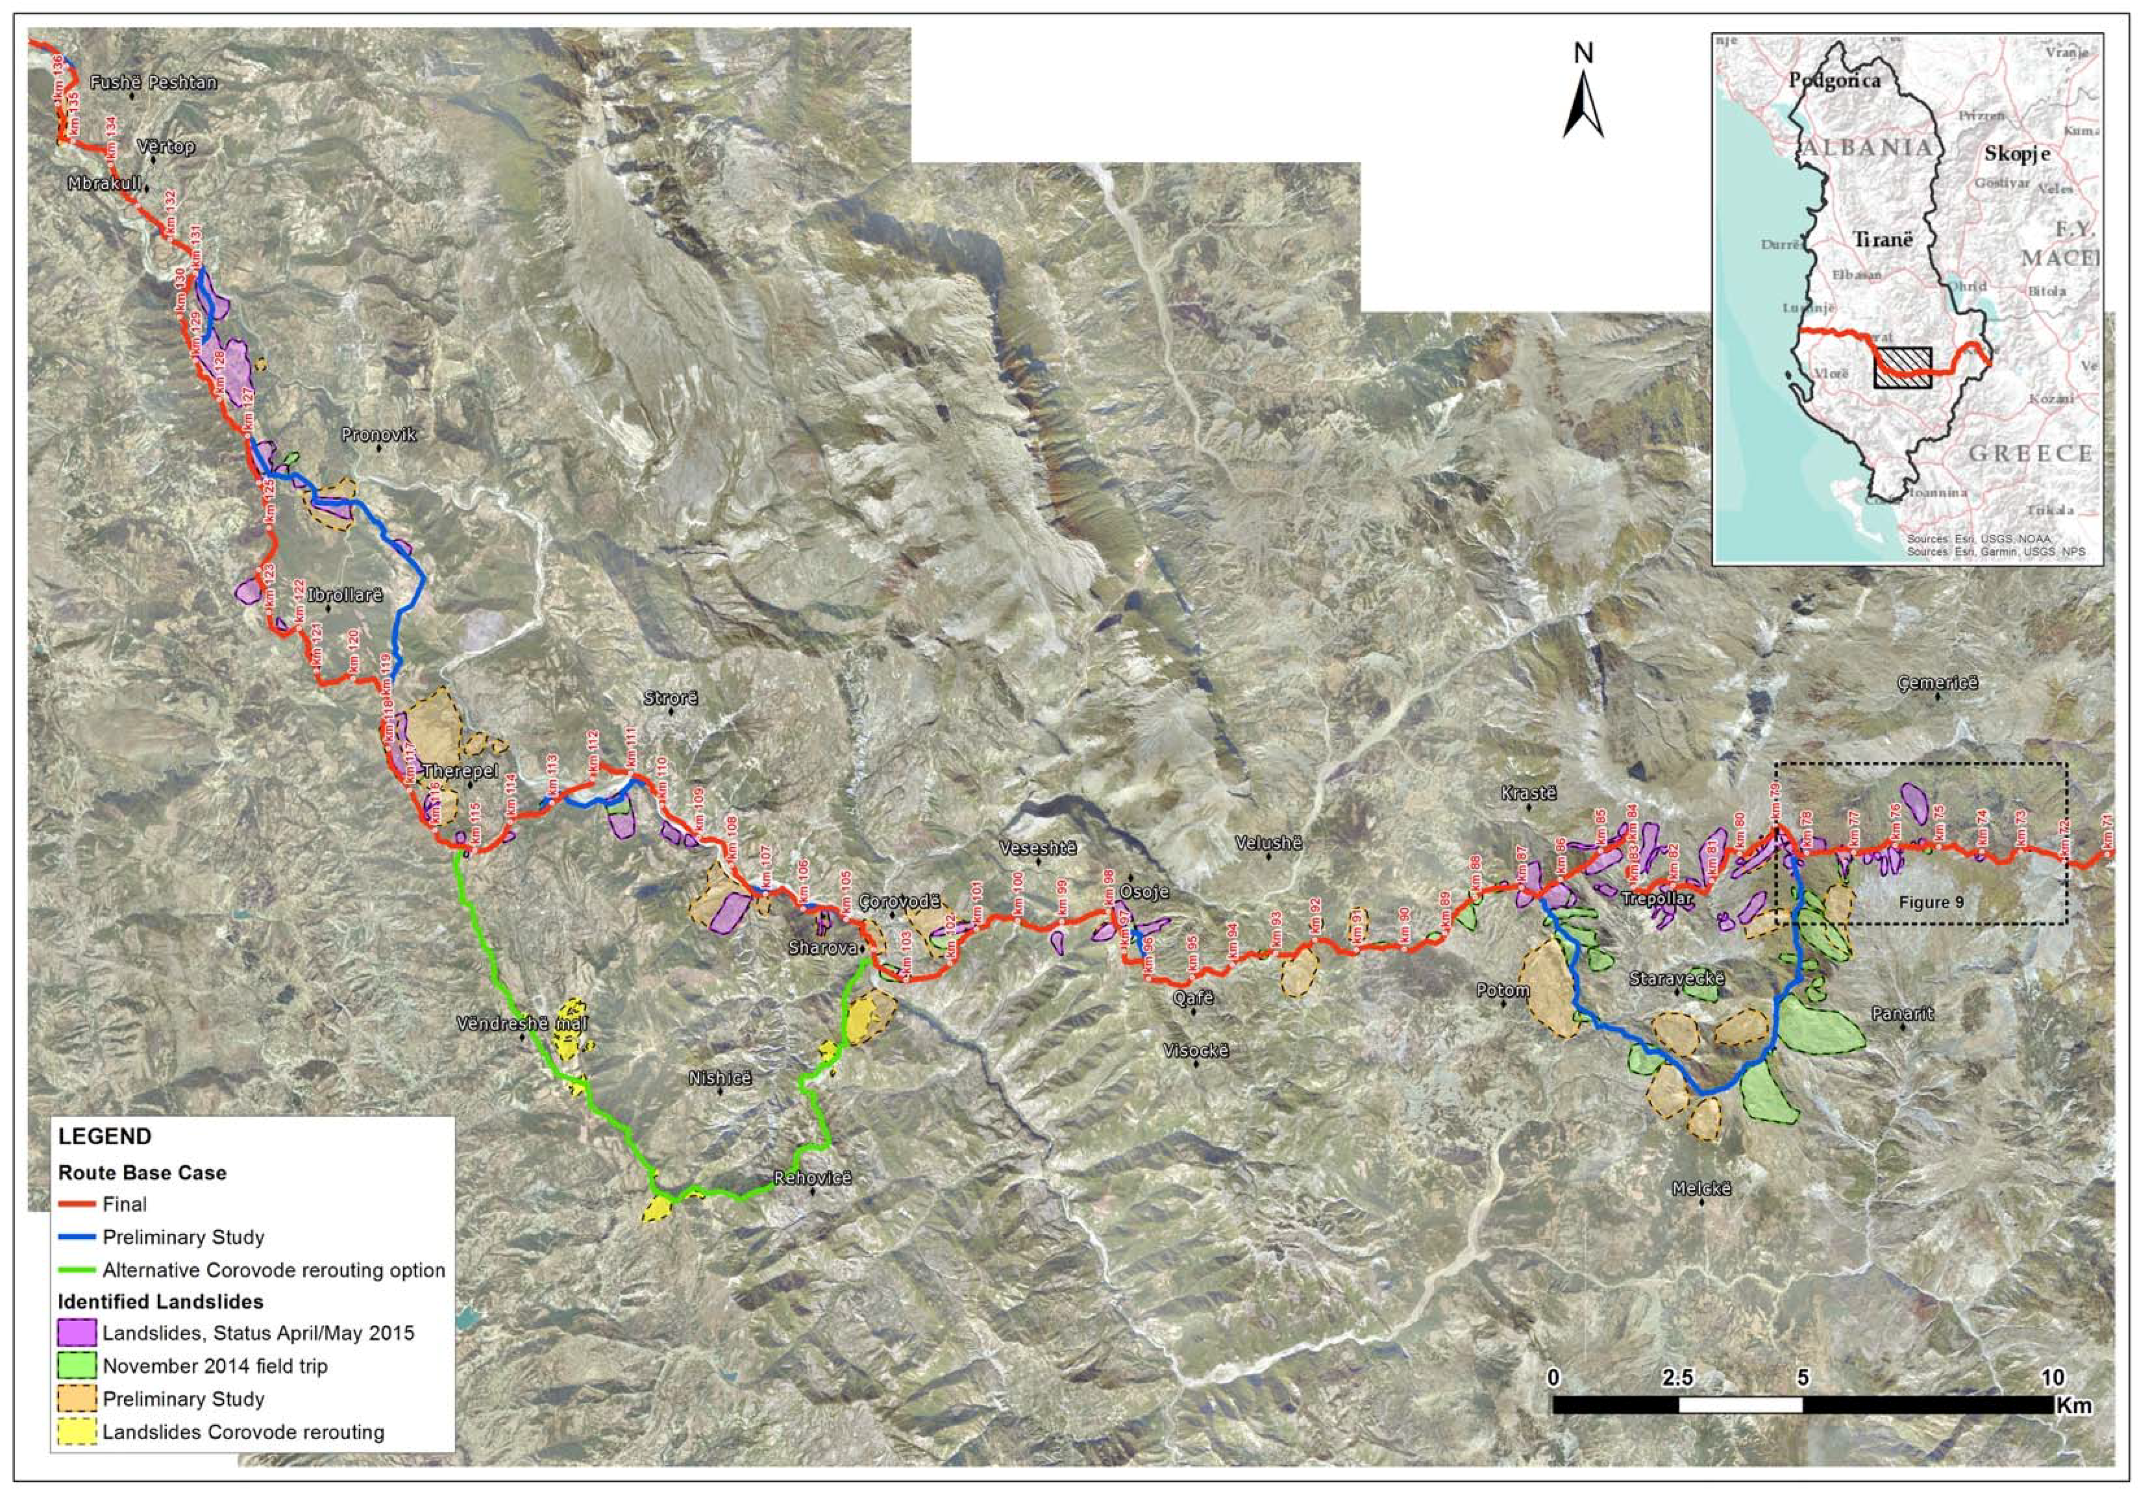
:1. Introduction
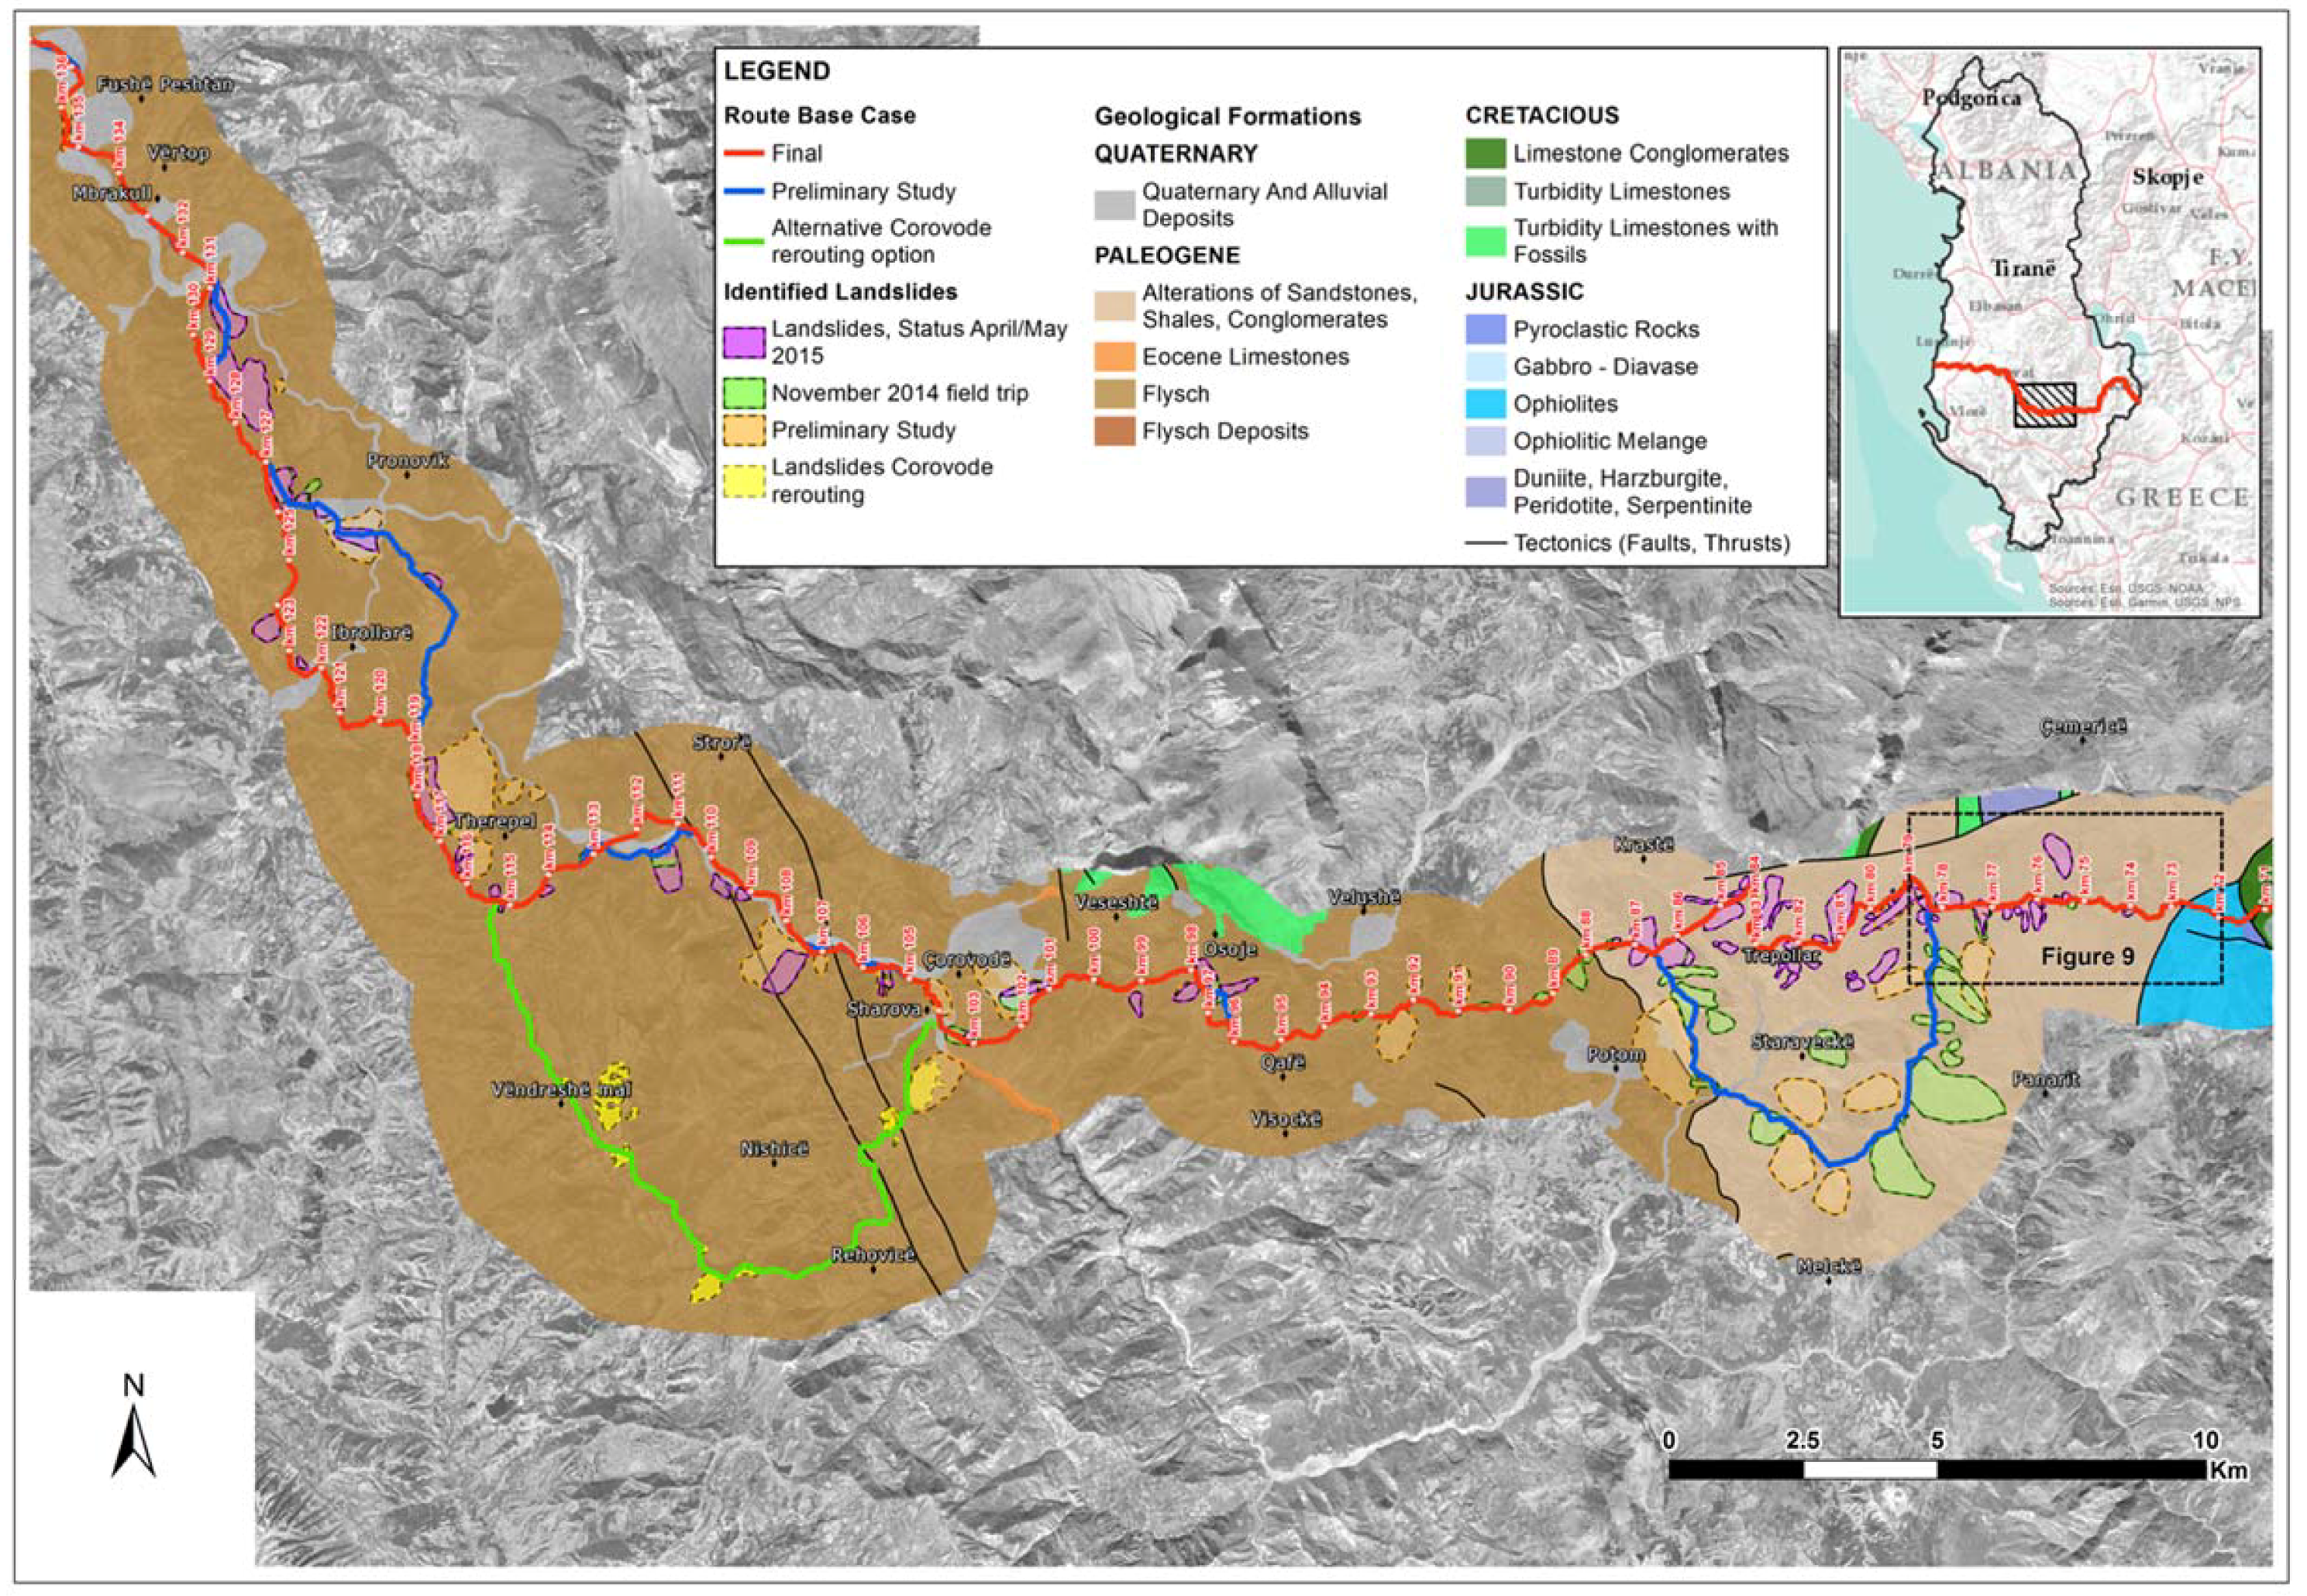
2. General Geological Conditions
Engineering Geological Conditions
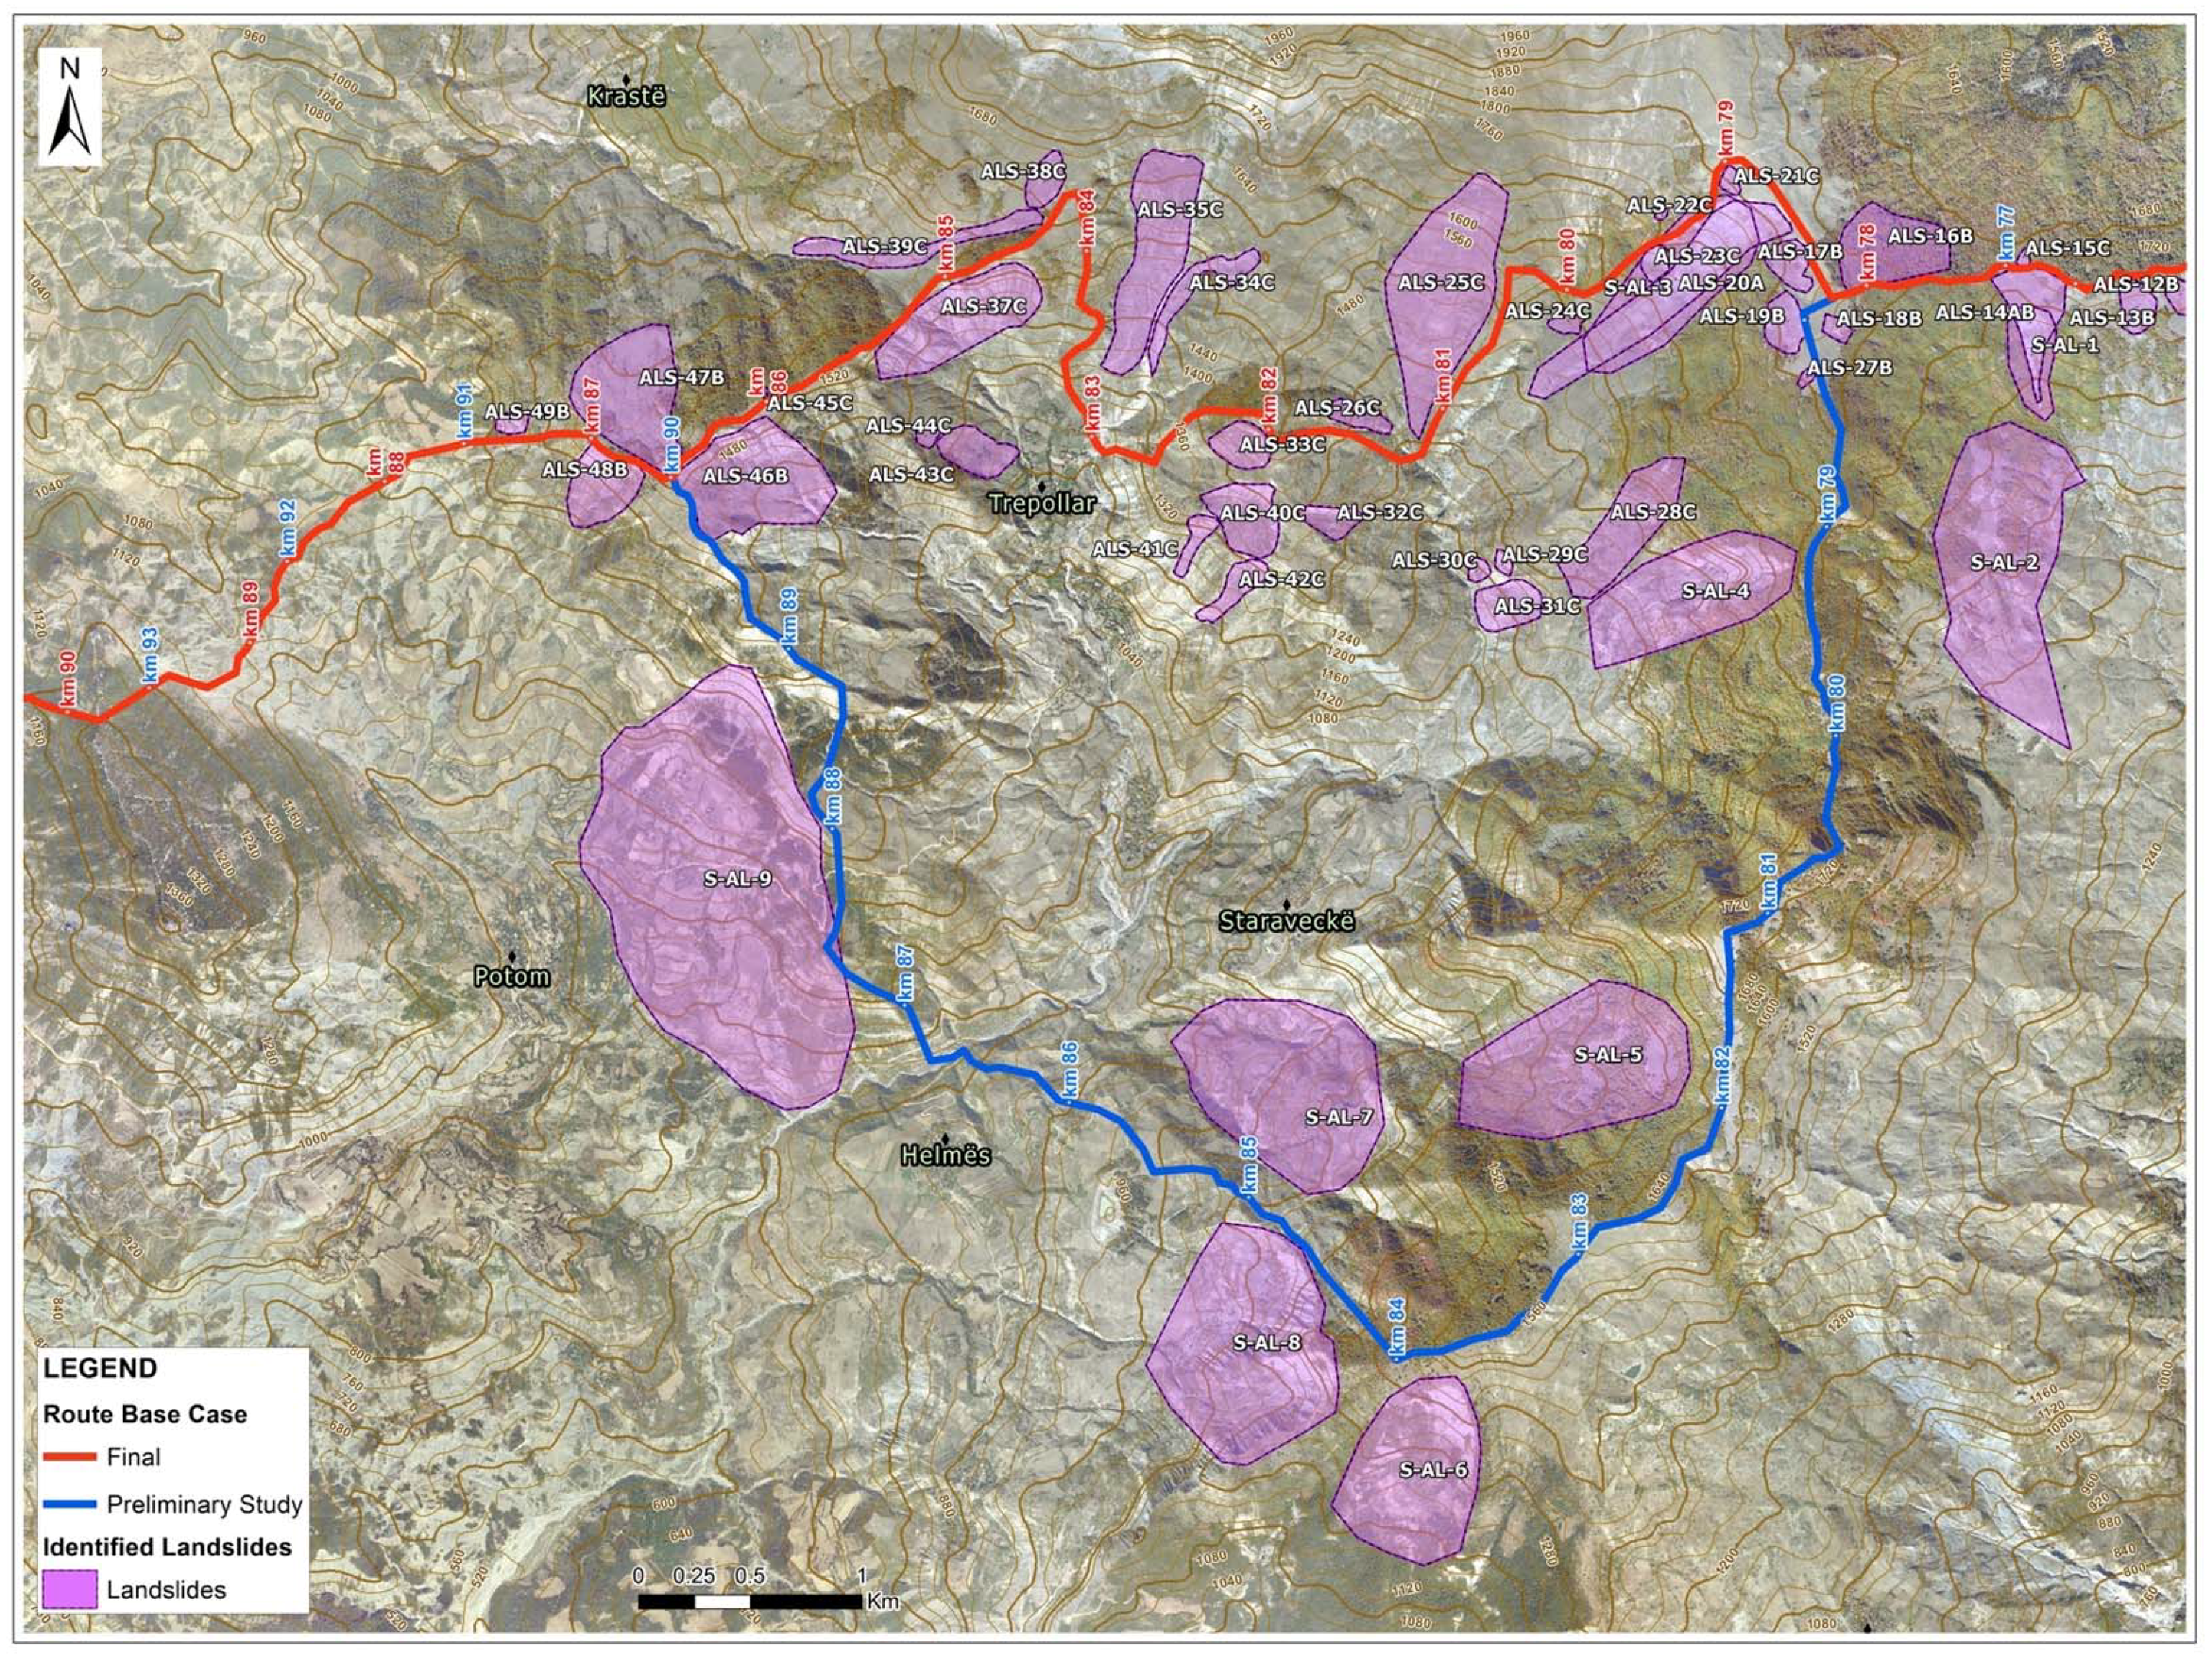
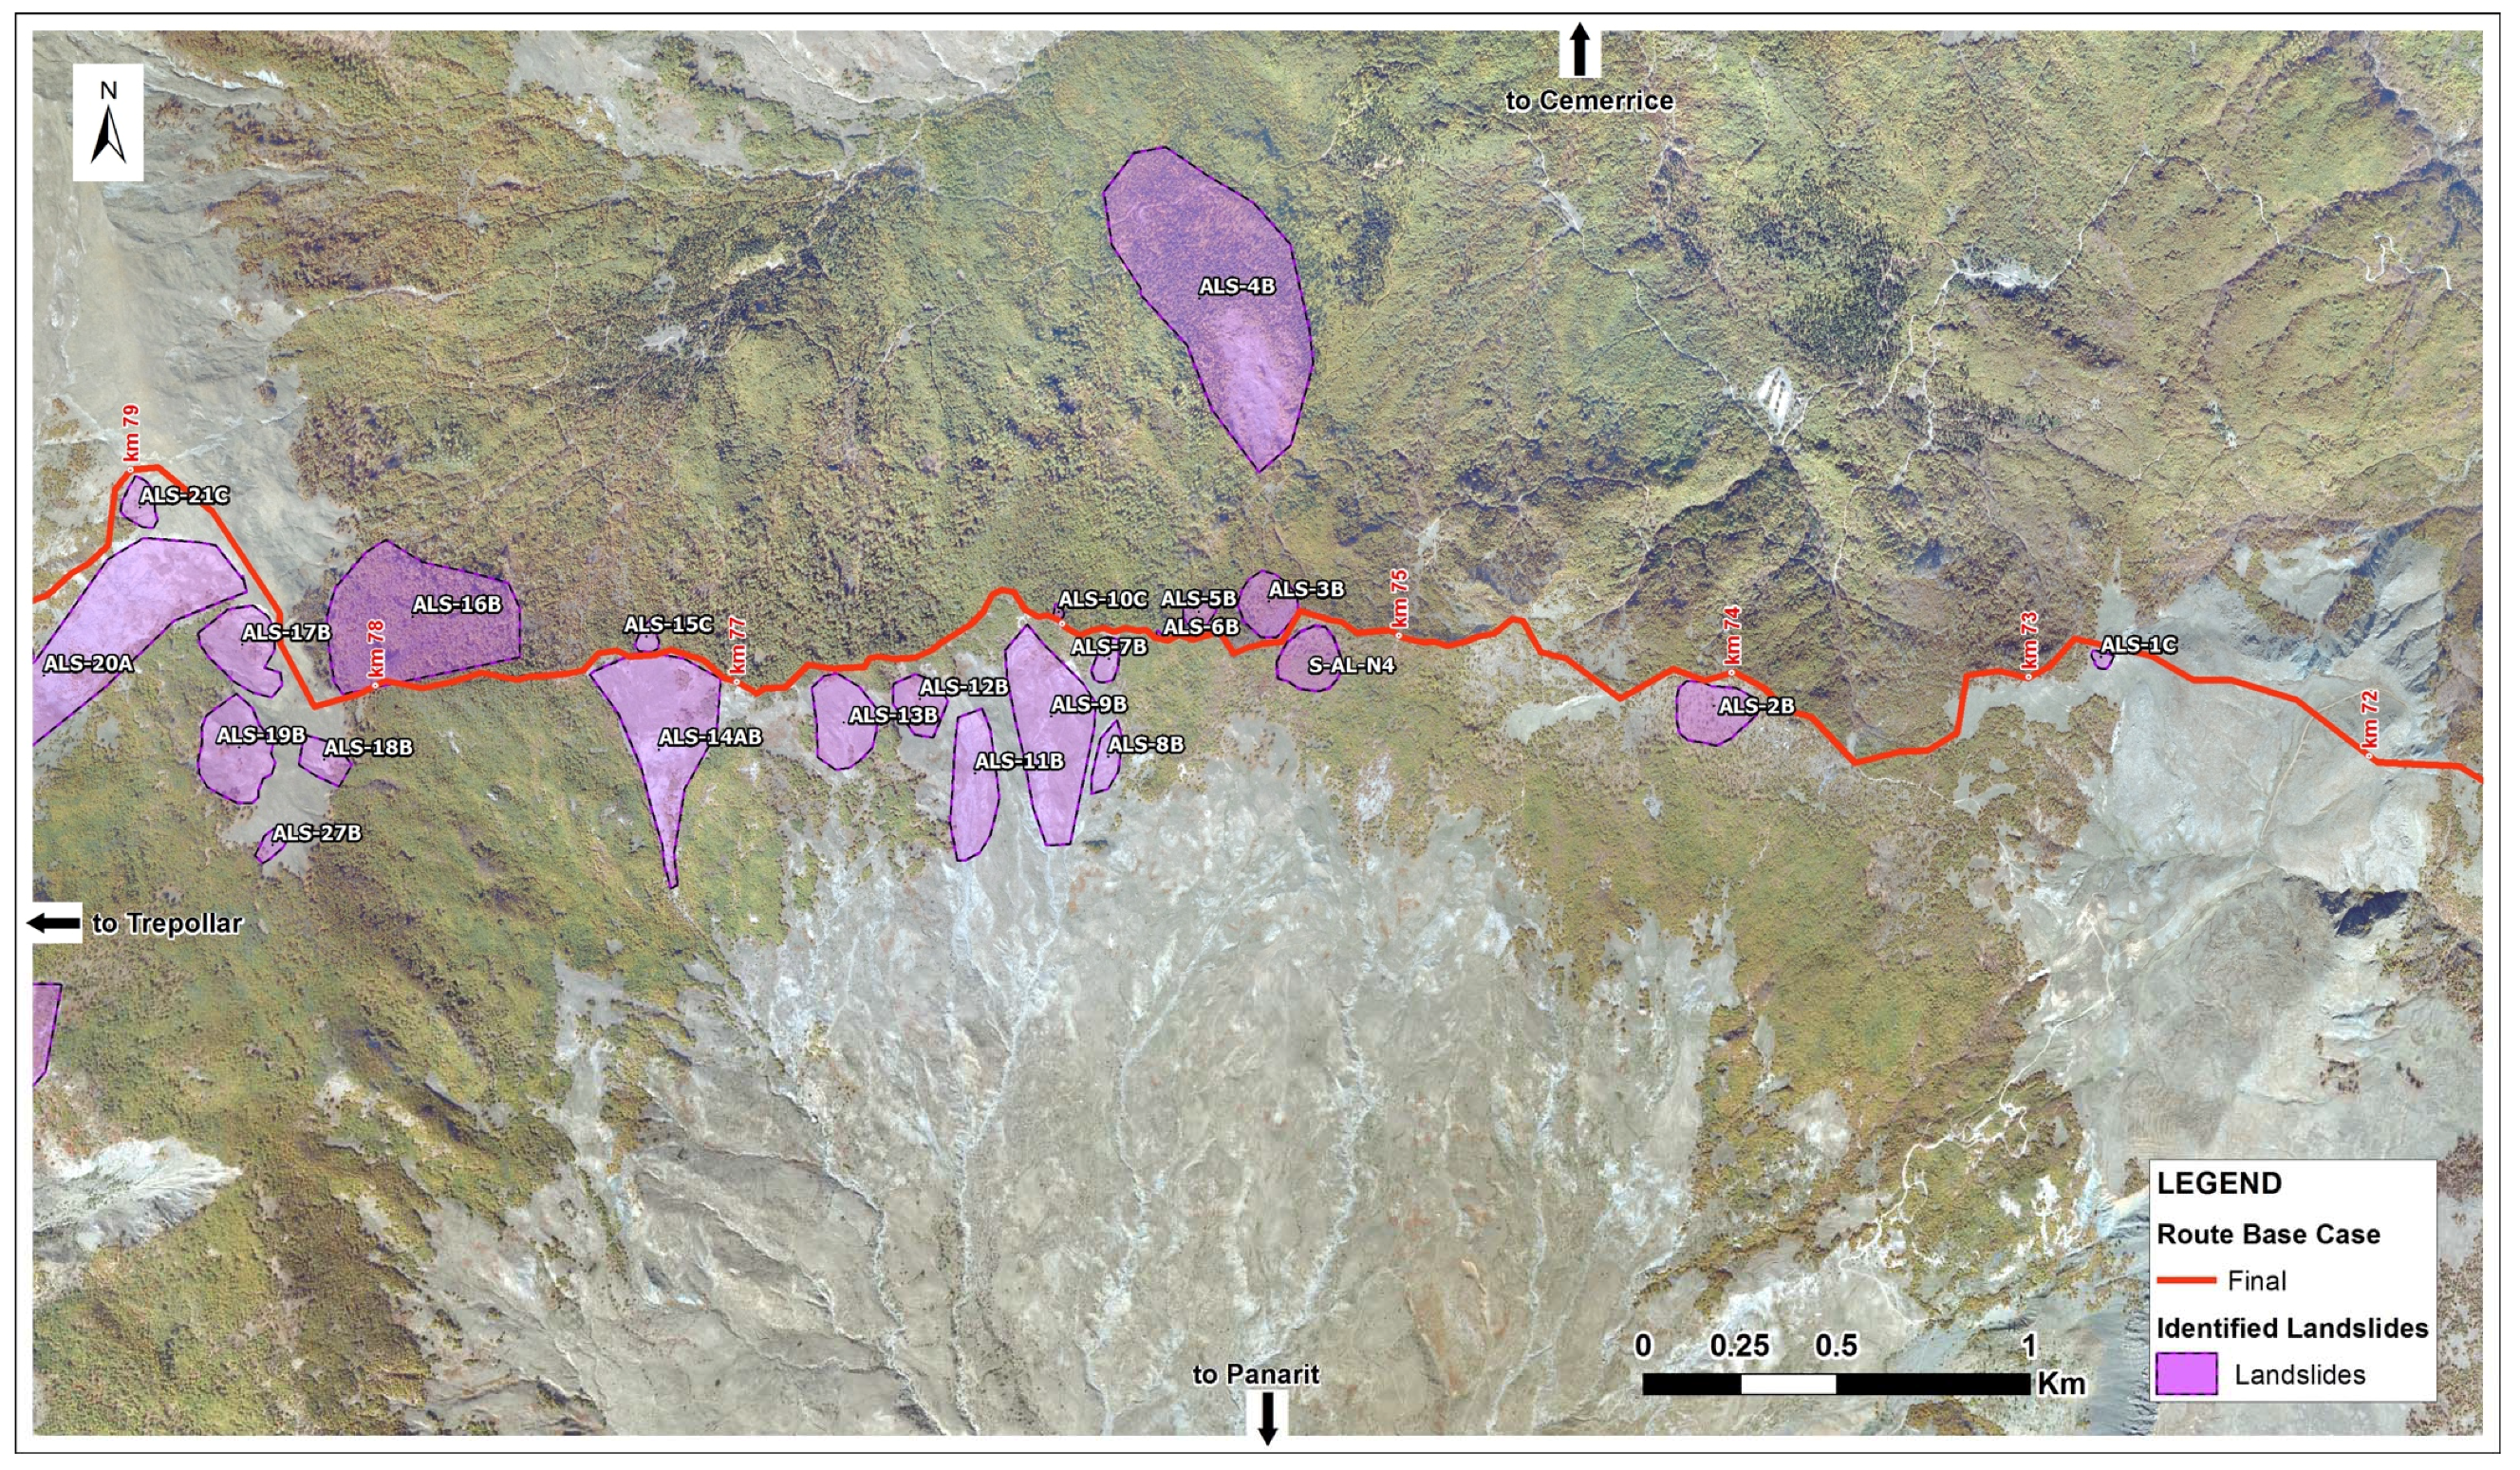
3. Landslide Inventory
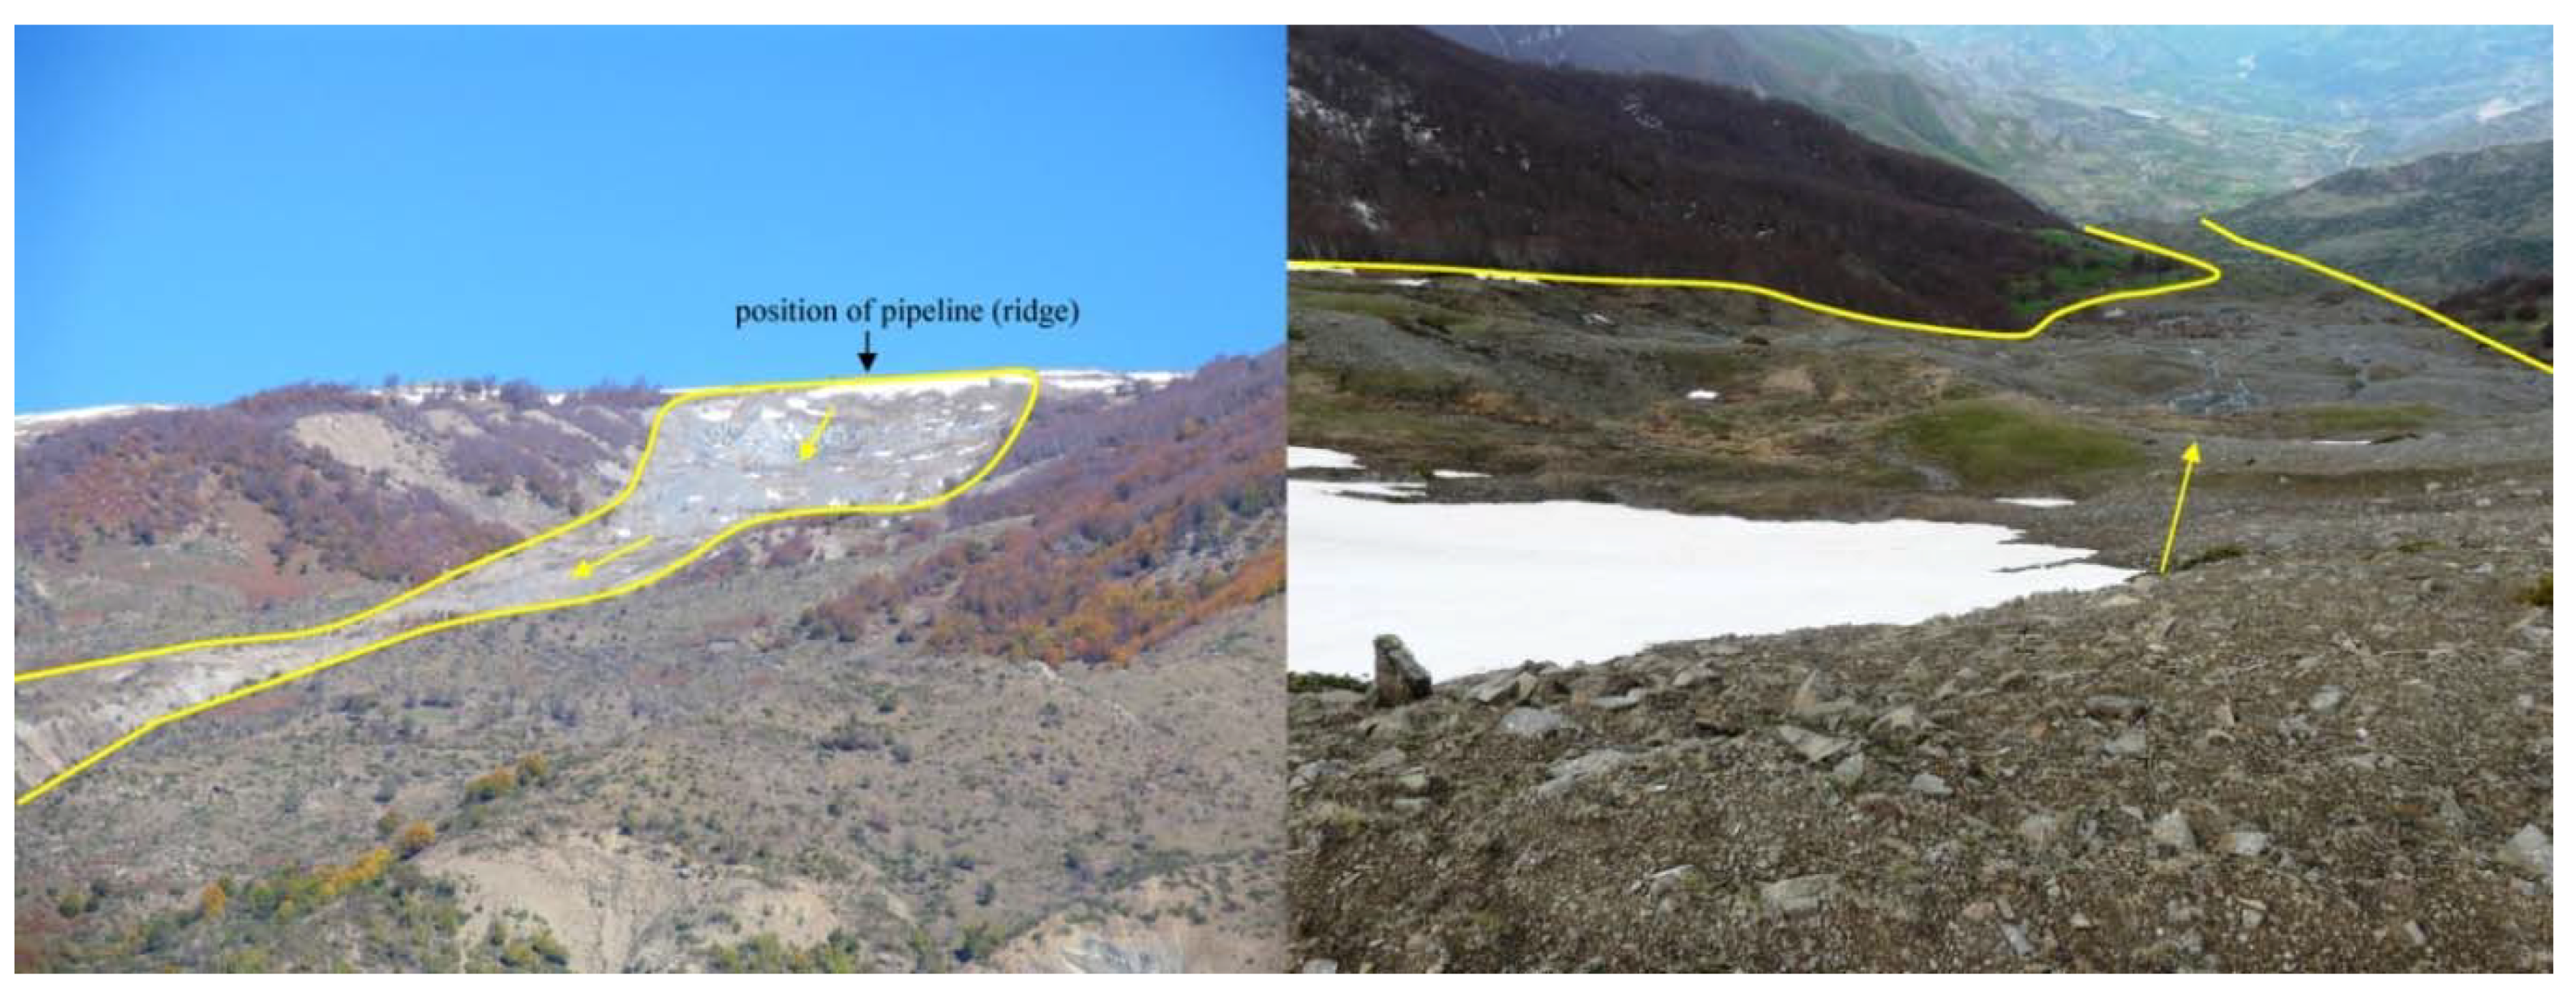
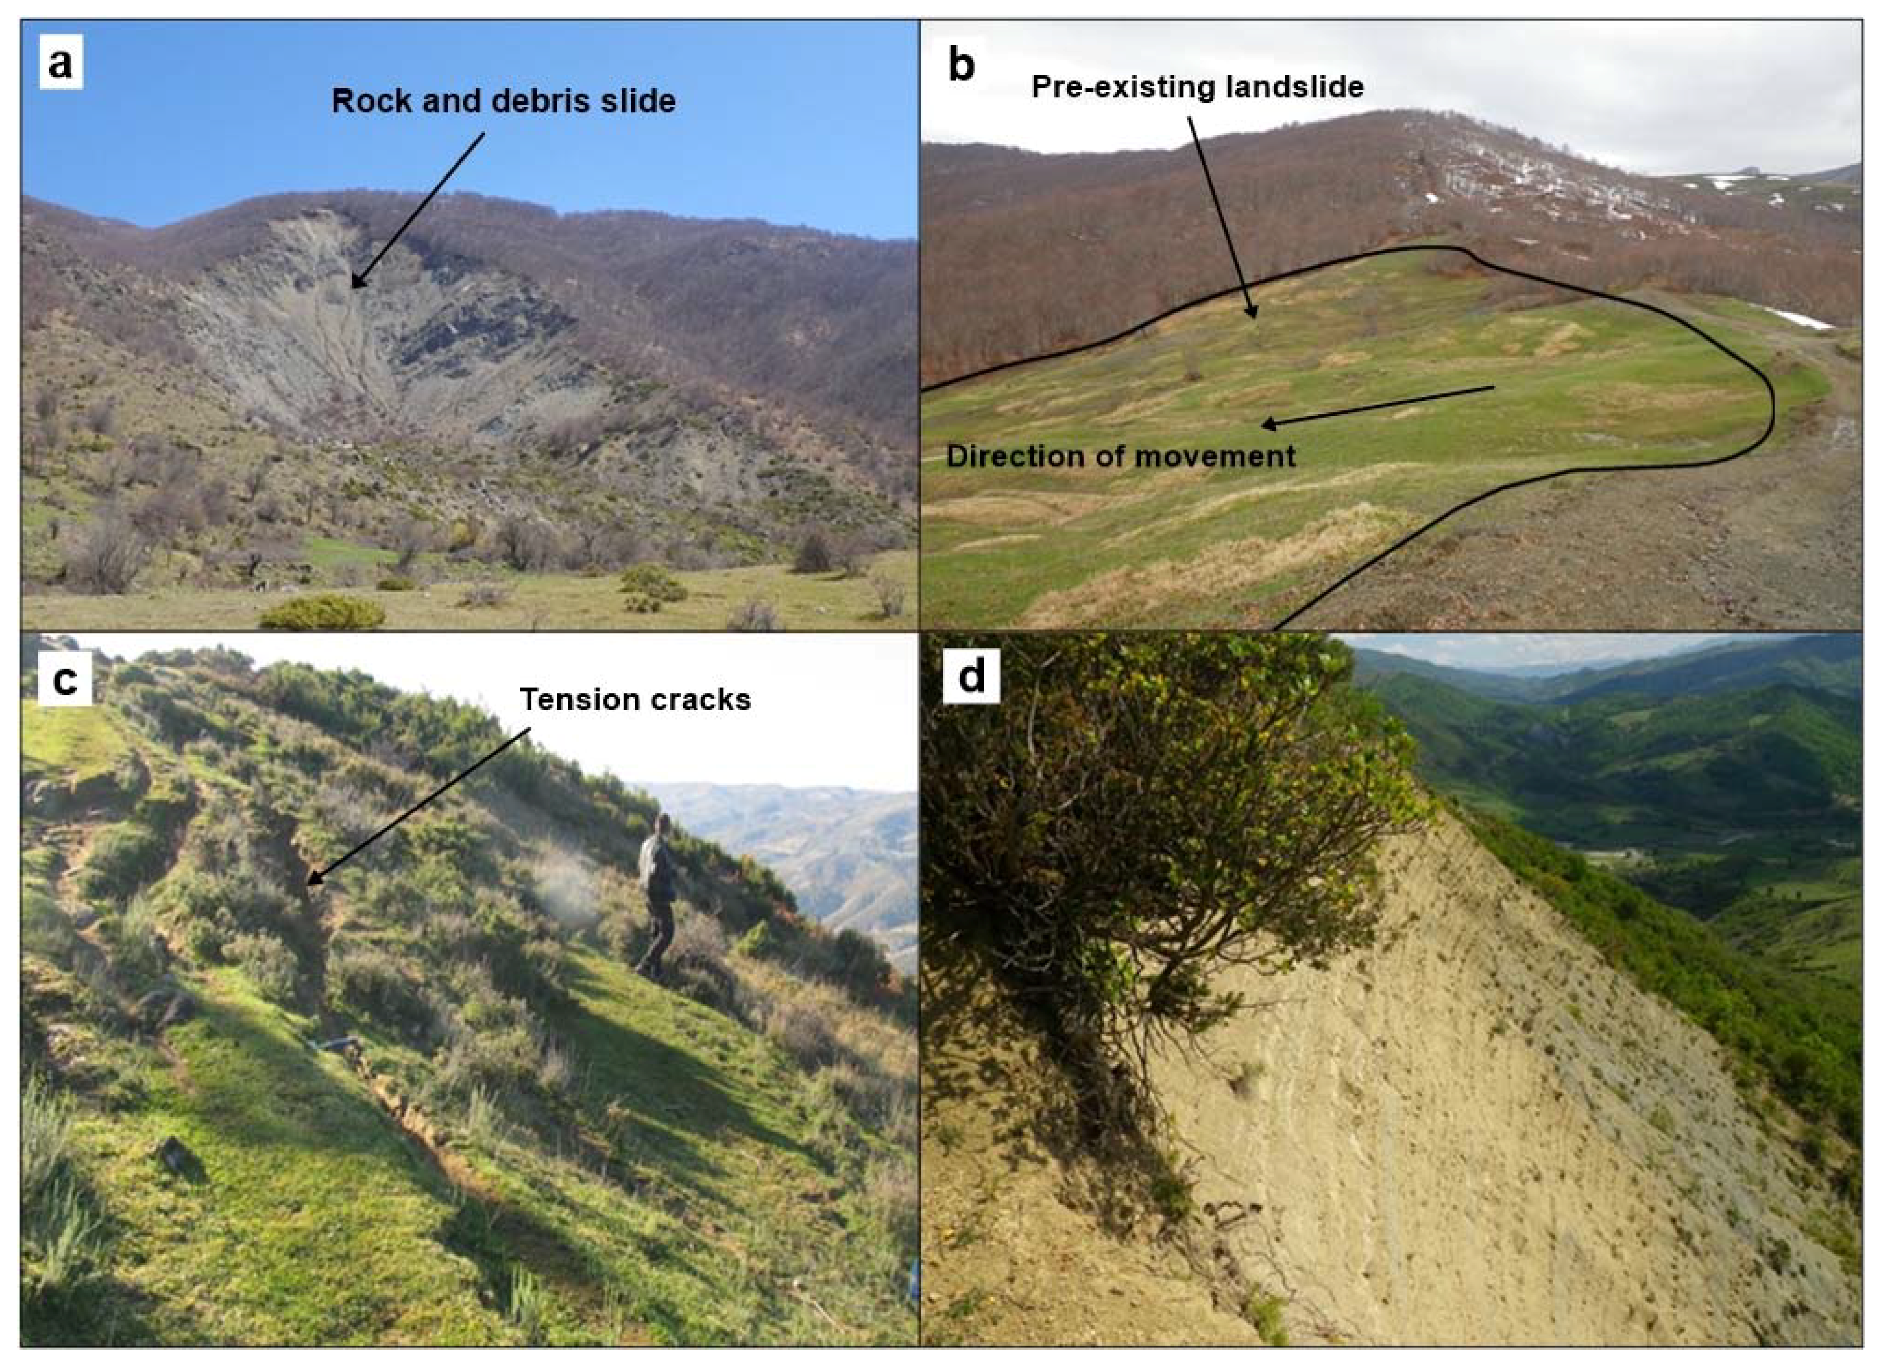
3.1. Landslide Identification
- Identification of possible old landslide areas from the topographic maps—Sudden changes of slope angle, flat areas or bulge on slopes (square, vis-à-vis contour lines).
- Identification of possible old landslide areas from satellite images (from Google Earth in this case)—bare, with no vegetation and/or steep slopes.
- Identification of surface water ponds and lakes.
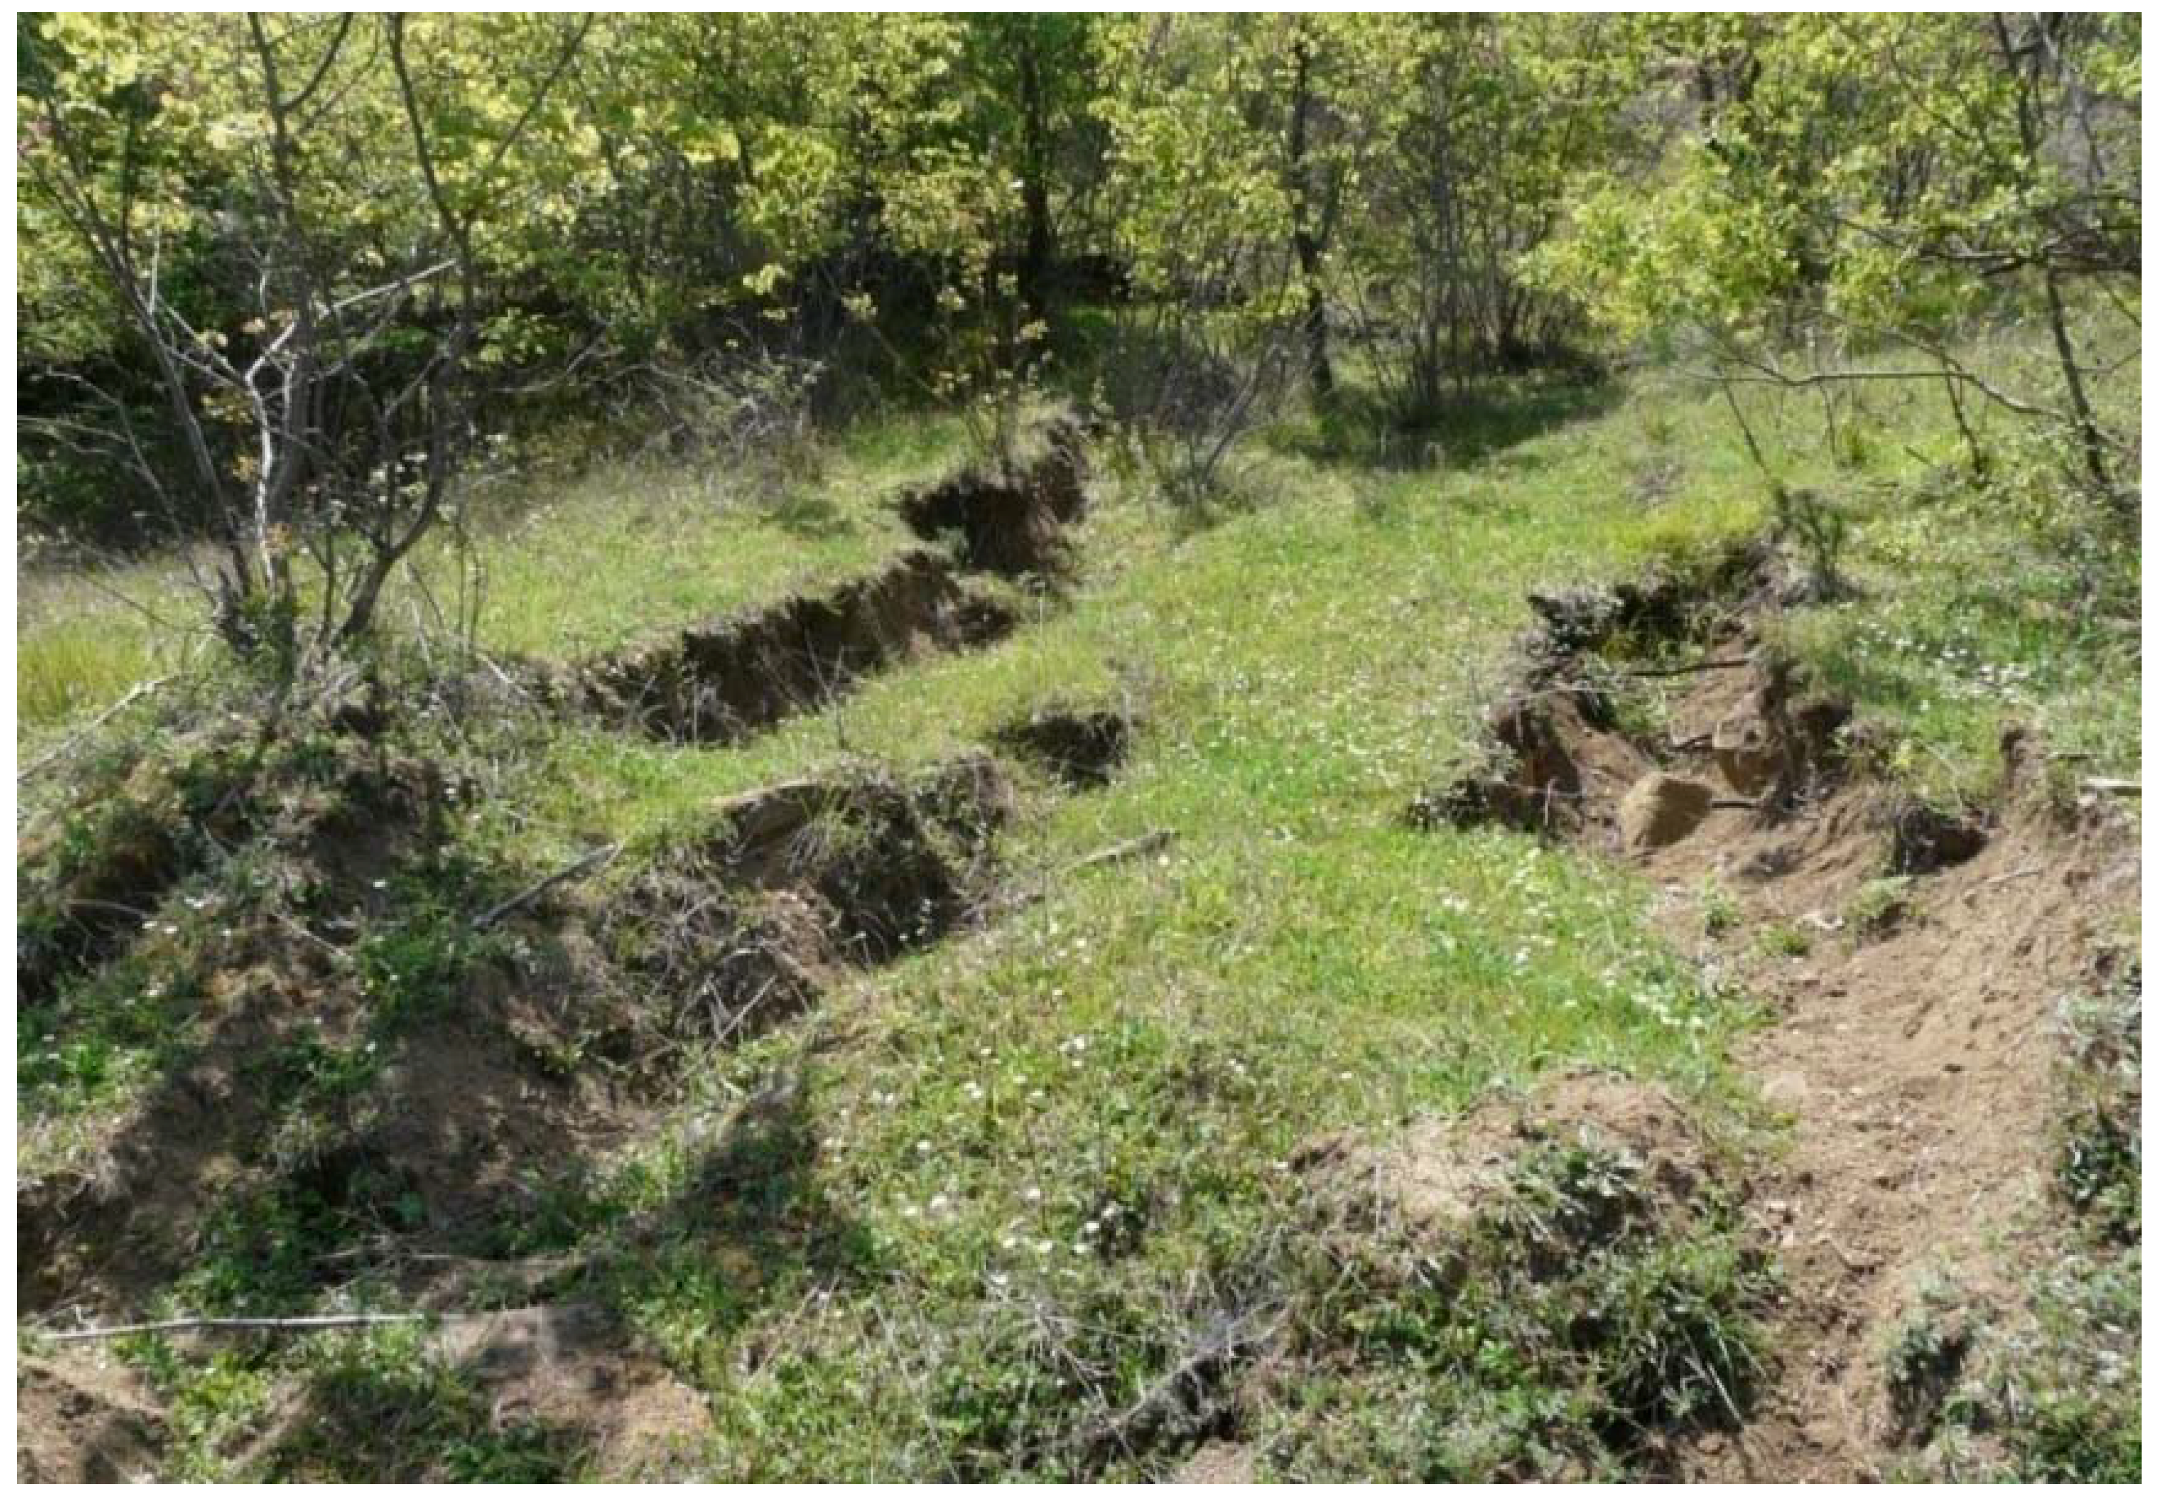
- Fresh cuts or ruptures along the slope, arch-shape or transversal to it;
- Wide undulating morphological features;
- Deformed vegetation—creep;
- Irregular topography with small hills and back-tilts along the slope;
- Springs, reservoirs of water (small lakes) in the middle of the slope;
- Sudden changes of slope angle, flat areas or bulge on slopes.
3.2. Landslide Inventory
4. Landslide Hazard Assessment
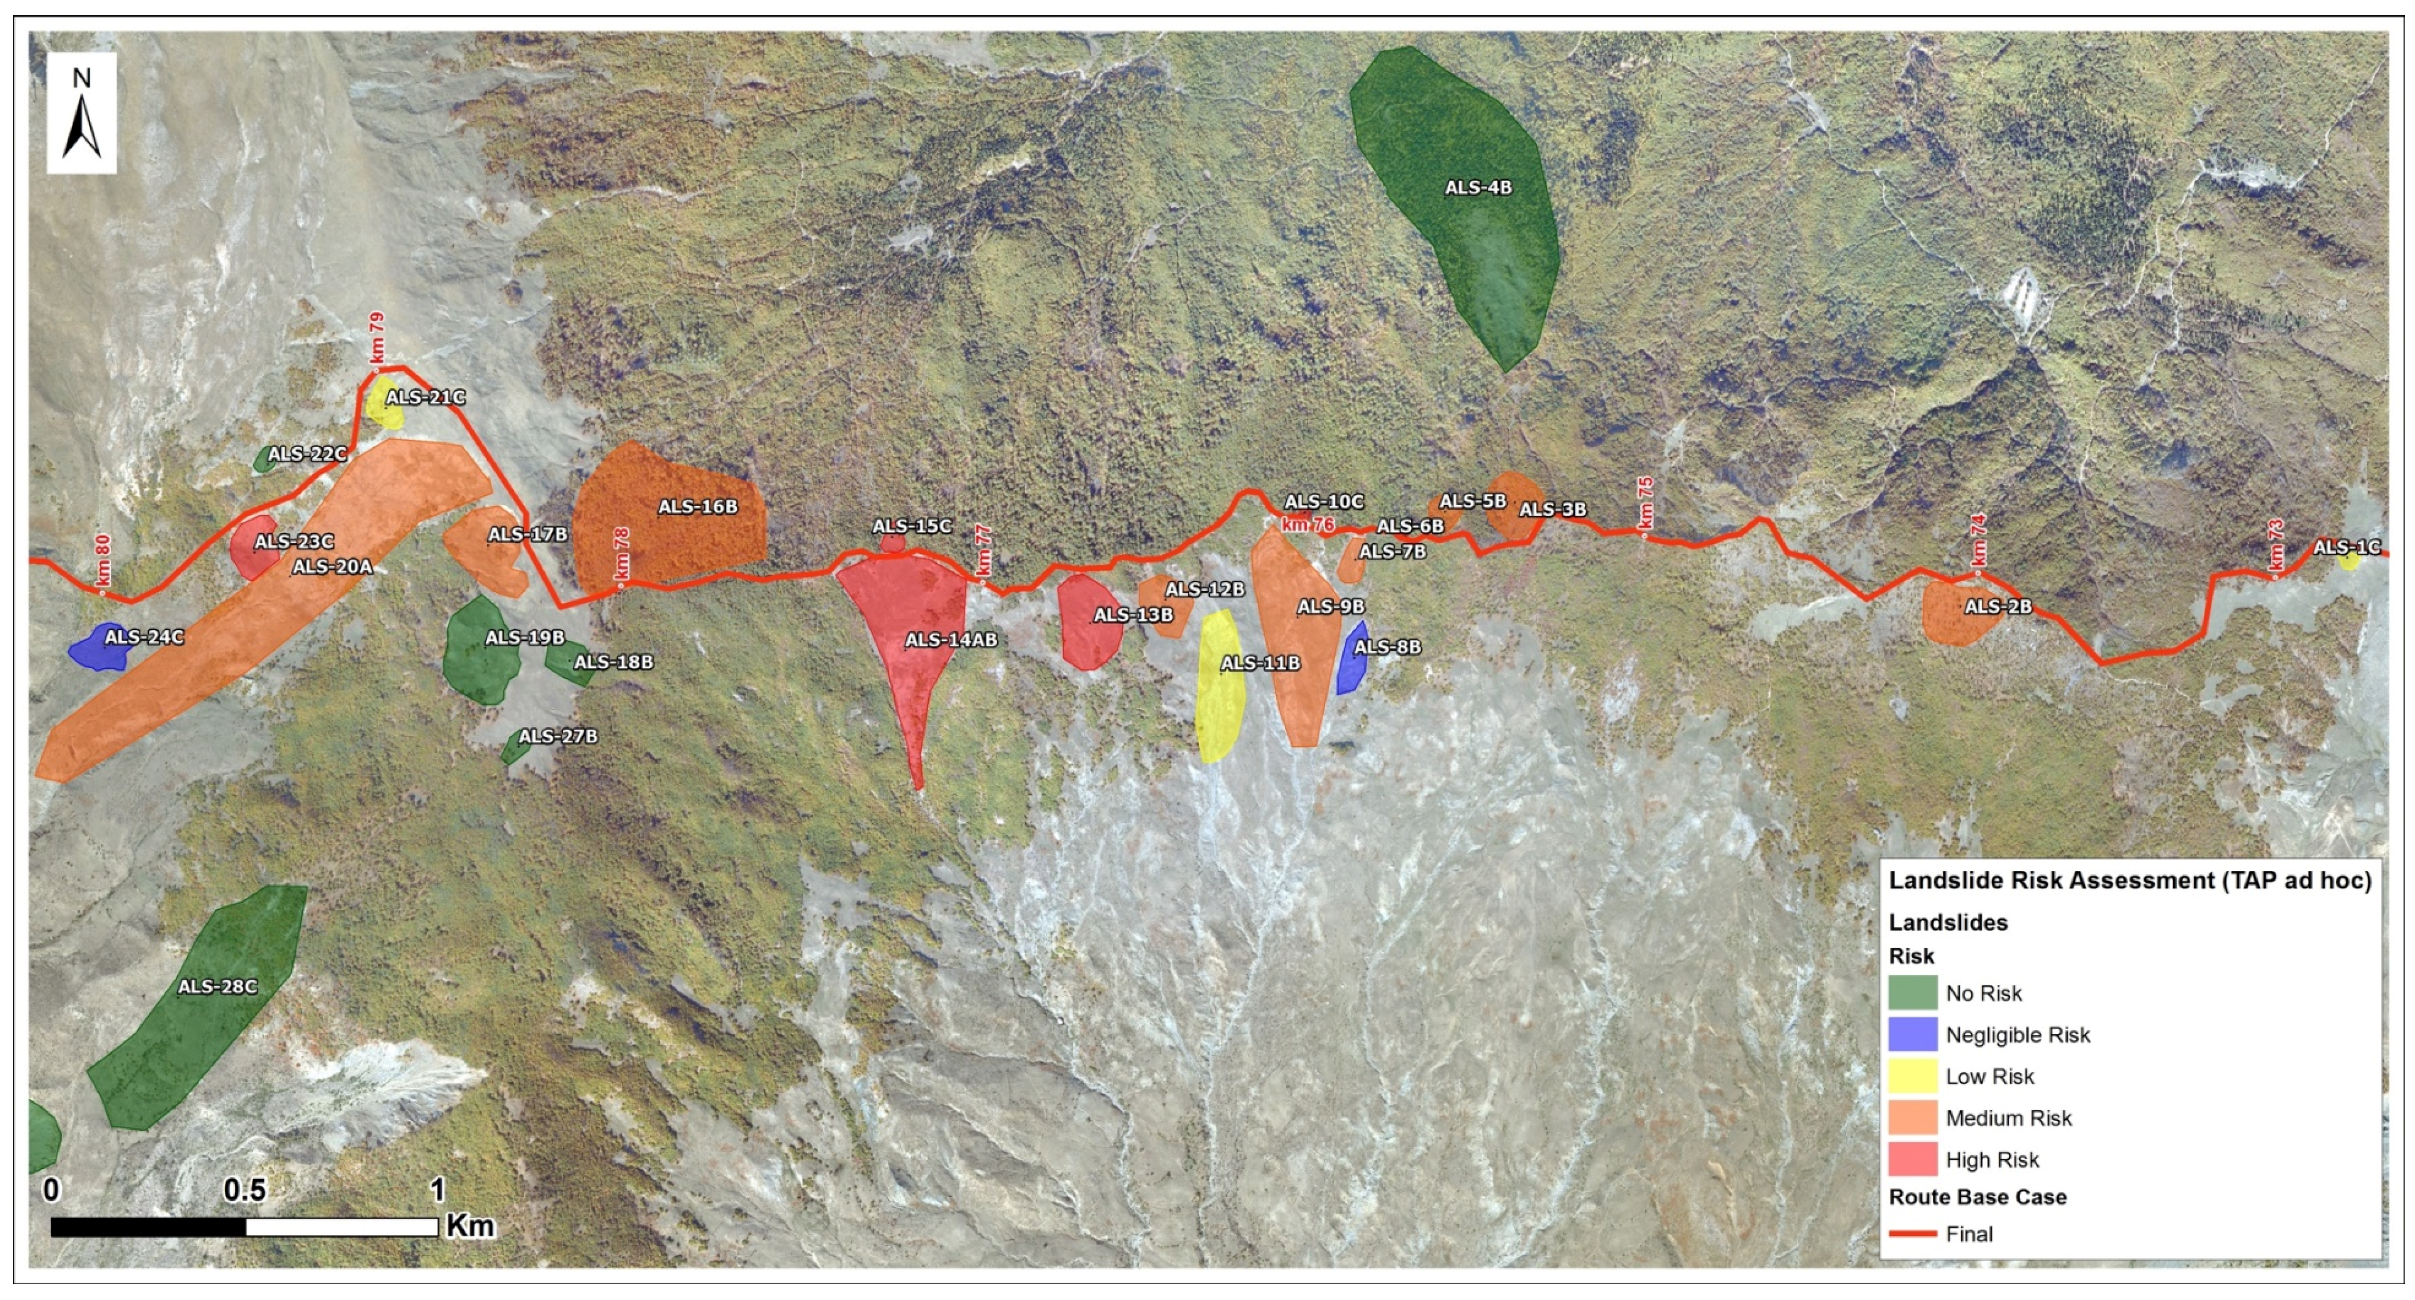
5. Landslide Risk Assessment
5.1. Likelihood of Pipeline Rupture (Risk Levels)
5.2. Risk Assessment Methodology
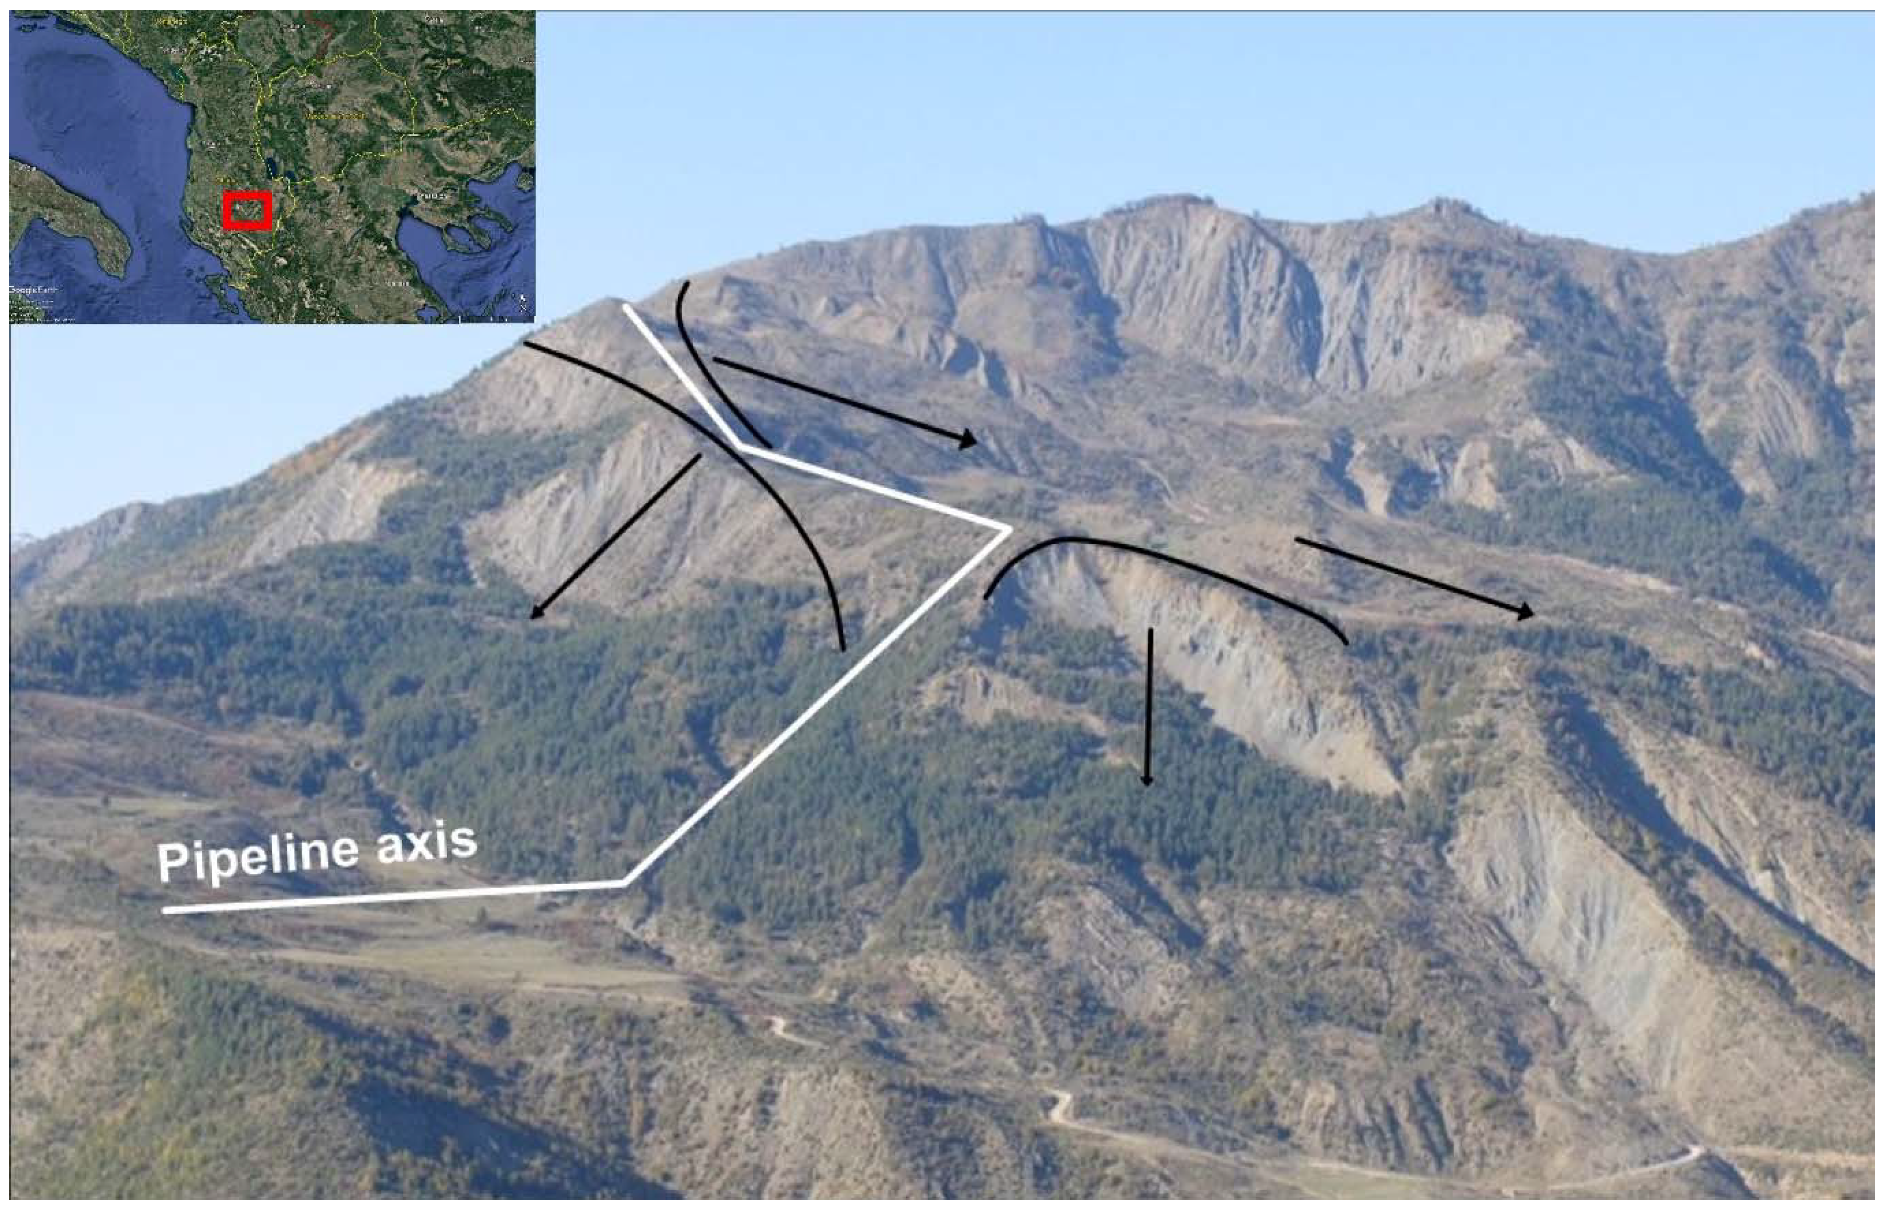
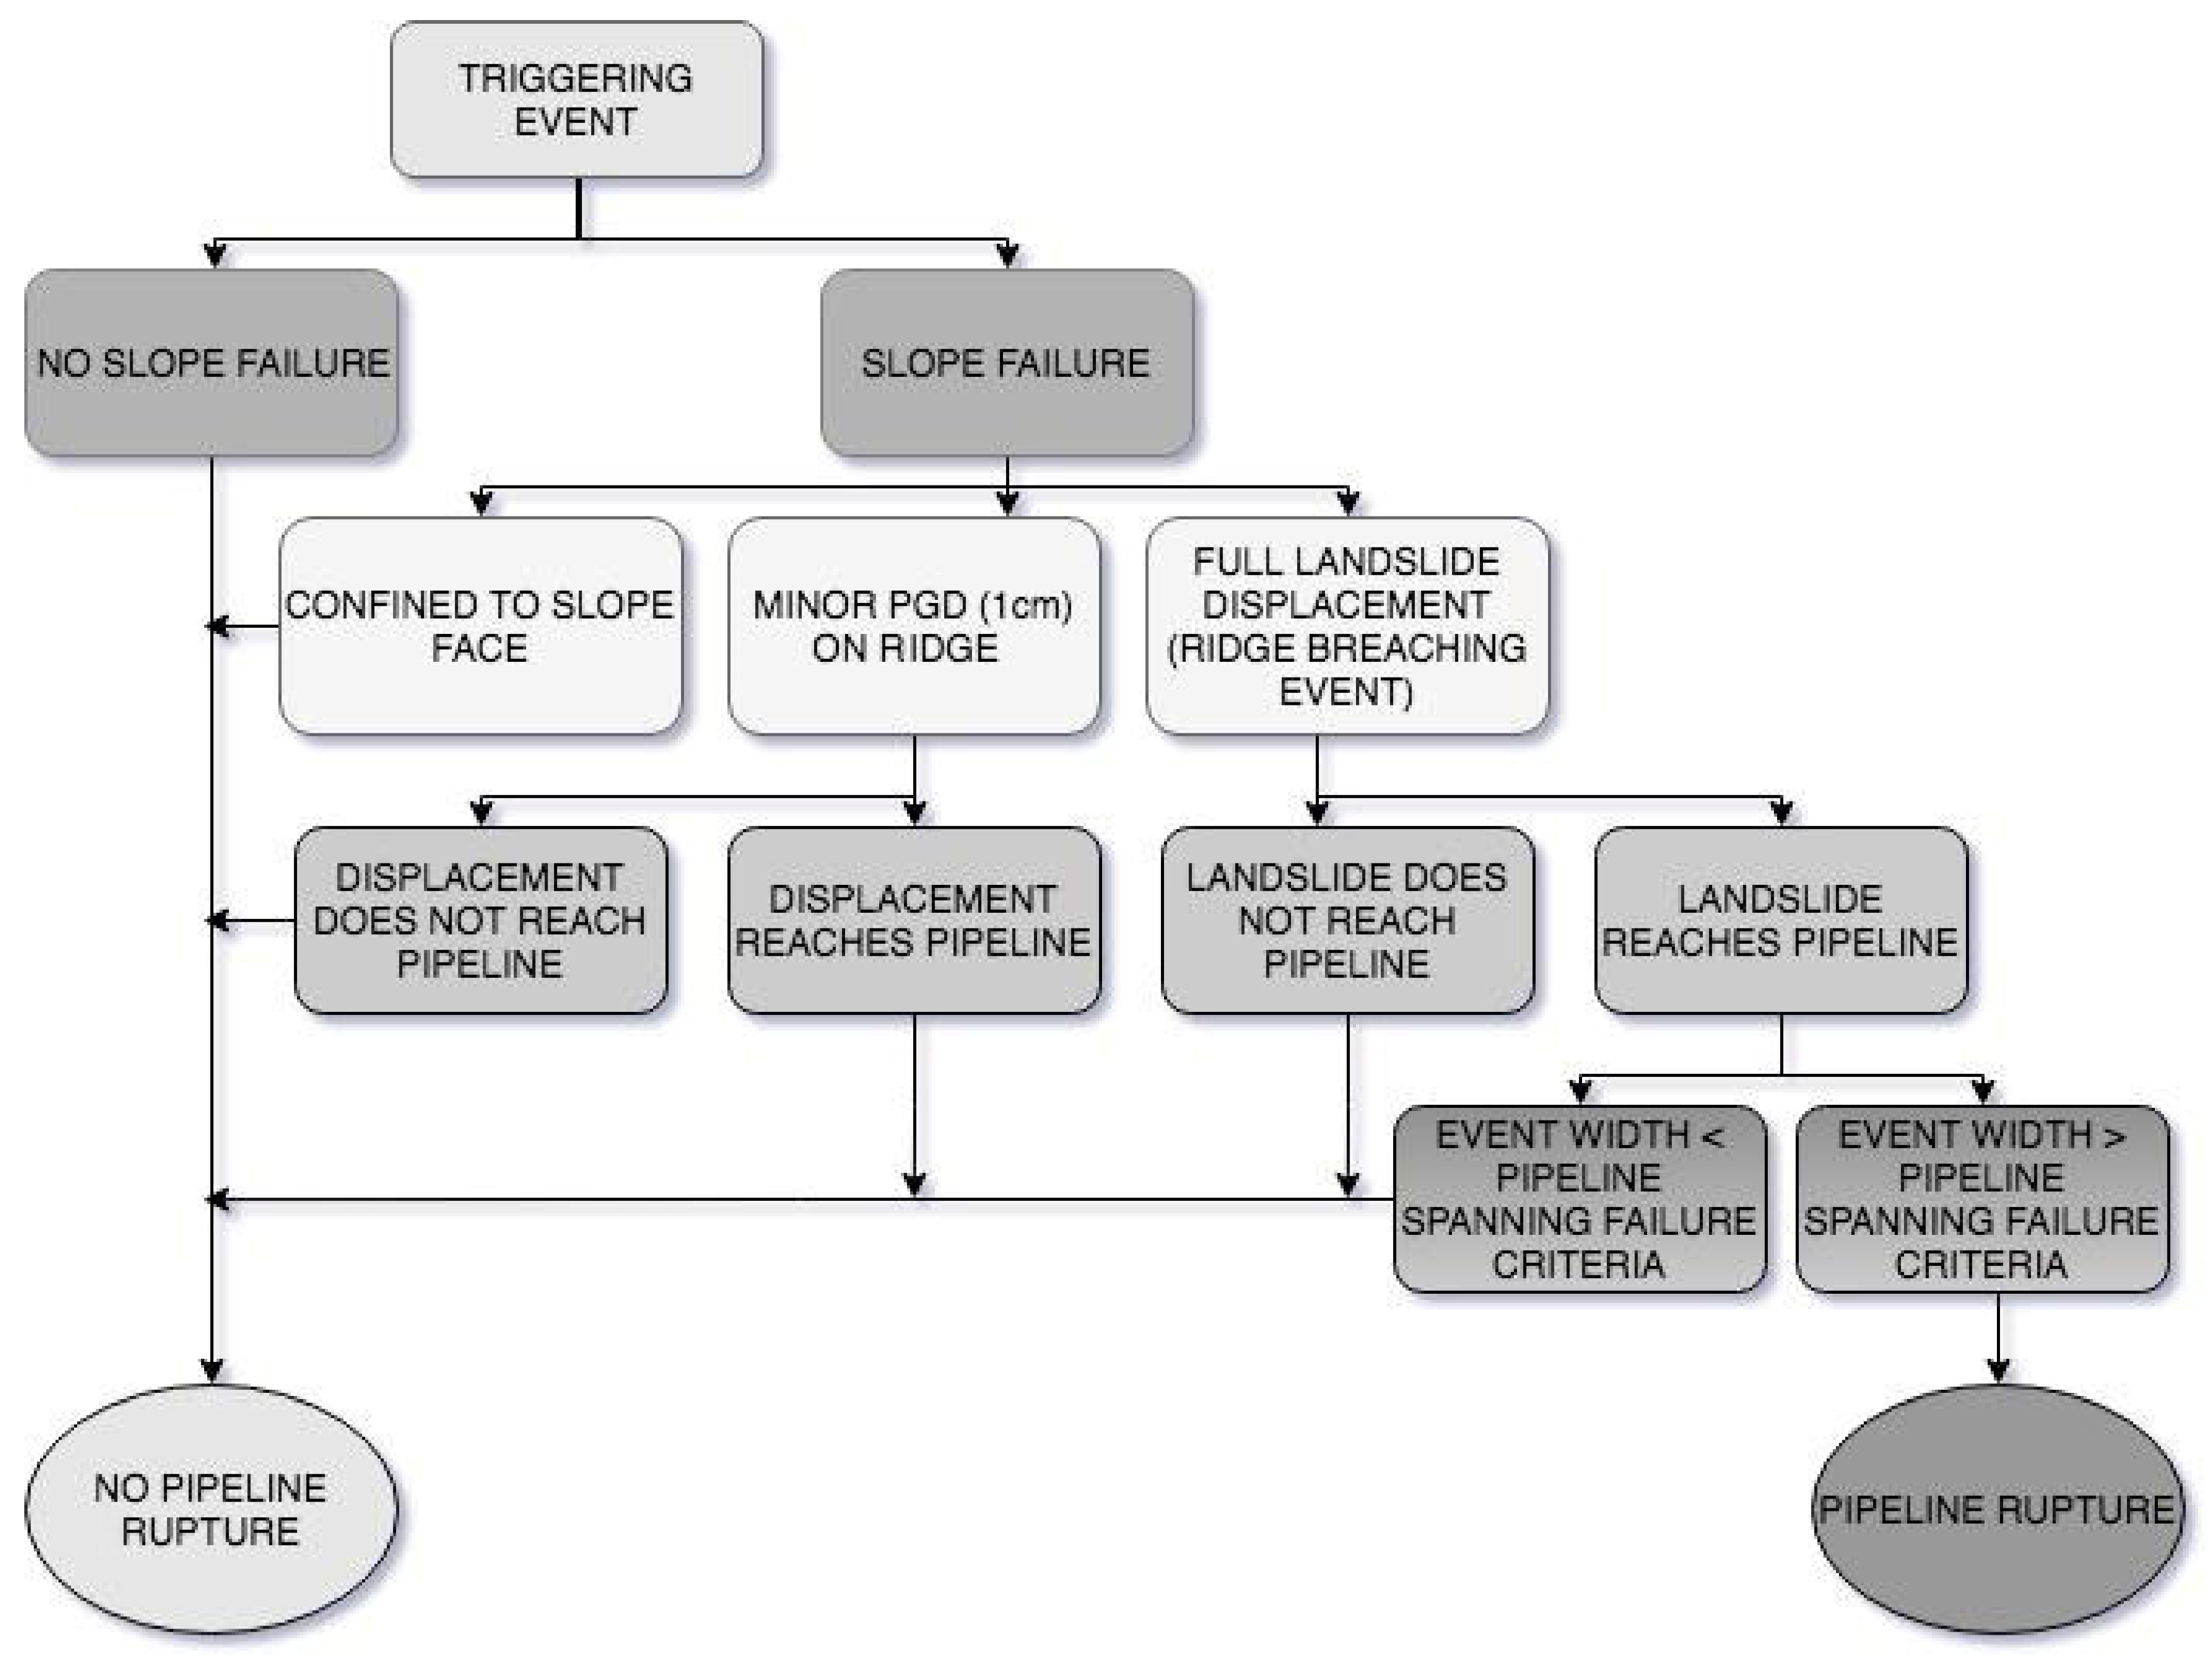
- Could a credible landslide event reach the pipeline? (Figure 16) Answering this question requires a judgement to be made about the size and intensity of the “expected landslide event” that could occur at a particular site, based on the current knowledge of the geological and geomorphological conditions. Clearly, the farther the landslide is from the route, the larger the event would have to be, while in many cases it was not considered credible for a landslide to reach the pipeline RoW.
- Given that the expected landslide has reached the pipeline, could the landslide cause a pipeline rupture event? (Figure 16) This involves a judgement about the potential for the landslide to generate conditions that exceed the simple displacement or spanning failure criteria. At several sites, the expected landslide was judged to be too small or shallow to cause pipeline rupture. However, at sites where several major landslides are found that could impact the pipeline, the rupture is considered as very probable.
- Given that a pipeline rupture event is possible, could the expected landslide be initiated under static conditions (i.e., triggered by climatic factors such as heavy rainfall or rapid snow melt)? If the site is stable under static conditions, could the expected landslide be initiated by a low-frequency strong earthquake (non-static conditions? (Figure 16) This judgement was based on the current knowledge of the geological and geomorphological conditions at a particular site, supported by the findings of static-case slope stability analyses at seven indicative sites. It is noted that for the static and non-static (seismic) stability analyses, landslides were assumed to be triggered in those cases where the Factor of Safety was less than 1.0, and, because of uncertainties about the ground conditions and groundwater levels, where the Factor of Safety was marginally above 1.
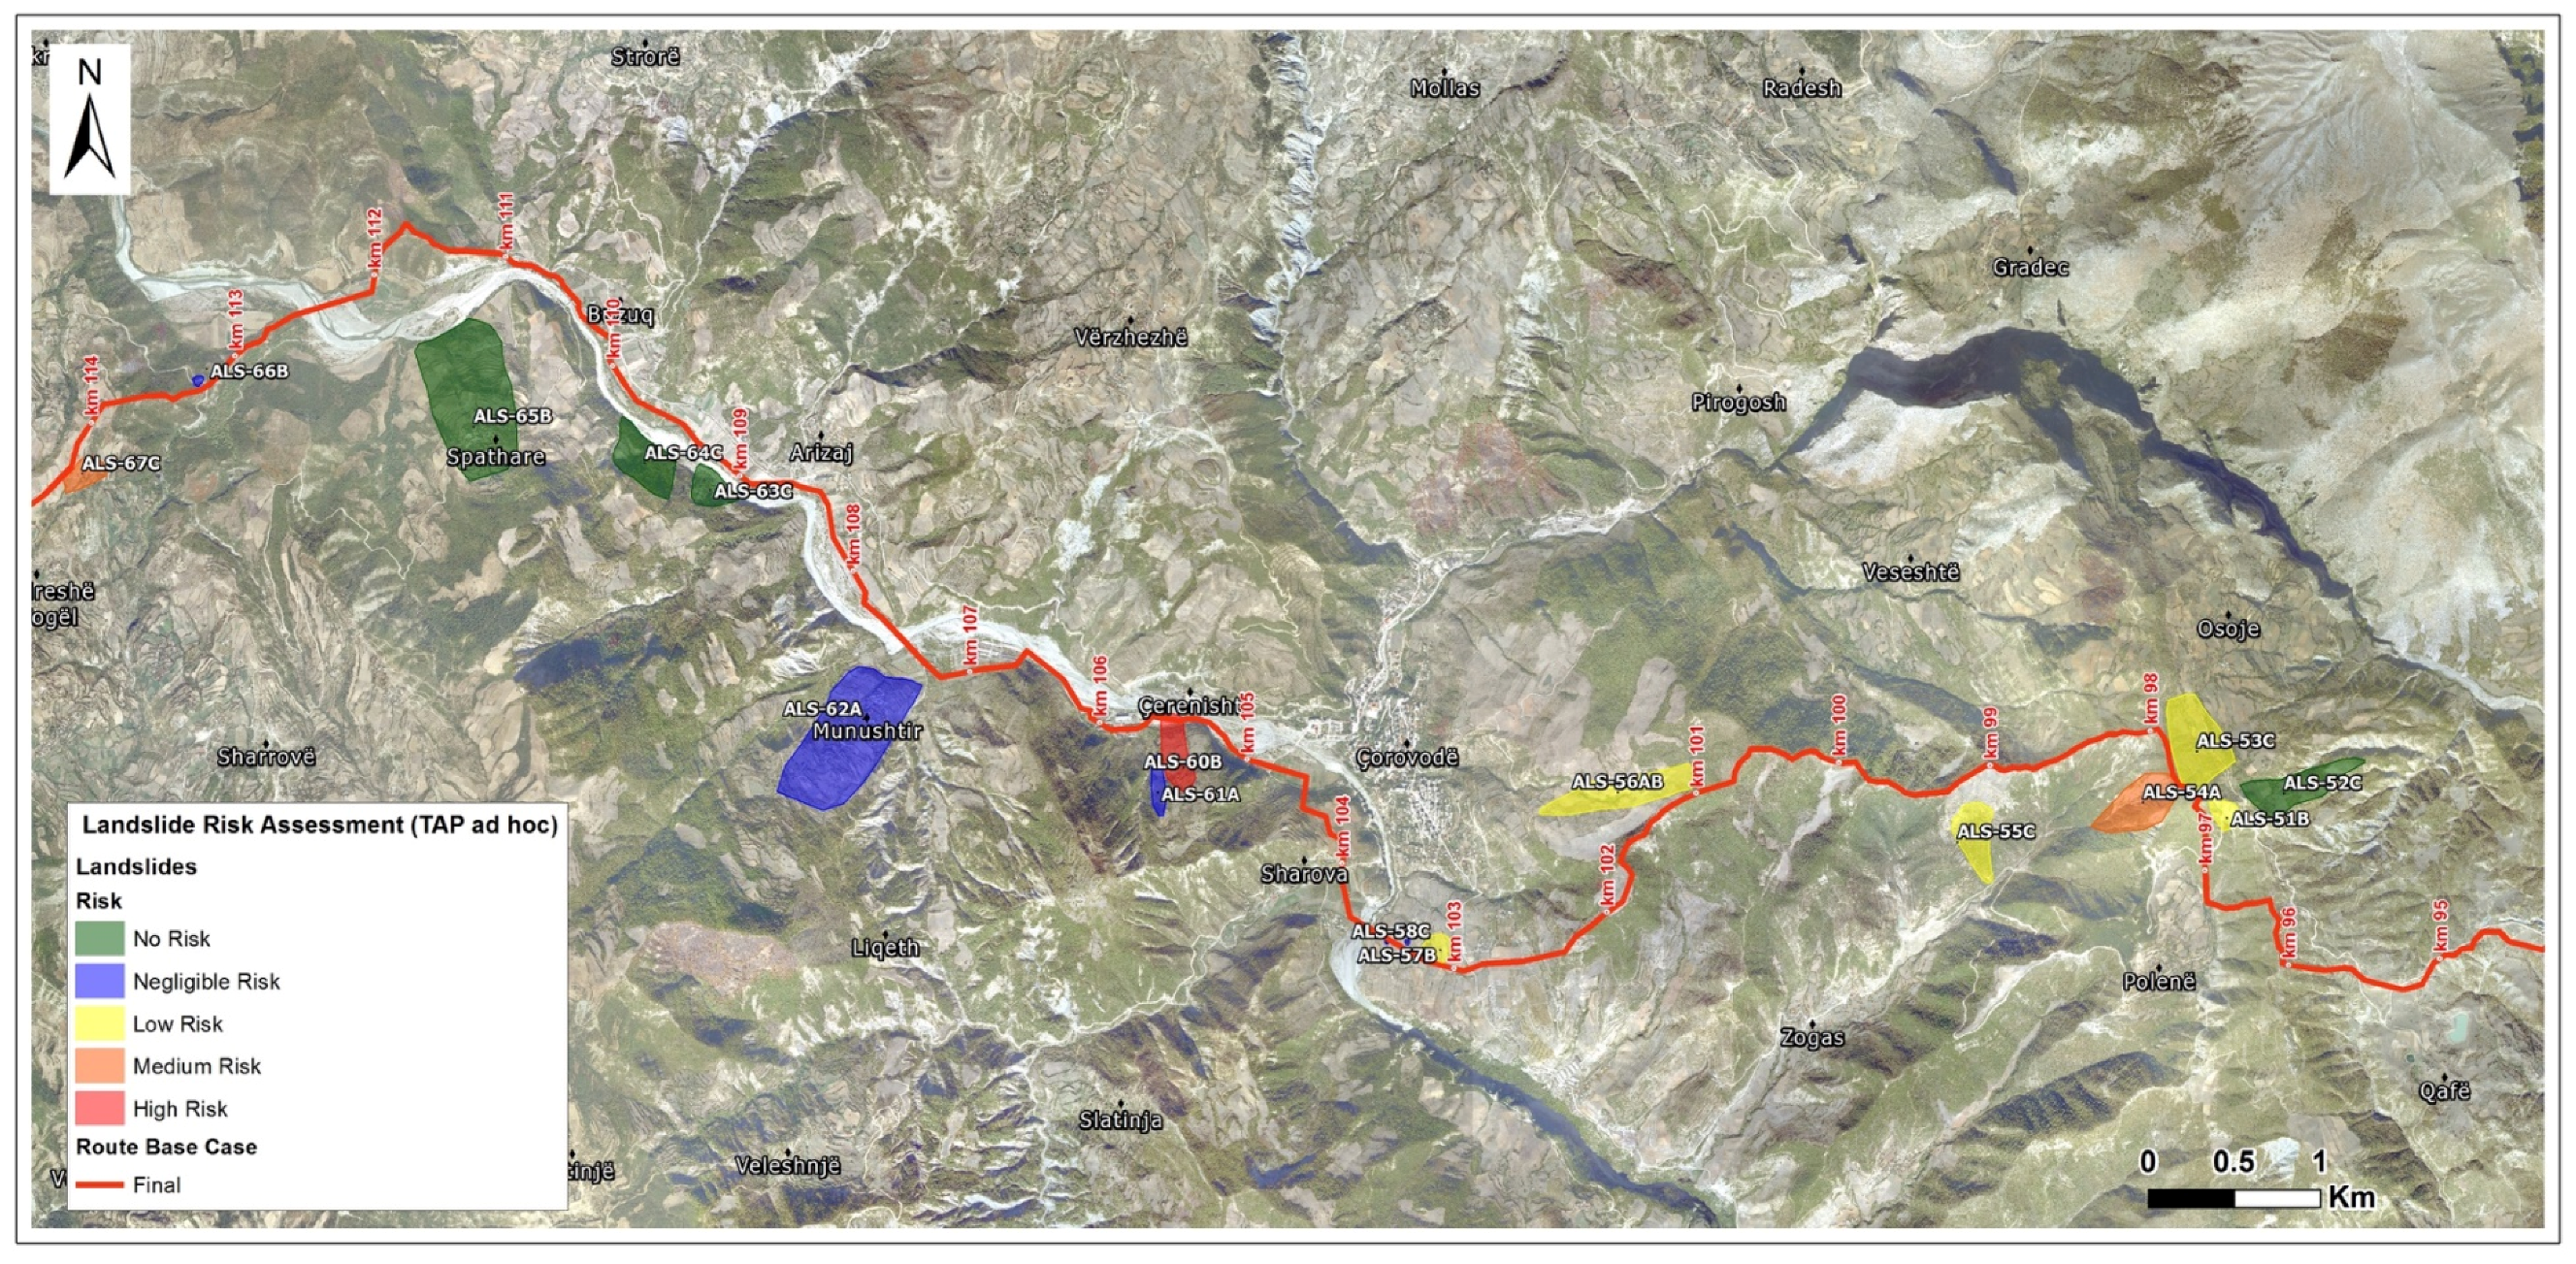
5.3. Risk Assessment Results
5.4. Risk Assessment Examples
5.4.1. Landslide ALS-14AB
- (A)
- Parameters affecting expected damage to the pipeline, if the landslide is activated.
- Landslide area: Large, absolute value 3, weighted value 3 × 15% = 0.45
- Landslide depth: Medium, absolute value 2, weighted value 2 × 25% = 0.50
- Proximity to pipeline: In contact with pipeline, absolute value 3, weighted value 3 × 60% = 1.8
- (B)
- Parameters affecting possibility of landslide activation.
- Landslide activity: Active, absolute value 3, weighted value 3 × 50% = 1.5
- Ground quality: Poor, absolute value 3, weighted value 3 × 25% = 0.75
- Slope angle: Gentle, absolute value 1, weighted value 1 × 25% = 0.25
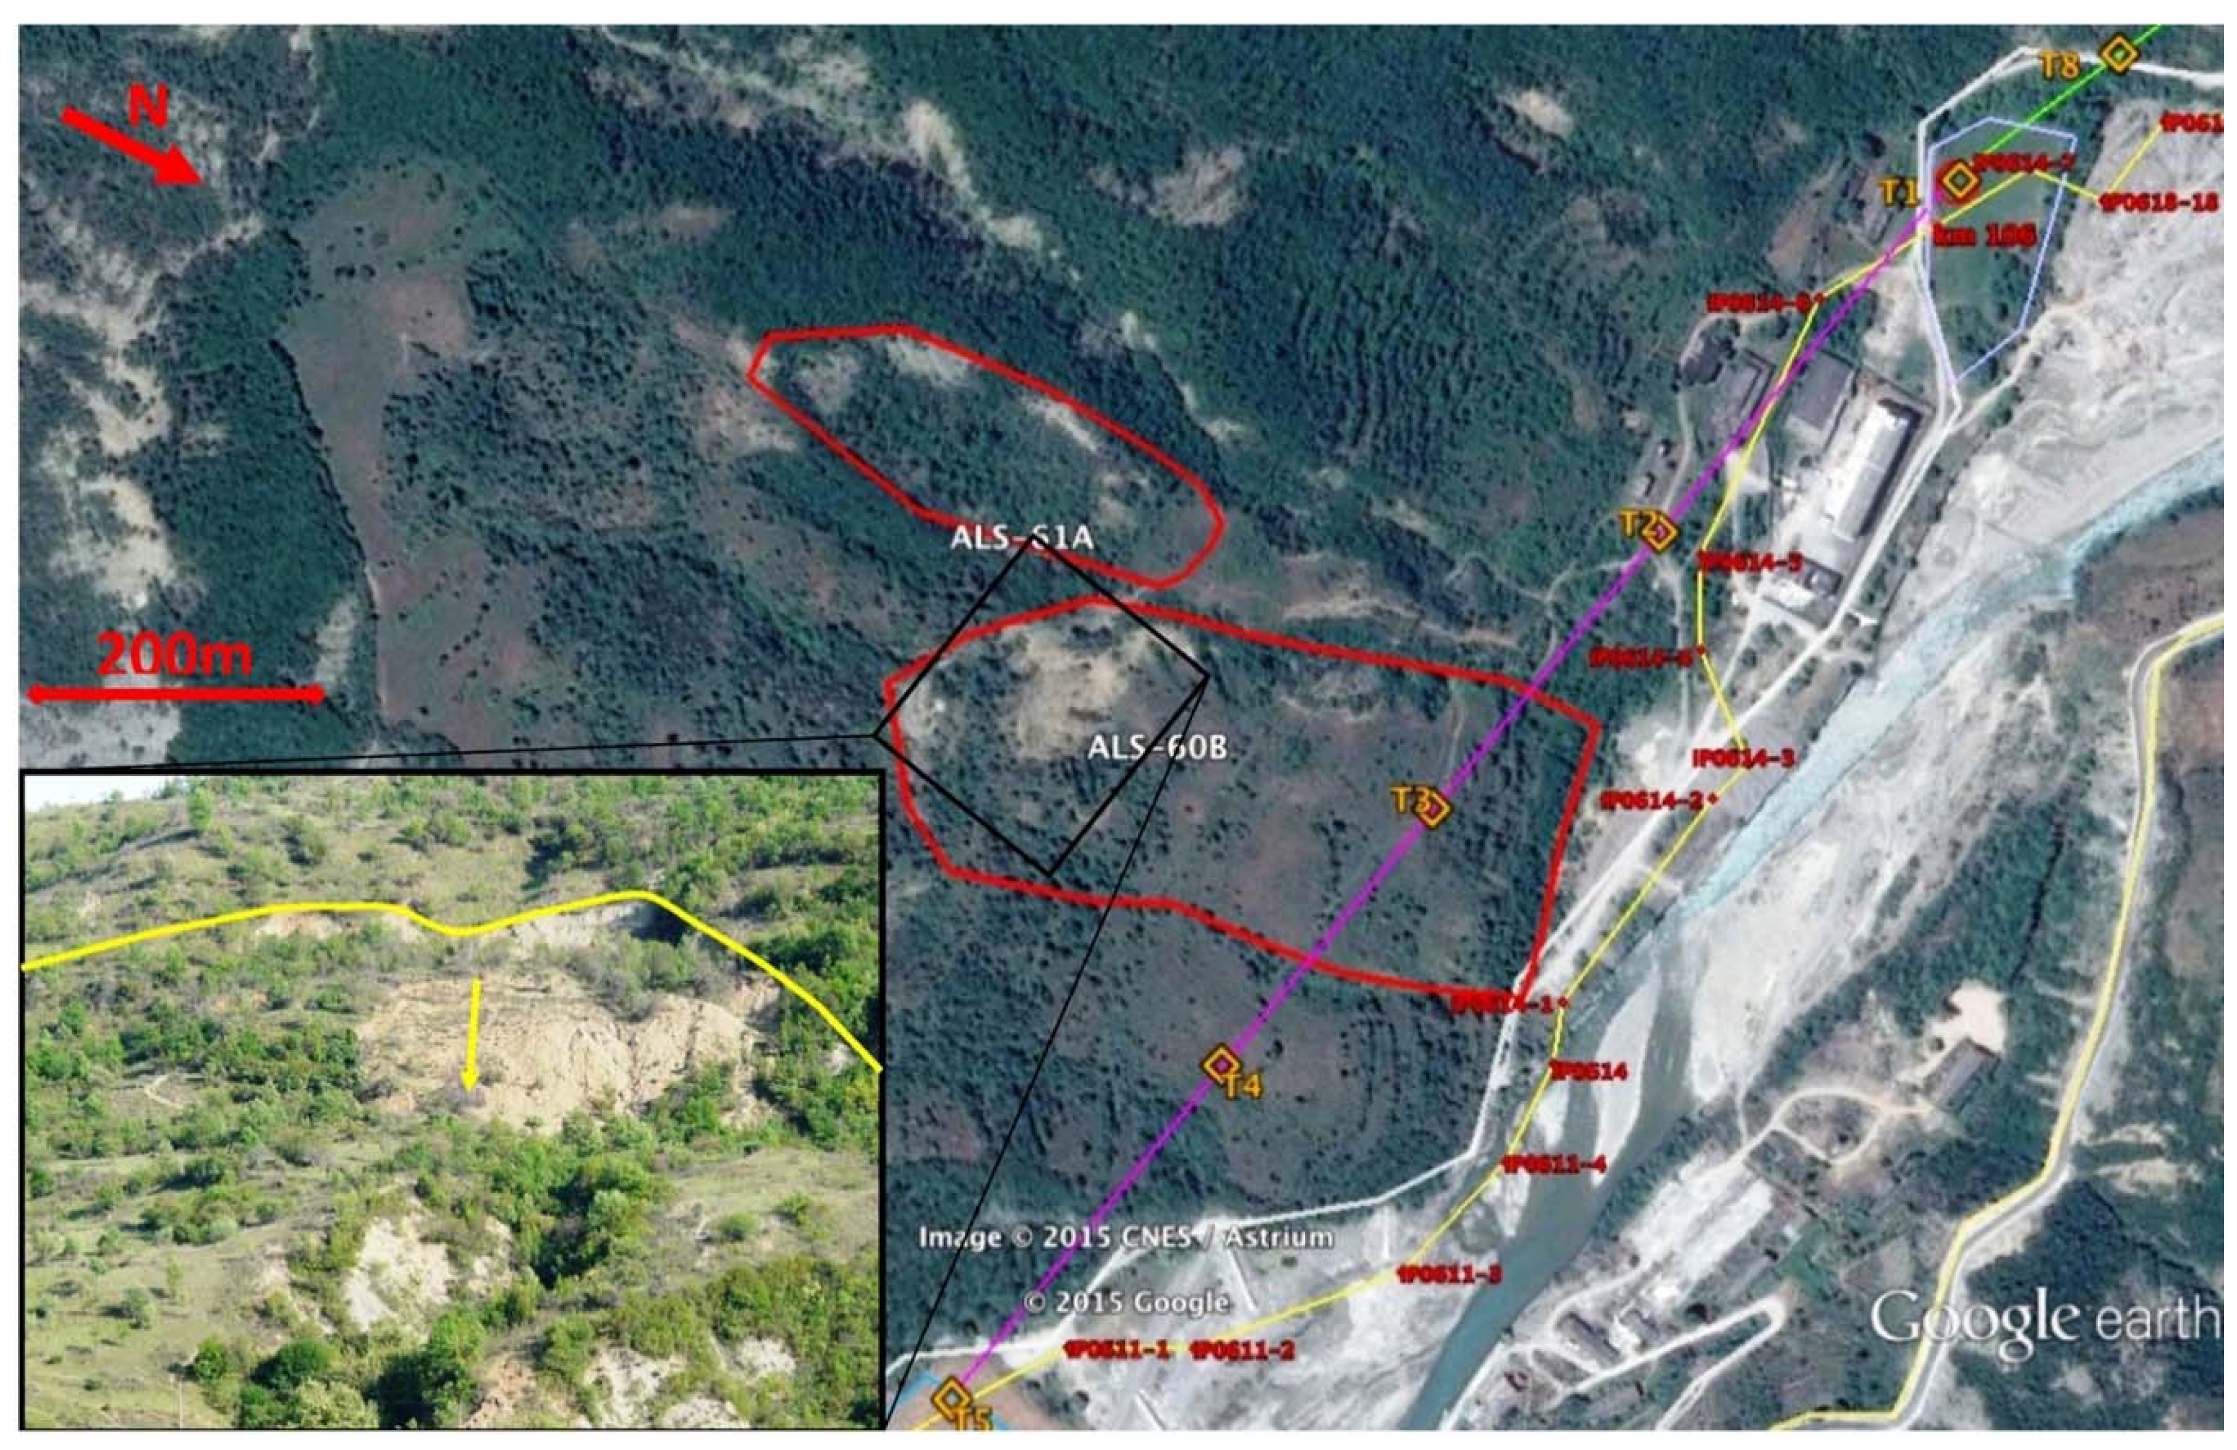
5.4.2. Landslide ALS-60B
- (C)
- Parameters affecting expected damage to the pipeline, if the landslide is activated.
- Landslide area: Large, absolute value 3, weighted value 3 × 15% = 0.45
- Landslide depth: Deep, absolute value 3, weighted value 3 × 25% = 0.75
- Proximity to pipeline: Close to pipeline, absolute value 2, weighted value 2 × 60% = 1.2
- (D)
- Parameters affecting possibility of landslide activation.
- Landslide activity: Active, absolute value 3, weighted value 3 × 50% = 1.5
- Ground quality: Poor, absolute value 3, weighted value 3 × 25% = 0.75
- Slope angle: Moderately steep, absolute value 2, weighted value 2 × 25% = 0.5
6. Discussion
7. Conclusions
Author Contributions
Funding
Acknowledgments
Conflicts of Interest
References
- Nyman, D.; Lee, E.M.; Audibert, J.M. Mitigating geohazards for international pipeline projects: Challenges and lessons learned. In Proceedings of the IPC 2008: 7th International Pipeline Conference, Calgary, AB, Canada, 29 September–3 October 2008; pp. 639–948. [Google Scholar]
- Savigny, K.W.; Porter, M.; Leir, M. Geohazard risk management for the onshore pipeline industry. Bus. Br. 2005, 2, 1–3. [Google Scholar]
- Sweeney, M. (Ed.) Terrain and Geohazard Challenges Facing Onshore Oil and Gas Pipelines; Thomas Telford: London, UK, 2005; p. 758. [Google Scholar]
- Lee, E.M. Landslide risk assessment: The challenge of estimating the probability of landsliding. Q. J. Eng. Geol. Hydrogeol. 2009, 42, 445–458. [Google Scholar] [CrossRef]
- Young, A.; Lockey, A. The assessment of pipeline integrity in geohazard areas using ILI data. In Proceedings of the ASME 2013 International Pipeline Geotechnical Conference, Bogota, Colombia, 24–26 July 2013; p. V001T02A008. [Google Scholar]
- Dai, F.C.; Lee, C.F.; Ngai, Y.Y. Landslide risk assessment and management: An overview. Eng. Geol. 2002, 64, 65–87. [Google Scholar] [CrossRef]
- Erener, A.; Düzgün, H.B.S. A regional scale quantitative risk assessment for landslides: Case of Kumluca watershed in Bartin, Turkey. Landslides 2013, 10, 55–73. [Google Scholar] [CrossRef]
- Fell, R.; Corominas, J.; Bonnard, C.; Cascini, L.; Leroi, E.; Savage, W.Z. Guidelines for landslide susceptibility, hazard and risk zoning for land use planning. Eng. Geol. 2008, 102, 85–98. [Google Scholar] [CrossRef] [Green Version]
- Yamagishi, H.; Moncada, R. TXT-Tool 1.081-3.1 Landslide Recognition and Mapping Using Aerial Photographs and Google Earth, Landslide Dynamics: ISDR-ICL Landslide Interactive Teaching Tools; Volume 1: Fundamentals, Mapping and Monitoring; Springer: Cham, Switzerland, 2018; pp. 67–82. [Google Scholar]
- Guzzetti, F.; Reichenbach, P.; Cardinali, M.; Galli, M.; Ardizzone, F. Probabilistic landslide hazard assessment at the basin scale. Geomorphology 2005, 72, 272–299. [Google Scholar] [CrossRef]
- Guzzetti, F.; Mondini, A.C.; Cardinali, M.; Fiorucci, F.; Santangelo, M.; Chang, K.T. Landslide inventory maps: New tools for an old problem. Earth-Sci. Rev. 2012, 112, 42–66. [Google Scholar] [CrossRef] [Green Version]
- SafeLand. Guidelines for landslide susceptibility, hazard and risk assessment and zoning. In Living with Landslide Risk in Europe: Assessment, Effects of Global Change, and Risk Management Strategies, Deliverable D2.4; EU-FP7 SafeLand Project, Ed.; SafeLand; Norwegian Geotechnical Institute: Stryn, Norway, 2011; 173p. [Google Scholar]
- Cardinali, M.; Reichenbach, P.; Guzetti, F.; Ardizzone, F.; Antonini, G.; Galli, M.; Cacciano, M.; Castellani, M.; Salvati, P. A geomorphological approach to the estimation of landslide hazards and risks in Umbria, Central Italy. Nat. Hazards Earth Syst. Sci. 2002, 2, 57–72. [Google Scholar] [CrossRef] [Green Version]
- Cruden, D.M.; Varnes, D.J. Landslides types and processes. In Landslides: Investigation and Mitigation; Turner, A.K., Schuster, R.L., Eds.; National Academic Press: Washington, DC, USA, 1996; pp. 35–76. [Google Scholar]
- Carrara, A.; Crosta, G.B.; Frattini, P. Geomorphological and historical data in assessing landslide hazard. Earth Surf. Process. Landf. 2003, 28, 1125–1142. [Google Scholar] [CrossRef]
- Klose, M.; Damm, B.; Highland, L.M. Geohazard Databases: Concepts, Development, Applications. Geomorphology 2015, 249, 1–136. [Google Scholar] [CrossRef]
- Piacentini, D.; Troiani, F.; Daniele, G.; Pizziolo, M. Historical geospatial database for landslide analysis: The Catalogue of Landslide Occurrences in the Emilia-Romagna Region (CLOCkER). Landslides 2018, 15, 811–822. [Google Scholar] [CrossRef]
- Ghosh, S.; van Westen, C.J.; Carranza, E.; Jetten, V. Integrating spatial, temporal, and magnitude probabilities for medium-scale landslide risk analysis in Darjeeling Himalayas, India. Landslides 2011, 9, 371–384. [Google Scholar] [CrossRef]
- O.G.S. Seismological Report for Albania; TAP: Lisbon, Portugal, 2013. [Google Scholar]
- Hoek, E.; Brown, E.T. Hoek-Brown failure criterion and, G.S.I—2018 Edition. J. Rock Mech. Geotech. Eng. 2018, in press. [Google Scholar] [CrossRef]
- Hoek, E.; Carranza-Torres, C.; Corkum, B. Hoek-Brown criterion—2002 edition. In Mining and Tunnelling Innovation and Opportunity, Proceedings of the 5th North American Rock Mechanics Symposium and 17th Tunnelling Association of Canada Conference, Toronto, ON, Canada, 7–10 July 2002; Hammah, R., Bawden, W., Curran, J., Telesnicki, M., Eds.; University of Toronto: Toronto, ON, Canada, 2002; Volume 1, pp. 267–273. [Google Scholar]
- Varnes, D.J. Slope movement types and processes. In Landslides—Analysis and control: National Research Council; Special Report 176; Schuster, R.L., Krizek, R.J., Eds.; Transportation Research Board: Washington, DC, USA, 1978; pp. 11–33. [Google Scholar]
- Uzielli, M.; Nadim, F.; Lacasse, S.; Kaynia, A.M. A conceptual framework for quantitative estimation of physical vulnerability to landslides. Eng. Geol. 2008, 102, 251–256. [Google Scholar] [CrossRef]


| Landslide | Activity 1 | Scale 2 | Proximity (to) 3 (Distance) | Slope Steepness 4 | Ground Quality 5 | Sliding Depth 6 | Hazard Class | Action |
|---|---|---|---|---|---|---|---|---|
| ALS-1C | active | small (1886 m2) | proximate (flank) (10 m) | gentle | Poor | shallow | low | Avoid: Move the route 15 m to the NE (discussed in the field) |
| ALS-3B | active | medium (19,188 m2) | proximate (crown) (7 m) | moderately steep | poor | medium | moderate | Investigation—Remedial Measures (not considered extensive and deep) |
| ALS-7B | active | small (6067 m2) | distant (crown) (28 m) | gentle | poor | shallow | low | Investigation—Remedial Measures (not considered extensive and deep) |
| ALS-10C | active | small (746 m2) | in contact (crown) (2 m) | gentle | poor | shallow | moderate | Investigation—Remedial Measures (not considered extensive and deep) |
| ALS-13B | active | medium (31,684 m2) | proximate (crown) (23 m) | gentle | poor | shallow | moderate | Investigation—Remedial Measures (not considered extensive, approximately 60 m) |
| ALS-14AB | active | large (90,259 m2) | in contact (crown) (2 m) | gentle | poor | medium | high | Investigation—Remedial Measures Isolate the pipeline from the sliding mass |
| ALS-15C | active | small (3493 m2) | in contact (crown) (2 m) | gentle | poor | shallow | moderate | Isolate the pipeline from the sliding mass (from the measures of the ALS-14AB) |
| ALS-16B | active | medium (39,230 m2) | in contact (body) (0 m) | moderately steep | moderate | medium | moderate | Avoid: Keep the pipeline to the southern side |
| ALS-17B | active | medium (32,751 m2) | distant (crown) (21 m) | gentle | moderate | medium | low | Avoid: Keep the pipeline to the NE |
| ALS-21C | active | small (8664 m2) | distant (flank) (74 m) | gentle | moderate | medium | low | Avoid |
| ALS-22C | active | small (2747 m2) | distant (flank) (36 m) | gentle | moderate | medium | low | Avoid |
| ALS-45C | active | small (820 m2) | proximate (crown) (6 m) | moderately steep | moderate | medium | moderate | Investigation – Remedial Measures (not considered extensive and deep) |
| ALS-47B | unknown | large (220,536 m2) | in contact (crown) (3 m) | gentle | moderate | medium | high | Investigation – Remedial Measures (not considered extensive and deep) |
| ALS-60B | active | large (53,689 m2) | proximate (toe) (12 m) | moderately steep | poor | medium | high | Keep the pipeline below the sliding surface by changing the excavation method (e.g., microtunnelling) |
| ALS-62A | unknown | large (368,450 m2) | distant (toe) (185 m) | gentle | poor | medium | low | In an adequate distance from the pipeline |
| ALS-65B | unknown | large (381,025 m2) | distant (body) (80 m) | gentle | poor | medium | low | Avoid. A local rerouting was decided |
- The activity status was assessed based on the presence of typical in situ evidence, such as fresh cracks, surface water ponds, unvegetated scarps, etc.
- Surface area: Small: ≤10,000 m2, Medium: 10,000–50,000m2, Large: >50,000 m2
- Proximity (to) (distance): In contact with: ≤5 m, Proximate: 5–50m, Distant: Distance >50 m
- Gentle: Slope angle ≤25°, Moderately Steep: 25° < Slope angle ≤ 45°, Steep: Slope angle >45°. These ranges are indicative and correspond to the steepness, under which the encountered rock mass types can potentially fail isotropically
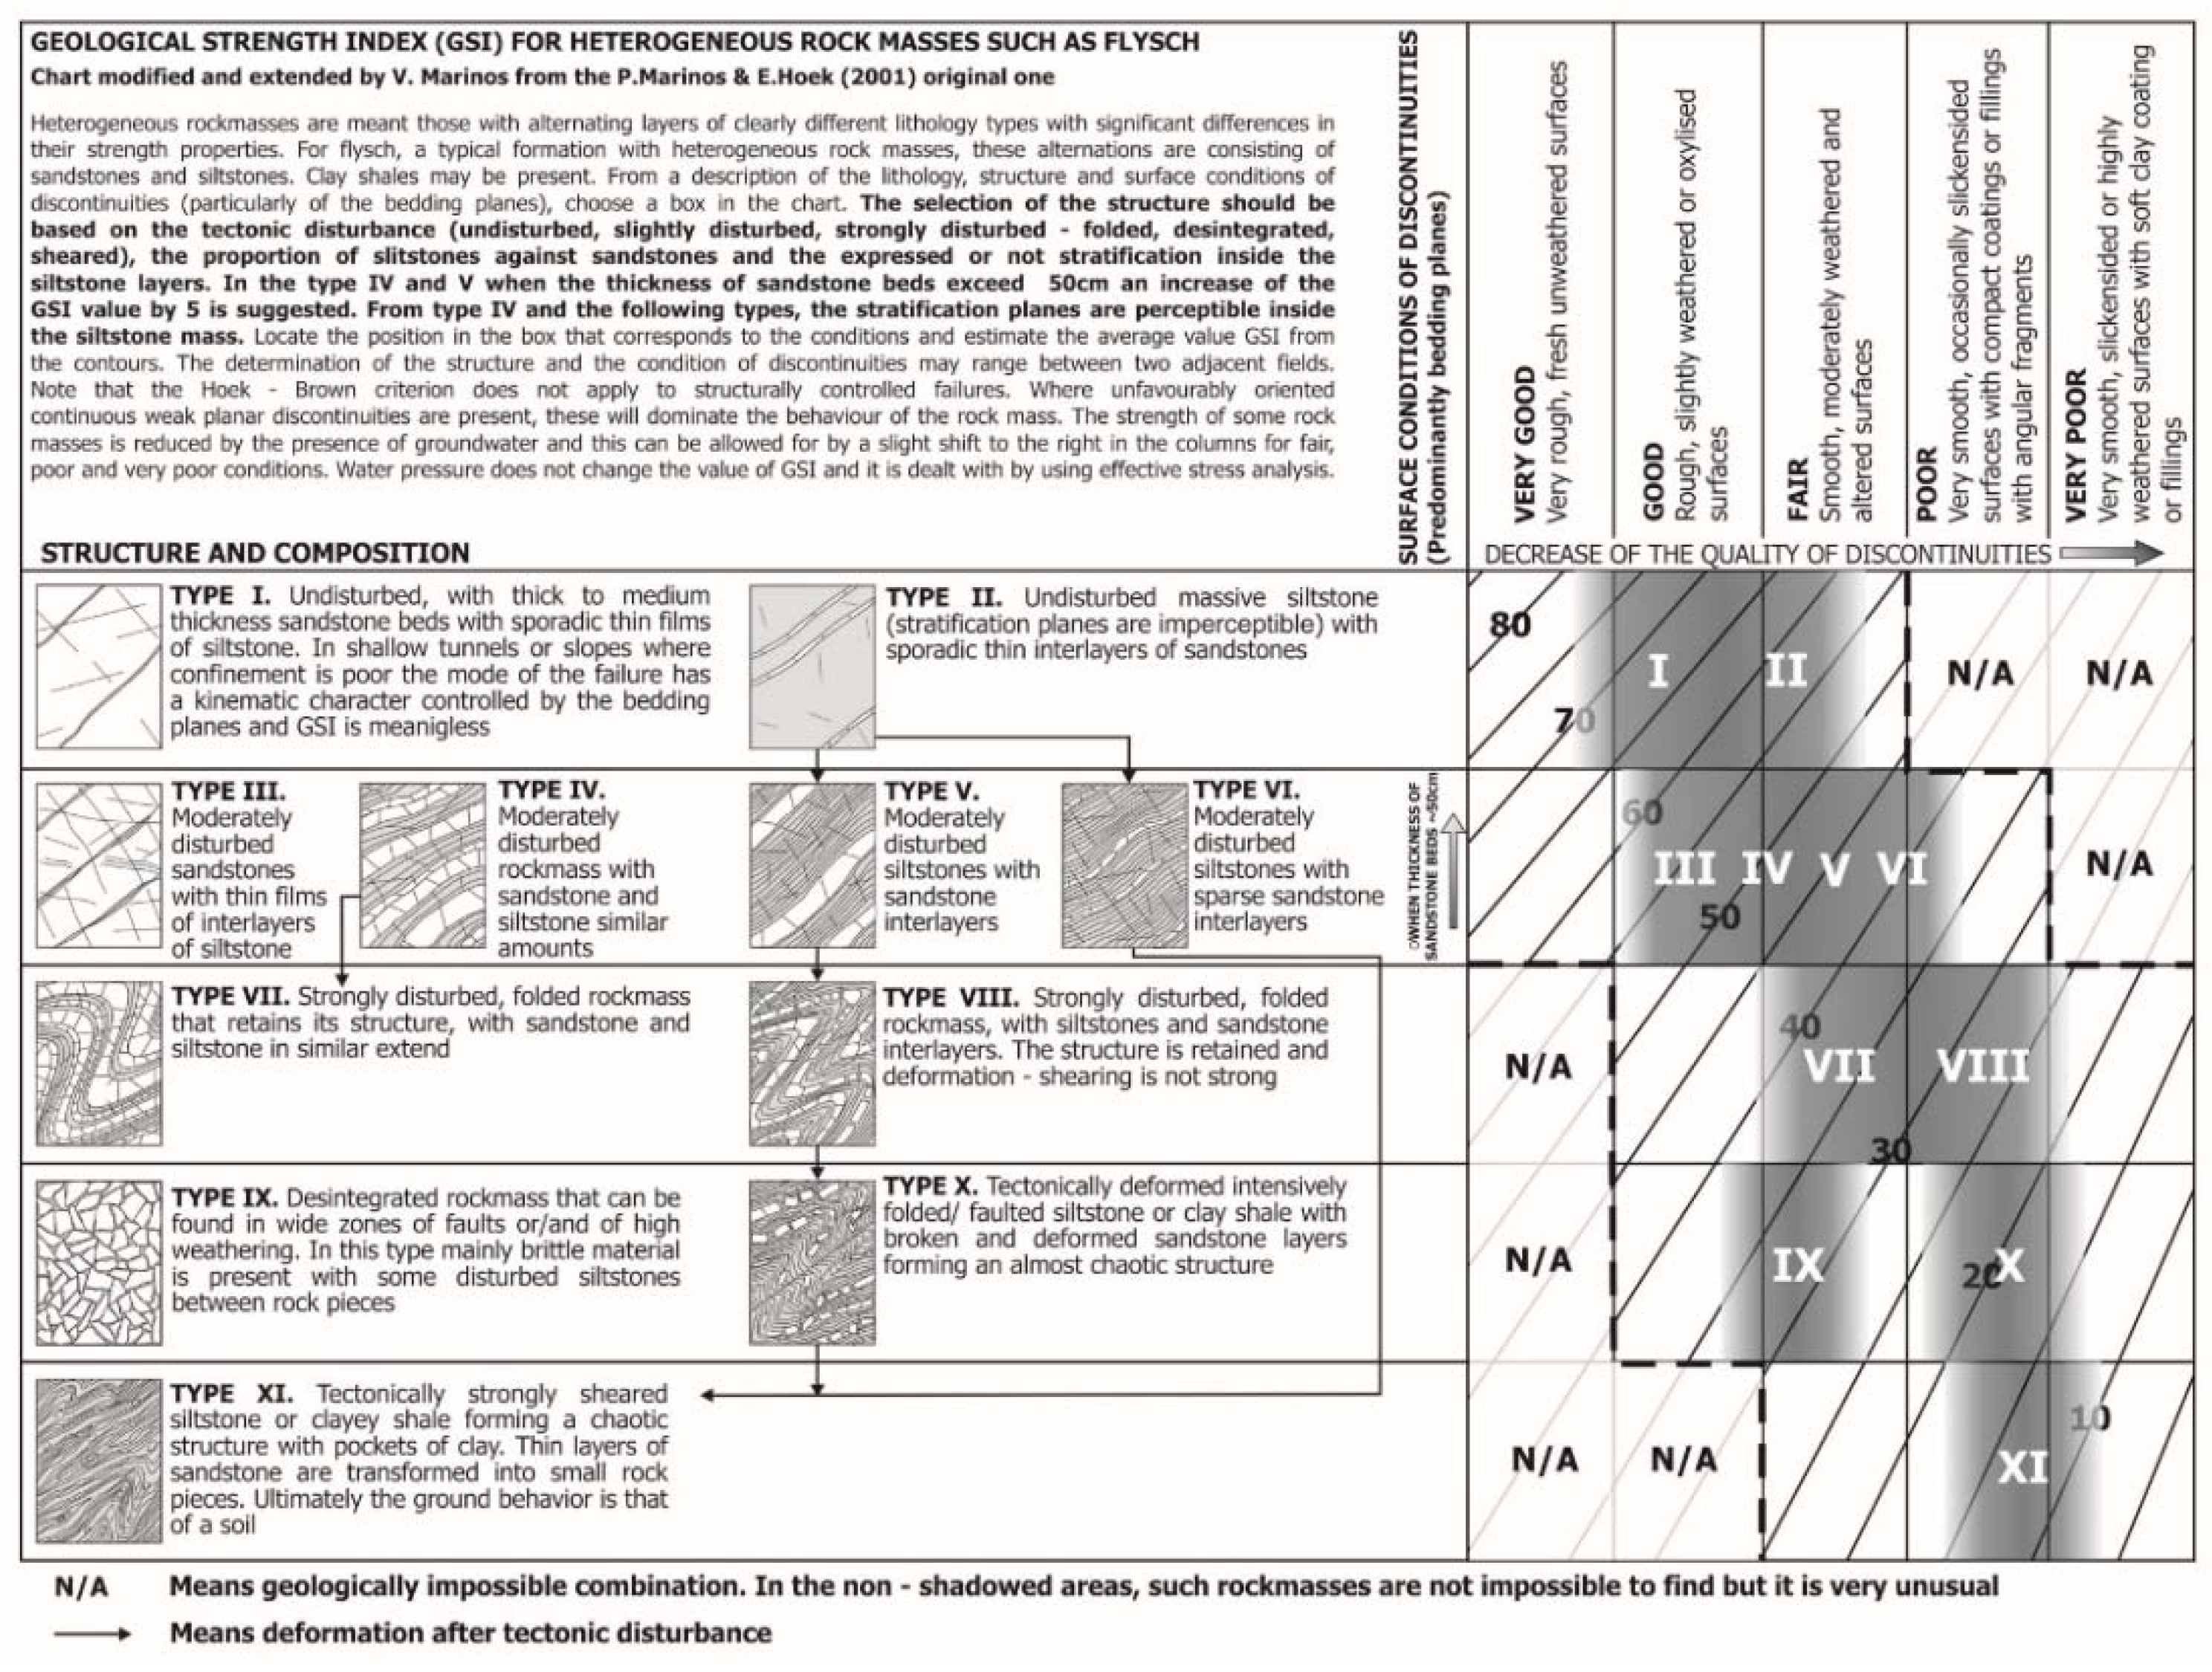
- Poor-Very Poor: GSI ≤20, Moderate: 20 < GSI ≤ 35, Good 35 < GSI ≤55, Excellent: GSI >55. Excellent ground conditions were not recorded in the study area.
- Sliding depth: Shallow: ≤5 m, Medium: 5–15m, Deep: >15 m.
| Risk Level | Indicative Risk Condition (Pipeline Rupture) | 25-YEAR Project Life Indicative Annual Probability Range | Landslide Triggering Conditions |
|---|---|---|---|
| HIGH | >10% chance of occurrence during PROJECT | >0.004 (>1 in 250) | Can occur in response to climatic factors |
| MEDIUM | 1 to 10% chance of occurrence during PROJECT | 0.004 to 0.0004 (1 in 250 to 1 in 2500) | Requires low-frequency strong earthquake to cause event |
| LOW | 0.1 to 1% chance of occurrence during PROJECT | 0.0004 to 0.00004 (1 in 2500 to 1 in 25,000) | Requires unlikely combination of circumstances (e.g., a combination of very-low-probability earthquake and exceptional climatic conditions) |
| NEGLIGIBLE | <0.1% chance of occurrence during PROJECT | <0.00004 (<1 in 25,000) | Only a very remote possibility that the event could occur |
| NONE | Not possible | 0 | N/A |
| Potential Impact on the Pipeline upon Activation | Likelihood of Activation | |||||
|---|---|---|---|---|---|---|
| Parameter | Landslide area | Landslide depth | Proximity to pipeline | Landslide activity | Ground quality | Slope |
| Weight factor | 15% | 25% | 60% | 50% | 25% | 25% |
| Value = 3 | large | deep | in contact with | active | poor | very steep |
| Value = 2 | medium | medium | close to | of unknown activity | moderate | moderately steep |
| Value = 1 | small | shallow | distant from | inactive | good | gentle |
| Likelihood of Activation Assessment | Potential Impact on the Pipeline upon Activation Assessment | Value Limits (Lowest to Highest Possible) | Risk Analysis | Risk Assessment |
|---|---|---|---|---|
| low likelihood | low impact | 1.00–1.66 | low likelihood/ low impact | low |
| moderate likelihood | moderate impact | 1.66–2.33 | low likelihood/ moderate impact | moderate |
| high likelihood | high impact | 2.33–3.00 | low likelihood/ high impact | high |
| moderate likelihood/ low impact | low | |||
| moderate likelihood/ moderate impact | moderate | |||
| moderate likelihood/ high impact | high | |||
| high likelihood/ low impact | low | |||
| high likelihood/ moderate impact | high | |||
| high likelihood/ high impact | high |
| Landslide | Parameters Affecting Expected Damage to Pipeline if Landslide is Activated (Potential Impact on the Pipeline upon Activation, Values 1 to 3) | Potential Impact | Impact Value | Parameters Affecting Possibility of Landslide Activation (Likelihood of Activation, Values 1 to 3) | Likelihood of Activation | Likelihood Value | Risk Value | Risk Analysis | Risk Assessment | ||||||||||
|---|---|---|---|---|---|---|---|---|---|---|---|---|---|---|---|---|---|---|---|
| Landslide Area | Landslide Depth | Proximity to Pipeline | Landslide Activity | Ground Quality | Slope Angle | ||||||||||||||
| ALS-1C | small | 1 | shallow | 1 | close to | 2 | low | 1.6 | active | 3 | poor | 3 | gentle | 1 | high | 2.5 | 4.00 | high likelihood—low impact | low |
| ALS-3B | medium | 2 | medium | 2 | close to | 2 | moderate | 2 | of unknown activity | 2 | poor | 3 | moderately steep | 2 | moderate | 2.25 | 4.50 | moderate likelihood—moderate impact | moderate |
| ALS-7B | small | 1 | shallow | 1 | distant from | 1 | low | 1 | active | 3 | poor | 3 | gentle | 1 | high | 2.5 | 2.50 | high likelihood—low impact | low |
| ALS-10C | small | 1 | shallow | 1 | in contact with | 3 | moderate | 2.2 | active | 3 | poor | 3 | gentle | 1 | high | 2.5 | 5.50 | high likelihood—moderate impact | high |
| ALS-13B | medium | 2 | shallow | 1 | close to | 2 | moderate | 1.75 | active | 3 | poor | 3 | gentle | 1 | high | 2.5 | 4.38 | high likelihood—moderate impact | high |
| ALS-14AB | large | 3 | medium | 2 | in contact with | 3 | high | 2.75 | active | 3 | poor | 3 | gentle | 1 | high | 2.5 | 6.88 | high likelihood—low impact | high |
| ALS-15C | small | 1 | shallow | 1 | in contact with | 3 | moderate | 2.2 | of unknown activity | 2 | poor | 3 | gentle | 1 | moderate | 2 | 4.40 | moderate likelihood—moderate impact | moderate |
| ALS-16B | medium | 0 | medium | 2 | in contact with | 3 | moderate | 2.3 | of unknown activity | 2 | moderate | 2 | moderately steep | 2 | moderate | 2 | 4.60 | moderate likelihood—moderate impact | moderate |
| ALS-17B | medium | 2 | medium | 2 | distant from | 1 | low | 1.4 | active | 3 | moderate | 2 | gentle | 1 | moderate | 2.25 | 3.15 | moderate likelihood—low impact | low |
| ALS-21C | small | 1 | medium | 2 | distant from | 1 | low | 1.25 | active | 3 | moderate | 2 | gentle | 1 | moderate | 2.25 | 2.81 | moderate likelihood—low impact | low |
| ALS-22C | small | 1 | medium | 2 | distant from | 1 | low | 1.25 | active | 3 | moderate | 2 | gentle | 1 | moderate | 2.25 | 2.81 | moderate likelihood—low impact | low |
| ALS-45C | small | 1 | medium | 2 | close to | 2 | moderate | 1.85 | of unknown activity | 2 | moderate | 2 | moderately steep | 2 | moderate | 2 | 3.70 | moderate likelihood—moderate impact | moderate |
| ALS-47B | large | 3 | medium | 2 | in contact with | 3 | high | 2.75 | of unknown activity | 2 | moderate | 2 | gentle | 1 | moderate | 1.75 | 4.81 | moderate likelihood—high impact | high |
| ALS-60B | large | 3 | deep | 3 | close to | 2 | high | 2.4 | active | 3 | poor | 3 | moderately steep | 2 | high | 2.75 | 6.6 | high likelihood—high impact | high |
| ALS-62A | large | 3 | medium | 2 | distant from | 1 | low | 1.55 | of unknown activity | 2 | poor | 3 | gentle | 1 | moderate | 2 | 3.10 | moderate likelihood—low impact | low |
| ALS-65B | large | 3 | medium | 2 | distant from | 1 | low | 1.55 | of unknown activity | 2 | poor | 3 | gentle | 1 | moderate | 2 | 3.10 | moderate likelihood—low impact | low |
© 2019 by the authors. Licensee MDPI, Basel, Switzerland. This article is an open access article distributed under the terms and conditions of the Creative Commons Attribution (CC BY) license (http://creativecommons.org/licenses/by/4.0/).
Share and Cite
Marinos, V.; Stoumpos, G.; Papazachos, C. Landslide Hazard and Risk Assessment for a Natural Gas Pipeline Project: The Case of the Trans Adriatic Pipeline, Albania Section. Geosciences 2019, 9, 61. https://doi.org/10.3390/geosciences9020061
Marinos V, Stoumpos G, Papazachos C. Landslide Hazard and Risk Assessment for a Natural Gas Pipeline Project: The Case of the Trans Adriatic Pipeline, Albania Section. Geosciences. 2019; 9(2):61. https://doi.org/10.3390/geosciences9020061
Chicago/Turabian StyleMarinos, Vassilis, Georgios Stoumpos, and Costas Papazachos. 2019. "Landslide Hazard and Risk Assessment for a Natural Gas Pipeline Project: The Case of the Trans Adriatic Pipeline, Albania Section" Geosciences 9, no. 2: 61. https://doi.org/10.3390/geosciences9020061
APA StyleMarinos, V., Stoumpos, G., & Papazachos, C. (2019). Landslide Hazard and Risk Assessment for a Natural Gas Pipeline Project: The Case of the Trans Adriatic Pipeline, Albania Section. Geosciences, 9(2), 61. https://doi.org/10.3390/geosciences9020061