Article

On the Processes that Produce Hydrocarbon and Mineral Resources in Sedimentary Basins

Department of Earth and Atmospheric Sciences, Cornell University, Ithaca, NY 14853, USA
Geosciences 2019, 9(12), 520; https://doi.org/10.3390/geosciences9120520
Submission received: 8 November 2019 / Revised: 10 December 2019 / Accepted: 13 December 2019 / Published: 17 December 2019

Abstract

:
Sedimentary basins are near-planetary scale stratigraphic-structural-thermochemical reactors that produce a cornucopia of organic and inorganic resources. The scale over which fluid movements coordinate in basins and the broad mix of processes involved is remarkable. Easily observed characteristics indicate the style of flow that has operated and suggest what kind of resources the basin has likely produced. The case for this proposition is built by reviewing and interpreting observations. Features that future basin models might include to become more effective exploration and development tools are suggested.

1. Introduction

Sedimentary basins might seem dead and uninteresting. They are, after all, simply the places where the Earth deposits its debris. In fact, they are remarkably dynamic and host a wide diversity of processes that have broad implications. We know a lot about basins because the energy and mineral resources they host have inspired the collection of massive amounts of data and funded extensive research. This paper reviews the mantle, fluid, capillary, and gas-generating processes that observations indicate operate in basins. The review is brief and intended to convey the scale and diversity of the processes involved, indicate why they matter for resources, and suggest how identification of the particular processes operating in a particular basin might be used in resource exploration.

2. Basin Processes

2.1. Mantle Dynamics

2.1.1. McKenzie’s Stretching Model for Basin Formation

McKenzie’s [1] lithosphere-stretching model was the first to quantitatively tie basin development to mantle dynamics. In this model the crust and its underlying lithosphere were assumed sutured together and stretched by tensional tectonic forces such that their original thickness (individually and in sum) was reduced by a factor β−1, and the width of any portion of the crust/lithosphere was increased by β. The temperature at the base of the lithosphere/top of the asthenosphere was considered to be 1350 °C, and the lithosphere and any ocean water load on it was considered to be in isostatic equilibrium (e.g., the crust/lithosphere floated on the underlying asthenospheric mantle). The consequence of the stretching was an immediate increase in heat flow, an immediate subsidence or uplift depending on the thickness of the crust, and an ensuing slow subsidence as the thinned lithosphere lost heat and grew back to its original thickness. For typical crust and mantle density and thermal expansion, ocean water loading, and complete oceanization (β large) of a portion of continent, the initial subsidence is ~4.2 km if the crust is 35 km thick, 0 km if it is 15 km thick, and −3.2 km (3.2 km of uplift) if the crust is initially 0 km thick. The thermal subsidence over the next ~60 million years is 3.2 km. The heat flow as a function of time can be calculated from the stretching factor, and the maturation of organic material in the sediments can be computed from this time-temperature history. Sediment loading causes additional isostatic subsidence, but this can also be taken into account.
The McKenzie stretching model proved a very useful baseline for analyzing when buried organic material in a basin might generate hydrocarbons and fill structural traps. It spawned a vast literature investigating the cooling effects of pore fluid movement, modeling the thermal conductivity of sediments, taking into account the impact of differential stretching of the crust and underlying lithosphere, accounting for the effects of gradual stretching and crustal flexure, the cooling effects of rapid sediment deposition, heating by sill intrusion, etc. There proved to be so many factors that needed to be taken into account that most exploration companies chose to use maturity indicators to calibrate the heat flow history in their basins rather than try to predict it from the ground up. However, where from-first-principle predictions can be made they are very informative. An example is given in what follows.

2.1.2. Rifting and Base Metal Deposition

Focused rifting can produce another kind of basin resource. Japan provides a good example [2]. Japan has been subject to multiple episodes of focused rifting. As illustrated in Figure 1A, Japan detached from China ~60 million years ago by the rifting and spreading that opened the Japan Basin. Between 38 and 20 Ma Japan rifted again, and the Yamato Basin opened. The Yamato Rise is a fragment of Japan that was left behind. Thirteen million years ago Japan rifted again, splitting its volcanic chain in half. This rift failed, although the volcanoes on either side of the segmented basin network remain active.
Just as suggested by McKenzie’s stretching model, the rifting produced basins. One is the Hokuroku Basin indicated in Figure 1B. Sediments flowed into the Hokuroku Basin from all sides. A good analogy is the Guaymas Basin in the Gulf of California, which overlies a seafloor spreading segment of the East Pacific Rise and hosts hydrothermal circulation today. The Hokuroku basin contains a collection of volcanogenic massive sulfide (VMS) deposits called the Hokuroku mining district. VMS deposits are formed by the same processes that are producing seafloor massive sulfide (SMS) deposits at ocean ridges today. Hundreds of these SMS deposits have been documented [3].
The SMS deposits form when non-boiling 350 °C fluids are thermally quenched near the seafloor, producing black smokers and massive sulfide deposits containing copper, zinc, and gold. Boiling would produce a vein deposit, so the Kuroku VMS deposits, which are mined today at ~500 m depth, must have formed at depths >1.5 km below sea level. Thus, the Hokuroku basin must have subsided more than a kilometer before the VMS deposits formed, and then uplifted after the rifting aborted. This kind of vertical tectonic behavior is expected. There is a dynamic loss of asthenospheric hydraulic head as the asthenosphere seeks to fill the void opened by the extension of the lithosphere and crust. As illustrated in Figure 1C, what happened in Japan is similar to what happens when two wood blocks in a bathtub are pulled apart. When the blocks are moving apart viscous resistance to the upwelling of water between the blocks causes the water level to be depressed. When one stops pulling the blocks apart, the fluid level returns to the bathtub level. If one thinks of the bathtub water being the asthenosphere, and the blocks the rifted Japanese lithosphere, the vertical motions of the Hokuroku and other rift basins in Japan can be understood. Basins such as the Hokuroku can have quite a dynamic history, can be expected to be bounded by significant faults, and may be underlain by hydrothermally altered rock and VMS mineralization (see [2] for more discussion).

2.1.3. Juxtaposition of Sediments of Contrasting Oxidation State

Brines form where surface conditions favor net evaporation, and being denser than fresh water they sink into the stratigraphy. This tends to happen nearly everywhere. Water with salinity low enough to be potable is usually confined to within 300 m of the surface.
Where there is net evaporation from isolated seas, the seas often become saline enough to stratify. This is the case in the Black Sea today, for example. The stratified waters tend to be stagnant and any flux of organic material into them will cause them to become anoxic. Thereafter, any organic material that settles to the floor of the basin will not be consumed by biological organisms or oxidized. Therefore, this is an excellent setting for the production of hydrocarbon source rock, and hydrocarbons can be expected to have associated pore waters that are highly saline. Metal solubility increases very strongly with salinity and so a relationship between basin oil field brines and base metal resources might be anticipated.
There are tectonic connections that are important. Eugster [4] noted that Red Beds tend to be capped by shales and evaporates. Oxidized sediments will be deposited in arid, rifted continental settings. As the lithosphere cools and subsides, marine waters will incur, restricted access to the ocean is likely, stratified brines pools with unusually high the primary productivity are likely to form, and organic rich shales will be deposited and covered by evaporates. Saline lakes have high primary productivity, and shales tend to be the first member of an evaporate sequence. Physical and chemical processes can in such circumstances be linked in what Eugster called an orderly (by which he meant expected) succession.

2.2. Fluid Dynamics

2.2.1. Dynamic Permeability

Fluids extract resources from one location and deposit them in a location where they accumulate. One might think that fluid movement requires basin sediments be permeable, and that intrinsic sediment properties are in control. In some cases, this is certainly true. But in others fluids make their own permeability.
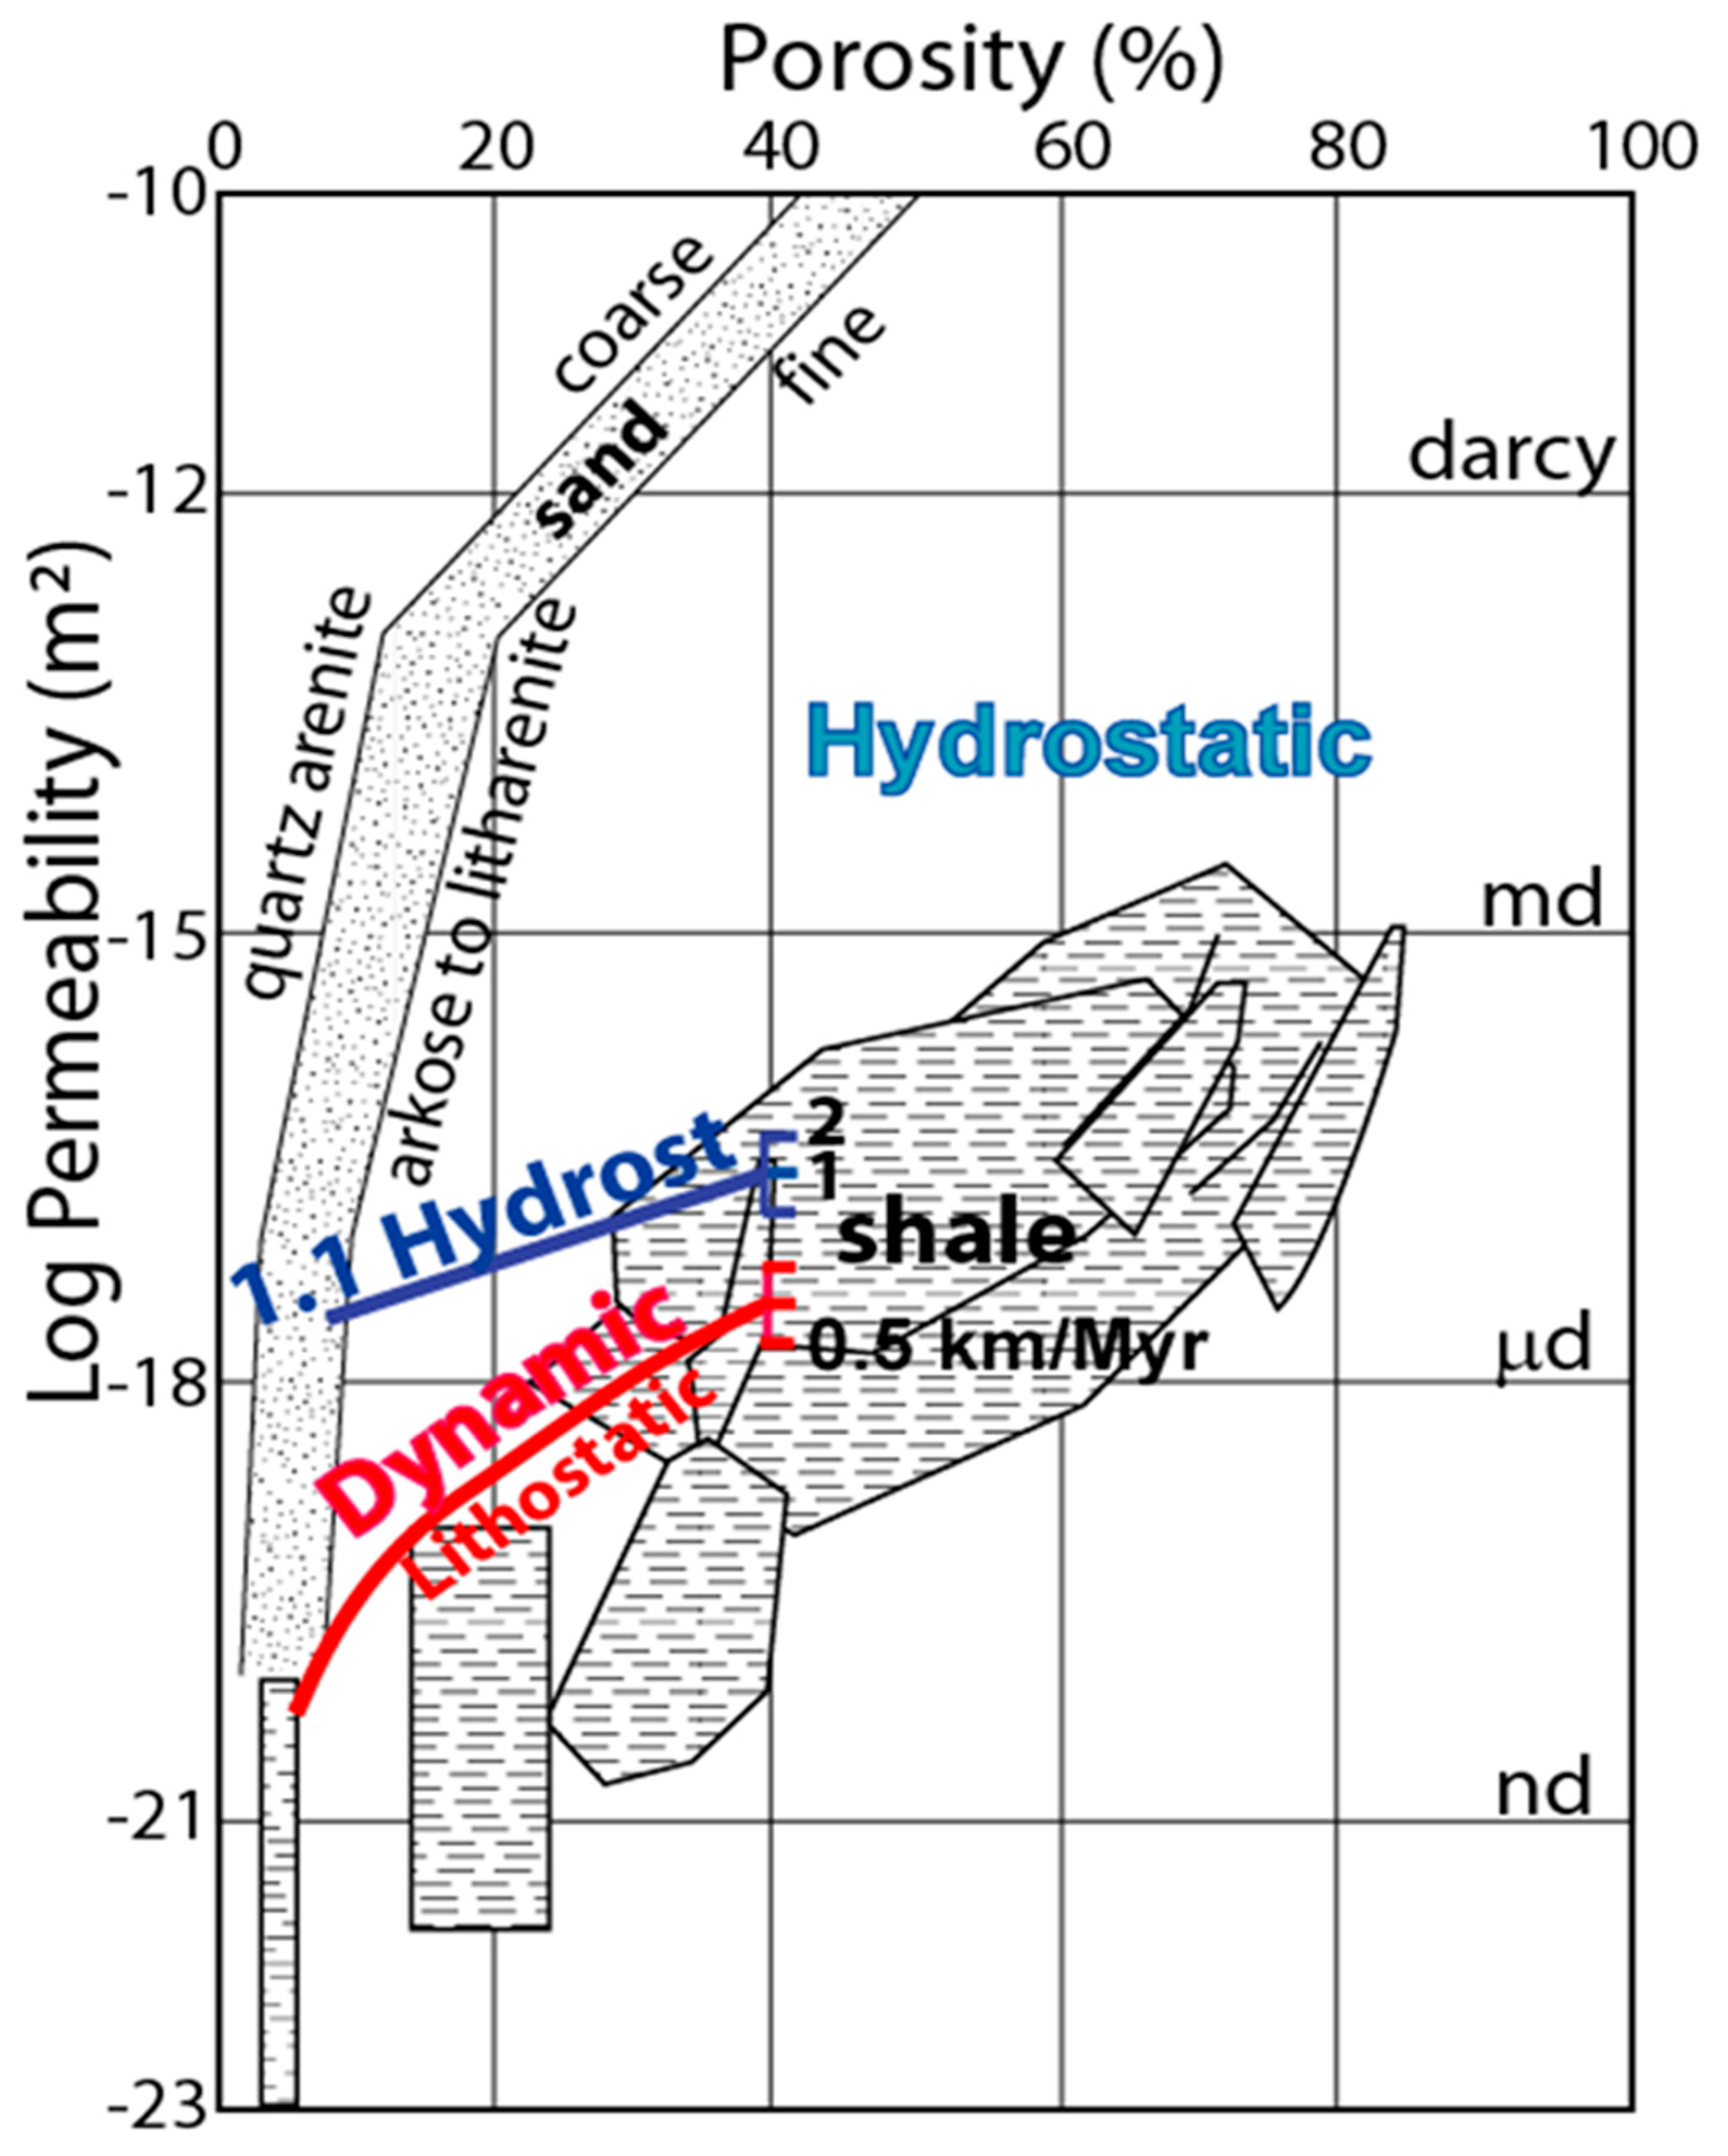
Consider mud depositing in a basin and converting first to mudstone and then to shale as it is buried. Regardless of induration, the sediments compact as they are buried. Porosity, near 90% at the sea or lake bottom, is ultimately reduced to a few percent at depth. The reduction in porosity pressurizes the pore fluids up to ~0.85 of the total weight of sediments and water above (e.g., up to ~0.85 of lithostatic). The fluid pressure does not rise further because at ~0.85 lithostatic the fluids hydro-fracture the rock and create the permeability needed for their escape to the surface.
The rate of decrease in porosity caused by a specified rate of sedimentation can be calculated for both a pore pressure gradient 0.85 of lithostatic, and 10% greater than hydrostatic. The permeability required for water expelled from the pores to escape to the surface can then be calculated.
Figure 2 shows that the dynamic permeability calculated in this fashion depends surprisingly weakly on sedimentation rate, and is similar to that measured for shales. Pore fluid expulsion and the associated hydro-fracturing seem to set the permeability of low permeability rocks such as shales in sedimentary basins. Malin et al. [5] suggest, for quite different reasons, that generally pore fluids conspire with mechanical processes to control not only the permeability but the distribution of permeability in the crust.(Calculations and additional discussion can be found in [5,6]).

2.2.2. Hydrocarbon Migration

Basin sediments are heated as they are buried and move downward through thermal gradients typically 20 to 30 °C km−1. Organic material is thermally cracked, first to oil (between 90–110 °C), and then to progressively dry (pure CH4) gas (between 110–130 °C). Oil and gas under basin conditions are lighter than water, and both will thus rise buoyantly through the sediments. If their rate of generation is slow compared to the rate at which they rise, they will rise as isolated rivulets of oil or in gas chimneys. If their rate of generation is fast compared to the rate at which they can rise, they will displace the pore water and completely fill the pores with oil or gas. The former is the conventional oil and gas scenario where the rising hydrocarbons are ponded beneath low permeability strata forming oil and gas reservoirs. The latter is the unconventional oil and gas scenario that has been of much interest recently. We’ll return to this latter case later. First consider conventional hydrocarbon migration.
If hydrocarbons mature in a basin with extensive sand layers that are more permeable than ~1 millidarcy (10−15 m2), vertically migrating hydrocarbons can be intercepted and diverted laterally over hundreds of kilometers. The oils migrate along only the upper centimeters of the carrier beds and fill reservoirs where the carrier beds are folded or offset by faults. The North Sea presents many examples of this kind of lateral migration and trapping, and the process is well described in [10]. Even a slight change in the tilt of the North Sea carrier sands can be important, and Løtviet et al. [11] show how tilting by glacial isostatic adjustment can redistribute oil in the North Sea.
The Gulf of Mexico is a currently active hydrocarbon generating area where there are no strata permeable enough to laterally divert the rising hydrocarbons in a very substantial fashion. In the 1990s we selected a portion of the Gulf of Mexico basin we thought would be large enough to capture the processes operating there. We called this ~200 × 100 km area of offshore Louisiana the “GRI Corridor” after our funding source, the Gas Research Institute. The corridor tells quite a remarkable story [12,13,14,15,16,17]. Briefly (elaboration follows): the oils in reservoirs in the northern half of this Corridor were sourced by Jurassic carbonate and Eocene shale strata, but in the south only by Jurassic carbonates. The deeper Jurassic oils matured and migrated first. The Eocene oils matured and migrated later, mixing with the earlier Jurassic oils in the north but not in the south. The Jurassic carbonates then generated gas which altered the oils by “gas washing” in a fashion that allows both the depth of washing and the amount of washing gas to be determined. This small area of one basin generated more hydrocarbon resources than have been extracted and consumed by humans over the entire petroleum era. Ninety percent of the generated oil was either expelled into the ocean or retained in the source strata. Discovered reservoirs in the Corridor constitute less than a fifth of the hydrocarbons currently migrating within it. The current reservoirs were filled recently (all perhaps in the last 100,000 years). In this flow-through hydrocarbon system “the present is the key to the present” (statement by Glen Gatenby, 2001).
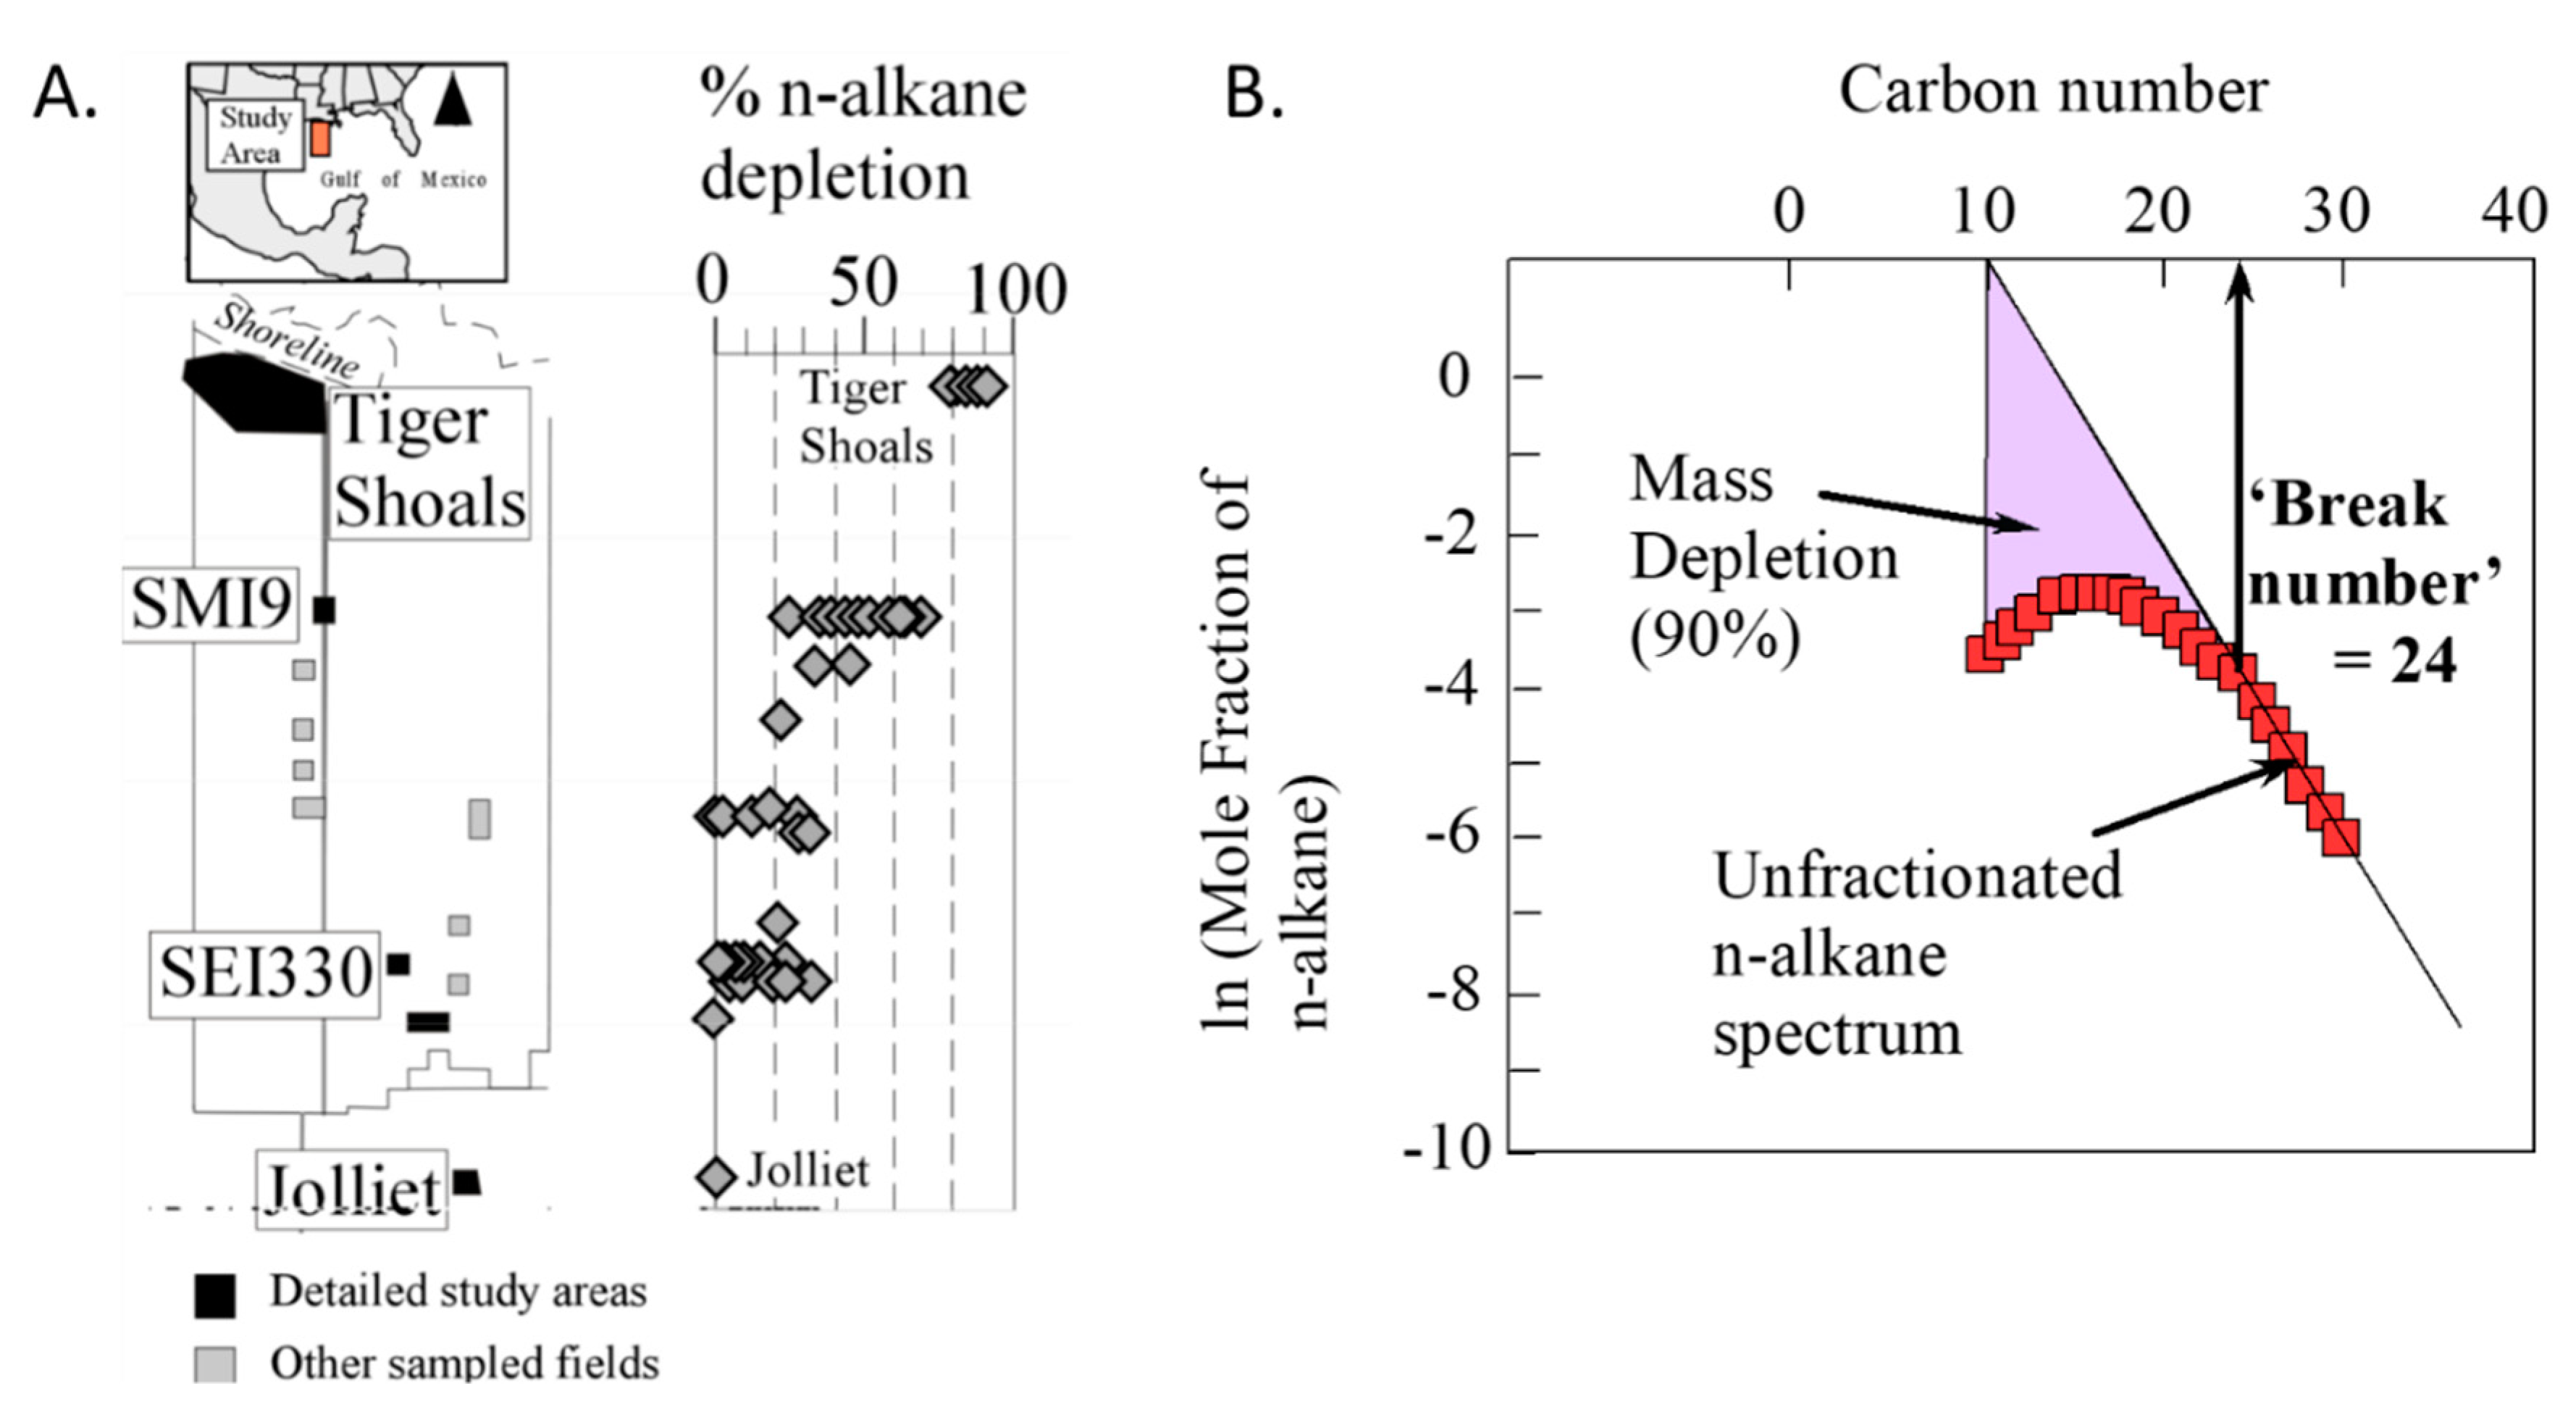
Perhaps the most immediately obvious and remarkable feature of the GRI Corridor is the regular N-S change in the chemistry of its reservoir oils (Figure 3) [14]. Over 90 wt% of the +10 n-alkane component of the oils in the Tiger Shoals field at the north end of the Corridor have been removed by gas washing. At the South Marsh Island Block 9 field (SMI 9) slightly to the south, 50% have been removed. At South Eugene Island Block 330 15% have been removed. At the Jolliet field at the south end of the transect, the oils have not been washed at all, and 0 Wt% of the n-alkanes have been removed.
Figure 3B illustrates how the n-alkane depletion is measured. Unaltered oils have a linear logarithmic decrease in the n-alkane mole fraction with carbon number, called the Kissen slope. This unaltered trend is shown by the black slanted line that melds to the measured n-alkane mole fractions of the un-depleted oil (red squares) at carbon numbers greater than 24. The mass depletion (in this case 90 wt%) is the purple shaded area. The depletion results from dry gas (methane) interacting with the oils. At basin pressures, methane can dissolve a lot of oil, and the lower carbon numbers are more soluble than the higher ones, which accounts for the greater depletion of the low carbon numbers (the rollover of the mole fraction curve). The depletion caused by gas washing can be distinguished from other kinds of alteration such as bacterial degradation. Modeling [18,19,20,21] shows that the break number at which the oil composition departs from the Kissen trend measures the depth at which the oil was washed, and the degree of n-alkane depletion measures the amount of gas that washed the oil. The reservoir oils in the transect appear to have been gas washed in the first sand layer encountered by the hydrocarbons rising to fill the reservoirs.
Extensive modeling was carried out to determine if the washing could have been produced by the oil and gas generated in the Corridor [15]. First the McKenzie stretching factor was determined from the sediment thickness and water depth along a 1050 km section near the Corridor that was contributed by Exxon. The section ran from the Lousiana border with Mississippi to the Sigsbee Knolls in the Gulf of Mexico. The evolution of the basin was reconstructed by back-stripping and decompaction. Heat flow, temperature, and vitrinite reflectance were calculated using a finite element grid tied to deposited strata and extending to the 150 km depth. The mantle heat flux determined from the stretching factor was applied there. Radiogenic heat production in the crust and sediments, changes in the surface temperature with water depth, the cooling due to sediment deposition, and the effect of compaction on lithology-specific thermal conductivity were taken into account. This modeling matched Exxon’s measured heat flow data as well as temperature and vitrinite reflectance depth profiles using unadjusted literature parameters. Heat flow is about half normal (30 mW m−2) near the shelf edge due to cooling by rapid sedimentation there, and about half this low heat flow is due to radiogenic heat production in the basin sediments. Despite the low heat flow, the temperature gradient is ~20 °C km−1 because of the low thermal conductivity of shales in the vertical direction. Agreement between the model and observations is excellent, and identification of the sources of heat is instructive, but great care had to be taken to include and properly specify all the important parameters in the model.
Heat flow at the base of the sediment section was then extracted from the portion of the Exxon line corresponding to the Corridor, and temperature calculated for the evolution of a much more realistic stratigraphy. Radiogenic heat production in the sediments was included, and the stratigraphic evolution included inversion of the Louann salt to a surface sill which was then buried. Salt diapirism and mini-basin formation was simulated. Maturation of a 100 m thick 5 wt% TOC (total organic carbon) carbonate Jurassic source strata (Type II kerogen) across the full section, and a 30 m thick 4 wt% TOC Type III Eocene coal across the northern half of the section was then calculated. The matured hydrocarbons were moved vertically out of the source strata once the saturation in the source strata exceeded 20 vol%, and moved upward thereafter when the pores of an element were filled to a specified migration saturation.
Gas is venting actively at hundreds of locations along the Corridor and there are many discovered hydrocarbon reservoirs. The modeling indicates that for gas to vent, the pore saturation of migrating hydrocarbons must be much less than 0.5%. The oils in the northern half of the section contain oleanane, a biomarker from plants that evolved in mid-Cretaceous time. The northern oils are also low in sulfur. Both indicate these oils came from the silicate Eocene source rock. For the Eocene oils to be dominant in the northern half of the Corridor, the migrating hydrocarbon pore saturation must be <0.05%. For a migration pore saturation of 0.025%, the oils are 85% Eocene at Tiger Shoals and 50% Eocene at the middle of the Corridor close to the end of the Eocene section, and there is sufficient late-generated gas to wash the oils as observed. Overall, the Corridor generated 184 Btoe (billion tons of oil equivalent) of hydrocarbons, mainly from Jurassic source beds, 37 Btoe were retained in the source rocks, 15 Btoe are in migration pathways between the source strata and the surface, and 131 Btoe (~1000 billion barrels- about 20% more than humans have consumed across the entire petroleum era) have been expelled into the ocean. Most of the oil has either been expelled (71%) or retained in the source strata (20%). The hydrocarbons discovered in the Corridor (1.4 Btoe) constitute ~9% of the hydrocarbons expelled from the source but not yet vented from the Corridor. The migration and filling is ongoing and the reservoirs were all filled recently, some very recently. The Jolliet reservoirs are hosted in 0.6 to 1.8 Ma strata. The model hydrocarbon flux across the 0.95 Ma horizon at the Jolliet location, assuming draw from a 40 km diameter mini-basin size area, is 190 and 110 tons of oil and gas per year respectively. Thus the Jolliet reservoirs (4400 kt oil and 3100 kt gas) could have been filled in 23 and 29 ka, respectively. The gas venting rate at Bush Hill near the Joliet field is estimated to be 900 t per year, which suggests the filling rate could be even more rapid [22].

2.2.3. Nature of Fluid Flow in Basins

Steady Expulsion: The Kupferschiefer Deposits in Germany and Poland

Base metal enrichment of the Kupferschiefer shale in Germany and Poland provides one of the most spectacular and best-documented examples of basin base metal mineralization.
The Kupferschiefer is the lowermost unit of the Zechstein evaporate sequence that extends from the England across the North Sea to southeastern Poland. It is a thin (usually 30 to 60 cm, but sometimes up to 1m thick), 258 Ma old pyrite and organic rich (~6% carbon) black shale, enriched in Cu, Pb, Zn, Au and other metals, and mined since at least 1199 AD. The technical challenges of mining made the Germans early leaders in technology. The deposits in Poland were discovered in 1957.
In the early Carboniferous (~350 ma) the 1700 × 500 km area later covered by the Zechstein sediments was the site of Hercynian clastic foreland basin sedimentation. In the Autunian (295–285 Ma), wrench tectonics extended the area and heated the lithosphere. Oxidized Rotliegende sediments accumulated in a basin and range topography with sill injection and some mafic volcanism. Erosion in a semi-desert setting of seasonal rivers and playa lakes leveled the topography. The peneplane was then partly covered by white aeolian dune sands (the Weissliegendes) which were later partially reworked into beach sands. As the lithosphere cooled, the area that would become the Permian Basin subsided in a broad down warp to 100 s of meters below sea level, but remained subaerial until ~259 Ma when it was suddenly flooded [23]. The laminated shale/shaly limestone or dolostone Kupferschiefer could thus be deposited throughout the basin below wave level in calm, shallow waters. The waters in this restricted basin were saline, the organic productivity high, and the bottom anaerobic [24]. The reduced, ubiquitous Kupferschiefer starkly contrasted with the oxidized sediments below. Four to five carbonate-anhydrite-salt cycles were then deposited in a shallow marine setting on top of the Kupferschefer. By the end of the Cretaceous up to 8 km of sediments had accumulated over the Kupferschiefer [6,23,24,25,26,27,28,29].
The mineralization occurred as post-Kupferschiefer sediment deposition loaded and compacted the underlying sediments. Oxidized brines, expelled from the compacting pores, forced their way through the Kupferscheifer and immediately adjacent strata, and pushed through in greater quantities where these strata were less resistive to flow. The metal-bearing oxidized brines were reduced as they moved through the reducing strata, and base metals were deposited. Where there was sufficient brine throughput, the Kupferschiefer was completely oxidized (called Rote Fäule or red fooling rock because it is barren of mineralization and red because the iron-bearing sulfides have been replaced by hematite) [24,27,30]. This process of metal deposition is not unusual. It also occurred in the midcontinent Proterozoic rift in the upper Peninsula of Michigan, for example, where reduced siltstones and shales of the Nonesuch Formation were oxidized by brines expelled from the underlying Copper Harbor conglomerate [6,31,32,33]. What is remarkable about the Polish Kupferschiefer mineralzation is the documentation of its metallization by 774 drillholes (50,000 analyzed samples) across all of Poland [34] (now there are 1700 drill holes [26]). The metallization maps allow us to estimate the volume of brine required to produce the metal enrichment. The estimated volume is so large that a large fraction of the brine expelled from the basin must have participated in the mineralization.
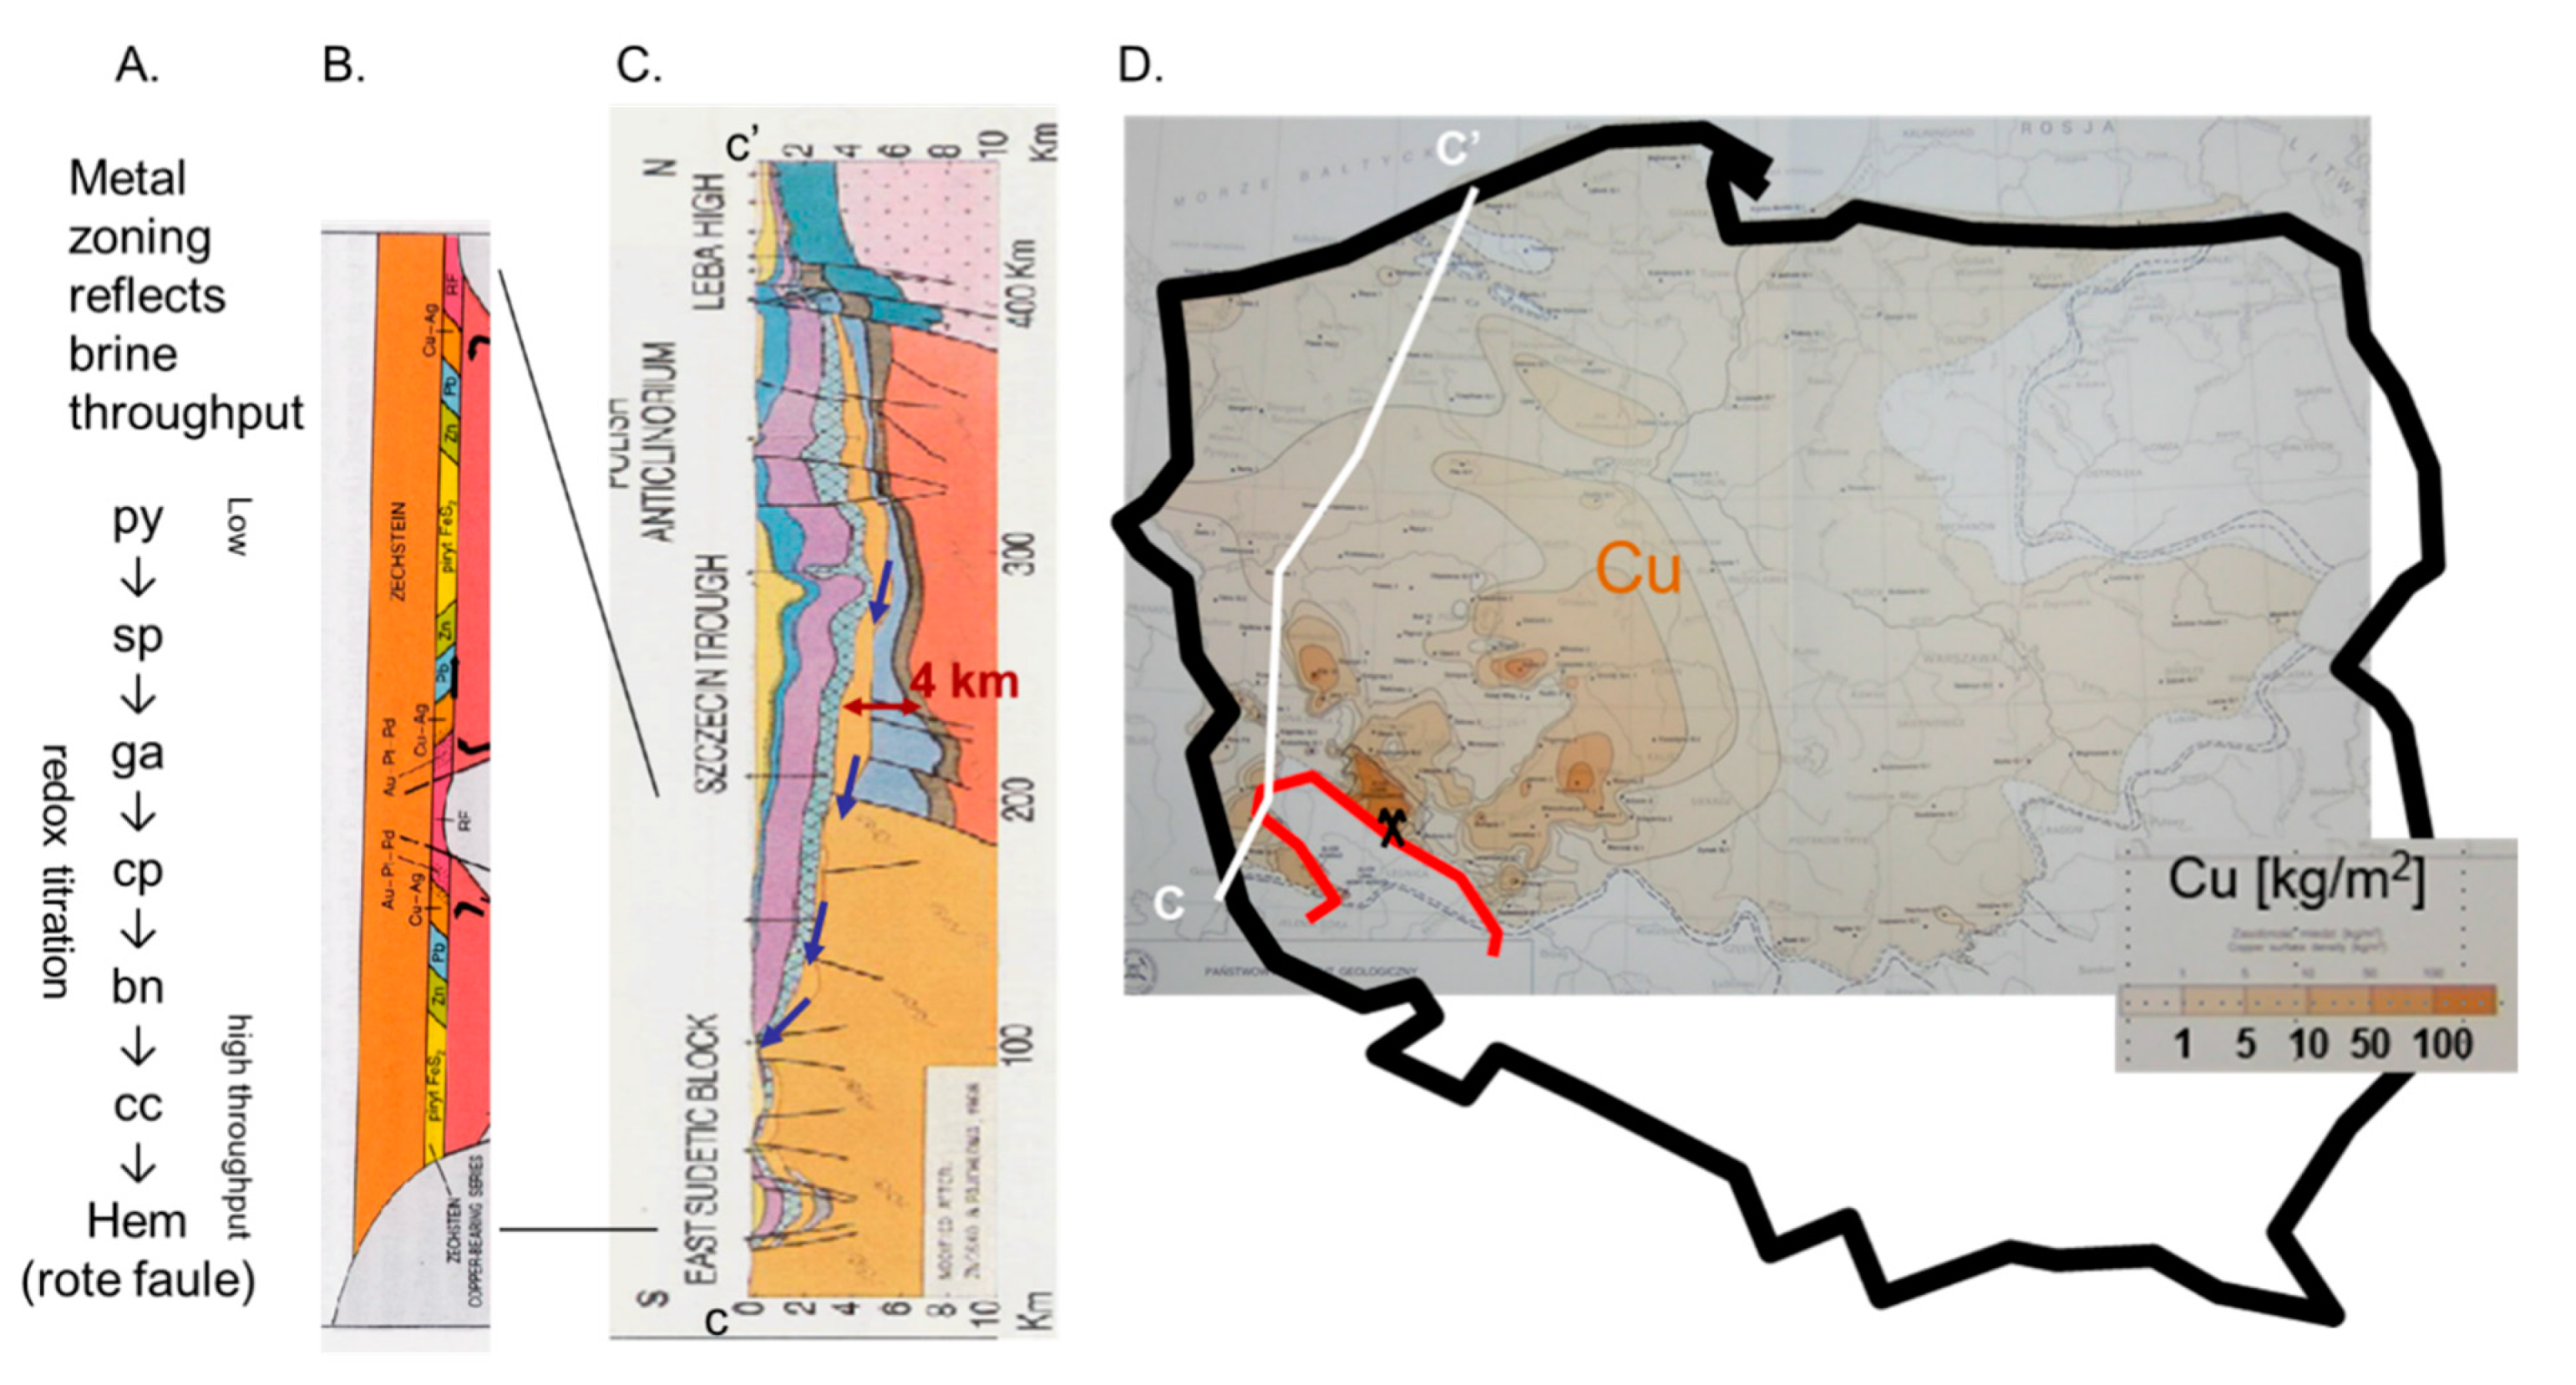
Figure 4 shows the copper surface density in kg/m2 from one of the maps in the Metallogenic Atlas of the Zechstein Copper-bearing Series in Poland [34]. Similar maps in the Atlas show the zinc and lead metal surface density. The metal surface density shown in Figure 4D is the kilograms of metal in the Kupferschiefer and adjacent strata under each m2 of plan area. The entire mineralized portion of the Lower Zechstein was analyzed down to a cutoff grade of 0.1%. The maximum thickness of the mineralized interval was 123 m, but typically the thickness analyzed was between 10 and 60 m. The metal density contours can be integrated to obtain the total metal added. I did this by tracing and summing the area of each metal density interval (e.g., 1–5, 5–10, 10–50 kg m−2, etc.) in the Atlas maps, and multiplying by the log average metal density added in each interval, as shown in Table 1. For example, the metal added between the 1 and 5 kg m−2 contours equals the area of this contour interval times 2.24 (= 100.5(log 1 + log 5)). The metal added between the 5 and 10 kg m−2 contours equals the area of this contour interval times 4.83. The 4.83 kg m−2 metal added equals the metal under this contour (7.07 = 100.5(log 5 + log 10)) minus the 2.24 kg m−2 log average surface density of the first contour interval. Table 1 shows that 824, 927, and 1523 million tons of Cu, Pb and Zn, respectively, were added to the Kupferschiefer and immediately adjacent sediments in the area covered by the Atlas maps. The reserves of the Lubin, Polkowice-Sieroszosice and Rudna mining districts (near the black mining symbol at the north border of the red-outlined Fore-Sudetic Block in Figure 4D) are 30.4 Mt Cu [26]. The mine reserves thus constitute only 3.6% of the metallization.
The 9th row of Table 1 (labeled Brine in column 1) indicates the concentration of metals that would have to precipitate from the brine to account for the metallization in the 8th row of the table, if the brine volume expelled through the Kupferschiefer were 200,000 km3. For this volume of brine, 4.1, 4.6 and 7.6 ppm of Cu, Pb, and Zn respectively would have to precipitate for the observed metal tonnages to be deposited. Metal concentrations more than those required have been measured in oil field brines (last 3 rows in Table 1). The 200,000 km3 volume of brine is very large. It could be supplied if compaction reduced the porosity of a 4 km thick strata covering a 500 × 500 km area (the area of Poland) by 20%. Such a reduction of porosity is possible (see discussion below), so the hypothesis of mineralization-by-brine-expulsion is plausible. Much could be discussed (e.g., the magnitude of the porosity change early and later in burial, how much basement rocks might compact, how much brine was expelled unrecorded through the Rote Fäule vents, etc.). The important point made by this rough calculation is that the brine expulsion recorded by the metallization mapped in Poland constitutes a significant portion of the brine that could be expelled by compaction from the sub-Kupferschiefer eastern portion of the Southern Permian Basin.
Another remarkable aspect of the Kupferschiefer mineralization, illustrated schematically in Figure 4A,B, is a regular regional scale metal zonation. As shown by a color-coded metal dominance map in the Atlas (but not reproduced here), the northeast of the map area in Figure 4D is largely unenriched in base metals and the original Kupferschiefer pyrite dominates. To the west of this pyrite zone lies an NE-SW trending band of about equal area where Zn is dominant. To the west of this lies a smaller band where Pb is dominant, to farther still to the lies an area where Cu is dominant, and still further west is an area of barren Rote Fäule.
What this suggests is that the oxidized brines have forced their way through the Kupferschiefer. Where only a little brine was forced through, sphalerite is the dominant mineral and Zn dominates. With more brine throughput Zn is flushed out, and Pb is the dominant metal. With still more throughput, successively more Cu-rich sulfides (chalcopyrite, then bornite, then chalcocite) dominate. With still more brine throughput, all the sulfides are oxidized, all the base metals are flushed out, and only hematite remains (Rote Fäule). Gold and platinum-group metals precipitated at the base of the zone of copper enrichment and the top of the encroaching Rote Fäule [38]. The metal enrichment process involves oxidative titration of the reduced Kupferschiefer shale by brine throughput. This story is a common one and applies to other types of base metal deposits, for example Kuroko-type volcanogenic massive sulfide deposits [39].
The progressive westerly increase of brine movement through the Kupferschiefer in Poland suggests the brines below the Kupferschiefer moved to the west. Near the Fore-Sudedetic Block the leakage through the Kupferschiefer was optimal for metal enrichment and the mines are located there, as indicated in Figure 4. Why was leakage easier through the Kupferschiefer in western Poland, and why does the brine throughput per unit area change so regularly? The brines must have had remarkably equal access to the base of the Kupferschiefer. Perhaps this is not surprising. The first Zechstein deposition was a thin basal limestone which could be very permeable and the Variscan sediments could be permeable. If the leakage was slow, uniform access to the base of the Kupferschiefer could be expected provided only that the underlying rocks were dramatically more permeable, as seems very likely. What is important here is that the metal zoning is remarkably coherent, so brine access must have been relatively uniform, and, in this case at least, the regular increase in leakage can be followed westward to the locations where it produced mineral deposits.
A couple of brief comments: First, transgressive reduced black shales lying between evaporates and red beds of continental origin are commonly enough mineralized that a “Kupferschiefer” sub-type of the sediment-hosted statiform copper deposit class has been distinguished [40]. Second, the estimate of the volume of brine expelled is for the eastern portion of the Southern Permian Basin. An equally large area of the western part of the basin would be required to produce the German Kupferschiefer deposits. Third, the few mm thick horizontal chalcocite and other veins in the Kupferschiefer indicate the brines forcing their way through were nearly lithostatically over-pressured, and that flow persisted through the Kupferschiefer for protracted periods of time. Near lithostatic pressures were required to jack the horizontal veins open, and time was required to fill them with mineralization. Over 80% of the mineralization is disseminated (replacement of framboids) which appears to have occurred early in the mineralization history, but the veins indicate overpressure. Fourth, convective flow is not responsible for the metal zoning. The Kupferschiefer is underlain by very permeable strata (the Weissliegend sands and conglomerates) which preclude the possibility of horizontal pressure gradient even vaguely large enough for brine convection to drive flow horizontally through the Kupfersciefer. Flow was driven by fluid overpressures (pressures greater than hydrostatic) produced by compaction, or possibly positive volume change hydrocarbon maturation reactions. Overpressured fluids were driven vertically (with perhaps slight, few meter scale, lateral diversions) through the Kupferschiefer. The metal zoning is due to the amount of brine throughput, as discussed above. Finally, the Kupferschiefer metallization records regional scale brine flow and documents leakage through a sealing shale capped by evaporites.

Episodic Expulsion: Mississippi Valley Type Pb-Zn Deposits

The sediment-hosted base metal deposits, of which the Kupferschiefer is a sub-type, seem to have formed by quiet, steady expulsion of over-pressured brine. Mississippi Valley-Type (MVT) Pb-Zn deposits formed by short, sudden pulses of brine expulsion. Ore deposition is by cooling rather than reduction.
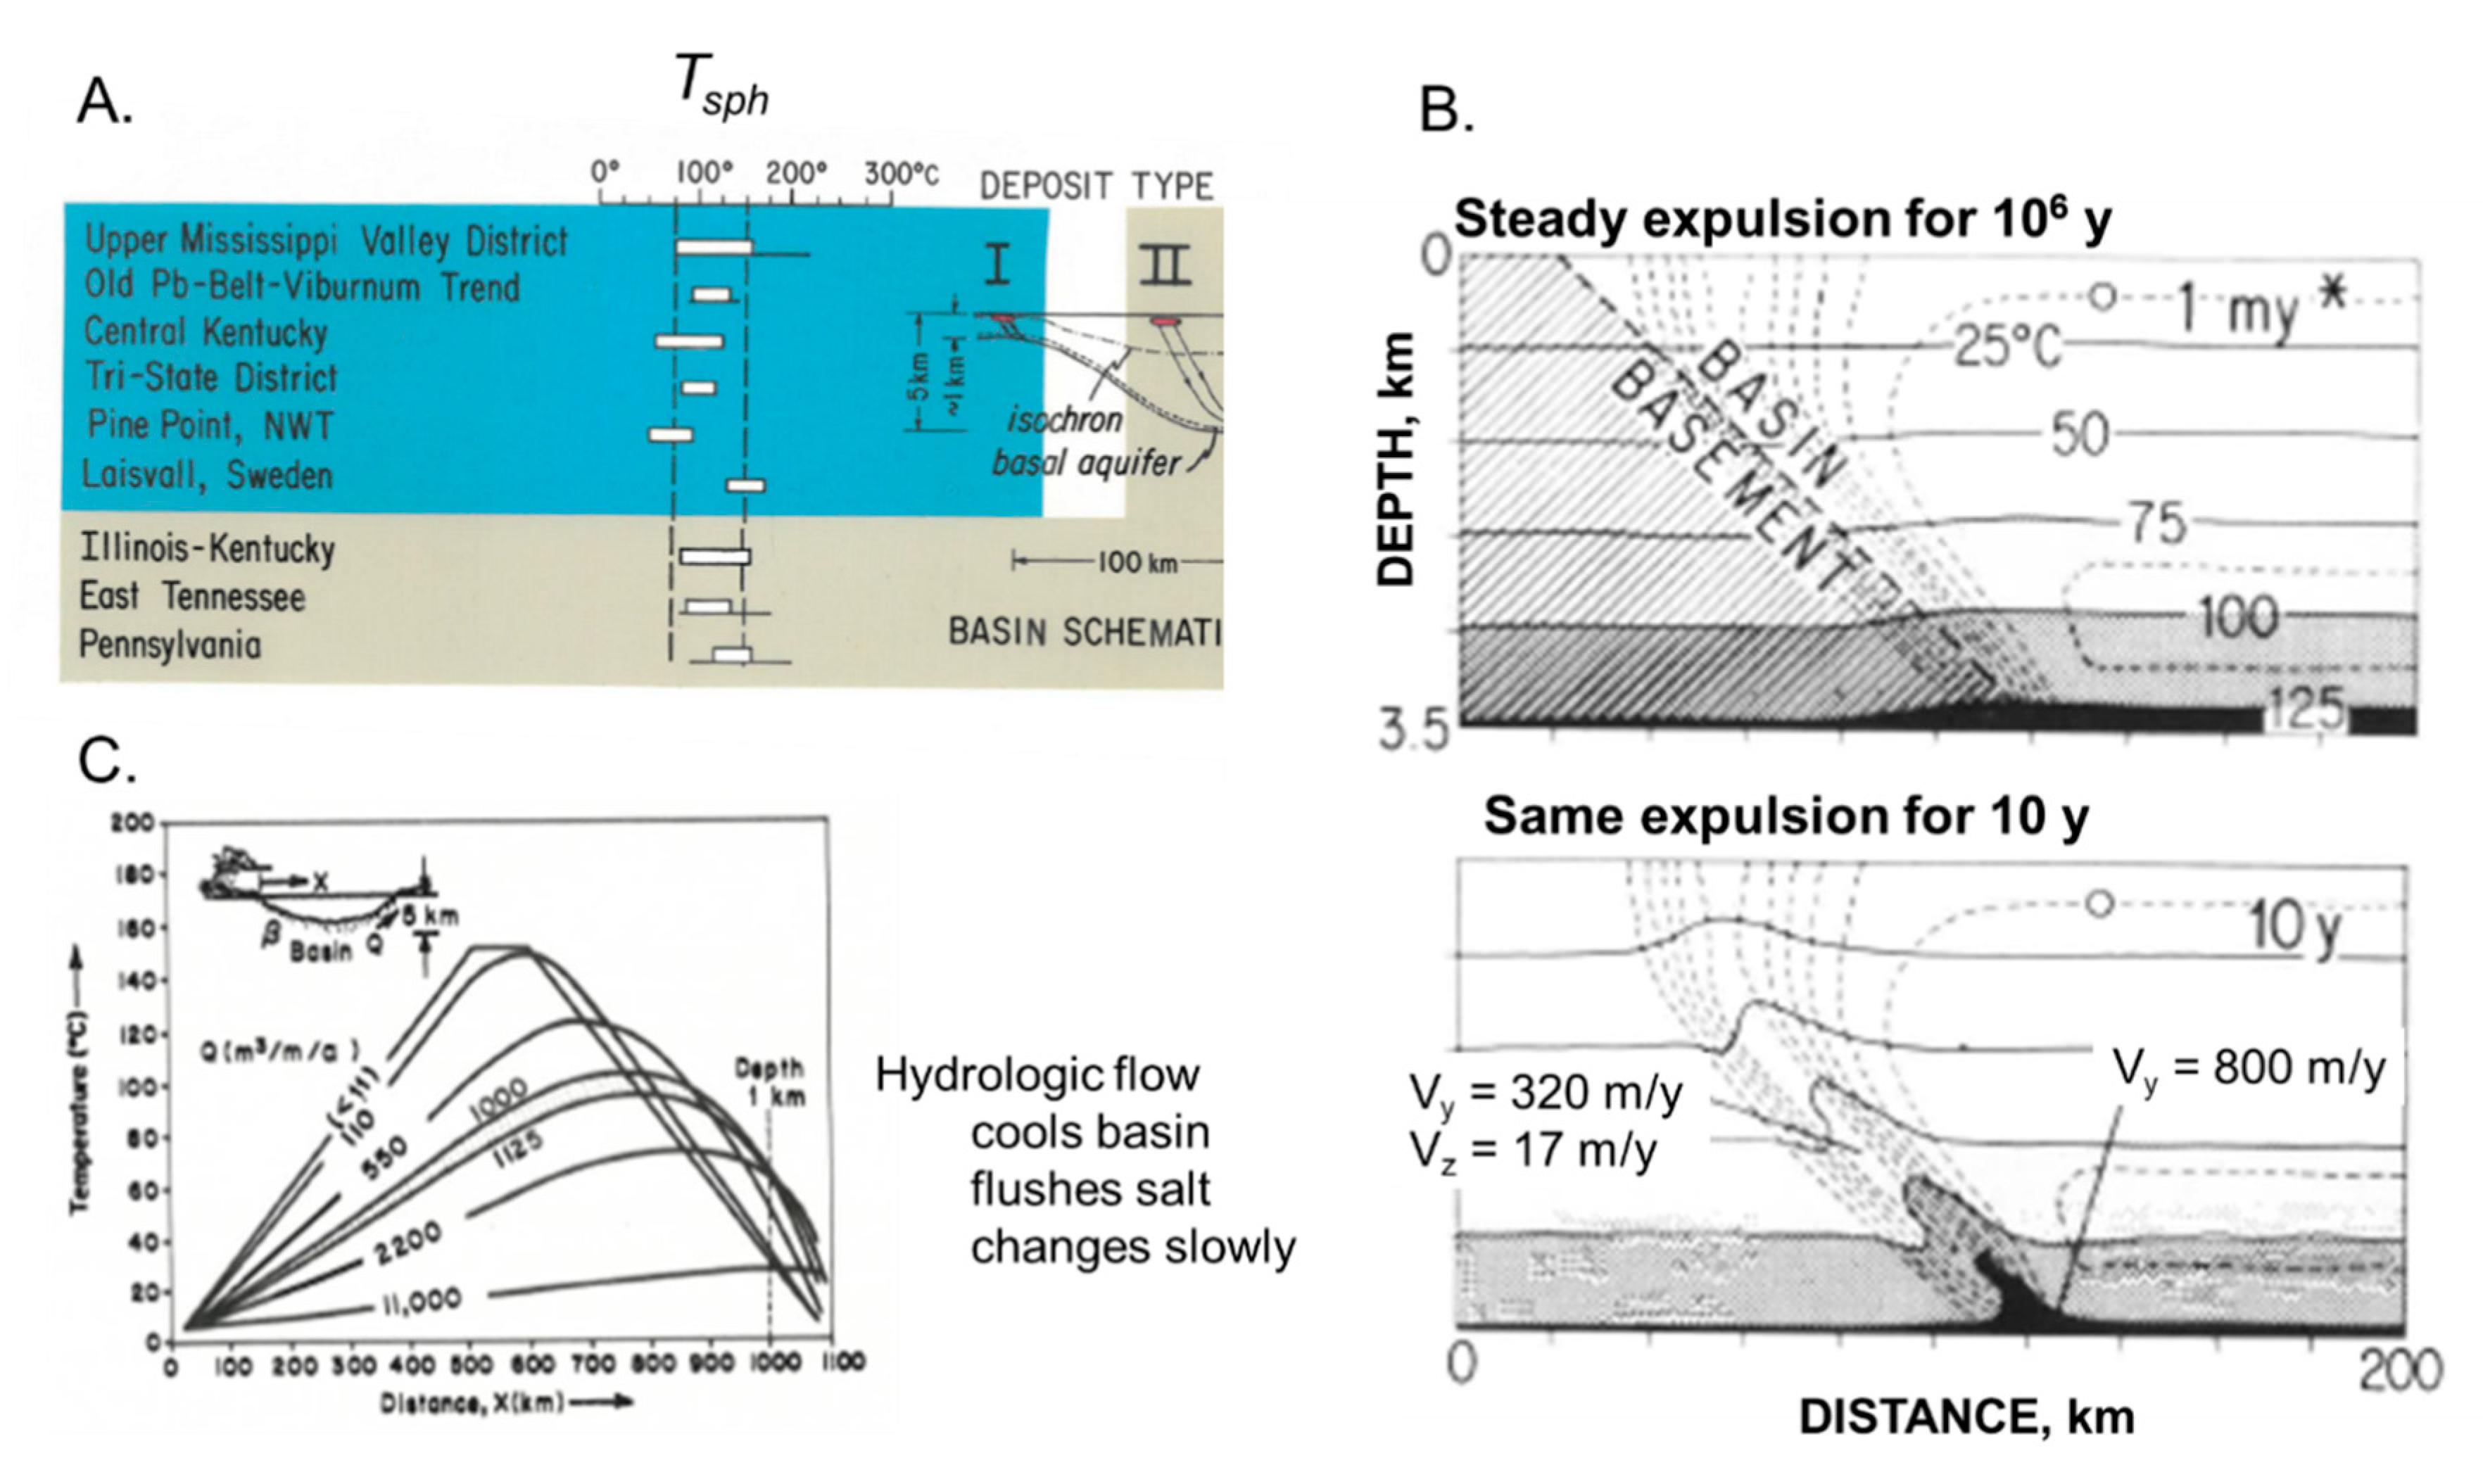
From the homogenization temperature of sphalerite fluid inclusions we know that ore deposition in MVT deposits occurred at T > 80 °C (Figure 5A), but the low maturation of conodonts indicates the sites could have been heated, cumulatively, for only a short period of time (<200,000 yrs; [41]). The deposits formed within a kilometer of the surface. Figure 5B shows that for the near subsurface to be even slightly warmed, a million years of compactive brine expulsion must occur in a few years. Temperature constraints thus suggest that the ore deposition occurred in short pulses. Other observations support this conclusion. For example, 8 pulses of mineralization have been documented in the Buick mine in the Viburnum Trend (carbonate reef escape hatch; [42]). Eight episodes of chalcopyrite deposition, 6 of sphalerite, 5 of galena and quartz have been documented in the Tri-state district [43]. Thermal pulses are indicated by cathodoluminescent banding in hydrothermal dolomite that is coherent over 275 km south of the Viburnum Trend [44]). The ore minerals show corrosion between pulses of deposition, and the cathodoluminescent bands show unconformities, as would be expected if the hydrothermal discharge were pulsed, and between pulses, cool meteoric water incurred and partly dissolved the mineralization.
Hydrologic flow across the basin is too steady to easily explain pulses in mineralization (topography changes slowly), cross basin flow would flush the brines before the margins are warmed, and cross basin flow at the rates required to warm the margins will cool the basin as shown in Figure 5C (see reviews in [6,41]). What caused the pulses of brine expulsion? For over 30 years I could find no good explanation, but now there is a mechanism that might just work: gas suddenly introduced to the brine-filled aquifer following the failure of a capillary seal, as discussed below.

2.3. Capillary Dynamics

2.3.1. Basin Pressure Compartments

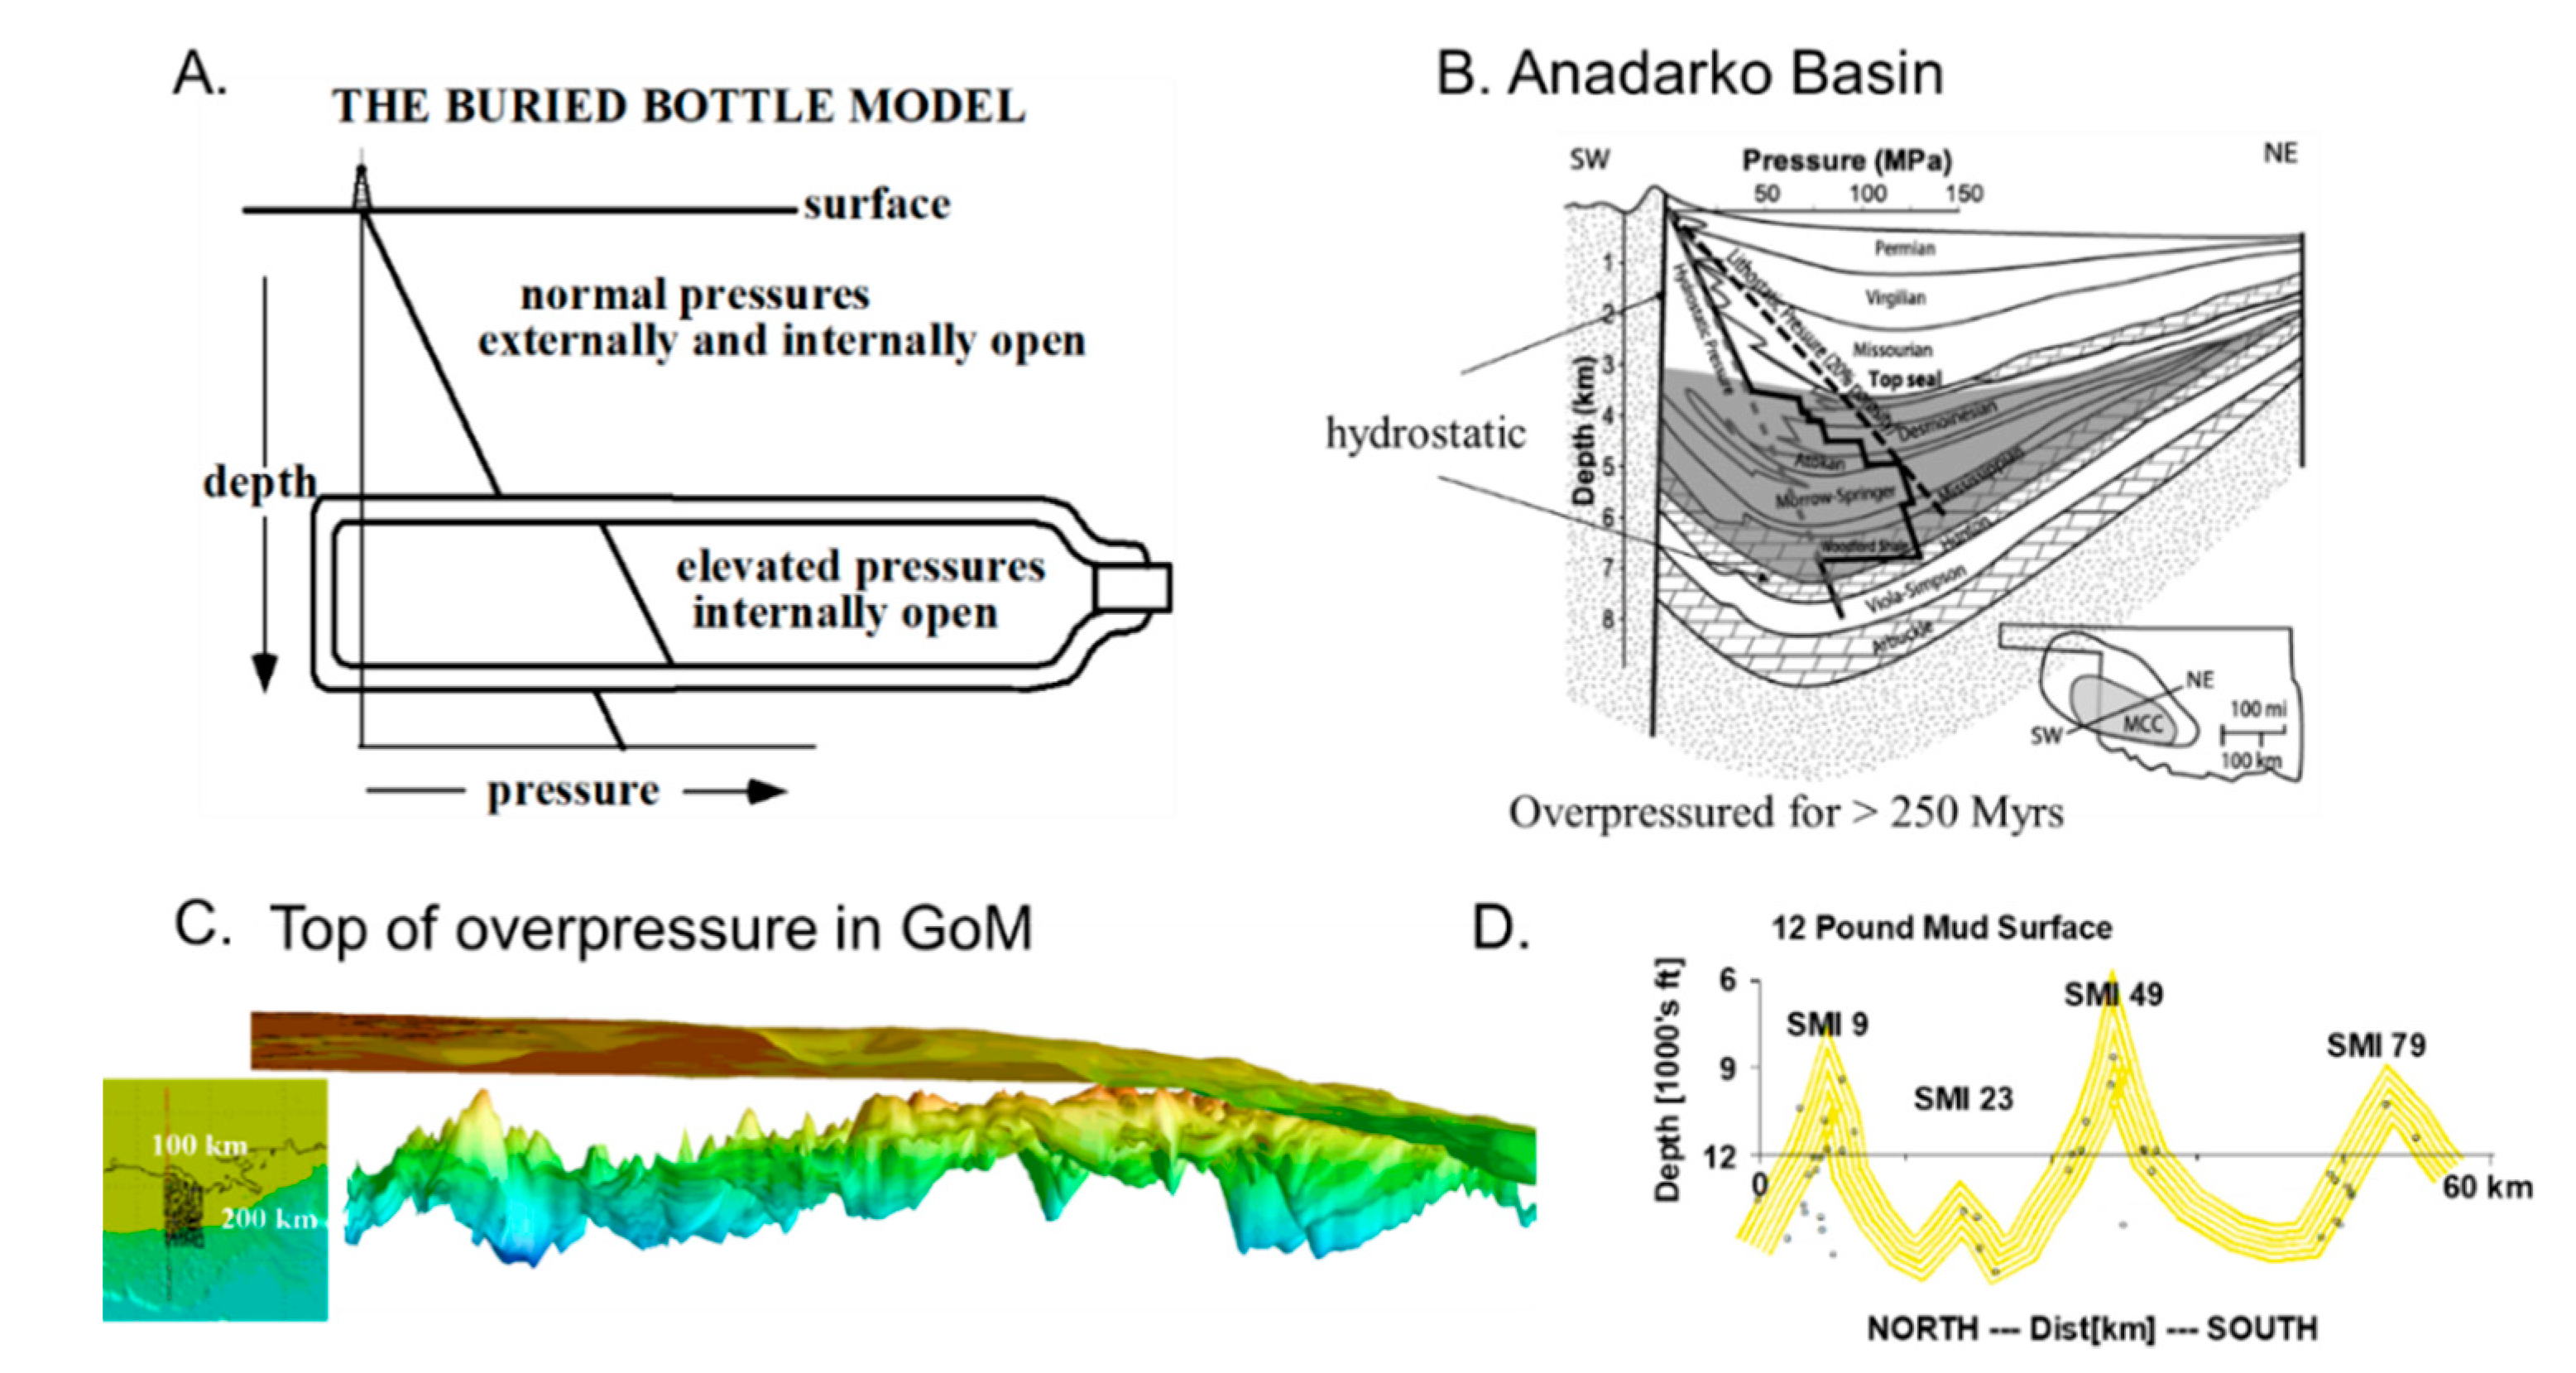
On 30 July 1987 Dave Powley (Amoco Production Company) made a presentation to the Gas Research Institute (GRI) in Chicago entitled “Subsurface Fluid Compartments” [47]. His presentation described how, over the previous two decades, Amoco studies by John S. Bradley and himself showed that basins are commonly over-pressured (but sometimes under-pressured) and compartmented at depths greater than 3 and sometimes just 1 km. The pressure is different between compartments, but the gradient is hydrostatic within compartments. He described the compartments as “huge [beer] bottles [which have been variably shaken]. Each one has a thin, essentially impermeable, outer seal and an internal volume which exhibits effective internal hydraulic communication.” Figure 6A reproduces his presentation figure. He stated: “…the compartments have an amazing longevity” and can “…cut indiscriminately across structures, facies, formations, and geologic time horizons…”. He gave examples from Romania, Norway, Burma, and Alaska. He urged GRI to investigate the causes of basin pressure compartmentation.
Over the next 10 years, the Gas Research Institute funded research on basin compartmentation and sealing. The first phase independently confirmed pressure compartmentation. AAPG Memoir 61 [48] documented that basins are commonly pressure-compartmented. Its poster child example is the Anadarko [49]. A highly over-pressured, gas-rich (20 tcf), ~240 × 113 × 5 km thick portion of this basin is overlain and underlain by normal hydrostatic pressures, as illustrated in Figure 6B. This zone has been overpressured for >250 Ma. It is so internally compartmented that Zuhair Al-Shaieb termed it a megacompartment complex. Compartments are nested within compartments in an almost fractal fashion.
That overpressure compartments can cross cut stratigraphy and have irregular surfaces is illustrated by Figure 6C, which shows the top of overpressure in the offshore Louisiana GRI Corridor (located in the insert in Figure 6C). The top of overpressure (TOOP) is defined in this figure by the 12 lb/gal mud weight surface (lithostatic is ~22.7 lb/gal) interpolated from mud weights in the header logs of 2131 wells and Krieged to produce the surface shown. The TOOP transgresses from 112 Ma Cretaceous to 2.4 Ma Quaternary strata as it shallows toward the continental slope from ~3.8 km under central Louisiana to <1 km depth on the slope. The TOOP surface is highly irregular, with topographic highs rising ~1km from the baseline surface. The topographic highs are spatially associated with discovered oil fields (Figure 6D; [12]). Twenty of 29 hydrocarbon fields in the Corridor are near topographic highs in the TOOP.

2.3.2. Capillary Seals

The second phase of GRI funding addressed the origin of the seals that bound the pressure compartments. How capillary forces impede the migration of hydrocarbons was understood: Water typically wets silicate surfaces and surface tension pulls water strongly into a shale. Oil, on the other hand, must be compressed to move from the large pores of a sand into the finer openings of a shale, and, unless the required entry pressure is exceeded, it will pond below the shale [50]. How a capillary seal of this nature could impede the movement of both brine and water was not clear, and Bradley and Powley [51] were careful to distinguish the compartment “pressure seal” that impedes both brine and hydrocarbons, from a capillary seal which impedes just hydrocarbons.
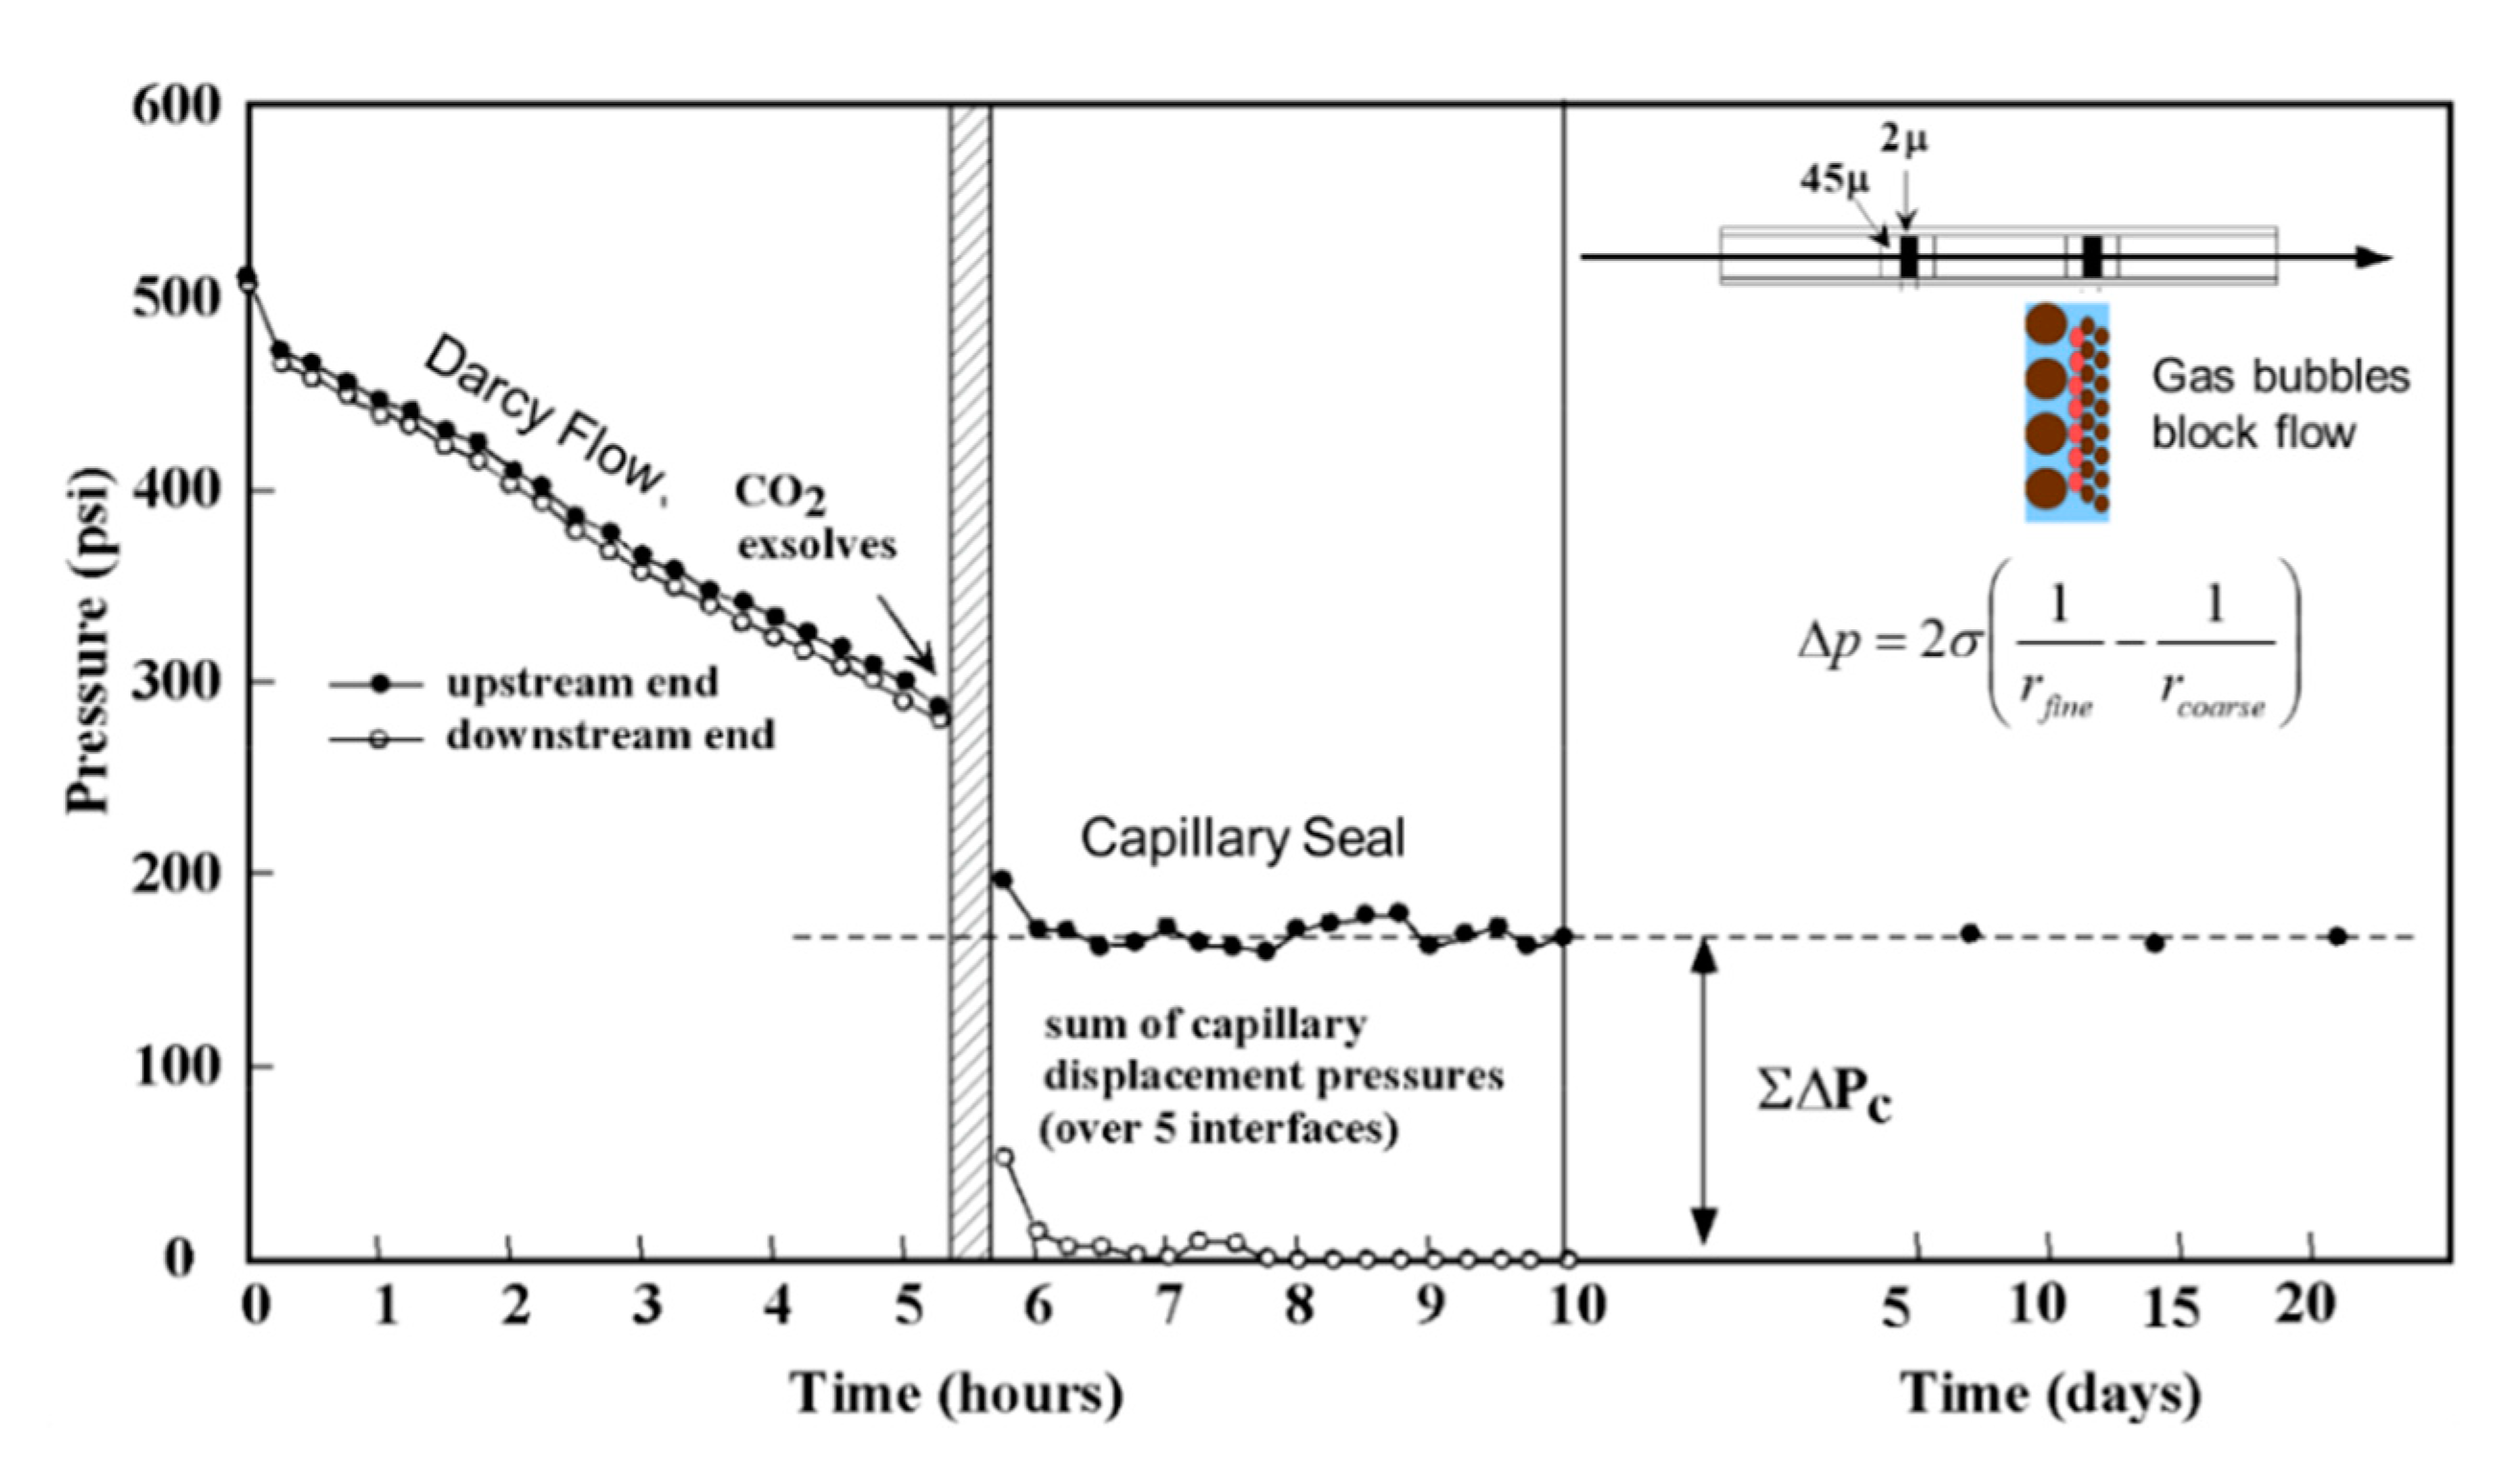
As illustrated in Figure 7, experiments carried out by Jennifer Shosa [52] show that, under the right circumstances, capillary seals can impede both brine and hydrocarbons. The right circumstance is that sufficient quantities of both wetting and non-wetting fluid phases be present in the pore space. Shosa passed CO2-laden water through a 0.5 m long 12.7 mm inner diameter sand-packed tube that contained 2 to 8 fine-grained impeding layers. The impeding layers consisted of 13 to 15 mm thick intervals of 2 μm diameter sand held in place by adjacent 45 μm diameter sand layers ~11 mm thick, as illustrated in the insert. Flow was driven through the tube and through these fine impeding layers by a high-performance liquid chromatography (HPLC) piston pump. Pressure was controlled with a backpressure regulator at the discharge end, and reduced slowly with time. Until the pressure dropped below 290 psi and the CO2 began to exsolve, flow through the tube was single phase and the pressure difference between the entry and exit ends was very small (first 5¼ h in Figure 7). When the CO2 began to exsolve, flow through the tube was terminated and the pressure at the discharge and was reduced to atmospheric. The pressure at the entry end dropped to 163 psi over a short transition period (cross hatched band), and then remained unchanged for 3 weeks. The pore fraction of CO2 gas after this decompression was 54%.
The total pressure drop is linearly related to the number of barriers. Six barriers have twice the pressure drop of 3 barriers and six times the drop of one barrier. Re-pressuring past 290 psi restores single phase flow and the single phase permeability is unchanged and predicted well by the Kozeny-Carmen relationship. The capillary pressure drop is predicted well by the Laplace relationship (insert) which equates the pressure drop across a fine-grained layer to the product of twice the CO2-water interfacial tension, σ, and the difference of the inverse radii of the fine and coarse pores on either side of the interface. The Laplace relationship does not contain permeability, and the temperature dependence of the capillary pressure drop, measured between 20 and 100 °C, is that of CO2-water interfacial tension. The two-phase barrier to flow in the experiment is thus clearly of a capillary nature. The capillary seals remained intact when 0.3 tube pore volumes of CO2-saturated fluid were passed through them. The flow blockage can be visualized as gas bubbles preventing flow into all the pores in the fine sand like toilet plungers (see insert). Capillary seals are remarkably easy to form in the laboratory, and remarkably durable.
The kind of seal formed in Shosa’s experiments has many new properties and implications. It is not a lithologic seal. Although it may seem tied to lithology because it forms at a particular fine-grained layer or sequence of fine-grained layers, it can shift to other fine-grained layers. The top of overpressure can migrate upwards. Since sealing depends on both wetting (brine) and non-wetting (usually gas) phases being present, where either is dominant the seal does not exist. In a gas chimney, for example, gas is free to move inside the pipe and water is free to move outside the pipe. Only in the transition zone between gas and water are both fluids present in sufficient quantities to be immobilized. A proper-mixture-proportion impermeable sheath confines the pipe. A consequence is that a Shosa seal can fail completely, and release a great volume of gas from a pressurized compartment, and then re-heal. Finally, Shosa seals should form naturally and spontaneously in basins, and produce just the kind of pressure compartments observed. While recognizing that there is much we don’t know about the kind of seals formed in Shosa’s experiments, the following paragraphs discuss our current perceptions.

Pressure Compartmentation is Spontaneous and Natural

Shosa seals should form spontaneously and pressure compartment basins just as observed. Hydrocarbon maturation will saturate brines in a basin, and compaction and reactions with positive volume change will oblige those brines to move through the stratigraphy. As the brine moves upward and decompresses, a bit of gas will exsolve and plug some of the pores in a shale parting or other comparatively fine-grained barrier, reducing its permeability. The decrease in permeability will divert the brine to an adjacent location, and exsolved gas will reduce its permeability. Eventually, enough partings will be sealed that the flow is stopped. In this fashion local pressure compartments will form. The overpressures in the compartments will be variable, and they will exchange brine as they are buried, further compacted, and further pressured. The details will be complicated and probably unpredictable, but pressure compartments in basins can be expected to form naturally and spontaneously.

Incarcerated Gas

Gas flowing upward in a gas chimney is in a sense incarcerated by its bounding Shosa seals. Gas chimneys are common in hydrocarbon basins and are generally cylindrical, with diameters up to 3 km or more. But the best example of incarcerated gas is basin center gas (see [6] for a more extensive summary than offered here). Huge volumes of gas are incarcerated in the centers of basins where the permeability is <0.1 md (<10−16 m2), and the gas is typically under-pressured with respect to hydrostatic. Examples are the Appalachian basin from New York to Tennessee documented with over 76,500 wells [53,54], and the Western Canada Sedimentary basin, well documented by [55]. In the 600 × ~100 km portion of the Western Canada basin it is not possible to drill a well that does not hit gas; the issue is only to find zones permeable enough to produce it. This is also the situation in the Arkoma Basin which lies just east of the Anadarko Basin discussed above. The water saturation is so low in the Arkoma that it is impossible to produce water from it. The pressure gradient is gas-static (~1 MPa km−1), 1/10th the usual hydrostatic gradient. The Marcellus Shale is dry as a bone and contains over-pressured gas [56].
In all these cases, except the gas chimney, the gas has been incarcerated for geologic periods of time (hundreds of millions of years). The incarceration is by Shosa-type capillary seals. The basins are rich enough in organic material that enough gas has been generated to not only expel all the water but also, in some cases, blow dry the pore space to desiccation. Normally, capillary forces would draw water into the formations, but Shosa-type capillary seals formed in the transition zone to water saturated sediments prevent the imbibition of water.

Seal Migration

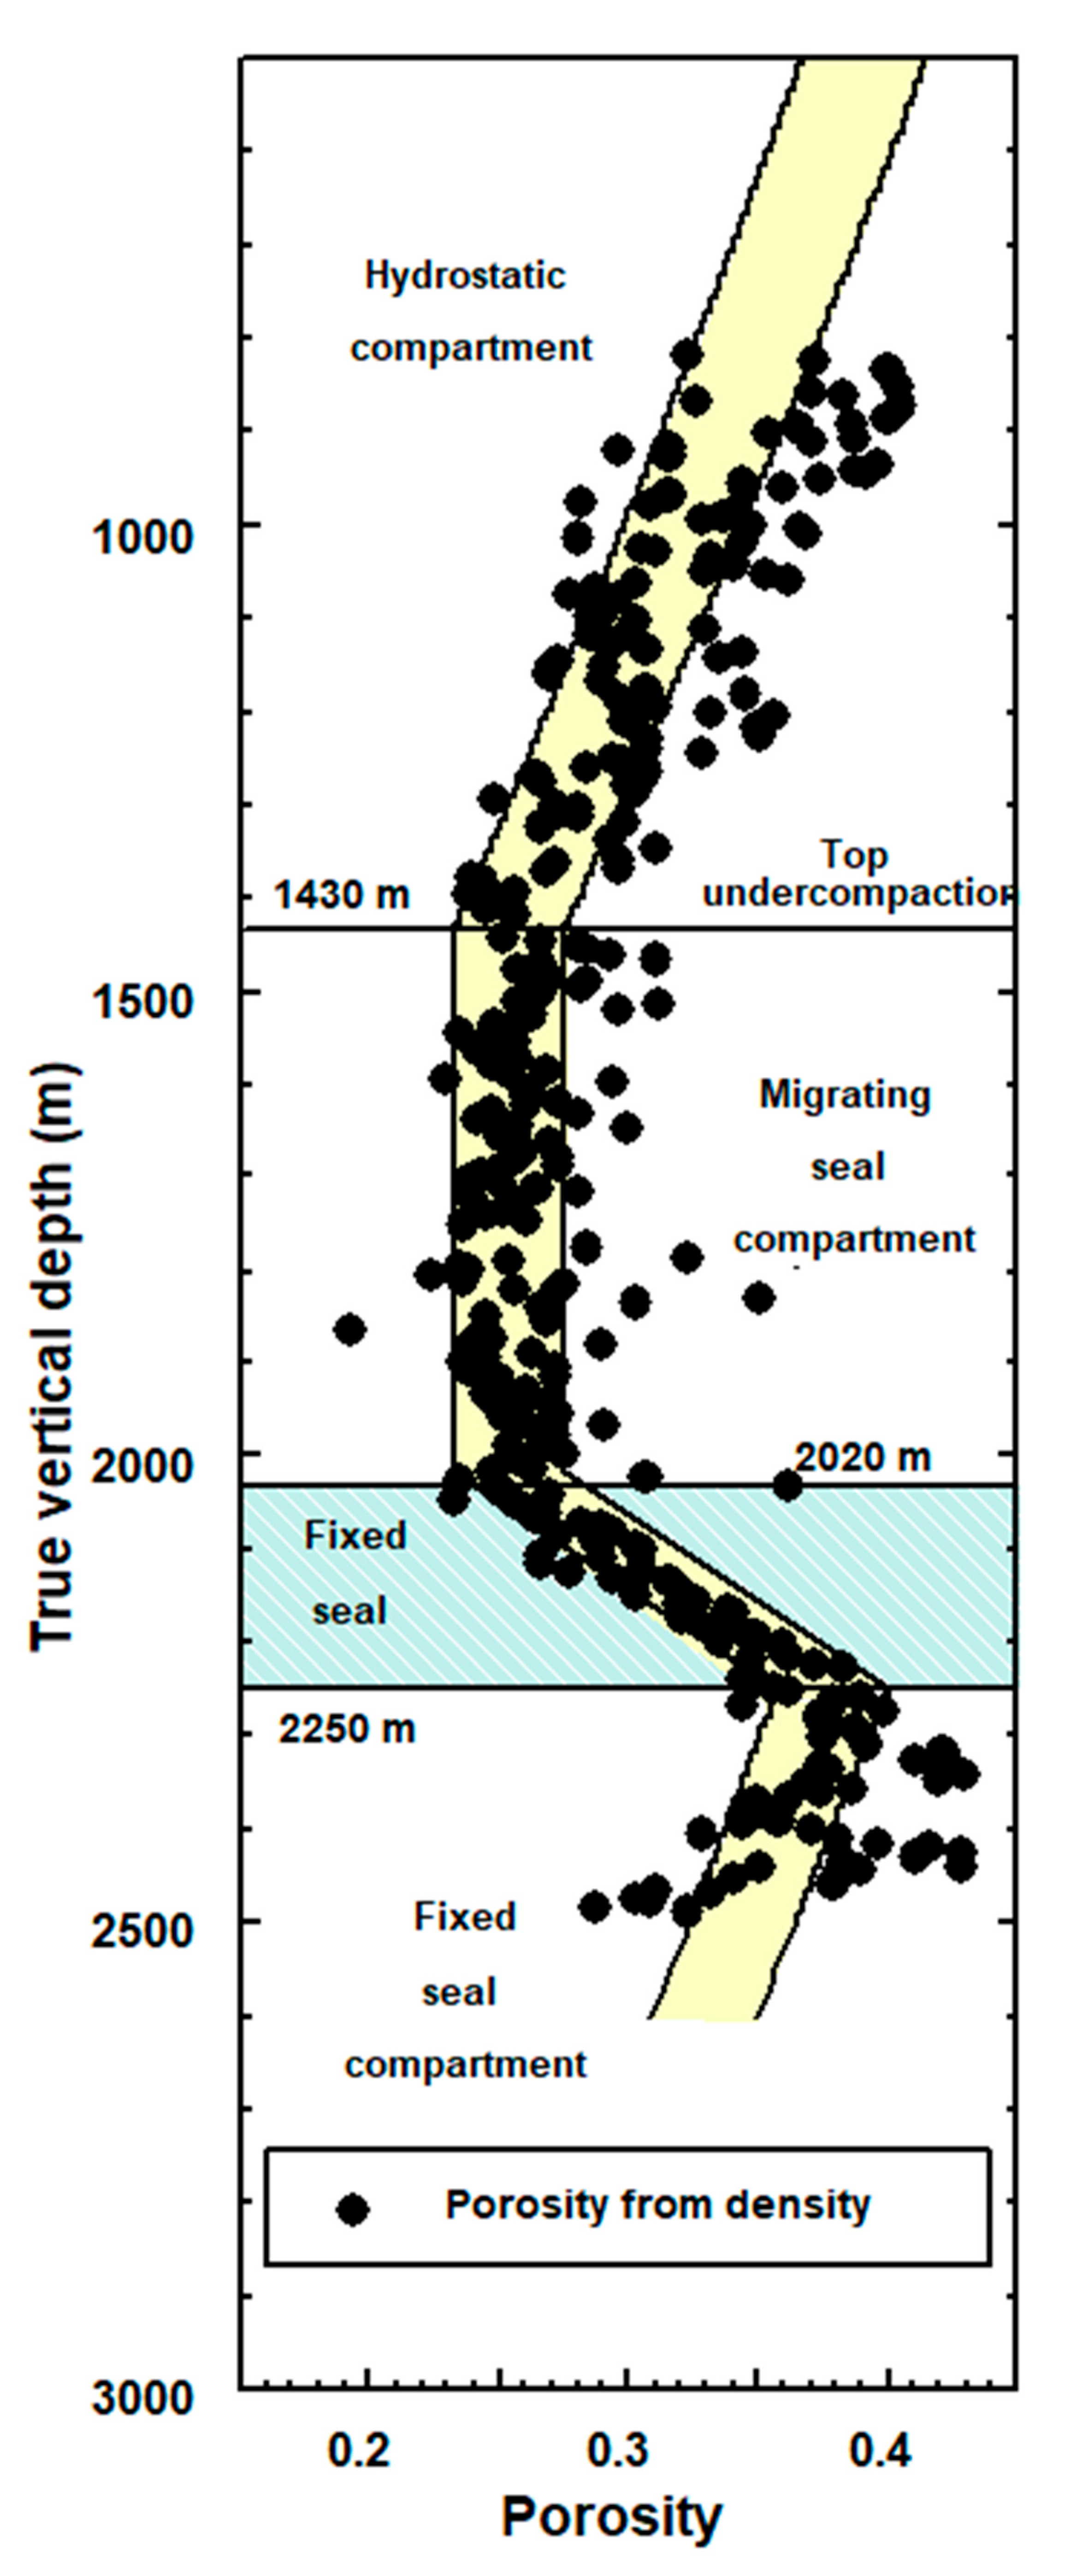
Shosa seals can migrate, and porosity profiles record the history of their formation and movement. Under hydrostatic conditions porosity is reduced almost linearly with depth. But because compaction depends on effective vertical stress (the weight of the overlying sediments and water minus the pore pressure), over-pressuring will arrest compaction.
Figure 8 illustrates how porosity changes with depth can be interpreted in terms of seal formation and migration. The black points indicate the porosity determined by density log. The yellow band is the model interpretation. The width of the band reflects the range in initial sediment porosities indicated by the measurements.
The pore pressure is hydrostatic and the compaction normal above 1430 m. If the blue-shaded H. selli shale became impermeable when its base was at 550 m water depth, the fixed seal compartment beneath it would have steadily increased in pressure (with no compaction because the pressure increase would keep the effective stress constant) until it began to hydrofrac and leak at a burial depth of 1430 m. As the seal top was buried from 1430 and the 2020 m depth, leakage caused the top of overpressure to migrate upward with sedimentation, capturing porosity at a constant depth and leading to a constant porosity-depth profile. The theoretical background and analysis of porosity depth profiles for 40 Gulf of Mexico wells can be found in [57]. The point here is that a porosity profile can tell us about when seals formed and how they migrated.

Fluids Migrate Together

One implication of a compartmented basin is that brines and hydrocarbons will tend to migrate together more than they otherwise might. Both will pass through the compartment seals only where and when they leak. Because the effective stress is lowest there, seals will tend to leak at topographic highs in the top of overpressure. Thus it is no surprise that hydrocarbon reservoirs are located preferentially near these highs. Brines will also flow preferentially through the topographic highs, and flow down the pressure gradient of the seal (and the higher temperature gradient it tends to host) will alter the seal. In the final volume of the GRI report, Jennifer Shosa lays the foundation for using the alteration as a flow meter for expelled brine [16].

Fluid Release Valve

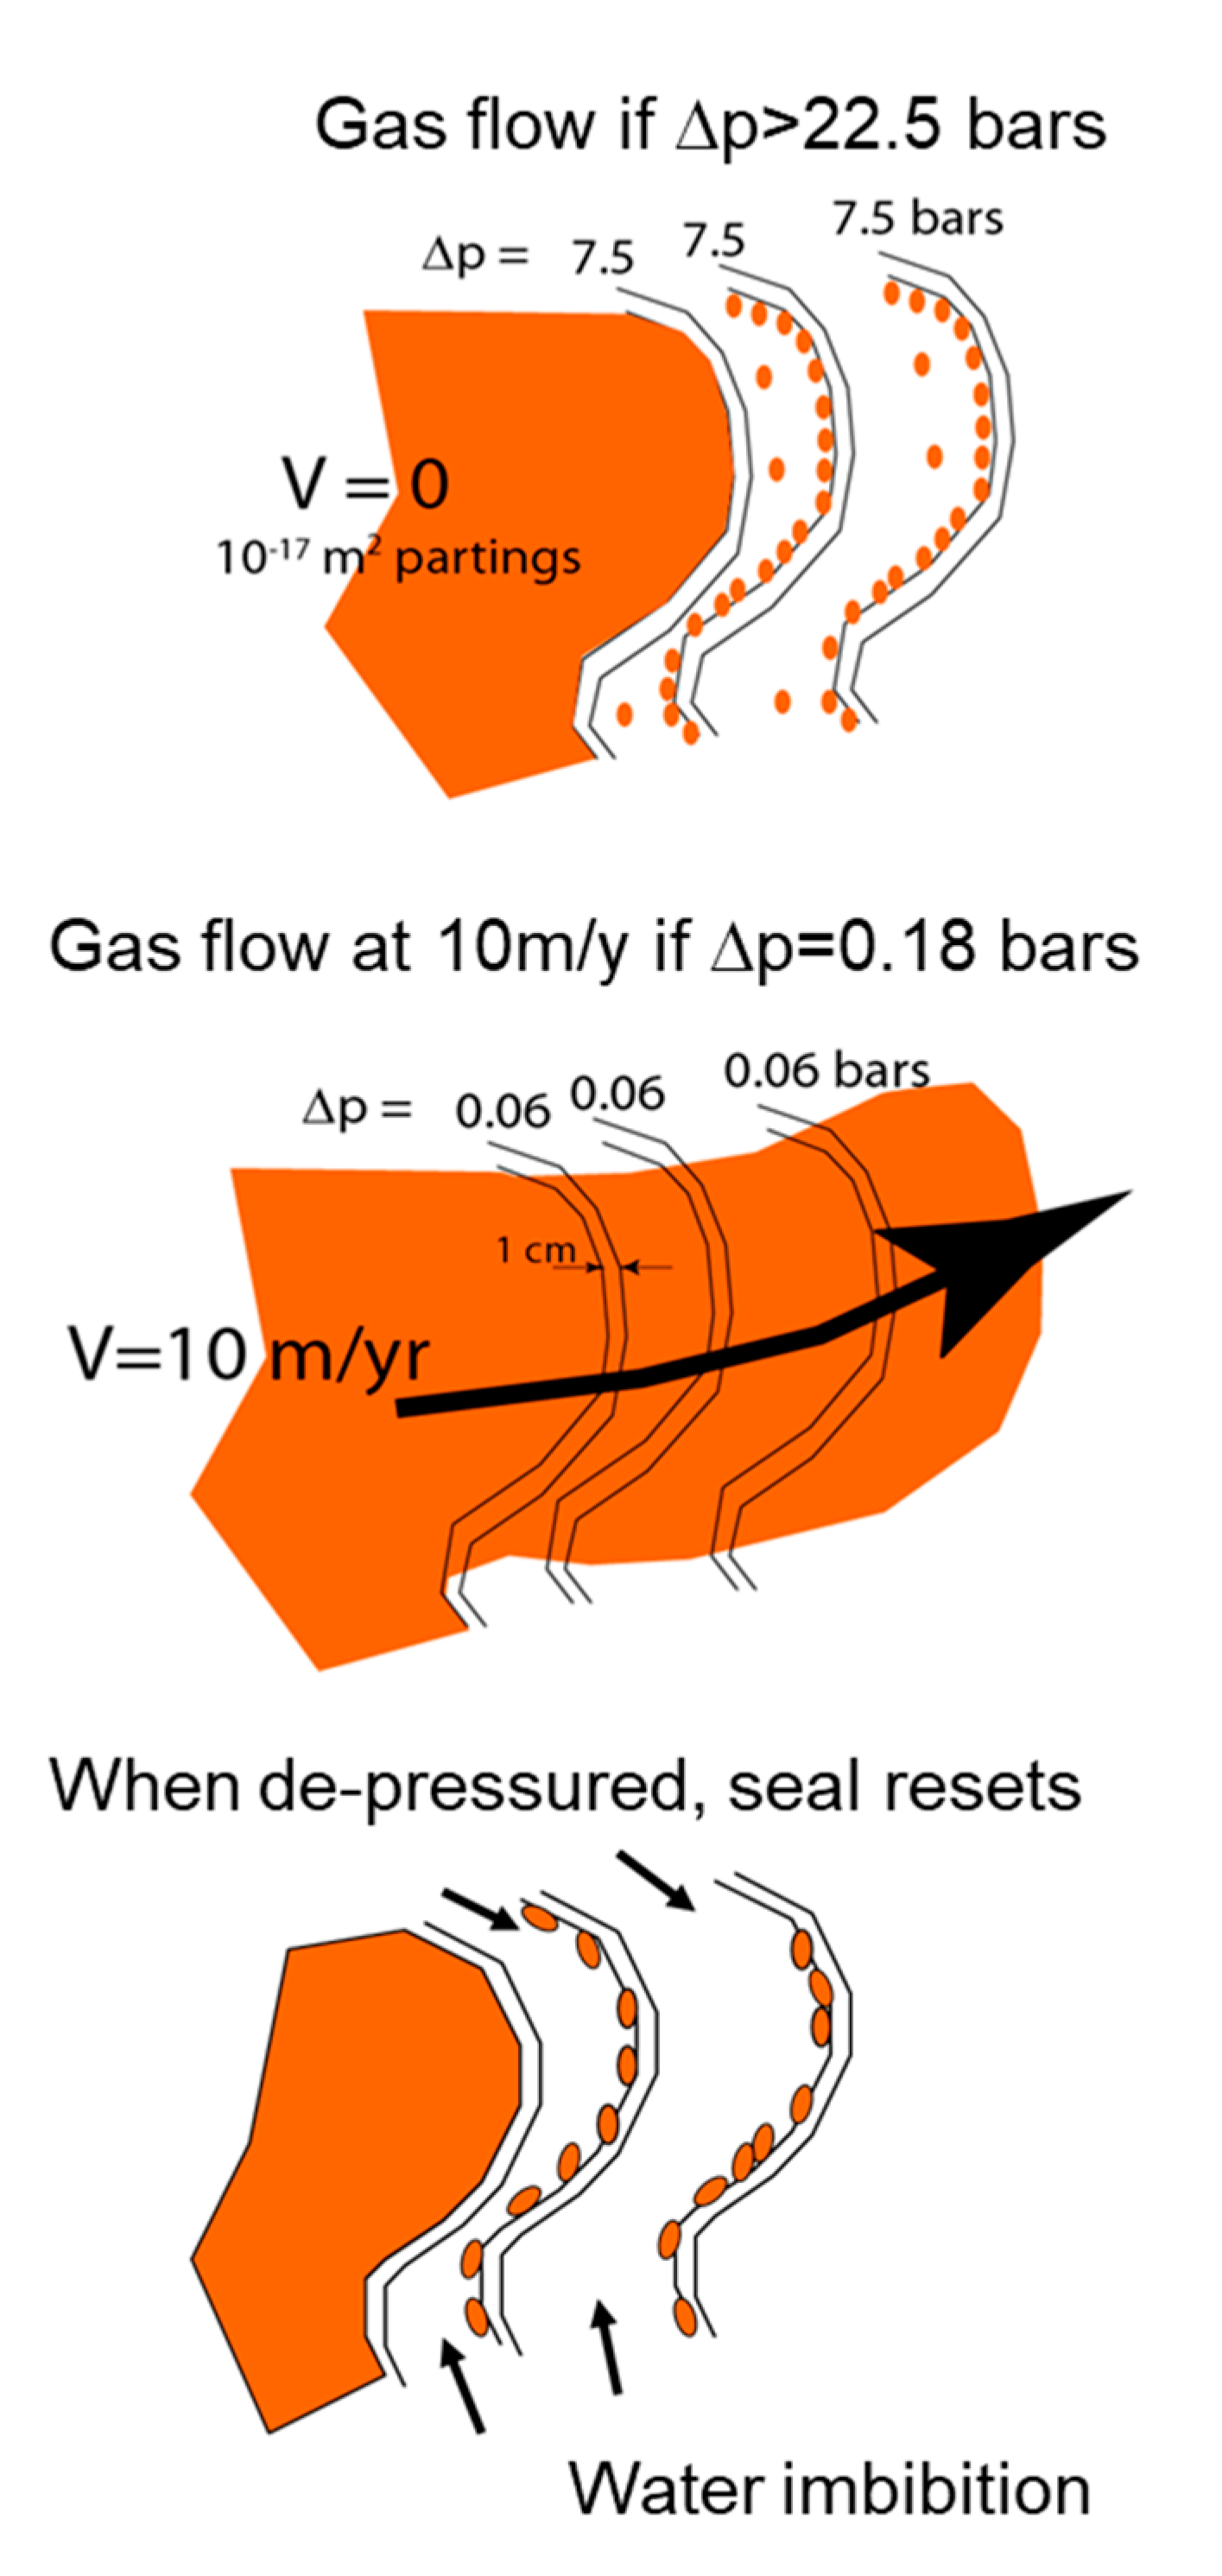
Shosa seals can open and shut like valves. When open, very large volumes of gas can be released very quickly. Figure 9 gives a calculated example for a series of three 1cm-thick partings with 0.1 md permeability. The caption explains the valve-like operation.

Gas Pulsar Formation of Mississippi Valley-Type (MVT) Deposits

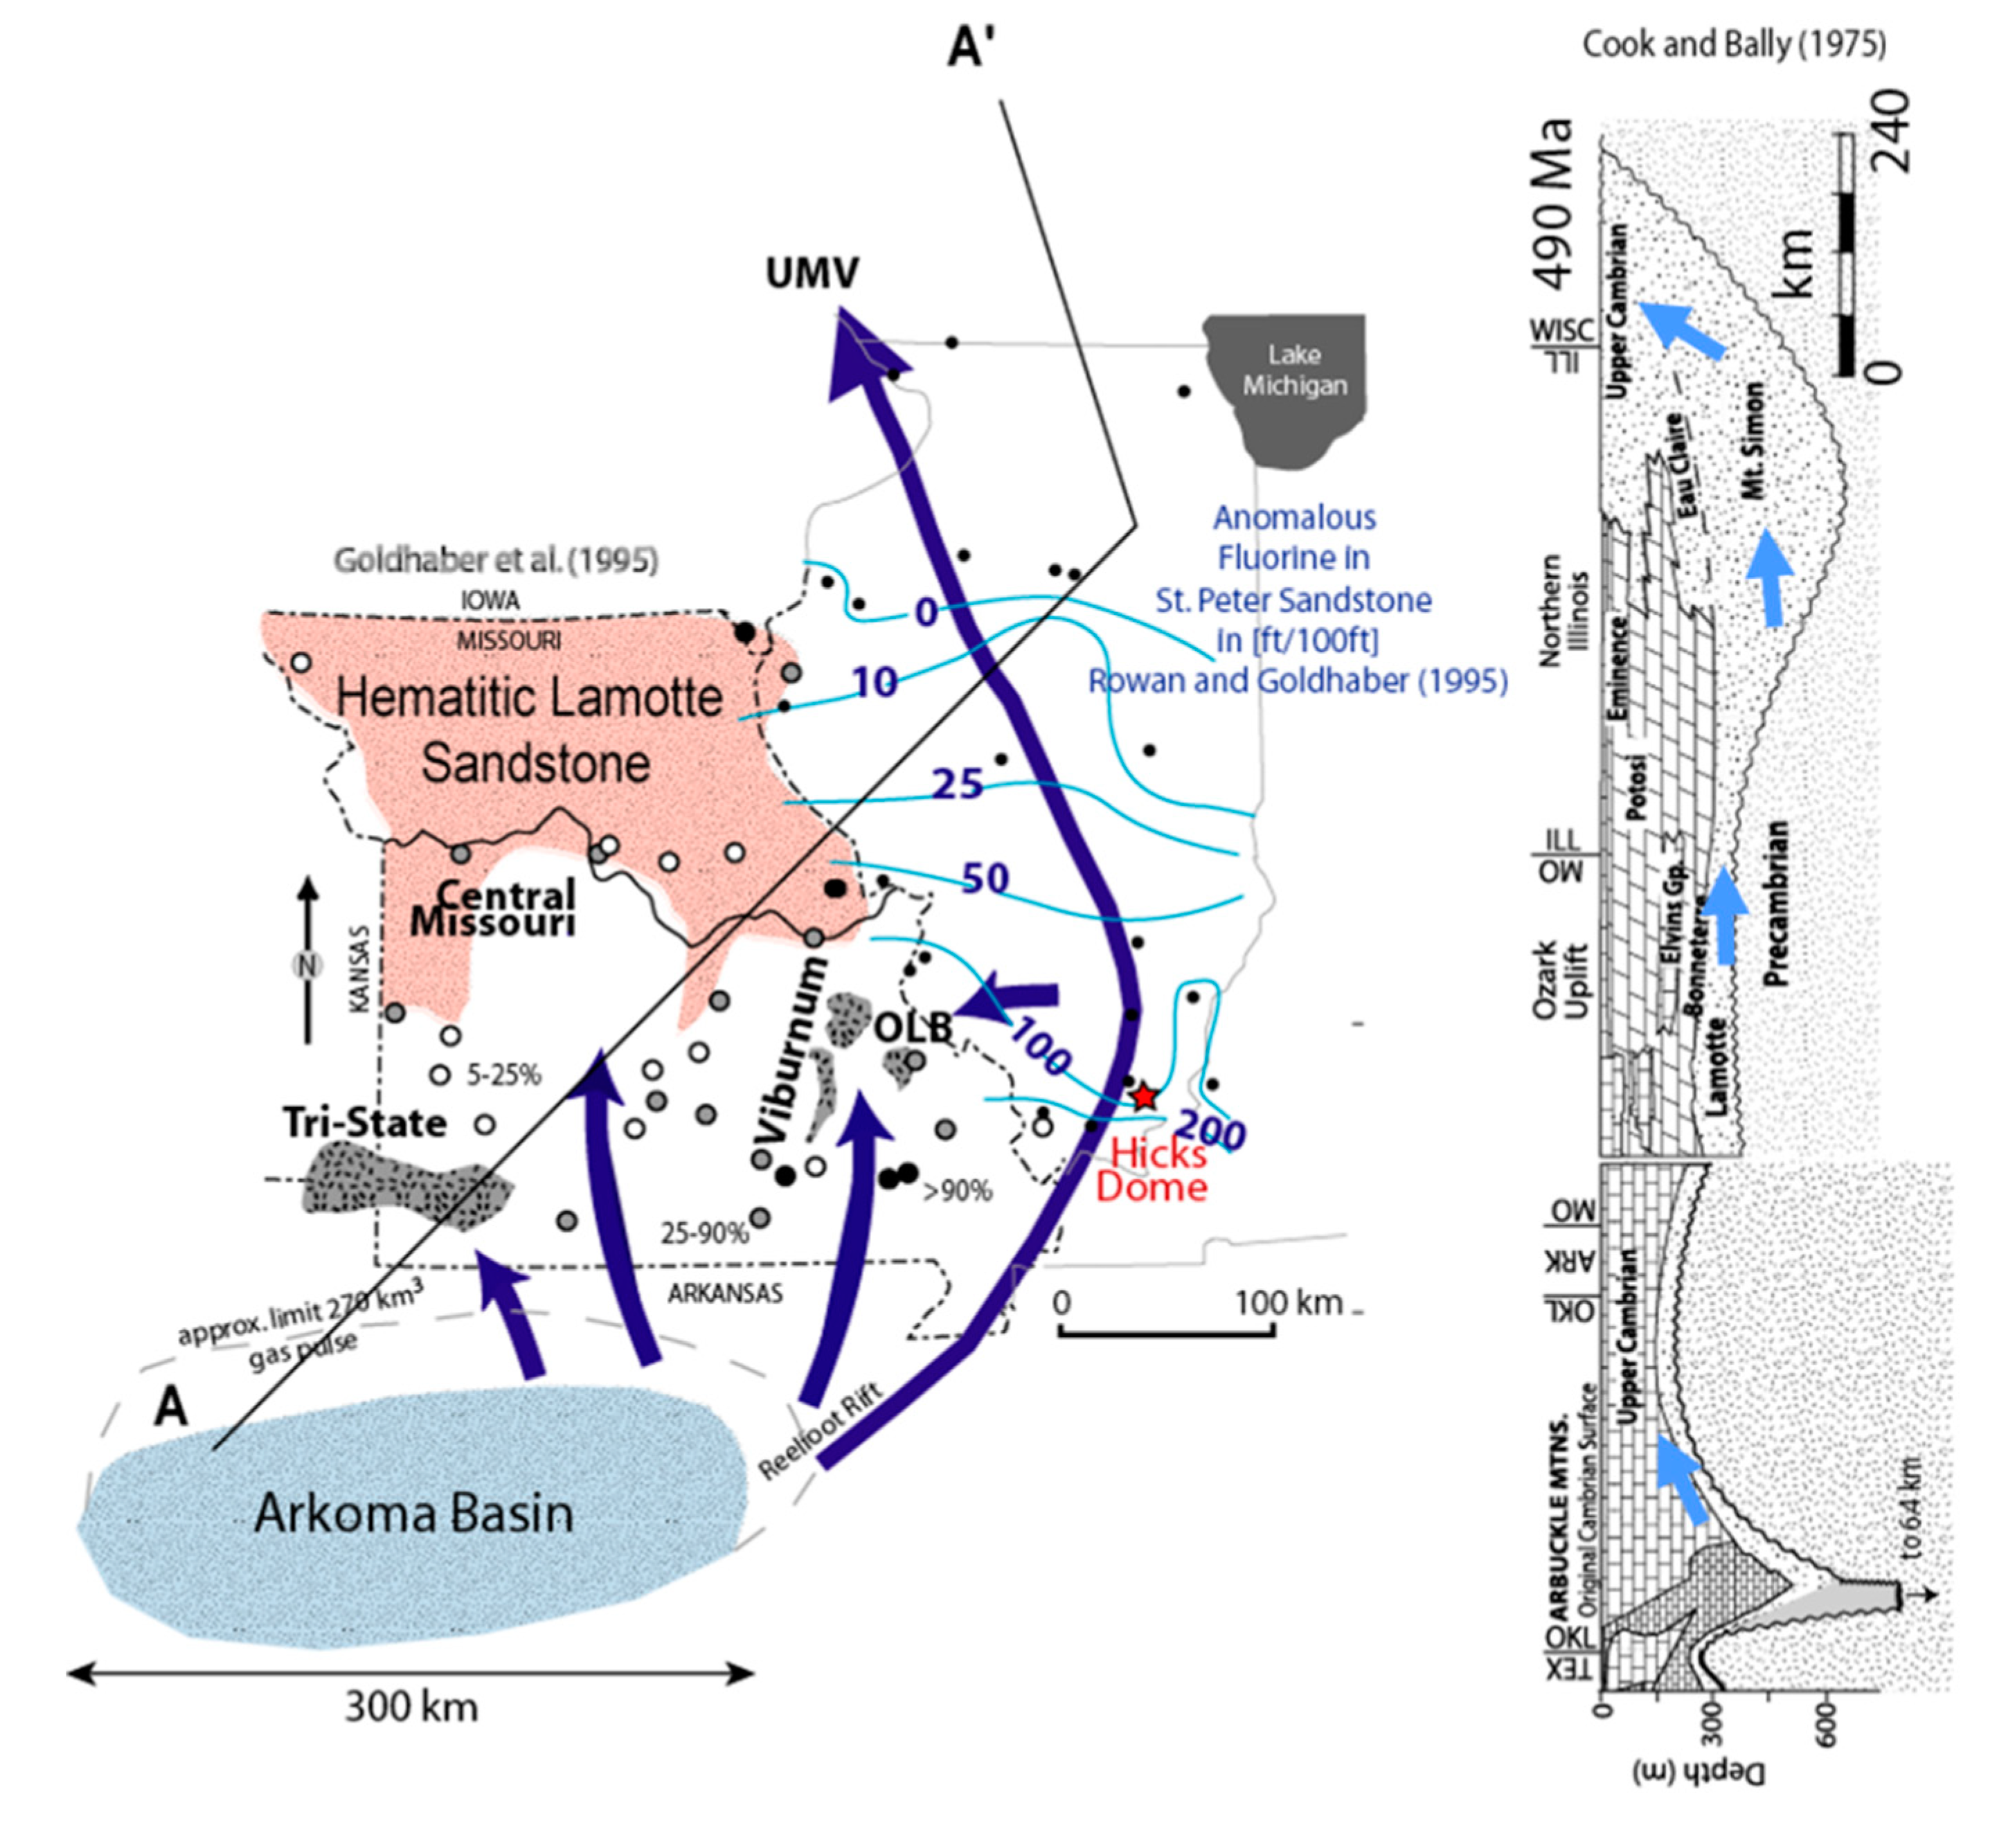
Figure 10 illustrates how failure of the seal between the gas-filled Arkoma and the darcy permeability aquifer system underlying the interior of the North American continent could have delivered pulses of hot brine to the sites of metal deposition. Weathering of Precambrian rocks in North America produced the extensive mid-continent darcy permeability Lamotte and Mt. Simon sandstones. These were subsequently overlain by karstic (and therefore very permeable) carbonates. The bines that produced the mid-continent MVT deposits discharged from these aquifers where the basal sands or carbonates approached the surface or were intersected by numerous or major faults. The pattern of hematite reduction in the Lamotte and the decrease northward from the Hicks Dome source of anomalous flourine in the St. Peter sandstone, suggest the mineralizing brines came from the Arkoma (Figure 10).
How could the presently gas-filled and under-pressured Arkoma have propelled the brines? The hypothesis is that back in the Permian when the Arkoma was actively generating gas it was overpressured. Periodically the capillary barrier between the Arkoma and the Lamotte and overlying carbonate was invaded by gas, rendered permeable, and perhaps as much as 3240 km3 of gas was rapidly injected into the aquifers. The brine displaced by this gas exited the aquifer system rapidly at all the most permeable excape locations, e.g., at exactly the sites of MVT deposition. After decompression, imbibition of water resealed the barrier seal, the Arkoma repressured and then delivered a second pulse of gas which caused a second pulse of brine and mineralization, etc. The expulsion could be rapid enough to warm the sites of MVT deposition as observed [41]. The underpressured state of the gas in the Arkoma indicates that the gas pressure after the last expulsive pulse was, and is presently, controlled by capillary seals at the top of the gas zone (e.g., [55]).

Late Paleozoic Remagnetization of the North American Mid-Continent

A plethora of paleomagnetic studies have confirmed that the entire mid-continent of the U.S. was re-magnetized in the Late Paleozoic. The area re-magnetized, by magnetite deposition, is that shown in Figure 10, but extends into Indiana, Kentucky and Ohio as well. It is considered a consequence of tectonically-driven brine migration [61], and occurred at the time the MVT deposits formed [62,63,64]. It is logical that the pulses of massive brine expulsion discussed in the previous section were also responsible for this continent-scale re-magnitization.

Impact on Oil Production

If gas exsolves from oil during production, capillary seals may reduce production. Capillary barriers can be accounted for by changing Darcy’s law to a plastic flow law wherein a small pressure gradient must be exceeded for any flow to occur. For a typical reservoir system gas exsolution and capillary barriers might reduce hydrocarbon flow to a well by 20% in 183 days. The damage will be fastest and greatest for the best producing wells because the drawdown cone for such wells extends further and encounters more capillary barriers. If production is stopped, the pressure will recover, the exsolved gas will dissolve, and the well will produce as it did initially [65]. Shosa seals have production implications.

2.3.3. Mud Volcanoes

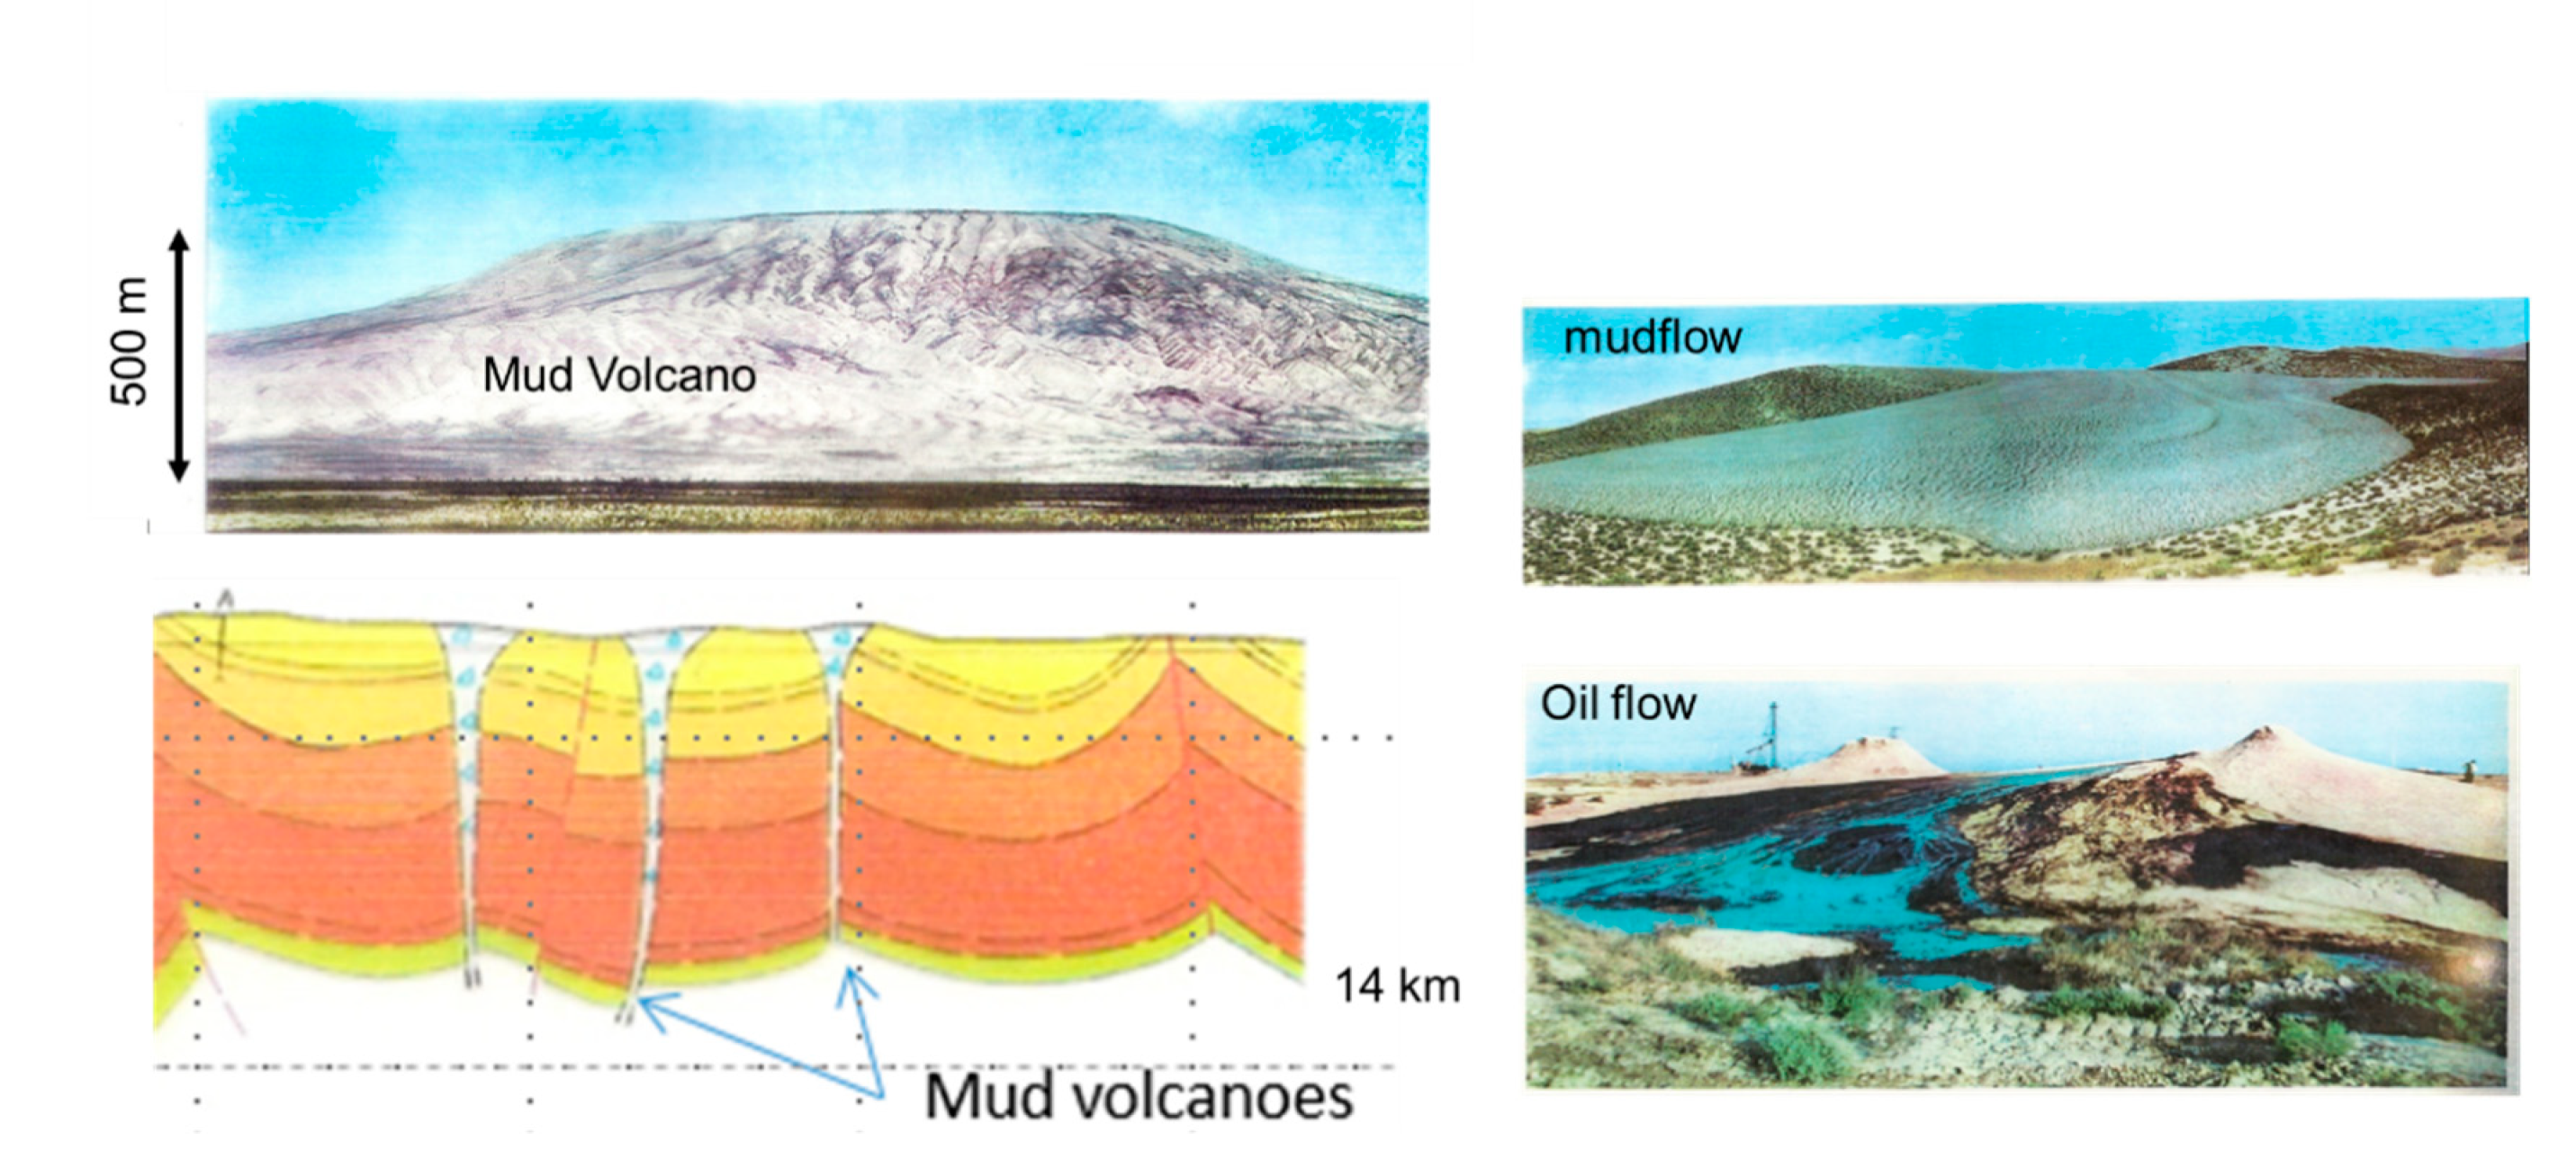
Mud volcanism, such as is occurring in Azerbaijan, results when sediments lack sufficient induration to allow maturing gas and oil to escape. Hydrocarbons maturing at ~14 km depth in Azerbaijan produce overpressures that make the sediments quick (as in quick sand). The result is oil- and gas-spewing mud volcanoes 1 to 3.5 km in diameter. As illustrated in a spectacular geologic atlas [66], the stratigraphy is literally turning itself inside out, and there is an observed triad of oil, gas, and diapiric structures (Figure 11).

2.4. Non-Hydrocarbon Gas Dynamics

Non-hydrocarbon gases generated in basins contribute information on how basins operate. Consider two: CO2 and H2.

2.4.1. CO2 Generation and Titration

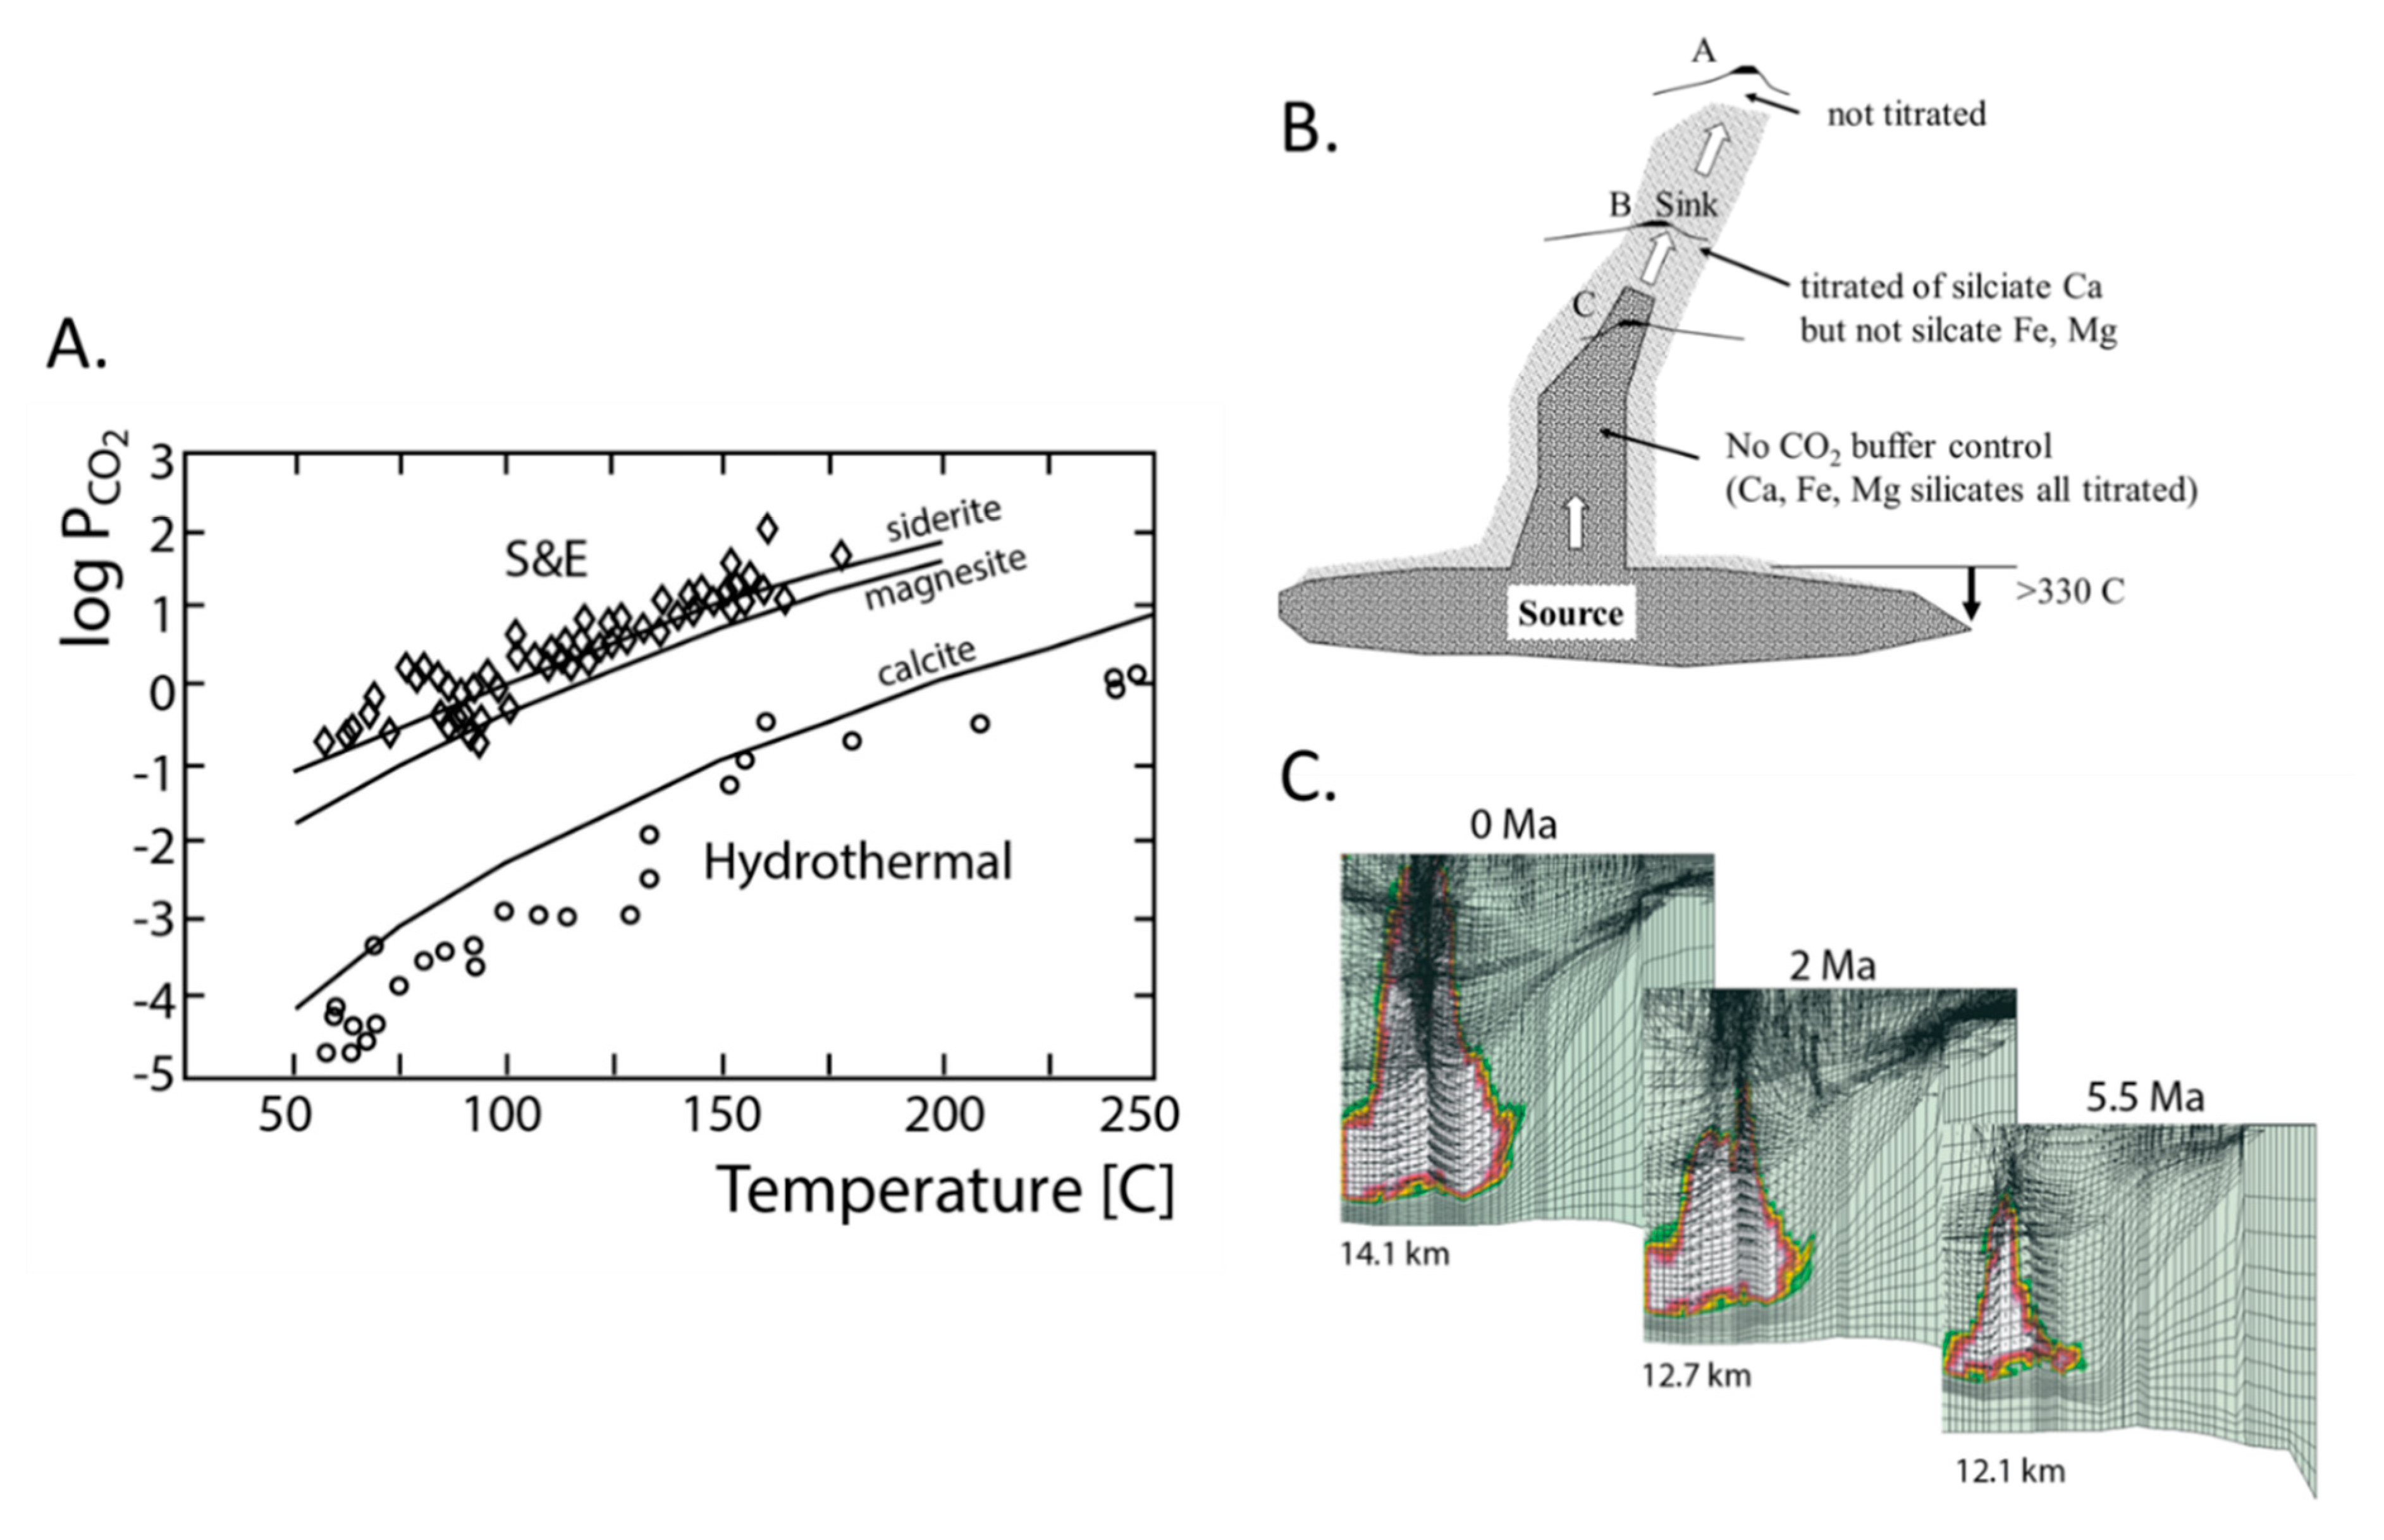
Some reservoirs trap almost pure CO2, and it is not uncommon for gas in reservoirs to contain a few percent CO2. In the latter case, the partial pressure of CO2 depends systematically on temperature, which indicates chemical equilibrium with siderite or magnesite [67], as shown in Figure 12A. Most reservoirs contain almost no CO2. These observations can be understood and modeled as indicated in Figure 12.
At 350 °C the partial pressure of water vapor and CO2 exceeds the fluid pressure in over-pressured basins, and a separate gas phase is formed. But dissolved CO2 is highly reactive, and as it migrates upward it will react with any silicate minerals that contain Ca, Mg, or Fe to form carbonates. The CO2 in the rising gas will be consumed. So long as the stratigraphy contains calcium aluminosilicates, the partial pressure in the gas and in reservoirs will be very low. If the Ca aluminosilicates have been fully reacted but Mg or Fe aluminosilicates remain, the partial pressure of CO2 in the reservoirs will depend on temperature and lie on the Smith and Ehrenberg (S&E) [67] buffer trend shown in Figure 12A. When the Mg or Fe aluminosilicates are titrated, there is no buffer control, and the reservoirs can be filled with pure CO2. The titration is illustrated in Figure 12B. Reservoirs at location C can contain 100% CO2, reservoirs at location B a few percent CO2, and reservoirs at location A will contain no CO2. Figure 12C shows how this titration process has been implemented in basin models (see [68]). Documentation of titrated migration pathways could reveal a lot about how gas migrates over substantial intervals of time in basins.

2.4.2. H2 Generation

Prinzhofer and Cathles [69] describe how H2, generated at 250 °C from ammonium breakdown, migrates to the surface to vent in pulses in Brazil. The daily pulses of H2 appear to be related to atmospheric tidal pressure changes. Modeling the pulses could help constrain the economic potential of the H2 resource.

3. Summary and Discussion

The above discussion by no means reviews all the interesting phenomena in basins, but hopefully has reviewed enough to ground a discussion of what might be beneficially incorporated into future basin models.
Space for sediment deposition is produced by rifting and spreading, processes governed by plate tectonics. On occasion models can be constructed that successfully predict the warming of sediments from first principles, and when this is done large scale basin properties are constrained, such as the degree of cooling by sediment deposition and warming by sediment radiogenicity. When first-principle models deviate from measured temperature or maturity profiles, processes such as cooling or warming by ground water circulation, or warming by sill intrusion may be inferred and perhaps quantified. Thus, ground-up models could produce insights useful enough to justify the effort required to construct them. Papers in this volume that assess the impact of sill emplacement are a step in this direction and illustrate the practical value that could be realized.
Defining permeability is perhaps the most important step in exploring for and producing basin resources. But what if permeability is set by the rate of fluid escape required by the sedimentation rate as suggested above? What if the distribution of permeability must be scale invariant as suggested by Malin et al. [5]. What if the most permeable flow pathways in this distribution could be imaged seismically as suggested by Sicking and Malin [70]. Incorporating such considerations and methods could produce far more accurate basin and production models.
Fluid flow is what we want to know because it is what redistributes and accumulates basin resources. The scale of flow in basins is stunning. Half the eastern portion of the Southern Permian Basin contributed the brine that mineralized the Kupferschiefer and produced the deposits in Poland. Pulses of brine flow remagnetized a substantial portion of the North American mid-continent while producing the MVT deposits found there. Knowing that a basin does not follow its paleomagnetic polar wander path, and therefore that it has been remagnetized, might be a clue to look for MVT deposits in that basin. Knowing that a basin has experienced pulses of rapid fluid flow (the kind that can remagnetize large areas) suggests the basin did not sustain the overpressured conditions for long periods as is required to produce Kupferschiefer style mineralization. Pulses of brine expulsion may not be optimum for hydrocarbon accumulation, or may displace accumulations from their expected positions. But pulses can produce MVT deposits.
Chemical alteration tells a lot. It is striking that the Cu enrichment of the Kupferschiefer and immediately surrounding strata is 28 times larger than the Cu in the discovered Polish deposits. The ubiquity of the Kupferschiefer metallization is remarkable. Large areas in Poland show metal enrichment (Zn, Pb, or Cu) well above background. The relative enrichment of Zn, Pb, and Cu shows a regular westward increase in leakage through the Kupferschiefer that ultimately produces ore deposits near the Fore-Sudedetic-Block. The Polish example suggests that if enriched metal content in a shale overlying red beds is noted, particularly if the shale shows indications of fluid overpressuring at the time of mineralization, one should look for base metal zoning in the shale and follow the gradient toward more intense leakage and mineralization. Similarly, measured reservoir CO2 concentrations on the Smith and Ehrenberg concentration-temperature trend indicate CO2 reservoirs might be found down section. A lot of useful information might be extracted from the patterns of chemical alteration. Patterns of chemical alteration could be used to train more capable basin models.
Capillary seal dynamics of the Shosa type deserves a lot of attention. Porosity profiles that tell when seals formed and how they migrated constrain the timing of hydrocarbon maturation and overpressuring. Since Shosa seals require a non-aqueous (usually hydrocarbon) fluid phase, basin flow was completely different before organic material was buried in sufficient quantity to produce hydrocarbon fluids. Paleozoic MVT deposits should not exist, and this seems to be the case [71].
It is hoped that this short paper has convinced the reader that sedimentary basins are indeed giant stratigraphic-structural-thermochemical reactors with surprising and fascinating characteristics and useful mineral and hydrocarbon products. Thanks to the focused exploration and research over the last 100 years we know enough about basins to begin to appreciate how they operate and how their processes interact. But, I suspect our understanding is just beginning. In the future we will understand a great deal more about their large scale interactions, and models that incorporate this understanding will be more effective exploration and extraction tools.

Funding

No funding supported the preparation of this paper. Past funding from the Gas Research Institute (GRI Grants 5093-260-2689 and 5097-260-3787), the DoE (DE-AC26-99BC15217), The Petroleum Research Fund (PRF 19767-AC2), Chevron Petroleum Technology Co. (CPTC 4505567 and 0070) and support (financial and data) from the Global Basin Research Network corporate affiliates program is gratefully acknowledged.

Acknowledgments

The author thanks three anonymous reviewers for excellent suggestions, and Richard Chuchla for inviting a presentation that formed the initial basis of this paper at the annual 2018 meeting of the Society of Economic Geologists in Keystone, Colorado.

Conflicts of Interest

The author declares no conflict of interest. The funders had no role in the design of the study; in the collection, analyses, or interpretation of data; in the writing of the manuscript, or in the decision to publish the results.

References

  1. McKenzie, D. Some remarks on the development of sedimentary basins. Earth Planet. Sci. Lett. 1978, 40, 25–32. [Google Scholar] [CrossRef]
  2. Cathles, L.M.; Guber, A.L.; Lenagh, T.C.; Dudás, F.Ö. Kuroko-Type Massive Sulfide Deposits of Japan: Products of an Aborted Island-Arc Rift. In The Kuroko and Related Volcanogenic Massive Sulfide Deposits; Society of Economic Geologists: Littleton, CO, USA, 1983. [Google Scholar]
  3. German, C.R.; Petersen, S.; Hannington, M.D. Hydrothermal exploration of mid-ocean ridges: Where might the largest sulfide deposits be forming? Chem. Geol. 2016, 420, 114–126. [Google Scholar] [CrossRef] [Green Version]
  4. Eugster, H.P. Oil shales, evaporites and ore deposits. Geochim. Cosmochim. Acta 1985, 49, 619–635. [Google Scholar] [CrossRef]
  5. Malin, P.; Leary, P.; Cathles, L.M.; Barton, C.C. Observational and critical state physics descriptions of long-range flow structures. Geosciences 2019. submitted. [Google Scholar]
  6. Cathles, L.M.; Adams, J.J. Fluid Flow and Petroleum and Mineral Resources in the Upper (<20-km) Continental Crust. In One Hundredth Anniversary Volume; Society of Economic Geologists: Littleton, CO, USA, 2005; pp. 77–110. [Google Scholar]
  7. Nelson, P.H. Permeability-porosity Relationships in Sedimentary Rocks. Soc. Petrophys. Well-Log Anal. 1994, 35, 38–62. [Google Scholar]
  8. Nelson, P.H. Evolution of Permeability-Porosity Trends in Sandstones. In Proceedings of the SPWLA 41st Annual Logging Symposium, Dallas, TX, USA, 4–7 June 2000; p. 14. [Google Scholar]
  9. Neuzil, C.E. How permeable are clays and shales? Water Resour. Res. 1994, 30, 145–150. [Google Scholar] [CrossRef]
  10. England, W.A.; Mackenzie, A.S.; Mann, D.M.; Quigley, T.M. The movement and entrapment of petroleum fluids in the subsurface. J. Geol. Soc. 1987, 144, 327–347. [Google Scholar] [CrossRef]
  11. Løtveit, I.F.; Fjeldskaar, W.; Sydnes, M. Tilting and Flexural Stresses in Basins Due to Glaciations—An Example from the Barents Sea. Geosciences 2019, 9, 474. [Google Scholar] [CrossRef] [Green Version]
  12. Cathles, L.M.; Wizevich, M.; Losh, S. Volume II: Geology, geophysics, geochemistry, and GoCAD database. In Seal Control of Hydrocarbon Migration and Its Physical and Chemical Consequences; GRI-03/0065; Cathles, L.M., Ed.; Gas Research Institute: Chicago, IL, USA, 2002; p. 51. [Google Scholar]
  13. Whelan, J.K.; Eglinton, L. Volume III: Organic geochemical consequences in a North South transect in the northern Gulf of Mexico. In Seal Control of Hydrocarbon Migration and Its Physical and Chemical Consequences; GRI-03/0065; Cathles, L.M., Ed.; Gas Research Institute: Chicago, IL, USA, 2002; p. 85. [Google Scholar]
  14. Losh, S.; Cathles, L.M. Volume IV: Gas washing of oil and its implications. In Seal Control of Hydrocarbon Migration and Its Physical and Chemical Consequences; GRI-03/0065; Cathles, L.M., Ed.; Gas Research Institute: Chicago, IL, USA, 2002; p. 74. [Google Scholar]
  15. Cathles, L.M.; Losh, S. Volume V: A modeling analysis of the hydrocarbon chemistry and gas washing, hydrocarbon fluxes, and reservoir filling. In Seal Control of Hydrocarbon Migration and Its Physical and Chemical Consequences; GRI-03/0065; Cathles, L.M., Ed.; Gas Research Institute: Chicago, IL, USA, 2002; p. 63. [Google Scholar]
  16. Cathles, L.M.; Shosa, J.D. Volume VI: A theoretical analysis of the inorganic alteration by flow of brines through seals. In Seal Control of Hydrocarbon Migration and Its Physical and Chemical Consequences; GRI-03/0065; Cathles, L.M., Ed.; Gas Research Institute: Chicago, IL, USA, 2002; p. 70. [Google Scholar]
  17. Cathles, L.M. Hydrocarbon generation, migration, and venting in a portion of the offshore Louisiana Gulf of Mexico basin. Lead. Edge 2004, 23, 760–770. [Google Scholar] [CrossRef]
  18. Losh, S.; Cathles, L.; Meulbroek, P. Gas washing of oil along a regional transect, offshore Louisiana. Org. Geochem. 2002, 33, 655–663. [Google Scholar] [CrossRef]
  19. Meulbroek, P. Equations of state in exploration. Org. Geochem. 2002, 33, 613–634. [Google Scholar] [CrossRef]
  20. Meulbroek, P.; Cathles, L.; Whelan, J. Phase fractionation at South Eugene Island Block 330. Org. Geochem. 1998, 29, 223–239. [Google Scholar] [CrossRef]
  21. Meulbroek, P.; Cathles, L.; Goddard, W.A. HCToolkit/EOS interface: An open source, multi-platform phase equilibria framework for exploring phase behaviour of complex mixtures. Geol. Soc. Lond. Spec. Publ. 2004, 237, 89–98. [Google Scholar] [CrossRef]
  22. Chen, D.F.; Cathles, L.M. A kinetic model for the pattern and amounts of hydrate precipitated from a gas steam: Application to the Bush Hill vent site, Green Canyon Block 185, Gulf of Mexico: A Kinetic Model for Hydrate Precipitation. J. Geophys. Res. 2003, 108. [Google Scholar] [CrossRef]
  23. Van Wees, J.-D.; Stephenson, R.A.; Ziegler, P.A.; Bayer, U.; McCann, T.; Dadlez, R.; Gaupp, R.; Narkiewicz, M.; Bitzer, F.; Scheck, M. On the origin of the Southern Permian Basin, Central Europe. Mar. Pet. Geol. 2000, 17, 43–59. [Google Scholar] [CrossRef]
  24. Oszczepalski, S. Kupferschiefer in Southwestern Poland: Sedimentary environments, metal zoning, and ore controls. In Sediment-Hosted Stratiform Copper Deposits; Special Paper; Geological Association of Canada: St. John’s, NL, Canada, 1989; pp. 571–600. [Google Scholar]
  25. Cathles, L.M.; Oszczepalski, S.; Jowett, E.C. Mass balance evaluation of the late diagenetic hypothesis for Kupferschiefer Cu mineralization in the Lubin Basin of southwestern Poland. Econ. Geol. 1993, 88, 948–956. [Google Scholar] [CrossRef]
  26. Oszczepalski, S.; Speczik, S.; Zieliński, K.; Chmielewski, A. The Kupferschiefer Deposits and Prospects in SW Poland: Past, Present and Future. Minerals 2019, 9, 592. [Google Scholar] [CrossRef] [Green Version]
  27. Jowett, E.C.; Rydzewsk, A.; Jowett, R.J. The Kupferschiefer Cu–Ag ore deposits in Poland: A re-appraisal of the evidence of their origin and presentation of a new genetic model. Can. J. Earth Sci. 1987, 24, 2016–2037. [Google Scholar] [CrossRef]
  28. Ziegler, P.A. Evolution of the Arctic-North Atlantic and the Western Tethys/Book and Map; American Association of Petroleum Geologists: Tulsa, OK, USA, 1988. [Google Scholar]
  29. Schito, A.; Corrado, S.; Trolese, M.; Aldega, L.; Caricchi, C.; Cirilli, S.; Grigo, D.; Guedes, A.; Romano, C.; Spina, A.; et al. Assessment of thermal evolution of Paleozoic successions of the Holy Cross Mountains (Poland). Mar. Pet. Geol. 2017, 80, 112–132. [Google Scholar] [CrossRef]
  30. Oszsczepalski, S.; Rydzewski, A.; Speczik, S. Rote Fäule-related Au–Pt–Pd mineralization in SW Poland: New data. In Proceeding of the Fifth Biennial SGA Meeting, London, UK, 22–25 August 1999. [Google Scholar]
  31. White, W.S. A paleohydrologic model for mineralization of the White Pine copper deposit, northern Michigan. Econ. Geol. 1971, 66, 1–13. [Google Scholar] [CrossRef]
  32. Brown, A.C. Sediment-hosted Stratiform Copper Deposits. Geosci. Canada 1992, 19, 125–141. [Google Scholar]
  33. Mauk, J.L.; Kelly, W.C.; van der Pluijm, B.A.; Seasor, R.W. Relations between deformation and sediment-hosted copper mineralization: Evidence from the White Pine part of the Midcontinent rift system. Geology 1992, 20, 427–430. [Google Scholar] [CrossRef]
  34. Oszczepalski, S.; Rydzewski, A.; Geologiczny, P.I. Metallogenic Atlas of the Zechstein Copper-Bearing Series in Poland; Państwowy Instytut Geologiczny: Warsaw, Poland, 1997. [Google Scholar]
  35. Downorowicz, S. Geothermics of the copper ore deposit of the Fore-Sudetic monocline: Prace Inst. Ge-. ol. (Poland) 1983, 106, 88. [Google Scholar]
  36. Hallager, W.S.; Carpenter, A.B.; Campbell, W.L. Smectite clays in red beds as a source of base metals. In Geological Society America Abstracts Programs; Geological Society America: Boulder, CO, USA, 1991; pp. 31–32. [Google Scholar]
  37. Tooms, J.S. Review of Knowledge of Metalliferous Brines and Related Deposits; Institution of Mining & Metallurgy: London, UK, 1970. [Google Scholar]
  38. Piestrzyński, A.; Pieczonka, J.; Głuszek, A. Redbed-type gold mineralisation, Kupferschiefer, south-west Poland. Min. Dep. 2002, 37, 512–528. [Google Scholar] [CrossRef]
  39. Eldridge, C.S.; Barton, P.; Ohmoto, H. Mineral textures and their bearing on formation of Kuroko orebodies. In The Kuroko and Related Volcanogenic Massive Sulfide Deposits; Economic Geology Monograph; Economic Geology Publishing Co.: Littleton, CO, USA, 1983; pp. 241–281. [Google Scholar]
  40. Cox, P.; Lindsey, D.A.; Singer, D.A.; Diggles, M.F. Sediment-Hosted Copper Deposits of the World: Deposit Models and Database. US Geol. Surv. Open-File Rep. 2003, 3, 50. [Google Scholar]
  41. Cathles, L.M. Changes in sub-water table fluid flow at the end of the Proterozoic and its implications for gas pulsars and MVT lead–zinc deposits. Geofluids 2007, 7, 209–226. [Google Scholar] [CrossRef]
  42. Sverjensky, D.A. The origin of a mississippi valley-type deposit in the Viburnum Trend, Southeast Missouri. Econ. Geol. 1981, 76, 1848–1872. [Google Scholar] [CrossRef]
  43. Hagni, R.D. Tri-State Ore Deposits: The Character of Their Host Rocks and Theis Genesis. In Cu, Zn, Pb and Ag Deposits; en Wolf, K.H., Ed.; Elsevier: Amsterdam, The Netherlands, 1976; Volume 6. [Google Scholar]
  44. Cathles, L.M. A Discussion of Flow Mechanisms Responsible for Alteration and Mineralization in the Cambrian Aquifers of the Ouachita-Arkoma Basin-Ozark System: Chapter 8: Diagenesis and Basin Hydrodynamics; American Association of Petroleum Geologists: Tulsa, OK, USA, 1993. [Google Scholar]
  45. Cathles, L.M.; Smith, A.T. Thermal constraints on the formation of mississippi valley-type lead-zinc deposits and their implications for episodic basin dewatering and deposit genesis. Econ. Geol. 1983, 78, 983–1002. [Google Scholar] [CrossRef]
  46. Cathles, L.M. A simple analytical method for calculating temperature perturbations in a basin caused by the flow of water through thin, shallow-dipping aquifers. Appl. Geochem. 1987, 2, 649–655. [Google Scholar] [CrossRef]
  47. Powley, D.E. Subsurface Fluid Compartments. In Gas Research Institute Deep Gas Sands Workshop; Gas Research Institute: Chicago, IL, USA, 1987. [Google Scholar]
  48. Ortoleva, P.J. Basin Compartments and Seals; Memoir 61; American Association of Petroleum Geologists: Tulsa, OK, USA, 1994; p. 477. [Google Scholar]
  49. Al-Shaieb, Z.; Puckette, J.O.; Abdalla, A.A.; Ely, P.B. Megacompartment Complex in the Anadarko Basin: A Completely Sealed Overpressured Phenomenon. In Basin Compartments and Seals; Orteleva, P.J., Ed.; American Association of Petroleum Geologists: Tulsa, OK, USA, 1994; pp. 55–68. [Google Scholar]
  50. Schowalter, T.T. Mechanics of Secondary Hydrocarbon Migration and Entrapment. AAPG Bull. 1979, 63, 723–760. [Google Scholar]
  51. Bradley, J.S.; Powley, D.E. Pressure Compartments in Sedimentary Basins: A Review. In Basin Compartments and Seals; Orteleva, P.J., Ed.; American Association of Petroleum Geologists: Tulsa, OK, USA, 1994; pp. 3–26. [Google Scholar]
  52. Shosa, J.D.; Cathles, L.M. Experimental investigation of capillary blockage of two phase flow in layered porous media. Pet. Syst. Deep-Water Basins Glob. Gulf Mexico Exp. Houston Texas GCSSEPM GCS 2001, 21, 725–739. [Google Scholar]
  53. Law, B.E. Basin-Centered Gas Systems. AAPG Bull. 2002, 86, 1891–1919. [Google Scholar]
  54. Ryder, R.T.; Zagorski, W.A. Nature, origin, and production characteristics of the Lower Silurian regional oil and gas accumulation, central Appalachian basin, United States. AAPG Bull. 2003, 87, 847–872. [Google Scholar] [CrossRef]
  55. Masters, J.A. Lower Cretaceous Oil and Gas in Western Canada. Elmworth: Case Study of a Deep Basin Gas Field; AAPG Memoir 38; American Association of Petroleum Geologists: Tulsa, OK, USA, 1984; pp. 1–33. [Google Scholar]
  56. Engelder, T.; Cathles, M.L.; Bryndzia, T.L. The fate of residual treatment water in gas shale. J. Unconv. Oil Gas Resour. 2014, 7, 33–48. [Google Scholar] [CrossRef]
  57. Revil, A.; Cathles, L.M. The porosity-depth pattern defined by 40 wells in Eugene Island South Addition, Block 330 Area, and its relation to pore pressure, fluid leakage, and seal migration. Pet. Syst. Deep-Water Basins Glob. Gulf Mexico Exp. Houston Texas GCSSEPM GCS 2001, 21, 687–712. [Google Scholar]
  58. Goldhaber, M.B.; Church, S.E.; Doe, B.R.; Aleinikoff, J.N.; Podosek, F.A.; Brannon, J.C.; Mosier, E.L.; Taylor, C.D.; Gent, C.A. Lead and sulfur isotope investigation of Paleozoic sedimentary rocks from the southern Midcontinent of the United States; implications for paleohydrology and ore genesis of the Southeast Missouri lead belts. Econ. Geol. 1995, 90, 1875–1910. [Google Scholar] [CrossRef]
  59. Rowan, E.L.; Goldhaber, M.B. Duration of mineralization and fluid-flow history of the Upper Mississippi Valley zinc-lead district. Geology 1995, 23, 609–612. [Google Scholar] [CrossRef]
  60. Cook, T.D.; Bally, A.W. (Eds.) Stratigraphic Atlas of North and Central America [cartographic Material]; Princeton University Press: Princeton, NJ, USA, 1975; p. 271. [Google Scholar]
  61. Lu, G.; Marshak, S.; Kent, D.V. Characteristics of magnetic carriers responsible for Late Paleozoic remagnetization in carbonate strata of the mid-continent, U.S.A. Earth Planet. Sci. Lett. 1990, 99, 351–361. [Google Scholar]
  62. Voo, R.V.D.; Torsvik, T.H. The history of remagnetization of sedimentary rocks: Deceptions, developments and discoveries. Geol. Soc. Lond. Spec. Publ. 2012, 371, 23–53. [Google Scholar]
  63. Oliver, J. Fluids expelled tectonically from orogenic belts: Their role in hydrocarbon migration and other geologic phenomena. Geology 1986, 14, 99–102. [Google Scholar] [CrossRef]
  64. McCabe, C.; Elmore, R.D. The occurrence and origin of Late Paleozoic remagnetization in the sedimentary rocks of North America. Rev. Geophys. 1989, 27, 471–494. [Google Scholar] [CrossRef]
  65. Erendi, A.; Cathles, L.M. Gas capillary inhibition to oil production. Pet. Syst. Deep-Water Basins Glob. Gulf Mexico Exp. Houston Texas GCSSEPM GCS 2001, 21, 607–618. [Google Scholar]
  66. Jakubov, A.A.; Ali-Zade, A.A.; Zeinalov, M.M. Mud Volcanoes of the Azerbaijan SSR. Atlas; The Academy of Sciences of the Azerbaijan SSR: Baku, Azerbaijan, 1971. [Google Scholar]
  67. Smith, J.T.; Ehrenberg, S.N. Correlation of carbon dioxide abundance with temperature in clastic hydrocarbon reservoirs: Relationship to inorganic chemical equilibrium. Mar. Pet. Geol. 1989, 6, 129–135. [Google Scholar] [CrossRef]
  68. Cathles, L.M.; Schoell, M. Modeling CO2 generation, migration, and titration in sedimentary basins. Geofluids 2007, 7, 441–450. [Google Scholar] [CrossRef]
  69. Prinzhofer, A.; Cathles, L.M. Explaining the pulsating emission of H2 from a sedimentary basin in Brazil. Geosciences. (in preparation).
  70. Sicking, C.; Malin, P. Permeability structure mapping using fracture seismics. Geosciences 2019, 9, 34. [Google Scholar]
  71. Leach, D.L.; Bradley, D.; Lewchuk, M.T.; Symons, D.T.; Marsily, G.; Brannon, J. Mississippi Valley-type lead–zinc deposits through geological time: implications from recent age-dating research. Miner. Depos. 2001, 36, 711–740. [Google Scholar] [CrossRef]
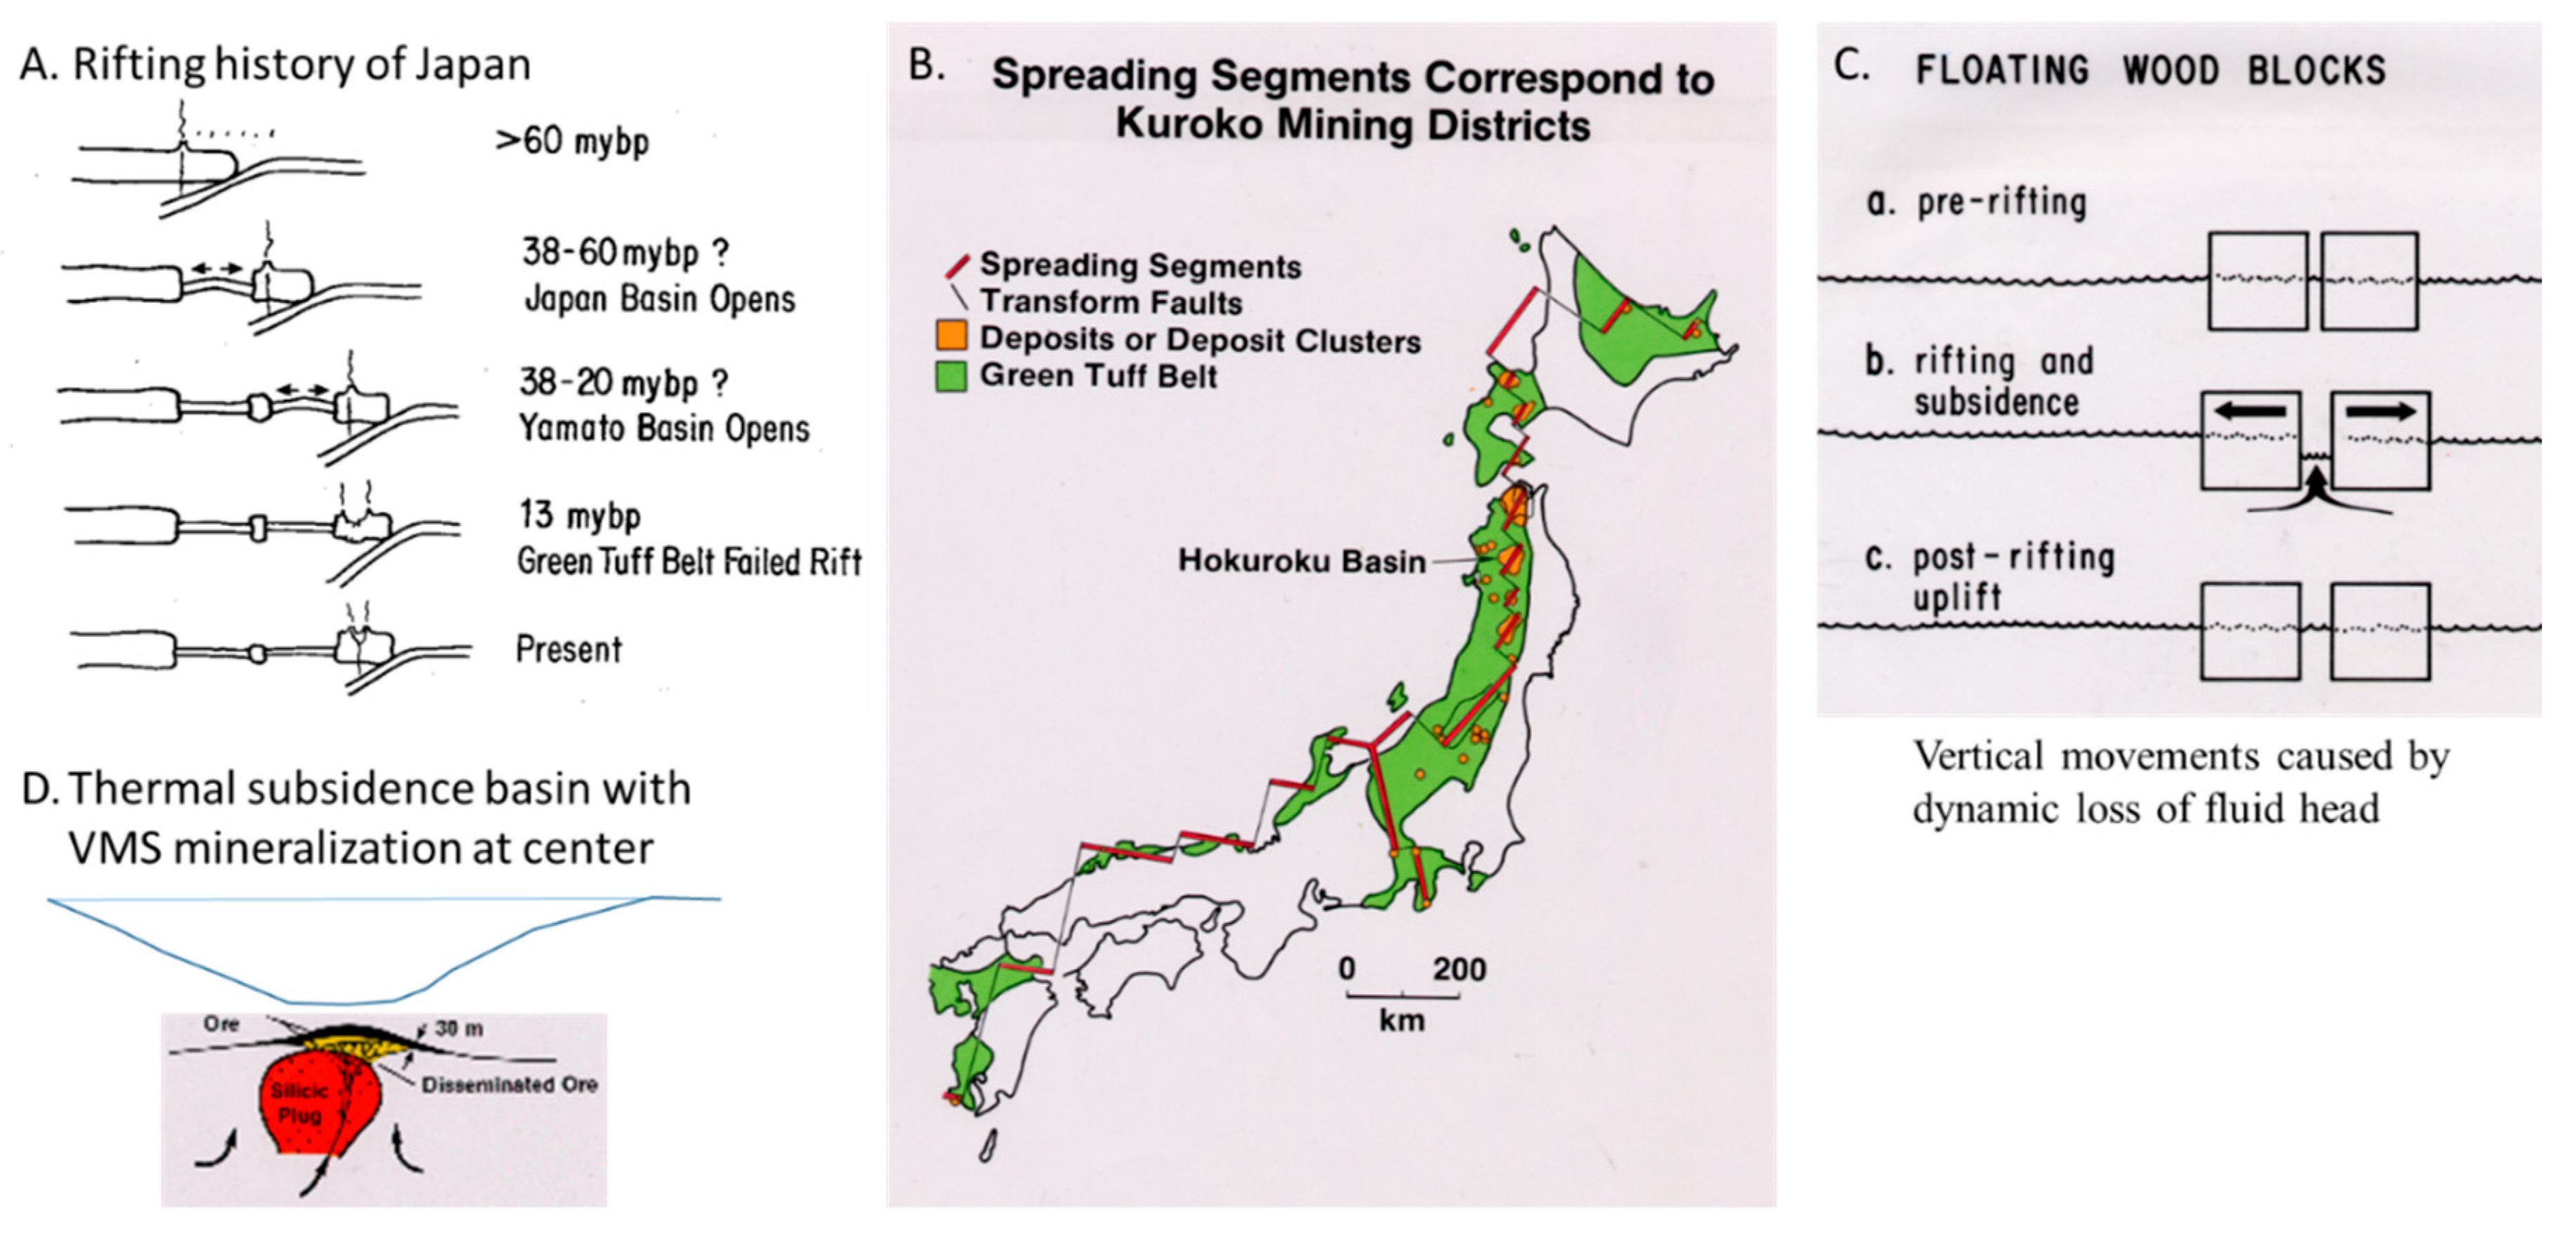
Figure 1. Formation of Kuroko-type volcanogenic massive sulfide (VMS) deposits in failed rifts, an example from Japan. (A) The rifting history of Japan. (B) The pattern of districts in Japan superimposed on hypothetical rift segments. (C) A floating wood block illustration of how dynamic loss of asthenosphere head can explain the inferred vertical movements associated with VMS formation. (D) VMS deposits may lie beneath rift basin centers. Figure panels A–C are from [2].
Geosciences 09 00520 g001
Figure 2. Shales have the permeability needed for pore fluids to escape as compaction occurs. The horizontal hachure shows the measured permeability of shale as a function of porosity. The red curve shows the permeability required for pore fluids to escape under overpressured conditions, and that the required permeability depends only very weakly on the sedimentation rate (scale at end shows how the curve would shift if the sedimentation rate was 2 km/ma or 0.5 km/ma instead of 1 km/ma). Sandstone permeability is from [7,8], shale permeability is from [9]. Figure is from [6].
Geosciences 09 00520 g002
Figure 3. Systematic changes in the n-alkane chemistry of 138 oils from N to S across a 202 km (N-S) by 125 km (E–W) transect in the offshore Louisiana Gulf of Mexico. (A) The transect is red rectangle in the insert. Below the insert the sample locations are shown on the left, and the percent n-alkane depletion on the right. (B) Illustration of how the n-alkane depletion is calculated (purple area) with reference to the un-washed n-alkane distribution (bounding straight line melding onto the measured n-alkane mole fractions indicted by red squares). The illustration is for Tiger Shoals. Figure simplified from [18].
Geosciences 09 00520 g003
Figure 4. Key aspects of the Kupferschiefer mineralization in Poland. (A) Pyrite in the Kupfereschiefer is replaced first by Zn, then Pb, then increasingly copper rich sulfides and finally flushed completely of metals (Rote Fäule). (B) The metallization and Cu enrichment and depletion is zoned around sites of more intense brine discharge near the Fore-Sudetic Block (red outline in D). Figure from [34]. (C) The Zechstein (blue cross hatched) and its basal Kupferschifer shale are underlain by the Rotliegend sediments (orange), Carboniferous sediments (blue), and Variscan (light brown), Caledonian (red), and pre-Cambrian (pink) basement rocks. Section from [28]. (D) Copper surface density determined by 774 drill holes through the Kupferschiefer [34]. Red outlines the Fore-Sudetic Block. The Lubin, Polkowice-Sieroszosice and Rudna mines are all adjacent to this block at the location marked by the black crossed rock picks.
Geosciences 09 00520 g004
Figure 5. (A) Mississippi Valley-Type (MVT) lead-zinc deposits formed at shallow depths and temperatures >80 °C. From [45]. (B) To warm the near-surface significantly requires a million years of compactive expulsion to occur in <10 years. (C) Cross basin hydrologic flow warms the discharge margin but also cools the basin. Temperatures at 1 km depth can be raised only to half the maximum in the basin. From [46].
Geosciences 09 00520 g005
Figure 6. (A) Buried bottle illustration of basin pressure compartmentation from Powley’s 1987 address to the Gas Research Institute (GRI) [47]. (B) Overpressure in the Anadarko Basin (gray) from [49]. (C) Top of overpressure (12 pound per gallon mudweight) from 2131 wells in the GRI Corridor. Deepest portion of the surface lies about 3.8 km under central Louisiana. (D) topographic highs in the top of overpressure tend to underlie oil reservoirs. For relation in full Corridor see [12].
Geosciences 09 00520 g006
Figure 7. Pressure changes as CO2-laden water is driven across a sand-packed tube with 5 fine-sand barriers as pressure is reduced. Until the pressure is reduced to the point that CO2 exsolves, the pressure difference between in inlet and outlet is small and predicted by the darcy flow equation. After CO2 exsolves, the flow of both gas and water stops despite a 163 psi pressure drop. The fine-sand barriers are illustrated in the insert, as is the nature of the sealing (red gas bubbles blocking flow into all the pores of the fine-grained layer). Figure modified from [52].
Geosciences 09 00520 g007
Figure 8. Observed (black points) and modeled (yellow band) porosity-depth profile from Gulf of Mexico. Profile records initiation and migration of a seal. Figure from [57].
Geosciences 09 00520 g008
Figure 9. Illustration of Shosa seal operating as a pressure release valve. (Top) The capillary-blocked pressure drop across the 3-parting seal is 22.5 bars. (Middle) If gas were to penetrate the seal, as shown in the second panel, resistance to flow would be only the permeability of the partings. An expulsion Darcy flux of 10 m y−1 would produce a pressure drop across all three partings of less than 0.2 bars. Gas in the compartment could be expelled rapidly and completely. (Bottom) Once pressure in the compartment had been dissipated, water would be imbibed into the seal strata until the seal was restored, as shown in the bottom panel. Pressure in the compartment might then build up again if gas generation continued, until a second rupture and discharge occurred. Figure modified from [41].
Geosciences 09 00520 g009
Figure 10. Periodic massive expulsion of gas from the Arkoma into the Lamotte and karstic Cambrian carbonates could displace sufficient volumes of brine rapidly enough to form the MVT deposits found in the North American interior (grey stippled areas). Brine flow from the Arkoma is suggested by the pattern of hematite reduction in the Lamotte, and the pattern of F carried north from the Hicks Dome and associated intrusions. Figure from [41] is a composite of figures from [58,59,60].
Geosciences 09 00520 g010
Figure 11. Mud volcanoes result when hydrocarbons are generated in un-indurated sediments. Mud Volcanoes of the Azerbaijan Atlas [66].
Geosciences 09 00520 g011
Figure 12. (A) Log partial pressure of CO2 in equilibrium with aluminosilicates and various carbonate minerals. From [67]. (B) Whether basin reservoirs can contain almost no, a few percent, or nearly 100% CO2 depends on whether the sediments along the pathways between the CO2 source at >330 C and the reservoir contain Ca aluminosilicates (almost no CO2 at location A), just Fe or Mg aluminosilicates (a few percent CO2 at location), or no aluminosilicates (~100% CO2 at location C). From [68]. (C) shows how the titration process has been implemented in basin models. From [68].
Geosciences 09 00520 g012
Table 1. Integration of metal surface densities in Metallogenic Atlas of Poland [34]. The first column indicates the metal surface density interval in the Atlas maps, and the second the log average metal content added by the interval, as discussed in the text. The next 3 columns show the area covered by each surface density interval, and the last 3 columns the additional metal introduced in each surface density interval, (e.g., the metallization) in millions of tons of Cu, Pb, and Zn. The 7th and 8th rows (labeled Sum and Brine in columns 1 and 2) show the total Cu, Pb, and Zn introduced in the area covered by the map, and the ppm that must have been extracted from a brine volume of 200,000 km3 to account for the introduced metals. The last 3 rows show metal concentrations observed in oil field brines.
Surface Density IntervalLog Average Metal AddedACuAPbAznMCuMPbMZn
(kg m−2)1000 km2106 tons
1 to 52.2460.070.0162.0134157363
5 to 104.8332.042.982.4155207398
10 to 5013.0520.027.058.0261352757
50 to 10039.043.35.40.11292115
100 to 500121.231.214500
Sum116.5145.3302.58249271523
Brine (km3)200,000ppm4.14.67.6
Rotliegende [35], ppm15050
Akkrum field [36], ppm<0.55060
Chelekin, 50–80 °C, [37], ppm0.9 to 15