Abstract
Water weakening is a phenomenon that is observed in high porosity chalk formations. The rock interacts with ions in injected water and additional deformation occurs. This important effect needs to be taken into account when modelling the water flooding of these reservoirs. The models used on field scale are simple and only model the effect as a change in water saturation. In this paper, we argue that the water weakening effect can to a large extend be understood as a combination of changes in water activity, surface charge and chemical dissolution. We apply the de Waal model to analyse compaction experiments, and to extract the additional deformation induced by the chemical interaction between the injected water and the rock. The chemical changes are studied on a field scale using potential flow models. On a field scale, we show that the dissolution/precipitation mechanisms studied in the lab will propagate at a much lower speed and mainly affect compaction near the well region and close to the temperature front. Changes in surface charge travel much faster in the reservoir and might be an important contributor to the observed water weakening effect. We also discuss how mineralogical variations impacts compaction.
1. Introduction
Many of the chalk formations in the North Sea contains large volumes of oil. In some areas, the porosity is higher than 45% [1,2]. During production, the reservoir pressure is decreased, the effective stress is increased and the reservoir subsequently compacts. Compaction is a significant driver for oil expulsion, and, as an example, for the Valhall field in the North Sea, the compaction is estimated to contribute to 50% of the total recovery [2]. For the Ekofisk field, reservoir compaction has led to seabed subsidence of approximately 9 m, where about 50% of the 9 m is due to pore pressure decline, and about 50% is due to the injected water [3]. The difference between physical and physicochemical effects is important to include when simulating the reservoir oil production and compaction.
In field-scale simulations of water-induced compaction in chalk, one uses the water saturation as an indicator of enhanced compaction [4]. In this paper, we argue that the water weakening effect is more related to changes in the water chemistry than changes in the water saturation, meaning that it is the changes in the concentration of specific ions that induce enhanced compaction, not only the ratio between oil and water. It is important to include a mechanistic understanding of fundamental processes of deformation, to model fluid flow and compaction in basins or reservoirs over observable timescales. Incorporating these insights on water weakening will produce reliable and more applicable basin models. In the next sections, we will review some of the relevant core experiments, and interpret them by simple models. Thereafter we discuss how these changes may propagate on the field scale, by the use of streamline models. The practical consequence of this is that one can, to some extent, control the fluid chemistry inside the pores, control compaction and thereby impact the oil recovery. Finally, we present discussions, summary and recommendations for the future.
2. Interpreting Triaxial Core Deformation Experiments in Terms of the de Waal Model
Hydrostatic tests are usually performed in triaxial cells, where the axial (length of the core) and, to some degree, the radial strain can be monitored during the experiment. Fluids are continuously passed through the cores, of approximately 7 cm in length, allowing for measurement of permeability and effluent fluid sampling. Back-pressure is applied to maintain a uniform pore pressure as the core compacts, and to avoid fluids boiling at elevated temperatures. A pressure difference of a few kPa is enough to drive fluids through the sample. Thus, the stress–strain development is mainly dictated by the microstructural properties of the solid (matrix) framework.
Usually, the triaxial test data are reported for two stages of testing: i) The hydrostatic loading stage, where the confining pressure and pore pressure are increased linearly, and the axial strain is measured as the axial stress is increased until the core has passed its yield point. ii) The creep stage, during which the core subsequently deforms slowly under a small constant load [5]. The yield point can be considered a measure of the “strength” or “compaction strength” of the core, while the time-dependent creep that occurs after the yield point has been exceeded might be considered as a kind of “viscosity”.
Figure 1 shows an example where a chalk core from the Aalborg outcrop was heated to 130 °C, loaded up to 12 MPa, and then left to creep for 61 days at a constant stress of 12 MPa, while a solution of 0.657M NaCl was passed through at a flooding rate of 1PV (Pore Volume) per day [6]. As can be seen from Figure 1a, the axial strain is proportional to the axial stress (e.g., the core deformation is elastic) up to the yield point at ~8.2 MPa (the solid black line). The yield point is not a single point, but rather a zone of transition between 7.5 and 8.5 MPa that separates the elastic and plastic (black dotted line) phases of deformation. The elastic bulk modulus is defined as the ratio of the change in axial stress to the change in volumetric strain up to the yield point [7] (the slope of the solid line in Figure 1a divided by 3). The plastic bulk modulus is defined as the ratio of the change in axial stress to the change in volumetric strain in the phase after the core has reached the yield point (the slope of the dashed line in Figure 1a divided by 3). Assuming that the material compresses equally in all directions, the axial strain can be converted to volumetric strain by multiplying by factor of 3, and the effective viscosity can be defined as the ratio between the axial stress and axial strain rate ) [7]. The effective viscosity increases strongly with time in a creep experiment and as the stress is kept constant, the strain rate is reduced.
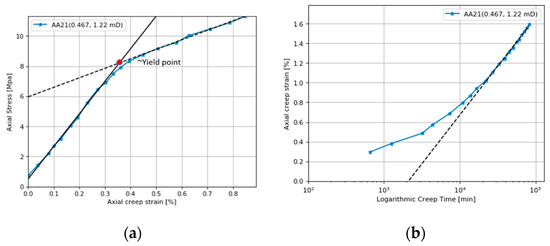
Figure 1.
(a) Hydrostatic loading stage. The elastic bulk modulus is 720 MPa (slope of solid line divided by 3). The plastic bulk modulus is 210 MPa (slope of the dashed line divided by 3). (b) The creep stage deformation. The core is left to deform at a constant stress 12 MPa. The dashed line is the de Waal model (text equation 1) with parameters = 0.012%/hour and = 0.43%. Data are from [6].
Numerous rock mechanical laboratory experiments have been carried out with a large degree of reproducibility between experiments. These experiments can be understood with reference to the grain contact model suggested by de Waal [8]. Here we describe the de Waal model and show how it provides a good basis for understanding experiments involving rock–fluid interactions and the various chemical factors that affect reservoir compaction. During the creep stage, compaction usually follows a log t trend as shown in Figure 1b. The following creep model captures this trend [8]:
is a constant related to the friction between the grains, and is the initial strain rate, which can be seen by differentiating the above equation with respect to t:
The model suggested by de Waal was derived from the basis of earlier work by [9] where it was shown that the friction coefficient between two blocks of rock, μ, depends on the time, t. The blocks were in stationary contact before sliding was initiated, and the friction coefficient was found to follow the empirical law:
where and are constants, and the friction coefficient at t = 0. In [9,10] experiments were conducted over a time frame of one day, where the materials were kept in contact at a constant normal and shear stress for time t. When the static contact time was reached, the shear stress was rapidly raised to the level required to produce a slip. The reason for the dependence of friction on the stationary contact time is that the contact area between the surfaces increases as the static contact time increases [9].
De Waal argued that Equation (3) can be used to understand creep [8] if t in the equation is replaced with a time constant that describes the average lifetime of grain–grain contact, and this contact time is related to the inverse strain rate. The physical explanation for the macroscopic time-dependent creep of rocks is thus, according to de Waal, that the average lifetime of contact points affects the real contact area which determines the sliding friction.
Westwood, Goldheim et al. [11] and Macmillan, Huntington et al. [12] extended Dieterich’s [10] perspective by pointing out that the friction coefficient is also dependent on the fluid chemistry. Based on the experiments conducted, they argued that ion interactions modify the surface microhardness, and that it is greatest when the zeta potential is close to zero for, in this case, MgO. This implies that the friction is at its lowest level when the zeta potential is close to zero because grain contact is minimized by the hardness. A low value of the zeta potential should thus increase the strain rate. Westbrook and Jorgensen [13] also pointed out that water adsorption from the air affected the time dependence of microhardness observed in nonmetallic materials. They found up to a 10% decrease in the microhardness of wet calcite compared to dry, depending on the crystal plane.
The de Waal model has also been used to capture the dependence of creep strain rate on loading rate. The loading rate is known to affect the strain rate in the laboratory [14], and the laboratory strain rate is usually much larger than the strain rate in a reservoir where the loading results from the slow drawdown of fluid pressure by petroleum and water extraction. The challenge is to translate the higher strain rates observed in the laboratory to the lower field strain rates. Andersen, Foged et al. [14] extended the de Waal model from constant stress rate to constant strain rate and showed how to apply it to North Sea chalk. They found that the de Waal friction factor for the Valhall field was more or less constant over the stress range of interest, which reduced the number of tests required to estimate compaction at field depletion rates.
3. Water Activity Weakens Chalk in Loading Phase
If the friction coefficient, thus the strain rate, is dependent on the fluid chemistry, it follows that the mechanical properties of chalk also depend on the pore fluid [15,16,17]. The physical mechanism for water weakening has been attributed to capillary forces and differences in “wettability” between fluids [16,17], but for later publications [18], at least in part, water weakening was explained by the relations between physical and chemical properties of the chalk.
Risnes [19] found that the hydrostatic yield point of chalk (the full elastic deformation) increased by 50%, 70%, and 80% if, instead of water, the pore fluid was switched to methanol, oil and glycol, or air, respectively. The hydrostatic yield point was estimated to be 18 MPa for glycol and 10 MPa for water. These results have been confirmed by [20,21], where the chalk was saturated with supercritical CO2, and by experiments where the activity of water was changed systematically by changing the fraction of glycol mixed into water [20]. Chalk strength increases as the activity of water is decreased.
A completely different approach by Røyne et al. [22] gives further insight into the water weakening effects. They used a double torsion method, wherein a calcite crystal with an initial crack is immersed in a fluid. The crack is extended by bending the calcite, and the crack velocity is measured. The crack velocity is considered to be a measure of surface energy, where a lower surface energy produces a greater crack velocity. By immersing the sample in a mixture of glycol and water, the surface energy of calcite was determined for different water activities. Assuming that the hydrostatic yield point is related to pore collapse and bond breaking between the individual grains in the sample, a lower surface energy should mean a weaker chalk and a lower yield point. In the Røyne et al. [22] experiment, the surface energy was 0.32 J/m2 for glycol and 0.15 J/m2 for water. This factor of ~2 reduction is very close to the factor of 1.8 reduction determined by Risnes [20]. The activity of water can also be changed by changing the concentration of salts. Risnes et al. [23] were able to reduce the activity of water to 0.48 by the adding of CaCl2. Figure 2 plots against the activity of water, the surface energy of calcite immersed in fluids with different water activity normalized to the surface energy of calcite immersed in pure water, or the yield point of cores saturated with fluids with different water activities normalized to their yield point when saturated with pure water (activity = 1). It shows that the decrease in chalk strength with water activity is similar, regardless of how the activity of water is modified. The figure shows that not only does the yield point change by similar amounts with changes in water activity for all the experiments, but also the trend of the change with water activity is similar. Water weakens chalk, and the activity of water is a measure of the amount of weakening.
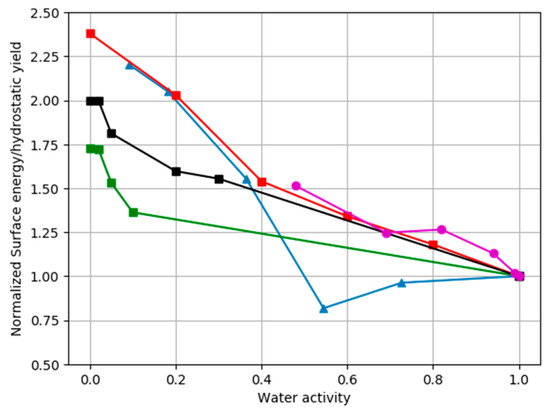
Figure 2.
The normalized surface energy of calcite immersed in fluids with different water activity, or the normalized hydrostatic yield point of cores saturated with fluids with different water activity, are plotted against water activity. Normalization is achieved by dividing by the yield point or surface energy measured when the pore or emersion fluid is pure water. Blue triangular points show changes in calcite surface energy from [22]. Green, black and red square points show core tests where water activity was changed by mixing water and glycol [20]. Purple points show the changes in normalized yield point when the activity of water is modified by additions of CaCl2 [23]. Experimental uncertainties are not included in the figure.
4. Water Surface Chemistry Affects Chalk Deformation and Creep
However, chalk strength depends on water chemistry as well as water activity. When comparing chalk deformed at 130 °C with seawater as the pore fluid, to chalk deformed at 130 °C with seawater without sulphate as the pore fluid, the yield point is 74% lower. The total dissolved solids concentration was kept constant by adding NaCl [24,25]. The activity of water, for a brine is [26]
where is the molality of other ions in the solution. For seawater the water activity is ~0.98; thus, the activity of water is not a factor in this comparison. Sulphate ions weaken chalk and Figure 3 shows how sulphate lowers the yield point. Notice that although the yield point is dramatically lowered (the elastic bulk modulus is strongly decreased) by the presence of sulphate, the plastic bulk modulus (the slope of the dashed lines) is not changed.
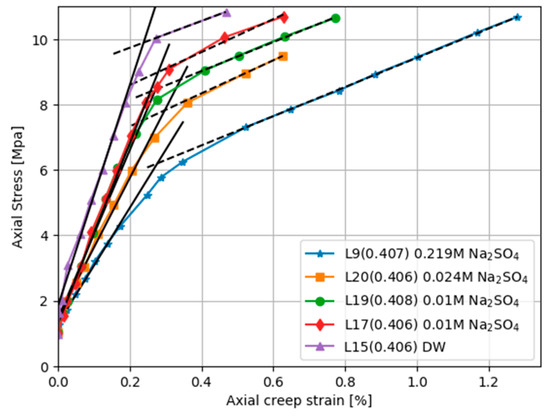
Figure 3.
Loading stage deformation for Liège cores saturated with different fluids and tested at 130 °C. NaSO4 concentration is varied while the amount of NaCl is adjusted to keep the ionic strength constant at 0.657 M. Pore fluids for the distilled water (DW) curve contain neither NaSO4 nor NaCl. The yield point is depressed and the elastic bulk modulus decreased by sulphate (solid lines), but the creep deformation and plastic bulk modulus are not affected by sulphate.
Megawati et al. [27] hypothesized that the electrostatic interactions that give rise to an osmotic pressure (disjoining pressure) near the grain contacts could explain the enhanced weakening. Sulphate adsorbed onto the calcite grains changes the surface and zeta potentials. The surface becomes more negatively charged. The variations in hydrostatic yield for all the chalk samples was proportional to the maximum peak of the disjoining pressure. Nermoen et al. [28] performed additional experiments and suggest the electrochemical interactions that give rise to the disjoining pressure can be incorporated into an effective stress equation.
Sulphate in the brine also affects the creep rate [27]. Cores from different outcrops, which have different mineralogical compositions, have a very similar creep rate and creep rate development when the brine contains sulphate. This is in contrast to cores from the same outcrops flooded with NaCl (inert) brine, which shows greater variance in the strain rate development. This might be an indication that the grain-to-grain friction between the calcite grains is to some extend controlled by the diffusive layer counter ions, and not only the local mineralogical properties of the grains. If sulphate is introduced after the loading phase, i.e., in the creep phase, there is a sudden increase in the creep rate [29]. This effect is transient, and when the pore surfaces of the calcite grains are saturated with sulphate, the creep rate is reduced.
5. Core Deformation Related to Mineral Alteration
Additional core deformation can be the result during the creep stage when the fluid passed through the deforming cores is out of equilibrium with the minerals in the core. Figure 4 and Figure 5 compare the axial creep strain for two sets of experiments. In one set, a wide range of chalk cores was flooded with inert (e.g., nonreactive) NaCl brine. In the second set, cores from the same outcrops are flooded with reactive MgCl2. In both sets of experiments, the temperature is 130 °C. The axial creep for all the cores flooded with MgCl2 is greater than those flooded with inert NaCl, and is commonly more than three times greater. The chalk cores with few impurities (>99.7% calcite, the Stevns Klint and Mons (Trivières Fm)) flooded with MgCl2 show a temporary plateau in creep strain, see Figure 5. The chalk cores with lower carbonate content (the Aalborg, Liège, and Kansas) show no such plateau.
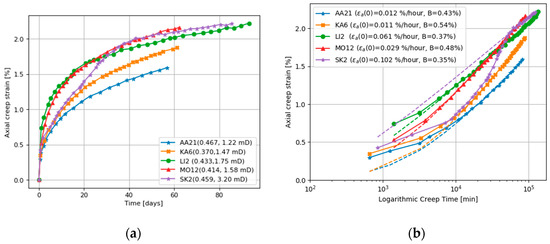
Figure 4.
(a) Axial creep for cores flooded at 130 °C with nonreactive NaCl, and (b) a corresponding fit to de Waal model. AA=Aalborg, KA=Kansas, LI=Liège, MO=Mons, SK=Stevns Klint. The numbers in the parenthesis gives the porosity and permeability. All data from [6].
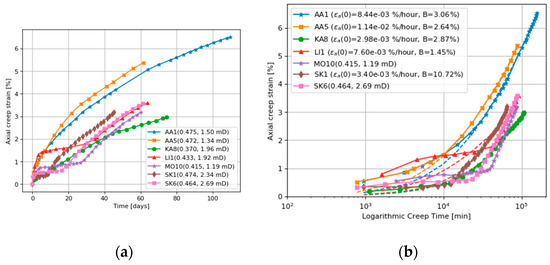
Figure 5.
(a) Axial creep for cores flooded at 130 °C with MgCl2, the numbers in the parenthesis gives the porosity and permeability, and (b) corresponding fit to de Waal model and model parameters in the parenthesis. AA=Aalborg, KA=Kansas, LI=Liège, MO=Mons, SK=Stevns Klint. All data from [6].
The creep strains experienced by all the cores under NaCl flooding are well described by the de Waal model (Equation (1)), as shown in Figure 4b. The de Waal model does not match well with the cores flooded with MgCl2 brine, as seen in Figure 5b. We can now use the de Waal model to estimate the additional strain induced by the chemical reactions. If we simply subtract the “expected” creep from the cores flooded by MgCl2, by using the results in Figure 4, Figure 6 shows the excess creep strain that results when the cores are flooded with MgCl2. The excess creep strain takes a while to develop for some cores (the plateau mentioned above), but once established the excess strain rate is linear and ~0.04%/day in magnitude.
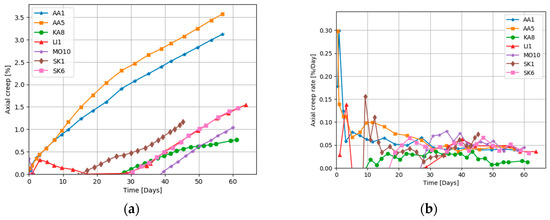
Figure 6.
(a) Excess axial creep measured in cores flooded with reactive MgCl2 obtained by subtracting the de Waal deformation for the NaCl flooding, and (b) the creep rate.
Post-experimental investigations by scanning electron microscopy (SEM) show mineralogical alterations already after weeks of flooding. Dissolution of calcite takes place, and is commonly observed together with precipitation of magnesite. For the chemical alteration to be fully appreciated, reactive fluids must be passed through the chalk cores at elevated temperatures for very long periods of time. Figure 7 shows the results when a Liège chalk core was flooded for ~3 years (1072 days). There is a significant flux of Ca2+ out of the core but no flux in, and there is an almost exactly counterbalancing flux of Mg2+ into the core with no Mg2+ flux out. The sum of the Mg2+ in and Ca2+ out always almost exactly matches the injected MgCl2 concentration. This indicates that Ca2+ in the carbonate core is being replaced mole for mole with Mg2+. Mass balance indicates that 93 to 98% of the initial calcite is replaced by magnesite over the course of this experiment [28]. The initial porosity of the core was 41%, and the final porosity 40%. The pore volume is thus conserved and the 10% axial (30% volumetric) strain resulted from the mineralogical alteration of the matrix. Mineralogical alteration can cause substantial compaction. Note that the de Waal model fits the MgCl2 core flooding well in this case (see Figure 7); however, in this case, the flooding rate is changed during the experiment. At ~380 days, the observed creep is deviating from the de Waal model, but at this point, the flooding rate is decreased (less chemical reactions) and the axial creep rate is lowered. After approximately 700 days, the observed creep is below the de Waal model, but at ~800 days, the flooding rate increased and axial deformation is increased. Thus, in this case, the match with the de Waal model is a coincidence, due to changes in the flooding rate.
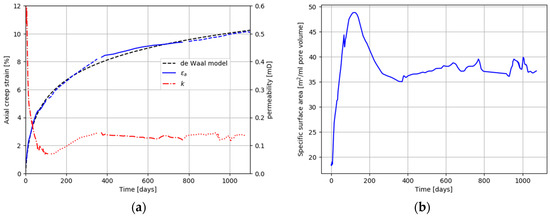
Figure 7.
(a) Axial creep, permeability, and influent and effluent chemistry for a carbonate core flooded at 130 °C for ~3 years with reactive MgCl2. Line style indicates changes in flooding rate from 1 PV/day to 3 PV/day. Solid black line in (b) is the specific surface area development estimated from the experimental permeability and porosity using the Kozeny–Carman equation.
As the porosity did not change in the experiment shown in Figure 7, the dramatic and immediate drop in permeability is unexpected. The drop in permeability is most likely caused by magnesite crystallization in the large, permeable pores (see Figure 8a). In other chalk types, crystallization of magnesium-bearing clay minerals may also reduce permeability (Figure 8b). Minerals crystallized in pores increases the surface area per unit pore volume. Since permeability is directly related to porosity and inversely related to the square of surface area per unit of pore volume and pore tortuosity (c.f., the Carmen-Kozeny equation), an increase in surface area per unit pore volume strongly decreased permeability. The slight recovery in permeability between 200 and 300 days (Figure 6a) could suggest either that precipitated magnesite had subsequently dissolved or that pore throats subsequently opened such that the tortuosity was reduced. Textural changes related to alteration can clearly and dramatically change permeability.
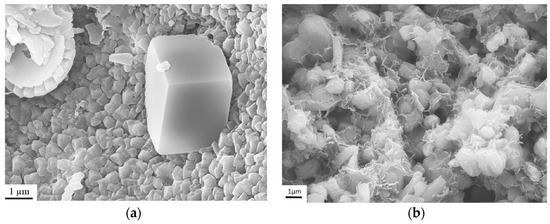
Figure 8.
(a) Newly precipitated magnesite crystals in a large pore (edited from [30]). (b) Magnesium-bearing clay minerals crystallized in Aalborg chalk, which contains large amounts of primary opal-CT, after being flooded with MgCl2.
At the end of the experiment flooding with MgCl2, (as shown in Figure 7) had completely replaced the original calcite with magnesite. After ~800 days, injected Mg2+ was no longer reacting, but passing unchanged in concentration through the core. A similar experiment that was terminated at 516 days flooded a Liège chalk core under Ekofisk field conditions with 0.219 M MgCl2. Mapping by energy dispersive spectroscopy (EDS) by the use of mineral liberation analyzer (MLA) of the core from inlet to outlet after flooding, shows two regimes of mineralogical change. Toward the outlet, the core is only partly altered. The mineralogy is mainly calcite, the primary mineralogy of chalk, but precipitates of clay and magnesite are found within the calcite matrix. At the inlet, a total transformation from calcite to magnesite is observed. Only magnesite and clay are observed, and no calcite is left. For cores flooded for an even longer period, the transition between the two regimes has moved further into the core, indicating that this transformation of mineralogy moves like a front through the cores [30,31].
6. Fluid–Rock Interactions in Reservoirs
The triaxial laboratory tests discussed in Section 5 cannot describe what takes place in a reservoir because they are carried out under isothermal conditions, whereas cold fluids are injected into a reservoir and reactions take place as fluids move through a thermal migration front. Figure 9 illustrates what is observed to happen in a reservoir. It plots the chemistry of fluids produced from a well 300–400 m from the nearest well into which seawater is being injected [32]. Chlorine does not react with the reservoir sediments. Seawater has a much lower chlorinity than Ekofisk formation water, and thus the production of low salinity water indicates the arrival of injected water. Following the changes in chlorinity in Figure 9, we see that during a period of 5–6 years, the chlorine concentration drops to 0.63 mol/L, which is close to the chlorine concentration in seawater of 0.525 mol/L. Thus, the water in the producer after 5–6 years is almost pure seawater.
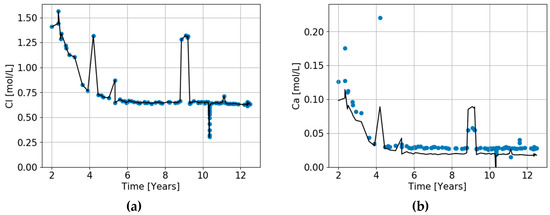
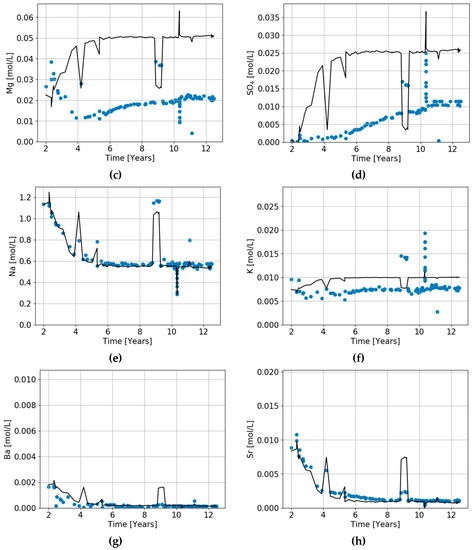
Figure 9.
(a–h) Chemistry of waters produced from an Ekofisk well 400–500 m from the nearest well where seawater is being injected. The chemistry of produced water (points) is compared to the predicted initial ion concentrations (solid lines), assuming that chlorine is a conservative (ideal) tracer for unreacted seawater and that the drop in chloride concentration is solely due to mixing between Ekofisk formation water and seawater. The difference between the lines and points indicates the chemical exchange that has occurred in the reservoir. Note that the Y-axes in the various graphs have different scales.
Using the chlorine concentration as a tracer for seawater, we can predict what the concentration of all the other ions would be if no chemical reactions took place in the reservoir. The solid lines in Figure 9 represents the unreacted concentrations of calcium, magnesium, etc. The difference between the produced water chemistry (points) and these solid lines indicates the chemical exchange between pore waters and the reservoir sediments that has occurred as the injected seawater moved from the injector wells to the production well. It can be seen that a large fraction of Mg and SO4, and a bit of K, have been lost from the fluid, presumably going into dolomite or magnesite, anhydrite, and clay, respectively.
Figure 10 and Figure 11 show models of alteration in a reservoir for a situation similar to that shown in Figure 9. These figures show streamlines between an injection and a production well 500 m away, assuming the reservoir is homogeneous. The streamlines are calculated using potential methods [32,33,34], injection rate is 30 Mbbl/day and production is constant at 5Mbbl/day; the flow is two phases and through a fixed depth interval of 70 m. The modelling methods are described in more detail in [32]. The snapshots after five years of seawater injection in Figure 9 and Figure 10 show that the temperature gradient lags behind the injected waterfront. The lag results from the fact that water only moves in the pore space, whereas the temperature moves in the total volume (matrix and pore space). Due to the temperature dependence of the mineral reaction kinetics, the chemical alteration fronts travel at speeds different form both the water and the temperature fronts. Figure 9 shows the weight fractions of some of the minerals precipitated and dissolved. Much of the magnesium carbonate alteration occurs close to the injector. After 40 years of simulated seawater injection, about 1.5 wt% of calcite is dissolved and 1.5 wt% of dolomite is precipitated near the injection well, and the calcite to magnesium carbonate transition may extends about 400 m from the injection well [32]. The sulphate bearing mineral anhydrite precipitates at high temperatures and dissolves at low temperatures. The simulations predict a sulphate wave that travels at the same speed as the temperature front, where anhydrite is precipitated and dissolved again as the thermal front passes through the reservoir.
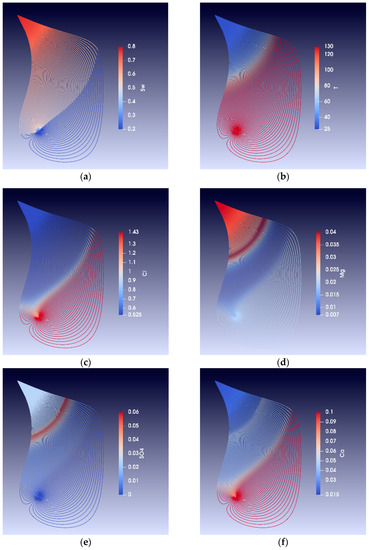
Figure 10.
Streamlines approximately 5 years of seawater injection. (a) Water saturation (Sw), (b) temperature profile, (c) chlorine concentration, (d) magnesium concentration, (e) sulphate concentration, and (f) calcium concentration.
Figure 11.
(a–c) Streamlines showing the weight fraction of alteration minerals in the reservoir at the time of water injection breakthrough (approximately 5 years of seawater injection). The wells are separated by 500 m.
7. Discussion and Summary
Chalk fields in the North Sea are over-pressured and during production and pressure depletion, they compact significantly. The compaction can contribute significantly to hydrocarbon recovery, and for the Valhall field, it is estimated to be responsible for about 50% [2] of the total oil recovery. For the Ekofisk field, the water weakening effect is expected to contribute to about 50% of the total compaction [3]. In the case of the Valhall field, it is believed to be much less than the Ekofisk field [35]. From the results discussed here, this can potentially be explained as a consequence of temperature differences, but another important factor is the pore pressure history. The Ekofisk, at discovery, had an initial reservoir temperature of 130 °C, whereas Valhall had a temperature of 93 °C. Both mineralogical alterations and the effect of surface charge, due to sulphate adsorption, are less significant at lower temperatures.
The field conditions are different, at the field scale the effective stress is changing due to pressure drawdown. As pointed discussed by Andersen, Foged et al. [14], it is possible to extrapolate lab results to field results by performing strain rate controlled tests. The experimental data presented and discussed in this paper have been performed at a constant hydrostatic stress, and not uniaxial constant strain rate. However, by comparing hydrostatic tests with and without chemical effects, we believe that many of our conclusions will still hold.
The effect of water activity is the most uncertain effect. The experiments discussed in Section 3, demonstrates quite nicely the transition between a phase consisting of pure fresh water, a mixture of water and glycol to pure glycol and dry samples. The experiments are also explained as a change in surface energy on the microscopic level. However, oil-bearing formations usually consist of a hydrocarbon phase that is immiscible with water. Water is believed to be trapped in small (water-wet) pores and oil resides in larger pores; over geologic time, oil adheres to the rock and change the wettability. During water flooding, the original formation water (ionic strength ~2–3 times seawater) and hydrocarbons are displaced by seawater. The change of water activity from formation water to seawater is not large. A change from a 3M brine to seawater is a change in water activity from ~0.95 to ~0.98 (see Equation (4)). However, there is likely more to this story because at low water saturations (~1–2%), the water activity is not easy to calculate because it is affected by surface charge, diffusive layers and ion interactions with the chalk surface. If most of the water in this case is bound to the chalk surface, the water activity should be much lower than 0.95 (independent on the salinity). Thus, in areas of very low water saturation, an increase in water saturation could give a sudden increase in the water activity, and weaken the chalk and induce compaction. There are some experimental data, where chalk cores have been aged with oil and water saturations about ~5% [36], in those cases when they are flooded with seawater, the creep rate does not change significantly compared to cores that are 100% water-filled. Thus, if these results are correct, the initial water saturation must be lower than 5% to see an effect of the water activity. From capillary pressure arguments, one would expect to see more compaction in areas high above the free water level, where the water saturation is low. The field data are scarce, but an observation well at the Ekofisk field shows more compaction close to the tight zone, where the water saturation is higher due to smaller pores [3]. This does not support the water activity hypothesis.
We have quantified the chemical effects in the hydrostatic creep experiments by using the de Waal model. Comparing the fitting of the de Waal model to core data, where the chemical effects are minimal and where they are present, we have shown that the effect of magnesium brines can be modelled by a linear term ~Ct. The constant C is about 0.05%/day, as shown in Figure 6.
The simulated calcite to magnesite (or dolomite) alteration in the core experiments is about 0.07 wt% per day. Thus, we find that the alteration corresponds directly to additional creep strain. The streamline simulations in Figure 11 show that close to the well, there is an alteration of 0.5 wt% change after 5 years of flooding; this should then correspond to about 0.5% additional creep (0.5 m of a 100-m reservoir interval). The chemical water weakening effects due to calcium to magnesium carbonate alteration are much smaller, but not insignificant, on the field scale compared to the lab. The main reason for the slow chemical alteration on the field scale is the cooling of the reservoir.
Sulphate, according to [27], adsorbs onto the calcite surface and causes additional elastic deformation of factor of two, compared to NaCl, see Figure 3 (seawater corresponds to 0.024 M Na2SO4). If sulphate is introduced into the core after yield, in the creep phase, the core experience a sudden increase in strain rate [29]. This effect is transient, but the increase in volumetric strain due to sulphate is ~1.5%. The simulations and the field data show that sulphate breaks through to the producer in a reasonably short period of time. The sulphate front is lagging behind the water (chlorine) front, due to both precipitation of calcium sulphate and adsorption onto positively charged calcium cites, and one should therefore expect to see some delayed water weakening effect, i.e., the reservoir compaction should happen after the water front has passed a reservoir section. In the reservoir models, the grid is coarse and thus the simulation models might not be able to distinguish the sulphate front from the water saturation.
8. The Future and Final Remarks
In the future, basin models will simulate the full chemical evolution of the reservoir with all its attendant consequences. The most difficult thing to model is how the rock - fluid interactions affects compaction at the various scales. We need core experiments to test rock deformation at realistic conditions, but the drawback is that it is difficult to tease out the exact mechanisms. The mechanisms are needed in order to get the speed of chemical interactions at a larger scale. Much has been investigated regarding the chemical effects, but perhaps the most uncertain and less studied effect is how the oil saturation affects compaction. There are some results [37] showing that oil-filled cores compact when flooded with water. Later results shows less effects when flooding oil-saturated cores with water [28,36,38]. The water activity is worth pursuing, as it will travel at the speed of the waterfront, but most likely it should only be effective at very low initial water saturation (high capillary pressure).
There is still uncertainty related to the effect of initial mineralogy. Cores with low carbonate have a different strain history, than cores with non-carbonate content (~5 wt%). Impurities in chalk seem to eliminate the delay in alteration-induced creep.
Effects of water chemistry on compaction on the lab scale is important. We strongly believe that reservoir models as used by the industry today are too crude to distinguish the different field scale compaction mechanisms. By extracting streamlines from reservoir simulators and conducting chemical alteration and adsorption calculations similar to those shown here, we can see the possibility of predicting the distribution of the alteration fronts, as well as how far the sulphate adsorption front has travelled. This might provide an idea of where to expect the most compaction, both horizontally and vertically. This, in turn, can be checked against observation wells, and potentially 4D seismic data.
Author Contributions
Writing–original draft, M.W.M. and A.H. All authors have read and agreed to the published version of the manuscript.
Funding
Norges Forskningsråd: 230303.
Acknowledgments
The authors like to thank the group working with water weakening of chalk at University of Stavanger for fruitful discussions. In addition, we are grateful for the input from the editors and reviewers of the journal, and the inputs from Lawrence Cathles. The authors acknowledge the Research Council of Norway and the industry partners, ConocoPhillips Skandinavia AS, Aker BP ASA, Vår Energi AS, Equinor ASA, Neptune Energy Norge AS, Lundin Norway AS, Halliburton AS, Schlumberger Norge AS, and Wintershall DEA, of The National IOR Centre of Norway for support.
Conflicts of Interest
The authors declare no conflict of interest.
References
- Plischke, B. Finite element analysis of compaction and subsidence—Experience gained from several chalk fields. In Rock Mechanics in Petroleum Engineering; Society of Petroleum Engineers: Delft, The Netherlands, 1994; p. 8. [Google Scholar]
- Barkved, O.; Heavey, P.; Kjelstadli, R.; Kleppan, T.; Kristiansen, T.G. Valhall field-still on plateau after 20 years of production. In Offshore Europe; Society of Petroleum Engineers: Aberdeen, UK, 2003. [Google Scholar]
- Doornhof, D.; Kristiansen, T.G.; Nagel, N.B.; Pattillo, P.D.; Sayers, C.J.O.R. Compaction and subsidence. Oilfield Rev. 2006, 18, 50–68. [Google Scholar]
- Sylte, J.E.; Thomas, L.K.; Rhett, D.W.; Bruning, D.D.; Nagel, N.B. Water Induced Compaction in the Ekofisk Field. In Proceedings of the SPE Annual Technical Conference and Exhibition, Houston, TX, USA, 3–6 October 1999; Society of Petroleum Engineers: Houston, TX, USA, 1999; p. 11. [Google Scholar]
- Griggs, D. Creep of Rocks. J. Geol. 1939, 47, 225–251. [Google Scholar] [CrossRef]
- Andersen, P.Ø.; Wang, W.; Madland, M.V.; Zimmermann, U.; Korsnes, R.I.; Bertolino, S.R.A.; Minde, M.; Schulz, B.; Gilbricht, S. Comparative Study of Five Outcrop Chalks Flooded at Reservoir Conditions: Chemo-mechanical Behaviour and Profiles of Compositional Alteration. Transp. Porous Media 2018, 121, 135–181. [Google Scholar] [CrossRef]
- Fjar, E.; Holt, R.M.; Raaen, A.; Risnes, R.; Horsrud, P. Petroleum Related Rock Mechanics; Elsevier: Amsterdam, The Netherlands, 2008. [Google Scholar]
- De Waal, J.A. On the rate type compaction behaviour of sandstone reservoir rock. Ph.D. Thesis, Technische Hogeschool Delft, Delft, The Netherlands, May 1986. [Google Scholar]
- Dieterich, J.H. Time-dependent friction and the mechanics of stick-slip. Pure Appl. Geophys. 1978, 116, 790–806. [Google Scholar] [CrossRef]
- Dieterich, J.H. Time-dependent friction in rocks. J. Geophys. Res. Solid Earth 1972, 77, 3690–3697. [Google Scholar] [CrossRef]
- Westwood, A.R.C.; Goldheim, D.L.; Lye, R.G. Rebinder effects in MgO. Philos. Mag. J. Theor. Exp. Appl. Phys. 1967, 16, 505–519. [Google Scholar] [CrossRef]
- Macmillan, N.H.; Huntington, R.D.; Westwood, A.R.C. Westwood Chemomechanical control of sliding friction behaviour in non-metals. J. Mater. Sci. 1974, 9, 697–706. [Google Scholar] [CrossRef]
- Westbrook, J.; Jorgensen, P. Effects of water desorption on indentation microhardness anisotropy in minerals. Am. Mineral. J. Earth Planet. Mater. 1968, 53, 1899–1909. [Google Scholar]
- Andersen, M.A.; Foged, N.; Pedersen, H.E. The rate-type compaction of a weak North Sea chalk. In Proceedings of the 33th U.S. Symposium on Rock Mechanics (USRMS), Santa Fe, NM, USA, 3–5 June 1992; American Rock Mechanics Association: Balkema, Rotterdam, The Netherlands, 1992; p. 10. [Google Scholar]
- Newman, G.H. The effect of water chemistry on the laboratory compression and permeability characteristics of some North Sea chalks. J. Pet. Technol. 1983, 35, 976–980. [Google Scholar] [CrossRef]
- Homand, S.; Shao, J.F.; Schroeder, C. Plastic Modelling of Compressible Porous Chalk and Effect of Water Injection. In SPE/ISRM Rock Mechanics in Petroleum Engineering; Society of Petroleum Engineers: London, UK, 1998; p. 10. [Google Scholar]
- Homand, S.; Shao, J.F. Mechanical Behaviour of a Porous Chalk and Water/Chalk Interaction. Part I: Experimental Study. Oil Gas Sci. Technol. Rev. IFP 2000, 55, 591–598. [Google Scholar] [CrossRef]
- Homand, S.; Shao, J.F. Mechanical Behaviour of a Porous Chalk and Water/Chalk Interaction. Part II: Numerical Modelling. Oil Gas Sci. Technol. Rev. IFP 2000, 55, 599–609. [Google Scholar] [CrossRef]
- Risnes, R. Deformation and yield in high porosity outcrop chalk. Phys. Chem. Earth A Solid Earth Geod. 2001, 26, 53–57. [Google Scholar] [CrossRef]
- Risnes, R.; Madland, M.; Hole, M.; Kwabiah, N. Water weakening of chalk—Mechanical effects of water–glycol mixtures. J. Pet. Sci. Eng. 2005, 48, 21–36. [Google Scholar] [CrossRef]
- Liteanu, E.; Spiers, C.; de Bresser, J. The influence of water and supercritical CO2 on the failure behavior of chalk. Tectonophysics 2013, 599, 157–169. [Google Scholar] [CrossRef]
- Røyne, A.; Bisschop, J.; Dysthe, D.K. Experimental investigation of surface energy and subcritical crack growth in calcite. J. Geophys. Res. Solid Earth 2011, 116, B4. [Google Scholar] [CrossRef]
- Risnes, R.; Haghighi, H.; Korsnes, R.; Natvik, O. Chalk–fluid interactions with glycol and brines. Tectonophysics 2003, 370, 213–226. [Google Scholar] [CrossRef]
- Heggheim, T.; Madland, M.V.; Risnes, R.; Austad, T. A chemical induced enhanced weakening of chalk by seawater. J. Pet. Sci. Eng. 2005, 46, 171–184. [Google Scholar] [CrossRef]
- Korsnes, R.; Madland, M.; Austad, T. Impact of brine composition on the mechanical strength of chalk at high temperature. In Proceedings of the International Symposium of the International Society for Rock Mechanics, Eurock, Liège, Belgium, 9–12 May 2006. [Google Scholar]
- Garrels, R.M.; Christ, C.L. Solutions, Minerals and Equilibria; Freeman, Cooper & Company: San Fransisco, CA, USA, 1965. [Google Scholar]
- Megawati, M.; Hiorth, A.; Madland, M.V. The impact of surface charge on the mechanical behavior of high-porosity chalk. Rock Mech. Rock Eng. 2011. [Google Scholar] [CrossRef]
- Nermoen, A.; Korsnes, R.I.; Hiorth, A.; Madland, M.V. Porosity and permeability development in compacting chalks during flooding of nonequilibrium brines: Insights from long-term experiment. J. Geophys. Res. Solid Earth 2015, 120, 2935–2960. [Google Scholar] [CrossRef]
- Korsnes, R.I.; Madland, M.V. The Effect on Compaction Rates by Divalent Anion and Cations on Outcrop Chalk Tested at Reservoir Temperature and Effective Stress Conditions. Poromechanics VI 2017, 706–714. [Google Scholar] [CrossRef]
- Minde, M.W.; Zimmermann, U.; Madland, M.V.; Korsnes, R.I.; Schultz, B.; Gilbricth, S. Mineral Replacement in Long-Term Flooded Porous Carbonate Rocks. Geochim. Cosmochim. Acta 2019, 268, 485–508. [Google Scholar] [CrossRef]
- Zimmermann, U.; Madland, M.V.; Nermoen, A.; Hildebrand-Habel, T.; Bertolino, S.A.R.; Hiorth, A.; Korsnes, R.I.; Audinot, J.-N.; Grysan, P. Evaluation of the compositional changes during flooding of reactive fluids using scanning electron microscopy, nano-secondary ion mass spectrometry, x-ray diffraction, and whole-rock geochemistry. Am. Assoc. Pet. Geol. Bull. 2015, 99, 791–805. [Google Scholar] [CrossRef]
- Hiorth, A.; Bache, Ø.; Jettestuen, E.; Cathles, L.M.; Moe, R.W.; Omdal, E.; Korsnes, R.I.; Madland, M.V. A Simplified Approach to Translate Chemical Alteration in Core Experiments to Field Conditions. In Proceedings of the International Symposium of the Society of Core Analysts, Austin, TX, USA, 18–21 September 2011. [Google Scholar]
- Higgins, R.; Leighton, A. Computer prediction of water drive of oil and gas mixtures through irregularly bounded porous media three-phase flow. J. Pet. Technol. 1962, 14, 1048–1054. [Google Scholar] [CrossRef]
- Hiorth, A.; Jettestuen, E.; Vinningland, J.; Cathles, L.; Madland, M. Thermo-chemistry reservoir simulation for better EOR prediction. In Proceedings of the IEA EOR 34th Annual Symposium, Stavanger, Norway, 8–12 September 2013. [Google Scholar]
- Kristiansen, T.G.; Plischke, B. History Matched Full Field Geomechanics Model of the Valhall Field Including Water Weakening and Re-Pressurisation. In Proceedings of the SPE EUROPEC/EAGE Annual Conference and Exhibition, Barcelona, Spain, 14–17 June 2010; Society of Petroleum Engineers: London, UK, 2010; p. 21. [Google Scholar]
- Zangiabadi, B.; Korsnes, R.I.; Madland, M.V.; Hildebrand-Habel, T.; Hiorth, A.; Kristiansen, T.G. Mechanical Properties of High and Lower Porosity Outcrop Chalk at Various Wetting States. In Proceedings of the 43rd US Rock Mechanics Symposium and 4th U.S.-Canada Rock Mechanics Symposium, Ashville, NC, USA, 28 June–1 July 2009. [Google Scholar]
- Andersen, M.A. Enhanced compaction of stressed North Sea chalk during waterflooding. In Proceedings of the Third European Core Analysts Symposium, Paris, France, 14–16 September 1992. [Google Scholar]
- Sachdeva, J.S.; Nermoen, A.; Korsnes, R.I.; Madland, M.V. Impact of Initial Wettability and Injection Brine Chemistry on Mechanical Behaviour of Kansas Chalk. Transp. Porous Media 2019, 128, 755–795. [Google Scholar] [CrossRef]
© 2019 by the authors. Licensee MDPI, Basel, Switzerland. This article is an open access article distributed under the terms and conditions of the Creative Commons Attribution (CC BY) license (http://creativecommons.org/licenses/by/4.0/).