Article

Experimental and Modelled Reactions of CO2 and SO2 with Core from a Low Salinity Aquifer Overlying a Target CO2 Storage Complex

by
Julie K. Pearce
1,2,*,
Grant K.W. Dawson
1,
Silvano Sommacal
3 and
Suzanne D. Golding
1
1
School of Earth and Environmental Sciences, University of Queensland, St. Lucia, QLD 4072, Australia
2
UQ Center for Natural Gas, University of Queensland, St. Lucia, QLD 4072, Australia
3
ARC Training Centre for Automated Manufacture of Advanced Composites, Research School of Electrical Energy and Materials Engineering, the Australian National University, Canberra, ACT 0200, Australia
*
Author to whom correspondence should be addressed.
Geosciences 2019, 9(12), 513; https://doi.org/10.3390/geosciences9120513
Submission received: 4 November 2019 / Revised: 9 December 2019 / Accepted: 10 December 2019 / Published: 12 December 2019
(This article belongs to the Special Issue Geochemical and associated Changes with Gas-Water-Rock Reactions)

Abstract

:
CO2-induced reactions in low salinity aquifers overlying CO2 storage sites are of interest to understand potential reactions or impacts in the possible case of a leak. Previous investigations of overlying aquifers in the context of CO2 storage have focused on pure CO2 streams, however captured industrial CO2 streams may contain ancillary gases, including SO2, O2, NOx, H2S, N2, etc., some of which may be more reactive than CO2 when dissolved in formation water. Eight drill cores from two wells in a low salinity sandstone aquifer that overlies a target CO2 storage complex are characterised for porosity (helium, mercury injection, or micro CT), permeability, and mineral content. The eight Hutton Sandstone cores are variable with porosities of 5.2–19.6%, including carbonaceous mudstones, calcite cemented sandstones, and quartz rich sandstones, common lithologies that may be found generally in overlying aquifers of CO2 storage sites. A chlorite rich sandstone was experimentally reacted with CO2 and low concentrations of SO2 to investigate the potential reactions and possible mineral trapping in the unlikely event of a leak. Micro CT characterisation before and after the reaction indicated no significant change in porosity, although some fines movement was observed that could affect permeability. Dissolved concentrations of Fe, Ca, Mn, Cr, Mg, Rb, Li, Zn, etc., increased during the reaction, including from dissolution of chlorite and trace amounts of ankerite. After ~40 days dissolved concentrations including Fe, Zn, Al, Ba, As and Cr decreased. Chlorite was corroded, and Fe-rich precipitates mainly Fe-Cr oxides were observed to be precipitated on rock surfaces after experimental reaction. Concentrations of Rb and Li increased steadily and deserve further investigation as potential monitoring indicators for a leak. The reaction of chlorite rich sandstone with CO2 and SO2 was geochemically modelled over 10 years, with mainly chlorite alteration to siderite mineral trapping 1.55 kg/m3 of CO2 and removing dissolved Fe from solution. Kaolinite and chalcedony precipitation was also predicted, with minor pyrite precipitation trapping SO2, however no changes to porosity were predicted.

Graphical Abstract

1. Introduction

Owing to international interest in existing and potential CO2 storage sites in deep saline aquifers, the majority of experimental CO2–water–rock reactions have been performed in brines and with pure CO2. There have however been international studies of CO2-water-rock interactions of core from low salinity or fresh water aquifers overlying CO2 storage sites to understand any potential changes in the unlikely event of a leak. Examples of field studies relevant to low salinity aquifer conditions are limited in number. A controlled shallow injection of CO2 into the Zert field site (MT, USA), was performed and resulted in a rapid pH decrease, and increases of Fe, Mn, Mg and Ca concentrations from mineral dissolution, desorption and ion exchange [1]. Associated experiments were used to determine that calcite and dolomite dissolution, with clay or Fe-oxyhydroxide ion exchange and desorption, and Mn oxyhydroxide dissolution and reduction were metal sources; where Mn was correlated with Ca, and Co with Ba and U. Dissolved As and Pb were reported to remain below drinking water guideline concentrations. Experimental studies specifically looking at low salinity conditions for CO2 leakage studies have included reactions of limestone or dolomite with CO2 [2,3]. The release of Sr, Co, Mn, Tl, Zn, and Ni were correlated with Ca and mainly attributed to the dissolution of the dolomite rather than pyrite or oxides, with high concentrations of As, Ni and Mn from some rocks. Limestone samples released Ca, Mg, Sr, Ba, Tl, and U, with only dissolved Ni and As at concentrations of concern. The main source of metals was determined to be from calcite dissolution, even though higher concentrations were sometimes present in pyrite or clays. The metals mainly present in carbonates were reported to be Ba, Sr, As, S and Ni, as determined from extraction experiments. The authors predicted that pyrite would be an important source of metals at longer reaction time scales up to 30 years, after carbonates reached saturation. Crushed cores from the Edwards limestone aquifer (TX, USA), containing calcite, quartz and montmorillonite were reacted with pure CO2 [4]. Mobilisation of Ca, Mg, Mn, Ba, Sr, Si, Mo, and transient increases of As, Pb, Zn, etc. were attributed to calcite dissolution and exchange reactions. The pH was buffered by carbonate dissolution and therefore the reported concentrations of metals were low. Batch experiments and geochemical modelling were performed for the low salinity Albian Aquifer core from the Paris Basin (France), to look for potential geochemical leakage monitoring tools [5,6]. Those authors reported increases of several dissolved elements during reaction with pure CO2, however Fe and Ba overall decreased. They also suggested the potential of carbon and strontium isotopes as monitoring tools. Core material from several low salinity aquifers in the USA were batch reacted with CO2, with dissolved elements including Ba, U, Co, Li, and transition metals such as Mn, Zn, and Fe increasing in concentration [7]. The elements Mo and As however generally decreased during some core reactions. Released concentrations were variable with the aquifer core. The authors also reported that interaquifer mineral heterogeneity influences the chemical impacts of a leak. Several studies performed a series of experiments on core from the Precipice Sandstone, Evergreen Formation, and one sample from the Hutton Sandstone (Queensland, Australia). Core was reacted with water or 1500 ppm NaCl and pure CO2 or CO2 containing 0.16% SO2 ± 2% O2 [8,9,10,11,12]. They observed reaction of both carbonate and silicate minerals and release of metals such as Fe and Mg from siderite and chlorite, and Ca, Mn, Sr from calcite and ankerite, with released concentrations higher when SO2 was present acidifying solution. With SO2 and O2 additionally present, gypsum precipitation generally occurred in calcite cemented core, or Fe-oxide precipitation in Fe-rich and Ca-poor core. In all their experiments with calcite cemented cores the measured porosity increased after experimental reaction through calcite dissolution.
Overall the above published studies on low salinity aquifer response to CO2 storage or potential leakage have generally shown that carbonate minerals calcite, dolomite, ankerite, siderite can dissolve releasing various elements to solution, dependent on the host mineralogy. However, in carbonate cemented or limestone cores for example fast pH buffering can result in subsequent re-precipitation or adsorption of elements back to the rock. In addition clays have been observed to react and provide dissolved cations, and therefore there is the potential for subsequent precipitation or mineral trapping to impact porosity or minimize the impacts of a potential leak, although this has not generally been studied.
In Queensland the Surat Basin has been reported as one of the most prospective sites for CO2 storage [13,14]. The feasibility or potential for storage in the Precipice Sandstone is being appraised, where the Evergreen Formation is an overlying caprock [15]. The Hutton Sandstone is an overlying low salinity aquifer above the Evergreen Formation caprock. Previously the Hutton Sandstone was also suggested as a potential CO2 storage reservoir [16]. The Hutton Sandstone is also of interest as it is part of the Great Artesian Basin and water is extracted from it in other areas for agriculture and stock use. In addition the Hutton Sandstone underlies the Walloon coal measures, an important coal seam gas production interval [17,18]. Differences in the groundwater hydrochemistry have been reported, as being fresh in the north and western outcrops with higher salinity to the south and east, especially east of the Burunga Leichhardt fault zone [11,19]. Hydrochemical analyses of groundwater have indicated that a dual permeability is likely in the Hutton Sandstone of the northern Surat Basin near the Mimosa syncline, with groundwater flow limited to ~50 m of its total thickness [20,21]. There is also reported evidence for possible groundwater movement from the Precipice Sandstone to the Hutton Sandstone up the Hutton Wallumbilla fault, and Burunga Leichhardt fault zone [20,21]. Sequence stratigraphy and also non-quantitative well core scale mineral identification have been performed by Hylogger on several wells including West Wandoan 1, GSQ Chinchilla 4, and Woleebee Creek GW4 [22].
Here we quantitatively characterize in detail sandstone, mudstone and calcite cemented cores from two wells in a low salinity aquifer, the Hutton Sandstone, overlying a potential storage reservoir and caprock. One core is characterized before and after experimental reaction with supercritical CO2, SO2 and low salinity water by automated mineral quantification (QEMSCAN), scanning electron microscopy (SEM-EDS) and micro Computed Tomography (CT) to determine potential changes to minerals and porosity. Dissolved metals released in the reaction waters were determined, and longer term geochemical modelling performed to predict potential for mineral trapping of CO2.

2. Materials and Methods

Drill cores were sampled from the Hutton Sandstone of the GSQ Chinchilla 4 well (latitude –26.72722, and longitude of 150.2014 decimal degrees, approximately 10 km SSE of Miles), and the West Wandoan 1 (WW1) well (latitude –26.181622, longitude 149.812422, approximately 19 km south west of the town of Wandoan), in Queensland, Australia. The stratigraphic column and a map showing the well locations in given in Supplementary Materials Figure S1. The West Wandoan 1 well was drilled for a CO2 storage feasibility study of a demo scale injection into the Precipice Sandstone. Core air permeability, mercury intrusion porosimetry (MICP), and Helium porosity of the Chinchilla 4 well cores described here were performed at Weatherford. MICP, He pychnometry, permeability, and X-ray diffraction of West Wandoan 1 core was performed at the University of Queensland (UQ) by methods reported previously [10,23,24]. Scanning electron microscopy (SEM) and Energy Dispersive Spectroscopy (EDS) in back scatter detection mode (BSE) with both a low-vacuum JEOL 6460LA environmental SEM (Peabody, MA, USA), and Hitachi TM3030 (Tokyo, Japan) with a Bruker EDS (Billerica, MA, USA) was performed on polished thin sections and blocks. Core total acid digestions or lithium metaborate fusions and loss on ignition were performed in the UQ Environmental Geochemistry Laboratory.
Micro CT was performed on sub-plugs to visualise and calculate pore space. QEMSCAN is an automated mineral quantification based on SEM-EDS that also provides visualisation of mineral associations and grain sizes. These were performed on polished sub-plug sections by FEI Australia (Canberra, Australia) (and more recently at the Australian National University) as described in detail previously [11,25,26]. Briefly, for the WW1 724.1 m sample that was reacted, a 3 mm diameter sub-plug was digitally characterised in 3D by X-ray micro computed tomography (μCT) with a voxel size of 2.2 µm. The 3D μCT images were registered into perfect geometric alignment with higher-resolution 2D SEM images and automated quantified SEM-EDS (QEMSCAN®) mineral maps were produced of a polished sub-plug slice from a trimmed end. The sub-plug was reacted, before being imaged again after reaction, and the two sets of before and after reaction images registered to one another to characterise the changes.
Long term batch experiments were performed in Parr reactors (Moline, IL, USA) at 120 bar and 60 °C for approximately 10 weeks with the reactors described in detail previously [12]. A low salinity water (100 mL of 1500 ppm NaCl) was added with the WW1 724.1 m rock core (15 mm cube, sub-plug and offcut) at a water:rock ratio of 7 by mass. Data on the in situ formation water chemistry was not available, however measurements in other regions of the aquifer range from ~ 282–1863 mg/kg NaCl with variable bicarbonate alkalinity ~136–733 mg/kg [19]. The simplified synthetic formation water chemistry was chosen to both be in the range of possible formation water salinities, and to be consistent with previous studies for comparison. Reactors were purged with N2 and pressurised to 120 bar at 60 °C for 5 days to provide a baseline water-rock soak chemistry. This time was similar to previous work given time constraints, however it is possible that full equilibration of water and rock may not have occurred. After fluid sampling, N2 was depressurised and reactors filled with 160 ppm SO2 in a balance of CO2. After another 18 days sodium bicarbonate was added (to 105 ppm) to approximate reservoir buffering. Note that this likely introduced some O2 from air contact, however O2 or air may be present anyway in injected CO2 streams especially from oxyfuel firing. Fluid was sampled during the experiments, with pH and electrical conductivity immediately measured with a TPS WP81 meter and probes. Aliquots were diluted 20 times and acidified to 2% ultra-pure nitric acid for analysis of ions in the UQ Environmental Geochemistry Laboratory by ICP-OES (Optima 3300 DV ICP-OES, Perkin Elmer, Waltham, MA, USA) with an error of ~5% for major elements. Trace element concentrations were measured by ICP MS (7900 ICP-MS, Agilent, Santa Clara, CA, USA with collision cell) with errors of less than 10%. Total inorganic and organic carbon, alkalinity, and sulphate were determined on selected unacidified samples (total organic carbon analyser, and ion chromatography performed at ALS environmental), and also NOx and phosphate at the end of the reaction (UQ, Lachat QuikChem8500 Flow Injection Analyser). A blank experiment without core was also performed to determine if cations were leached from the reactor.
Kinetic geochemical models were constructed for the reaction of the WW1 724.1 m Hutton Sandstone for up to 10 years from the characterization data, with the input minerals given in Supplementary Materials. The upscaled reactive surface areas of minerals used are also given in Supplementary Materials, with the water-rock ratio based on the porosity and an equilibrated water chemistry based on formation water measurements [19]. The general methods and mineral kinetic and thermodynamic parameters have been published in detail previously for other rock reactions [11,12,26,27,28,29]. Briefly, geochemical models were run in the react module of Geochemist work Bench (GWB) version 9, using the EQ3/6 database, with minerals input via mineral script files to describe acid neutral and basic mechanisms [29,30,31]. CO2 fugacity was calculated at 12 MPa and 60 °C from Duan and Sun (2003), with SO2 gas added by mass, models were also run with the CO2 fugacity at half of the full fugacity to test the effect on pH [32]. Saturated minerals were allowed to precipitate based on observations of experiments and natural analogue systems, e.g., the carbonates siderite and ankerite/dolomite have been observed to precipitate in natural systems along with kaolinite, smectites, silica, and pyrite [33,34,35,36].

3. Results

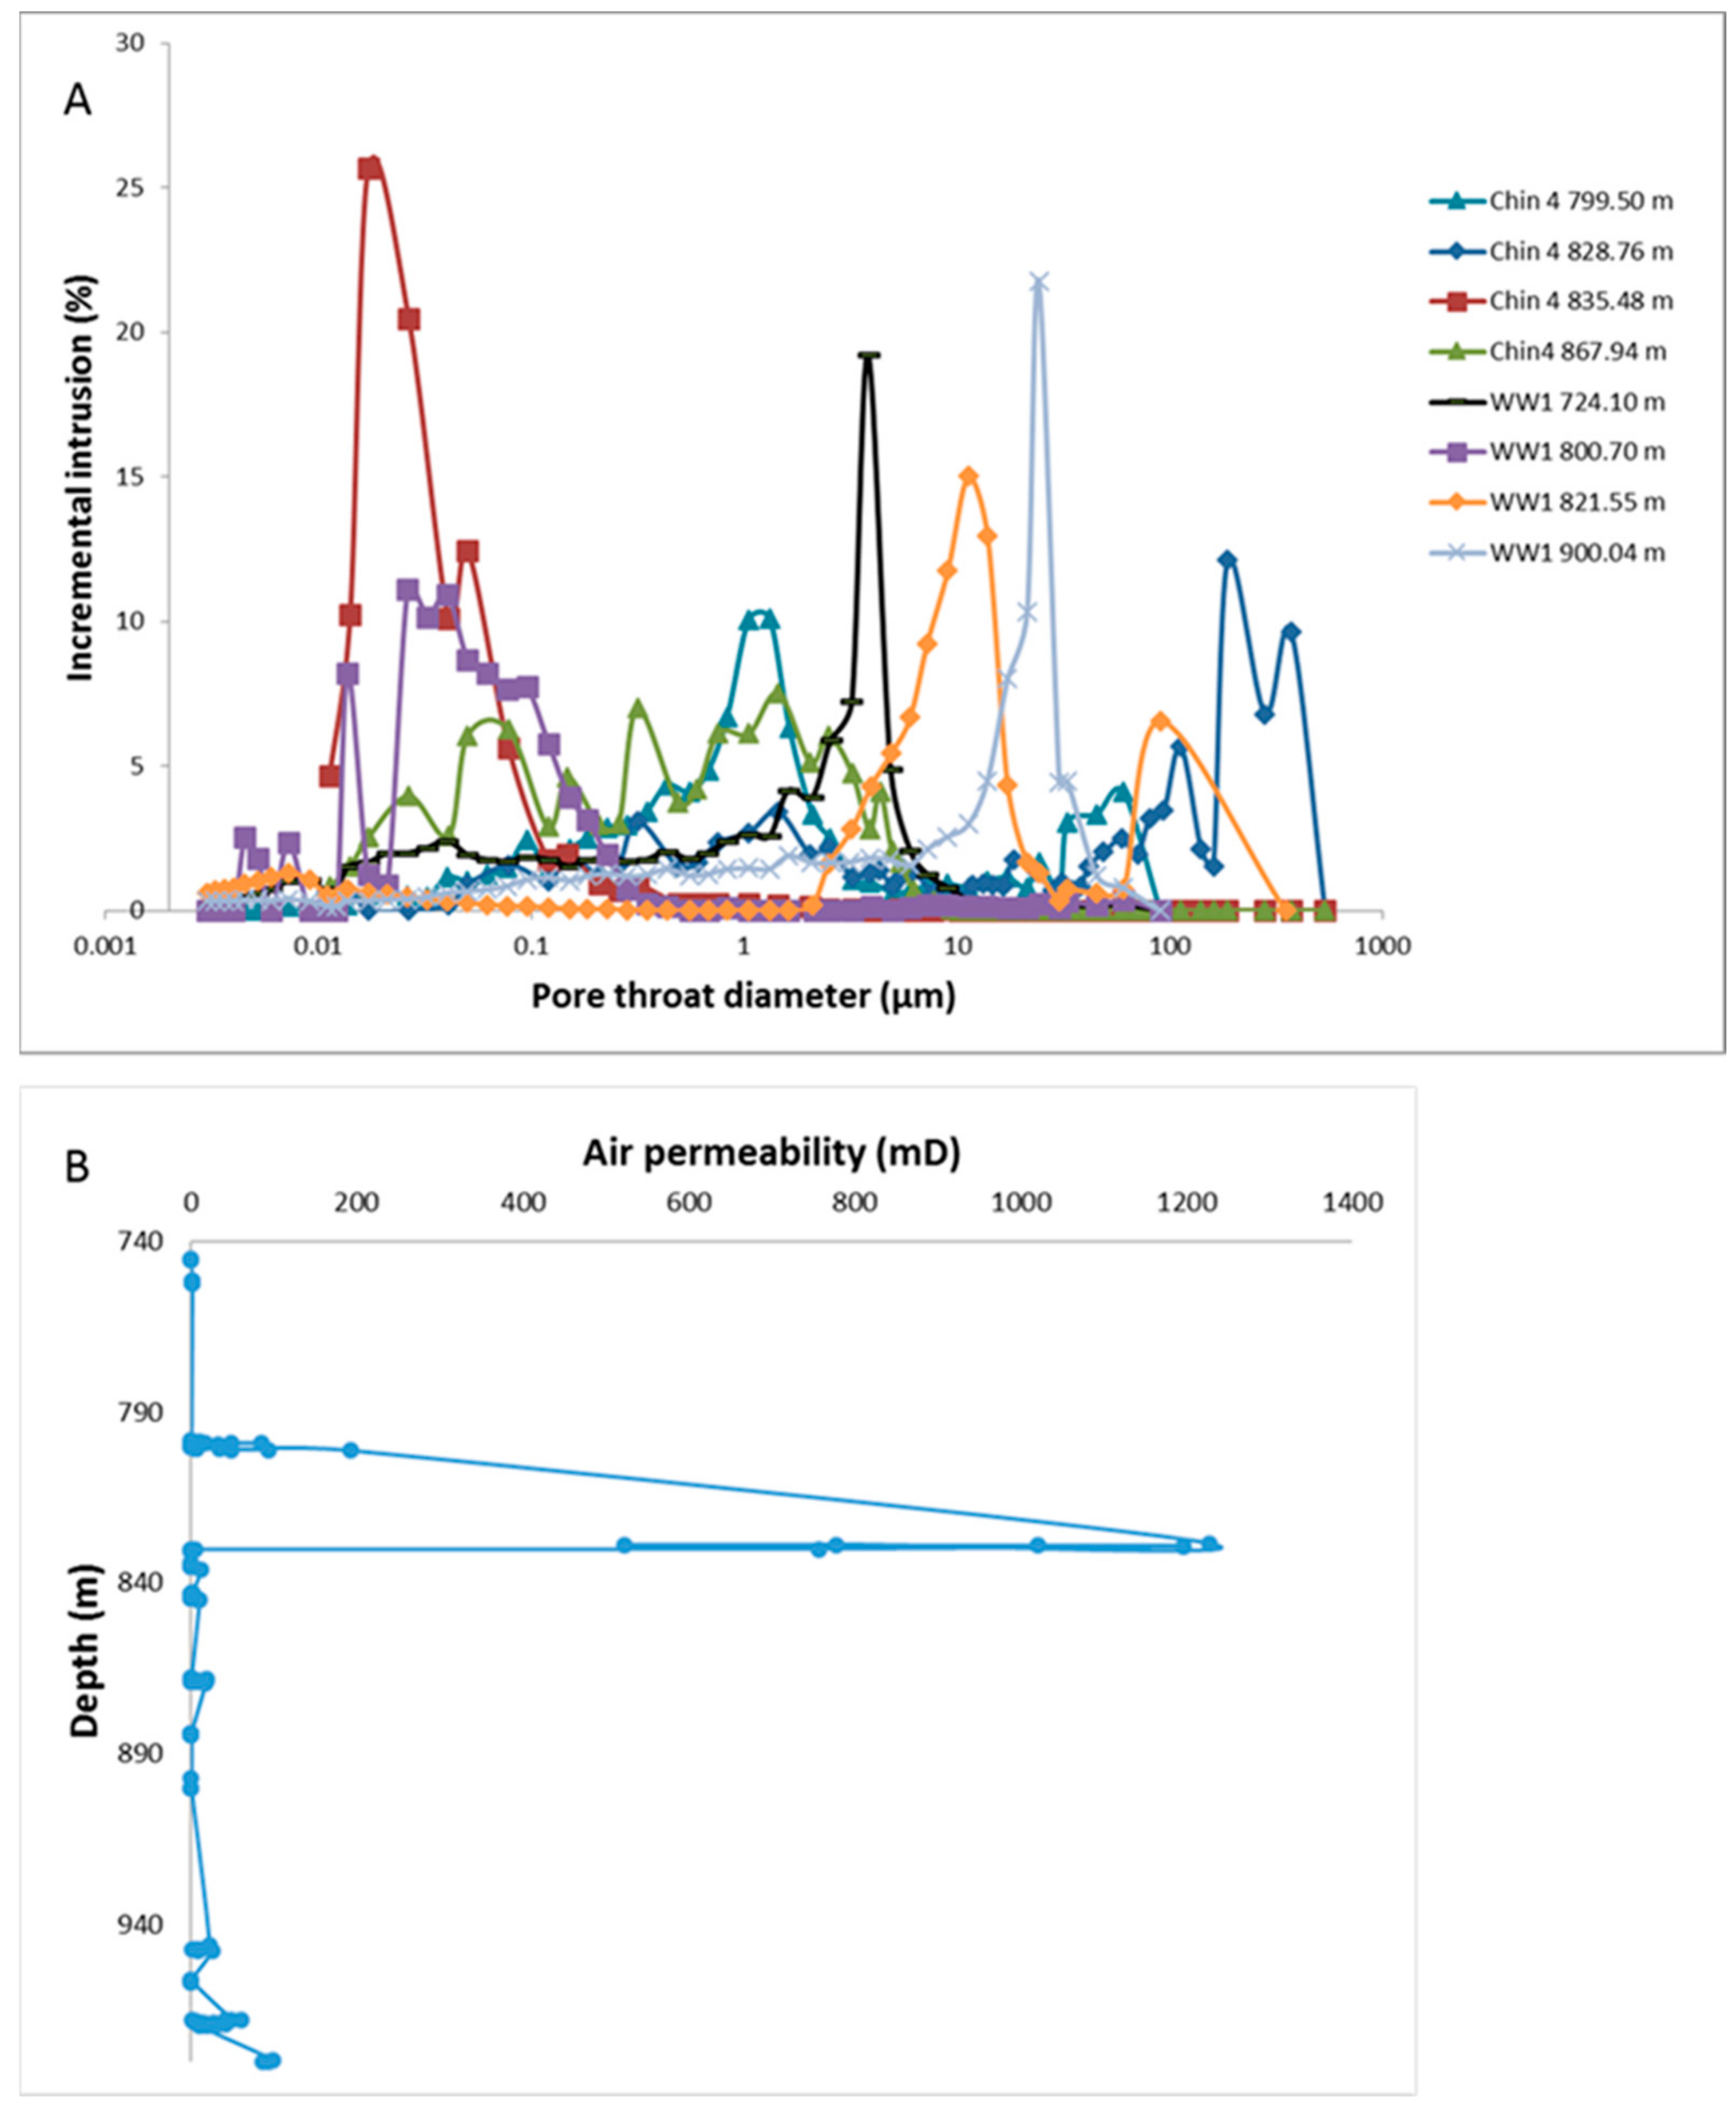
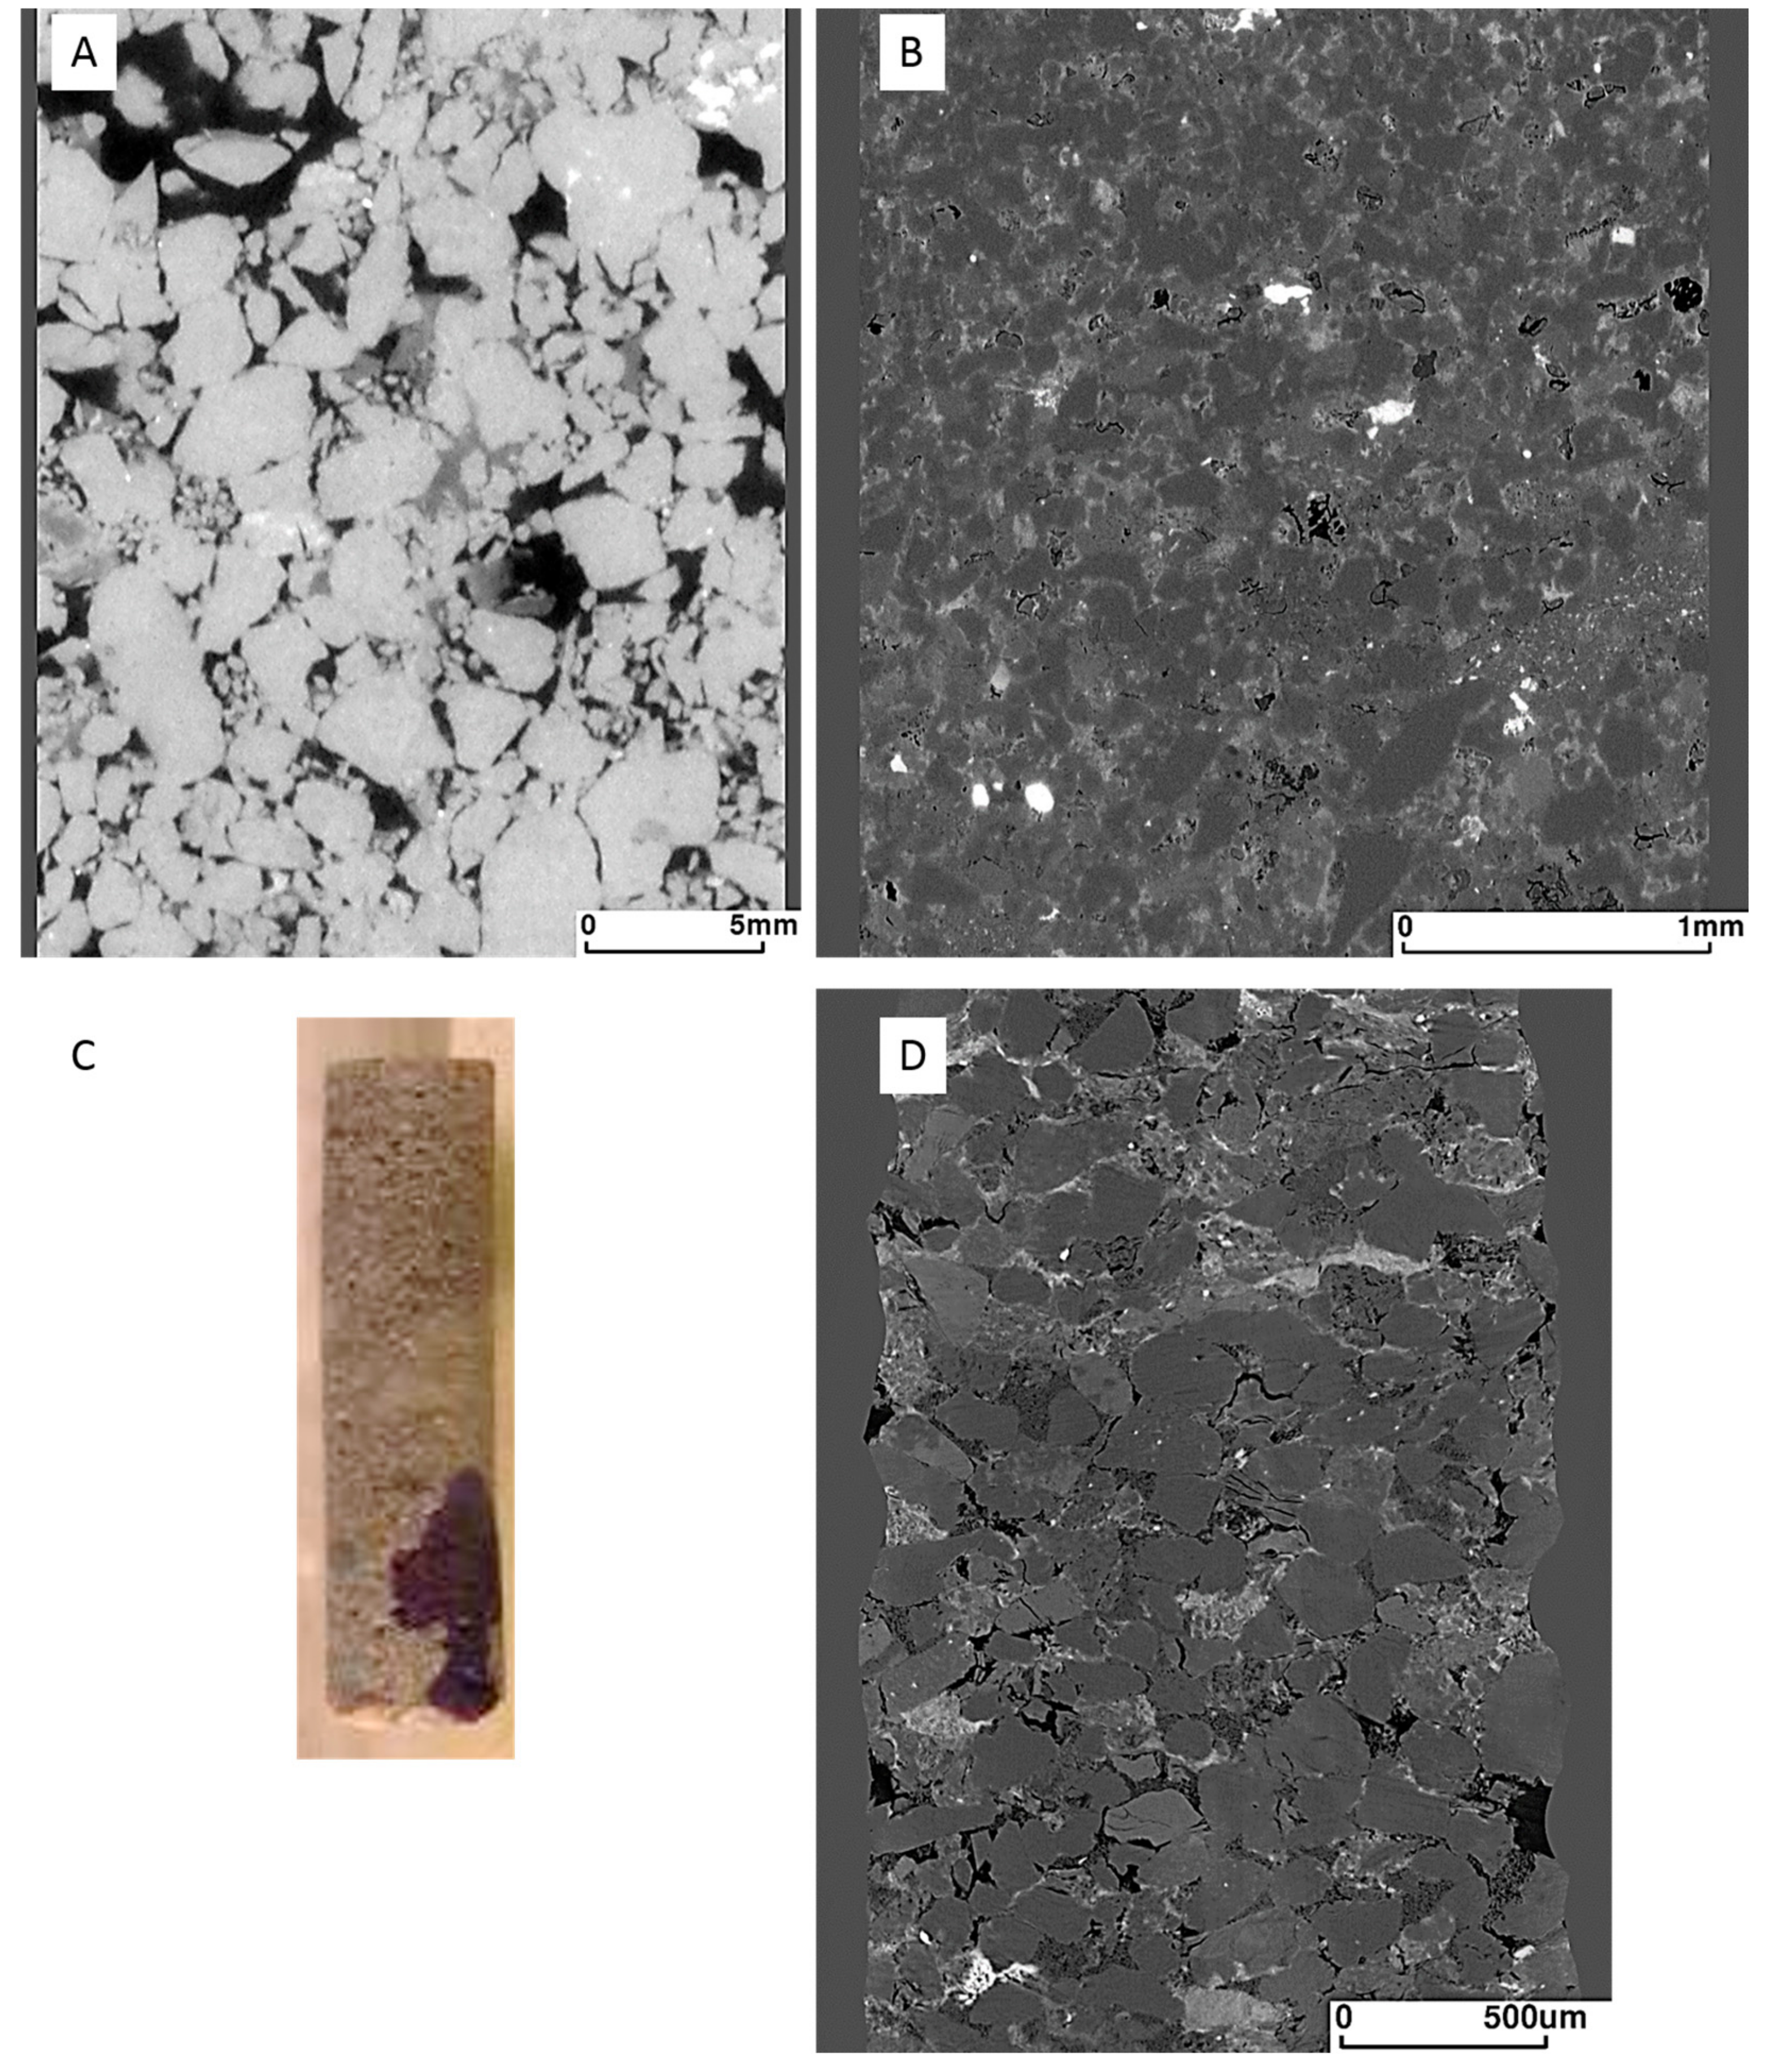
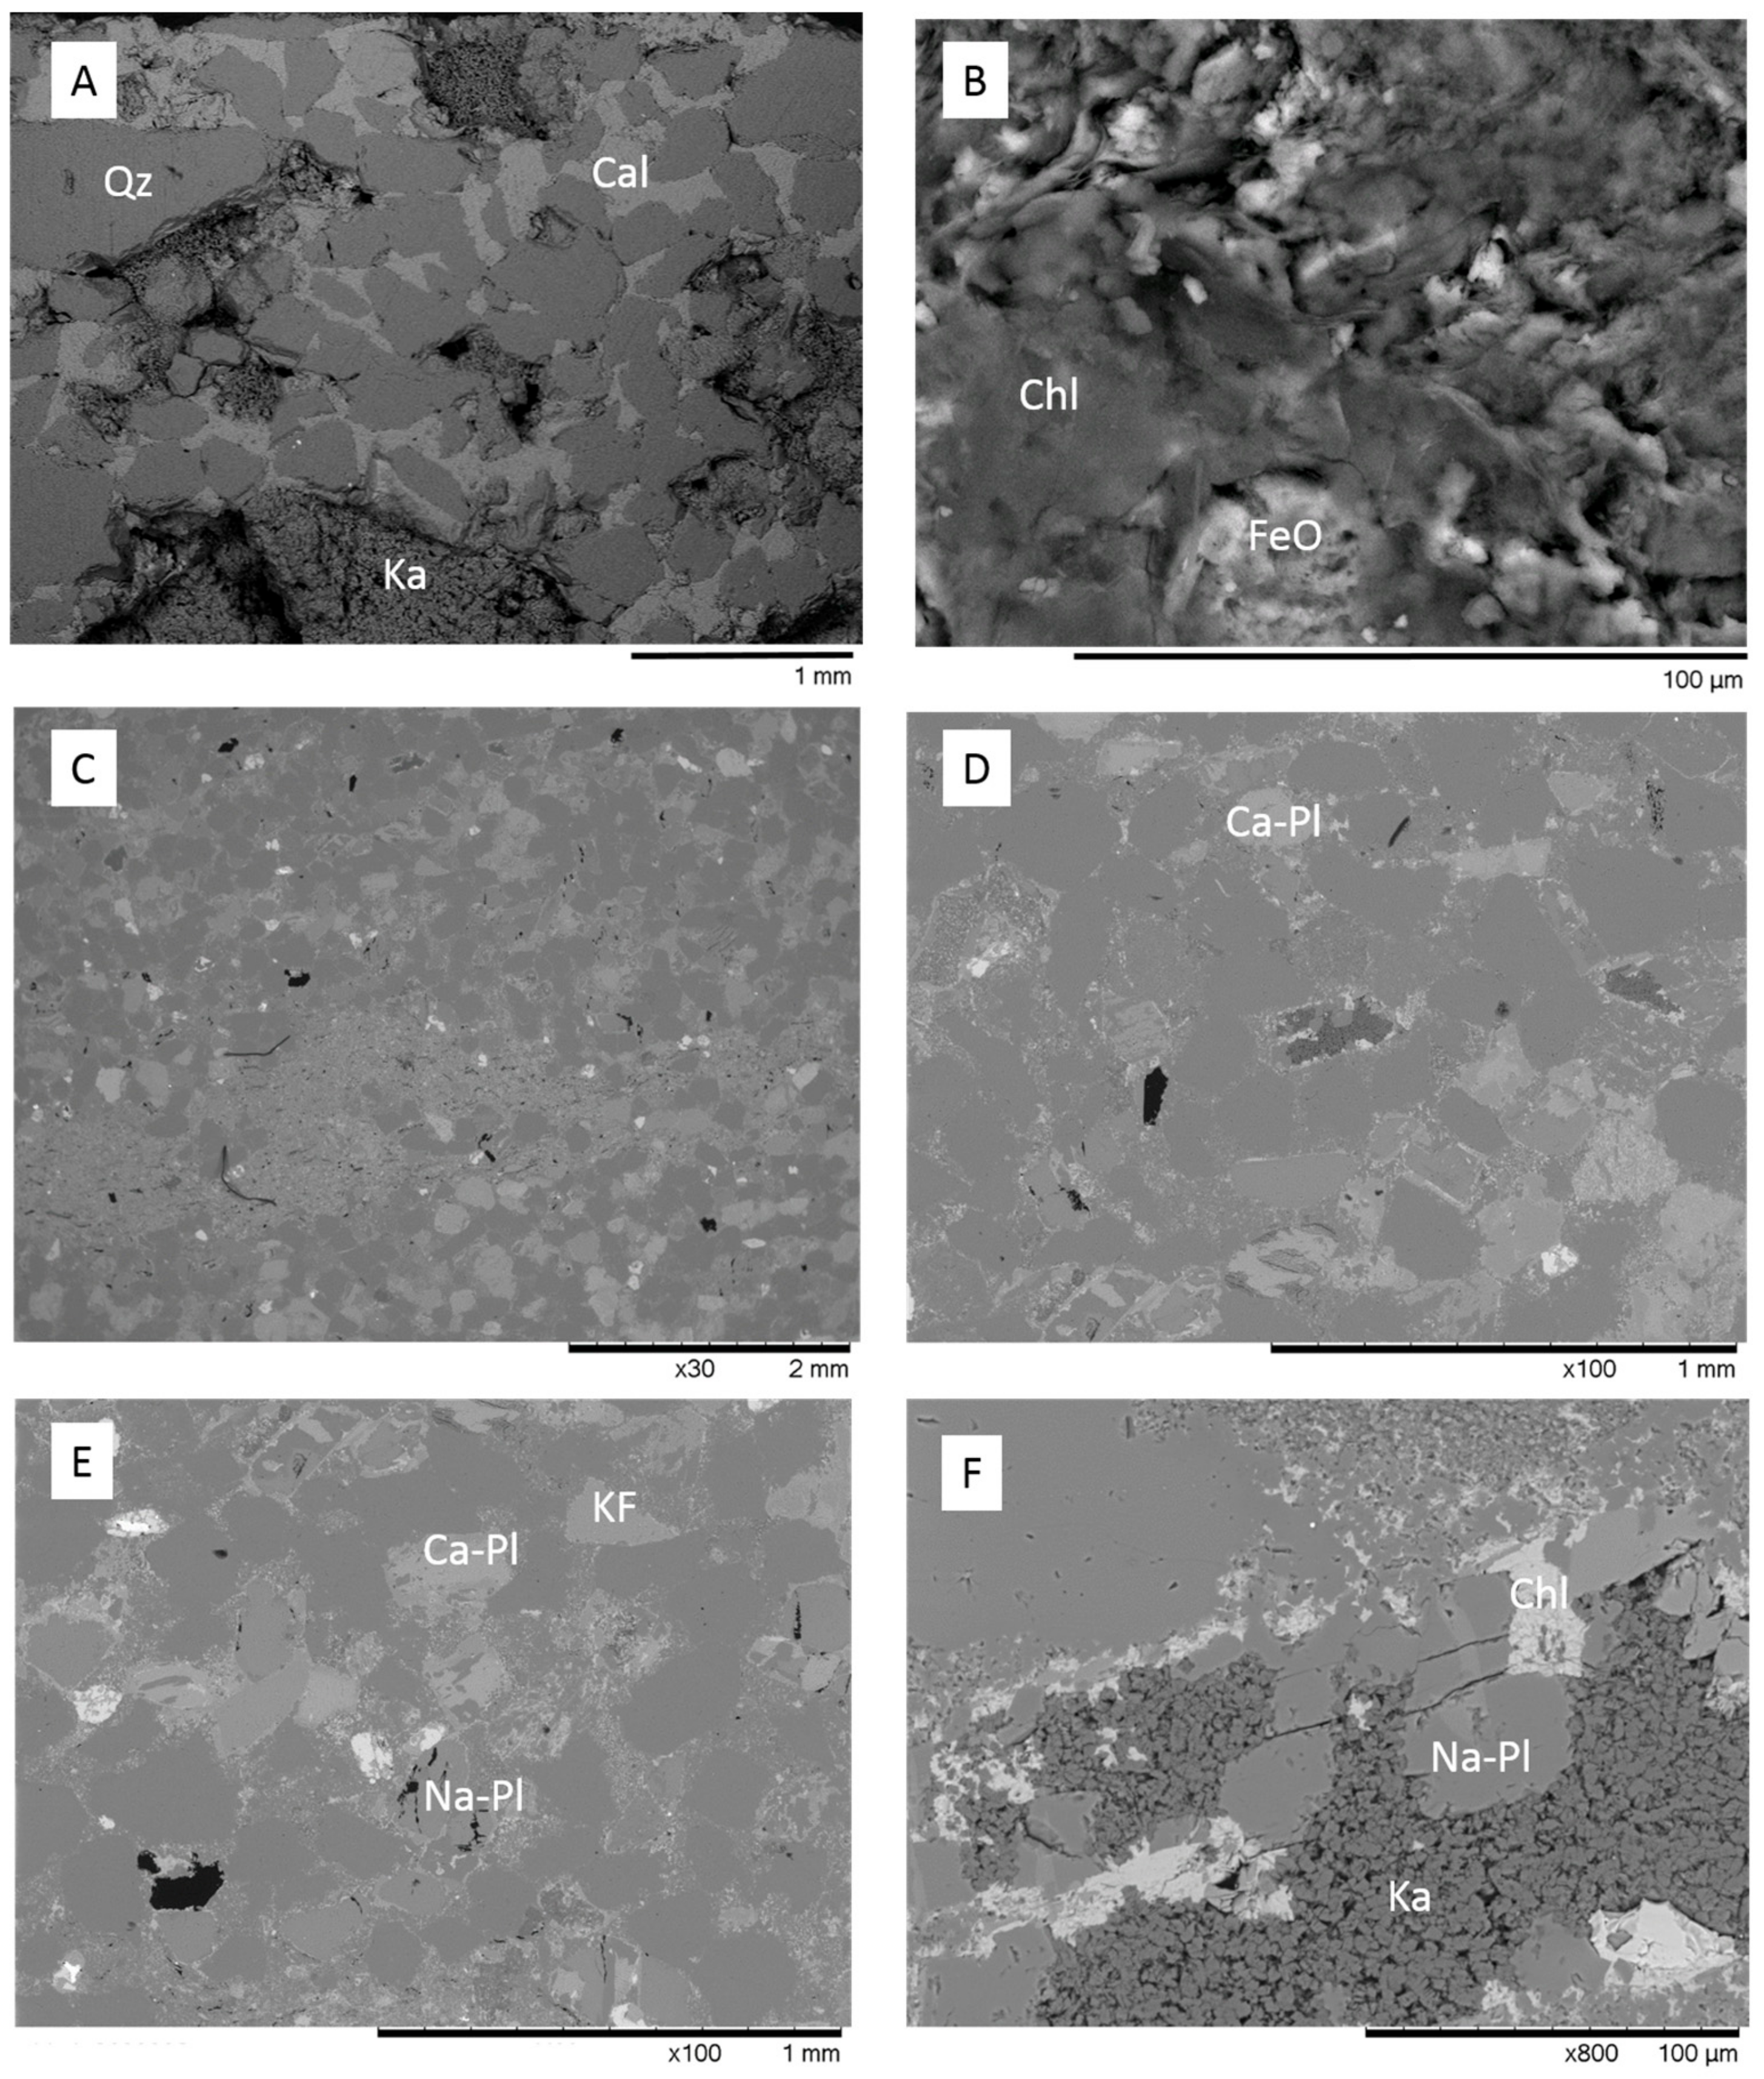
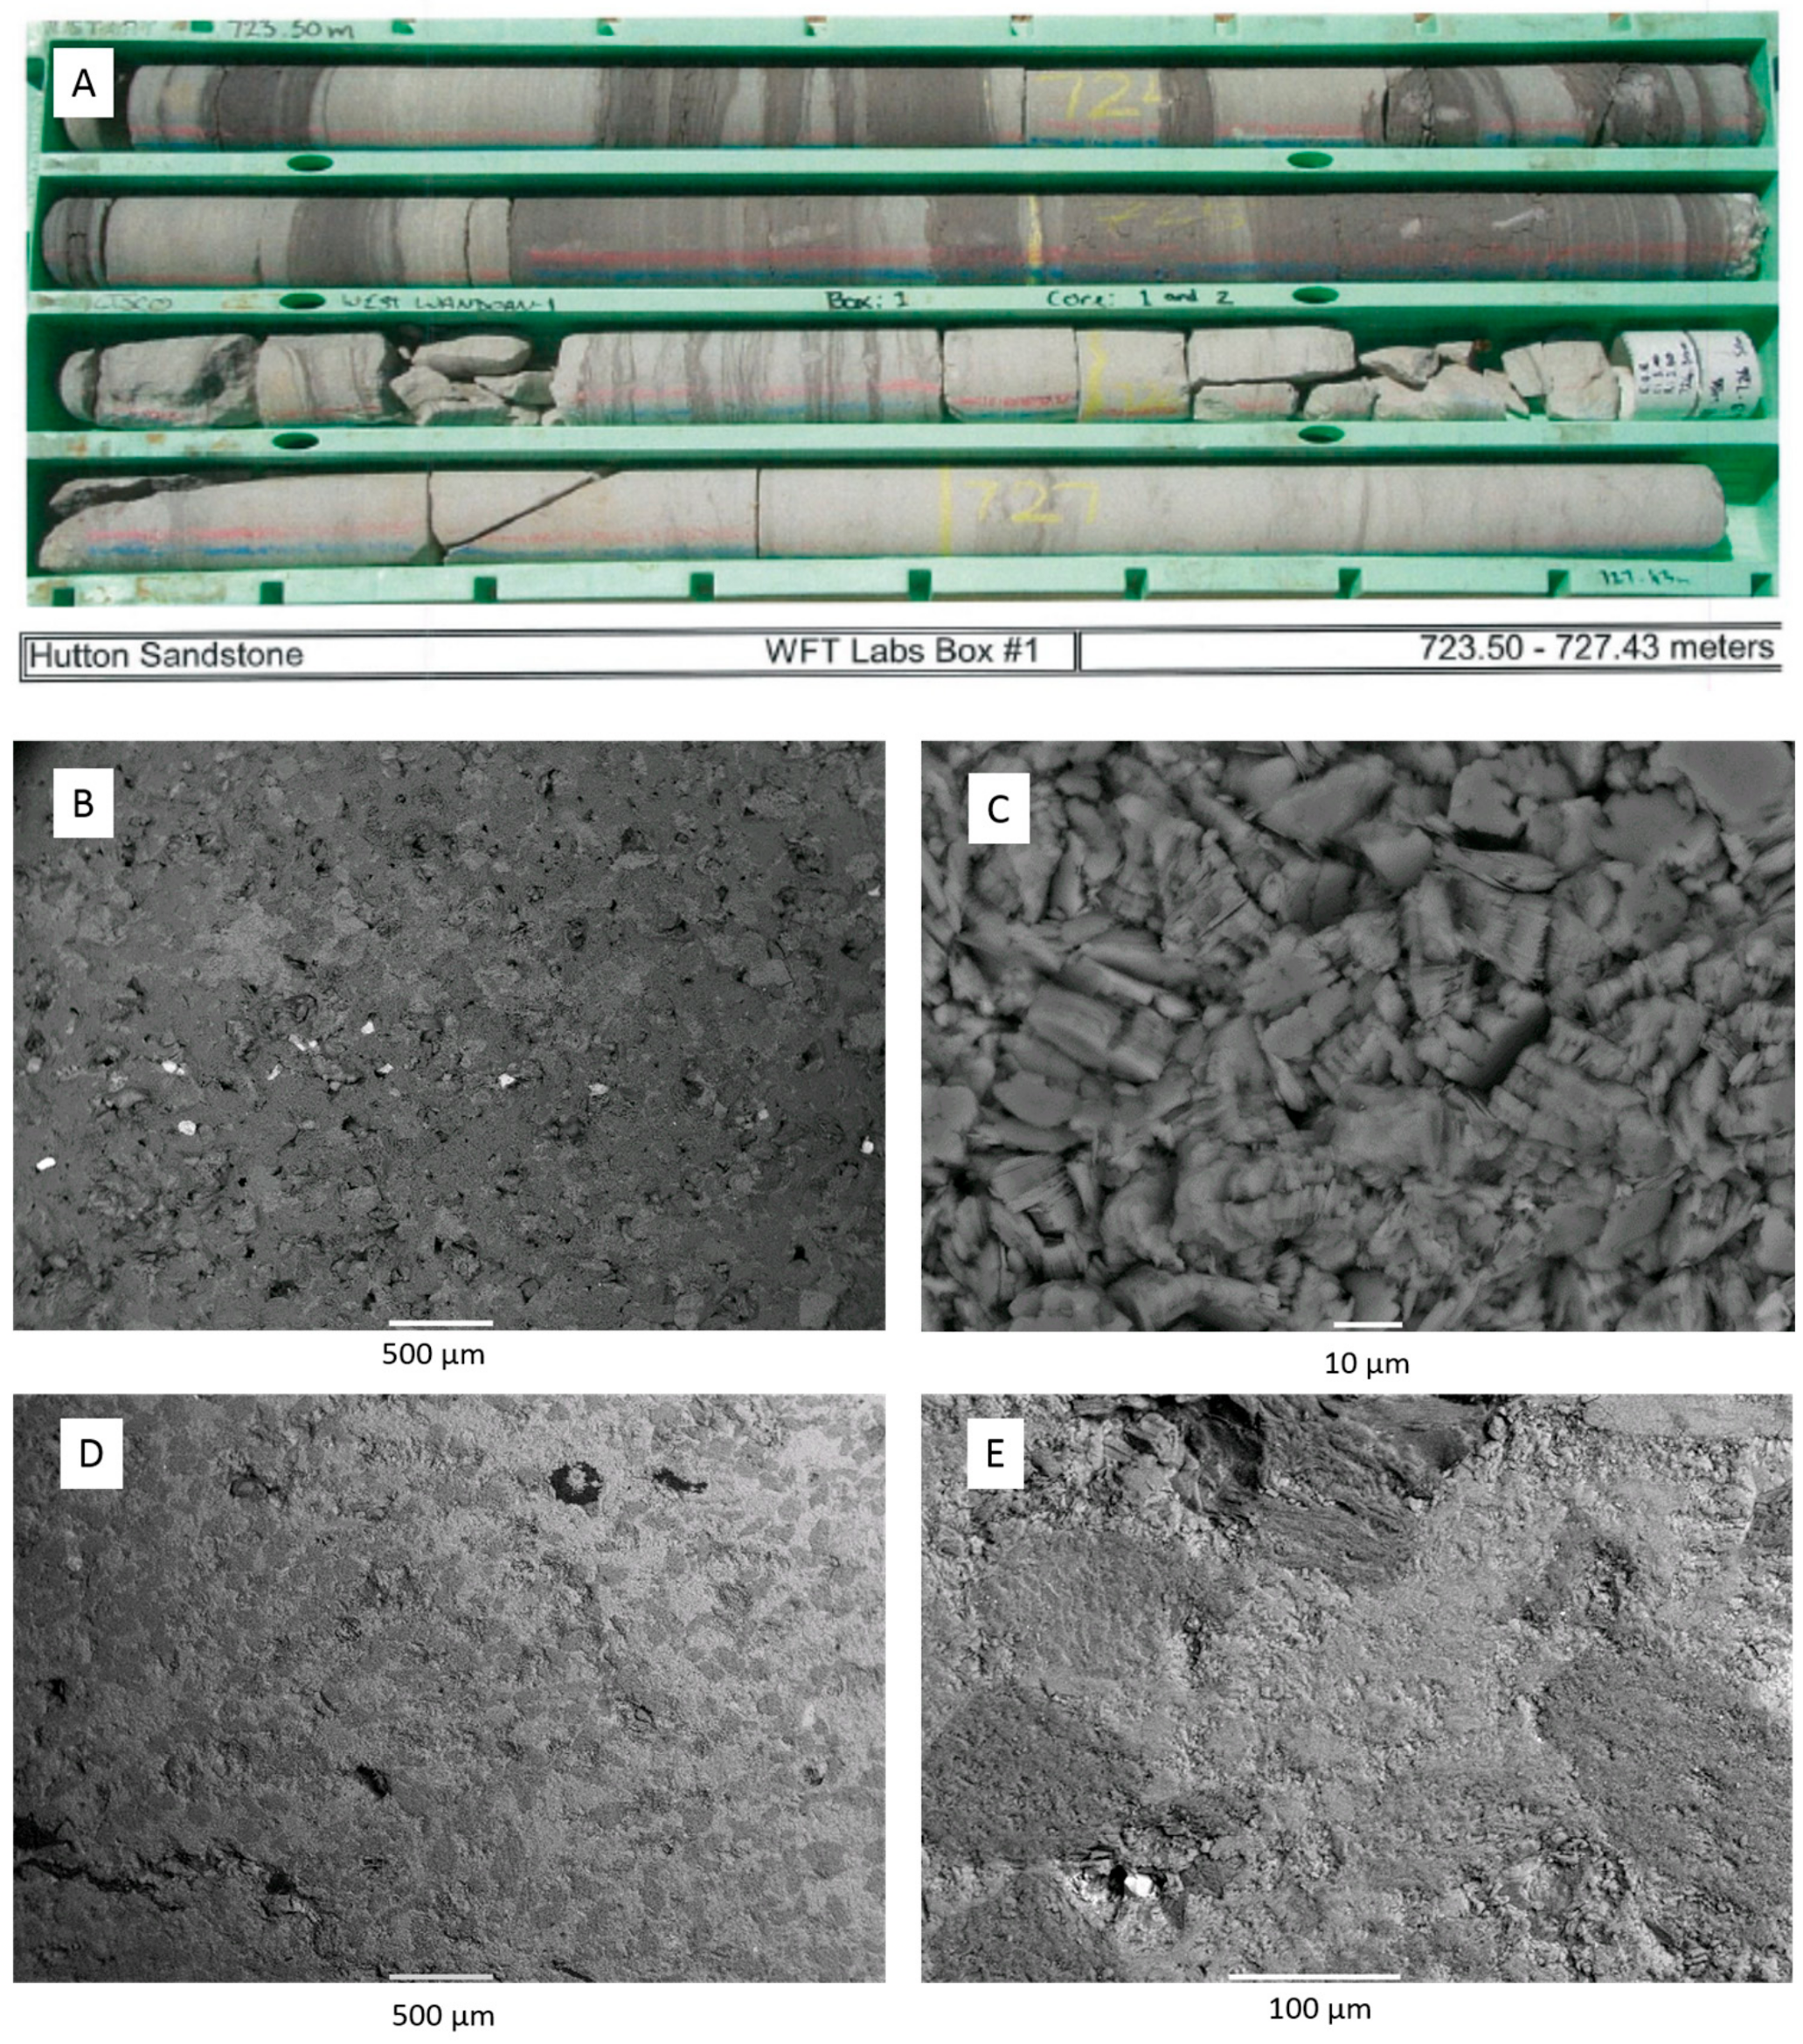
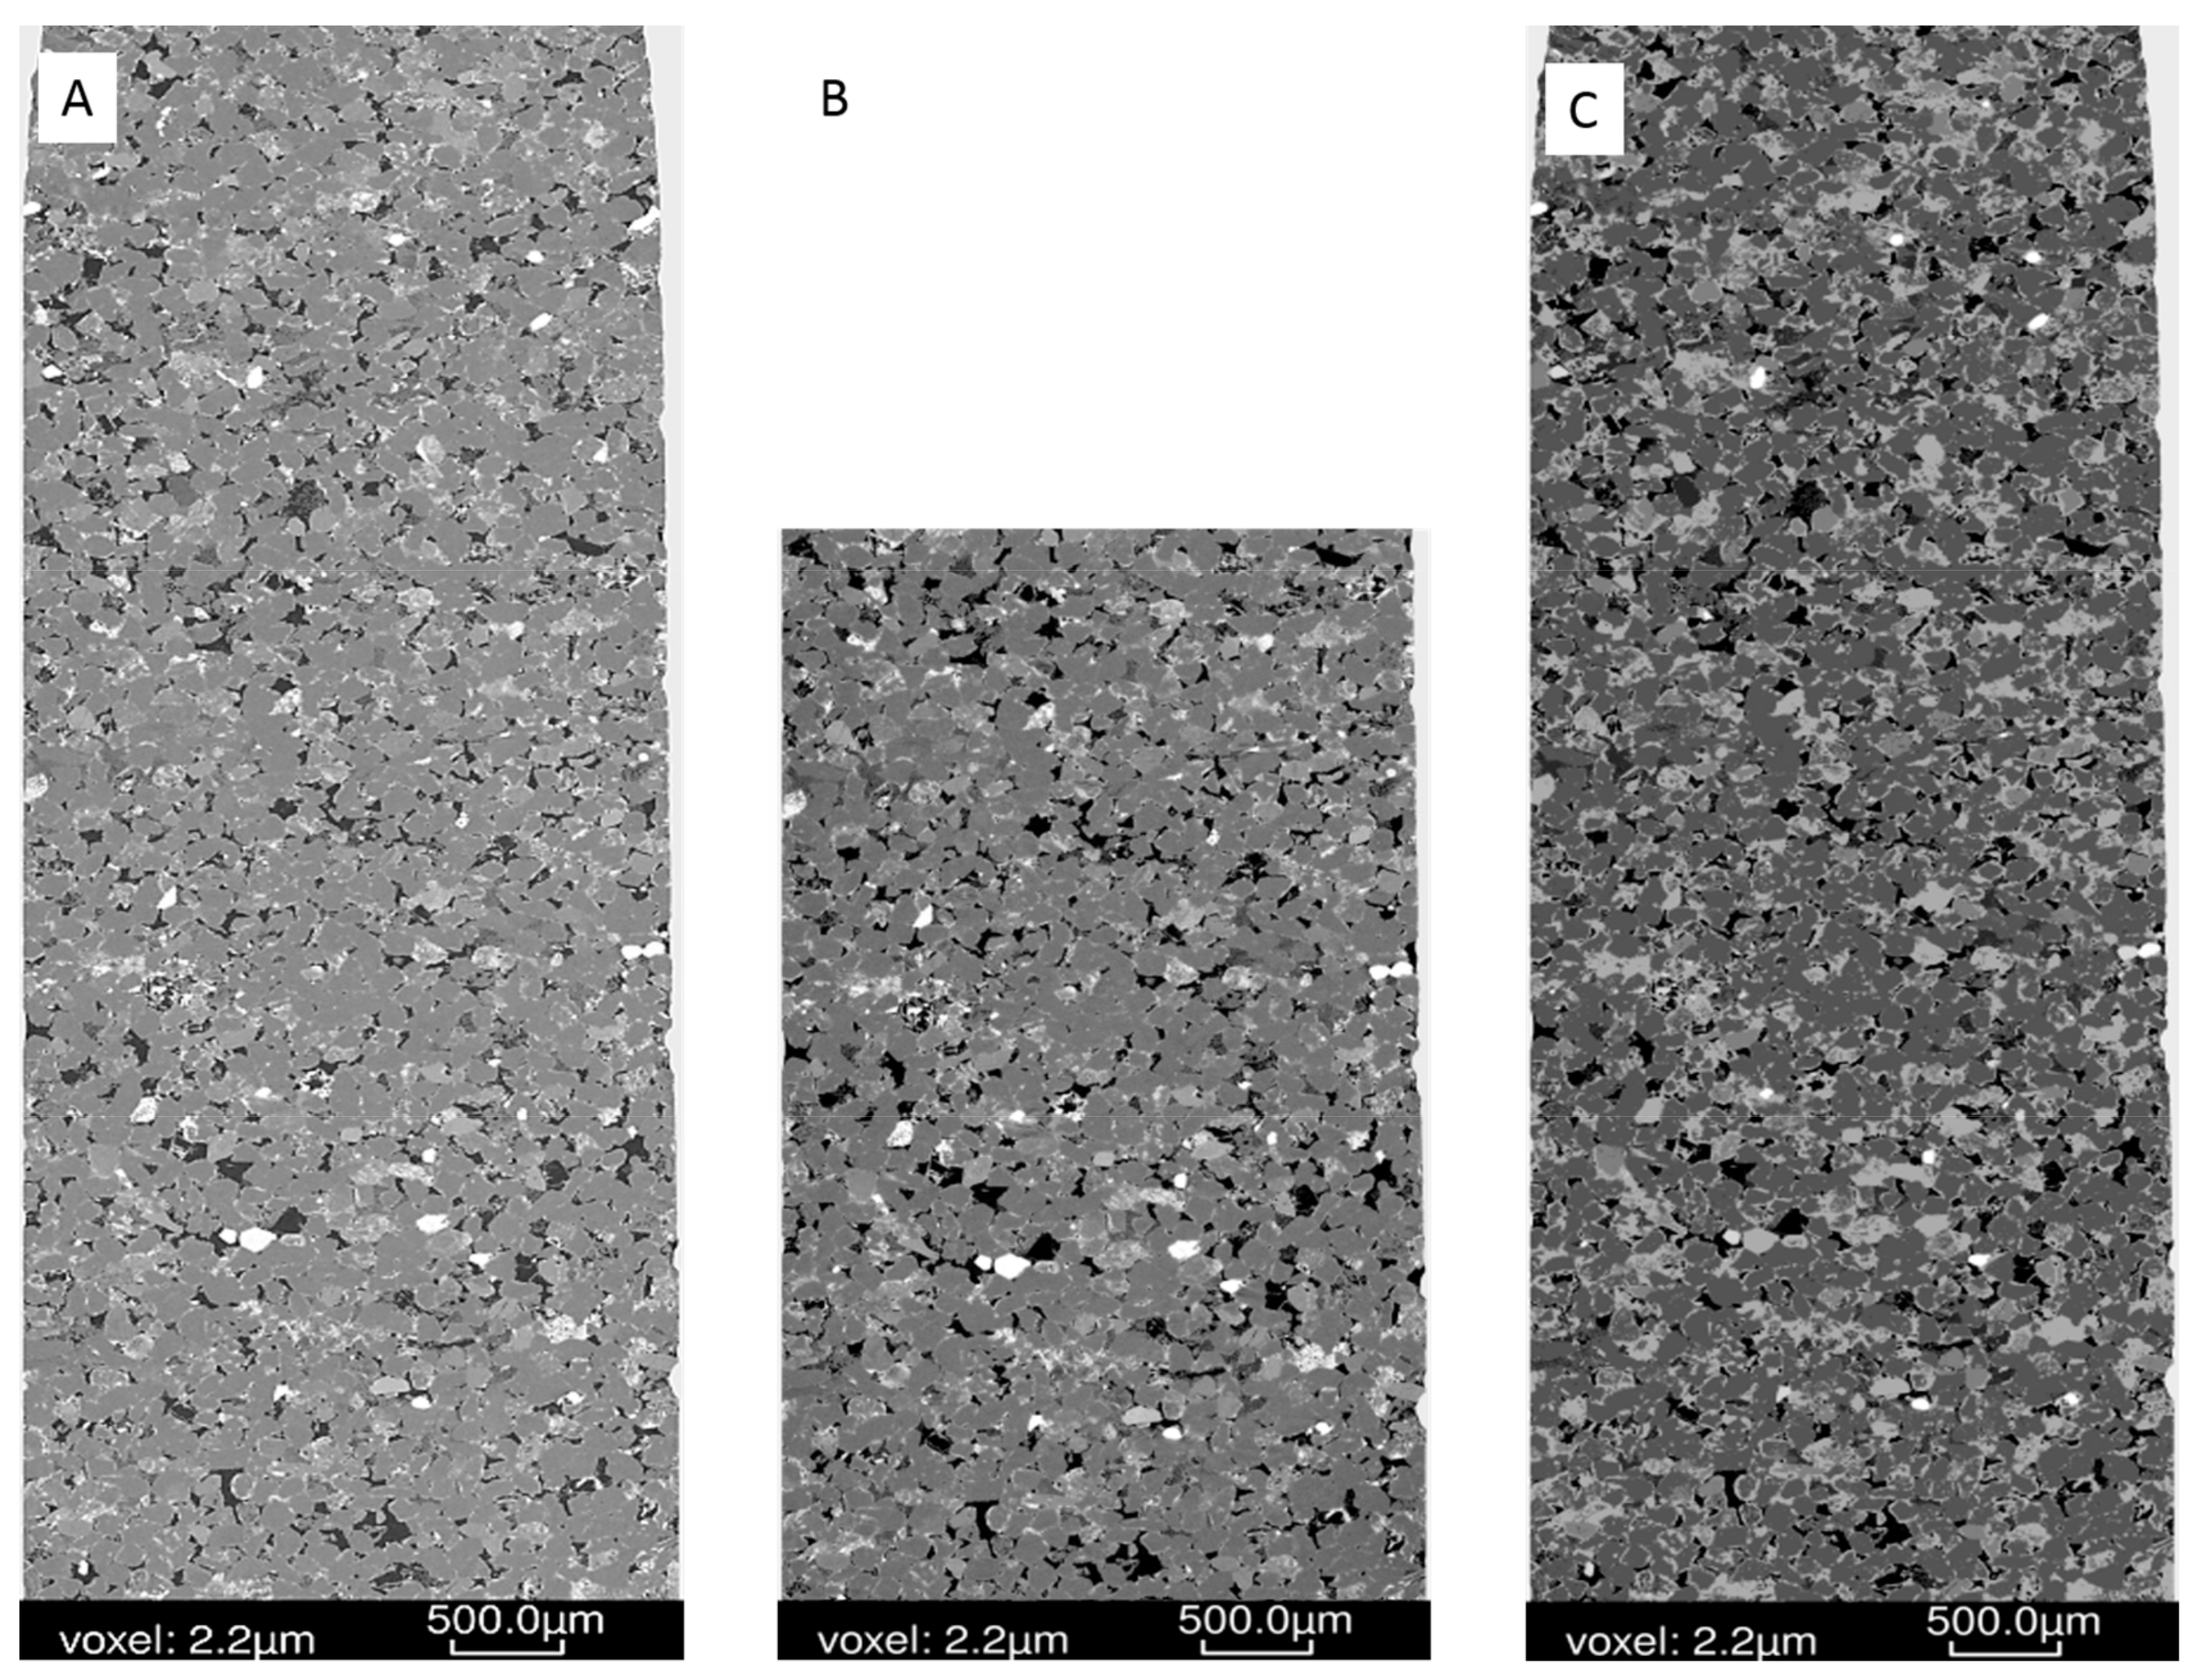
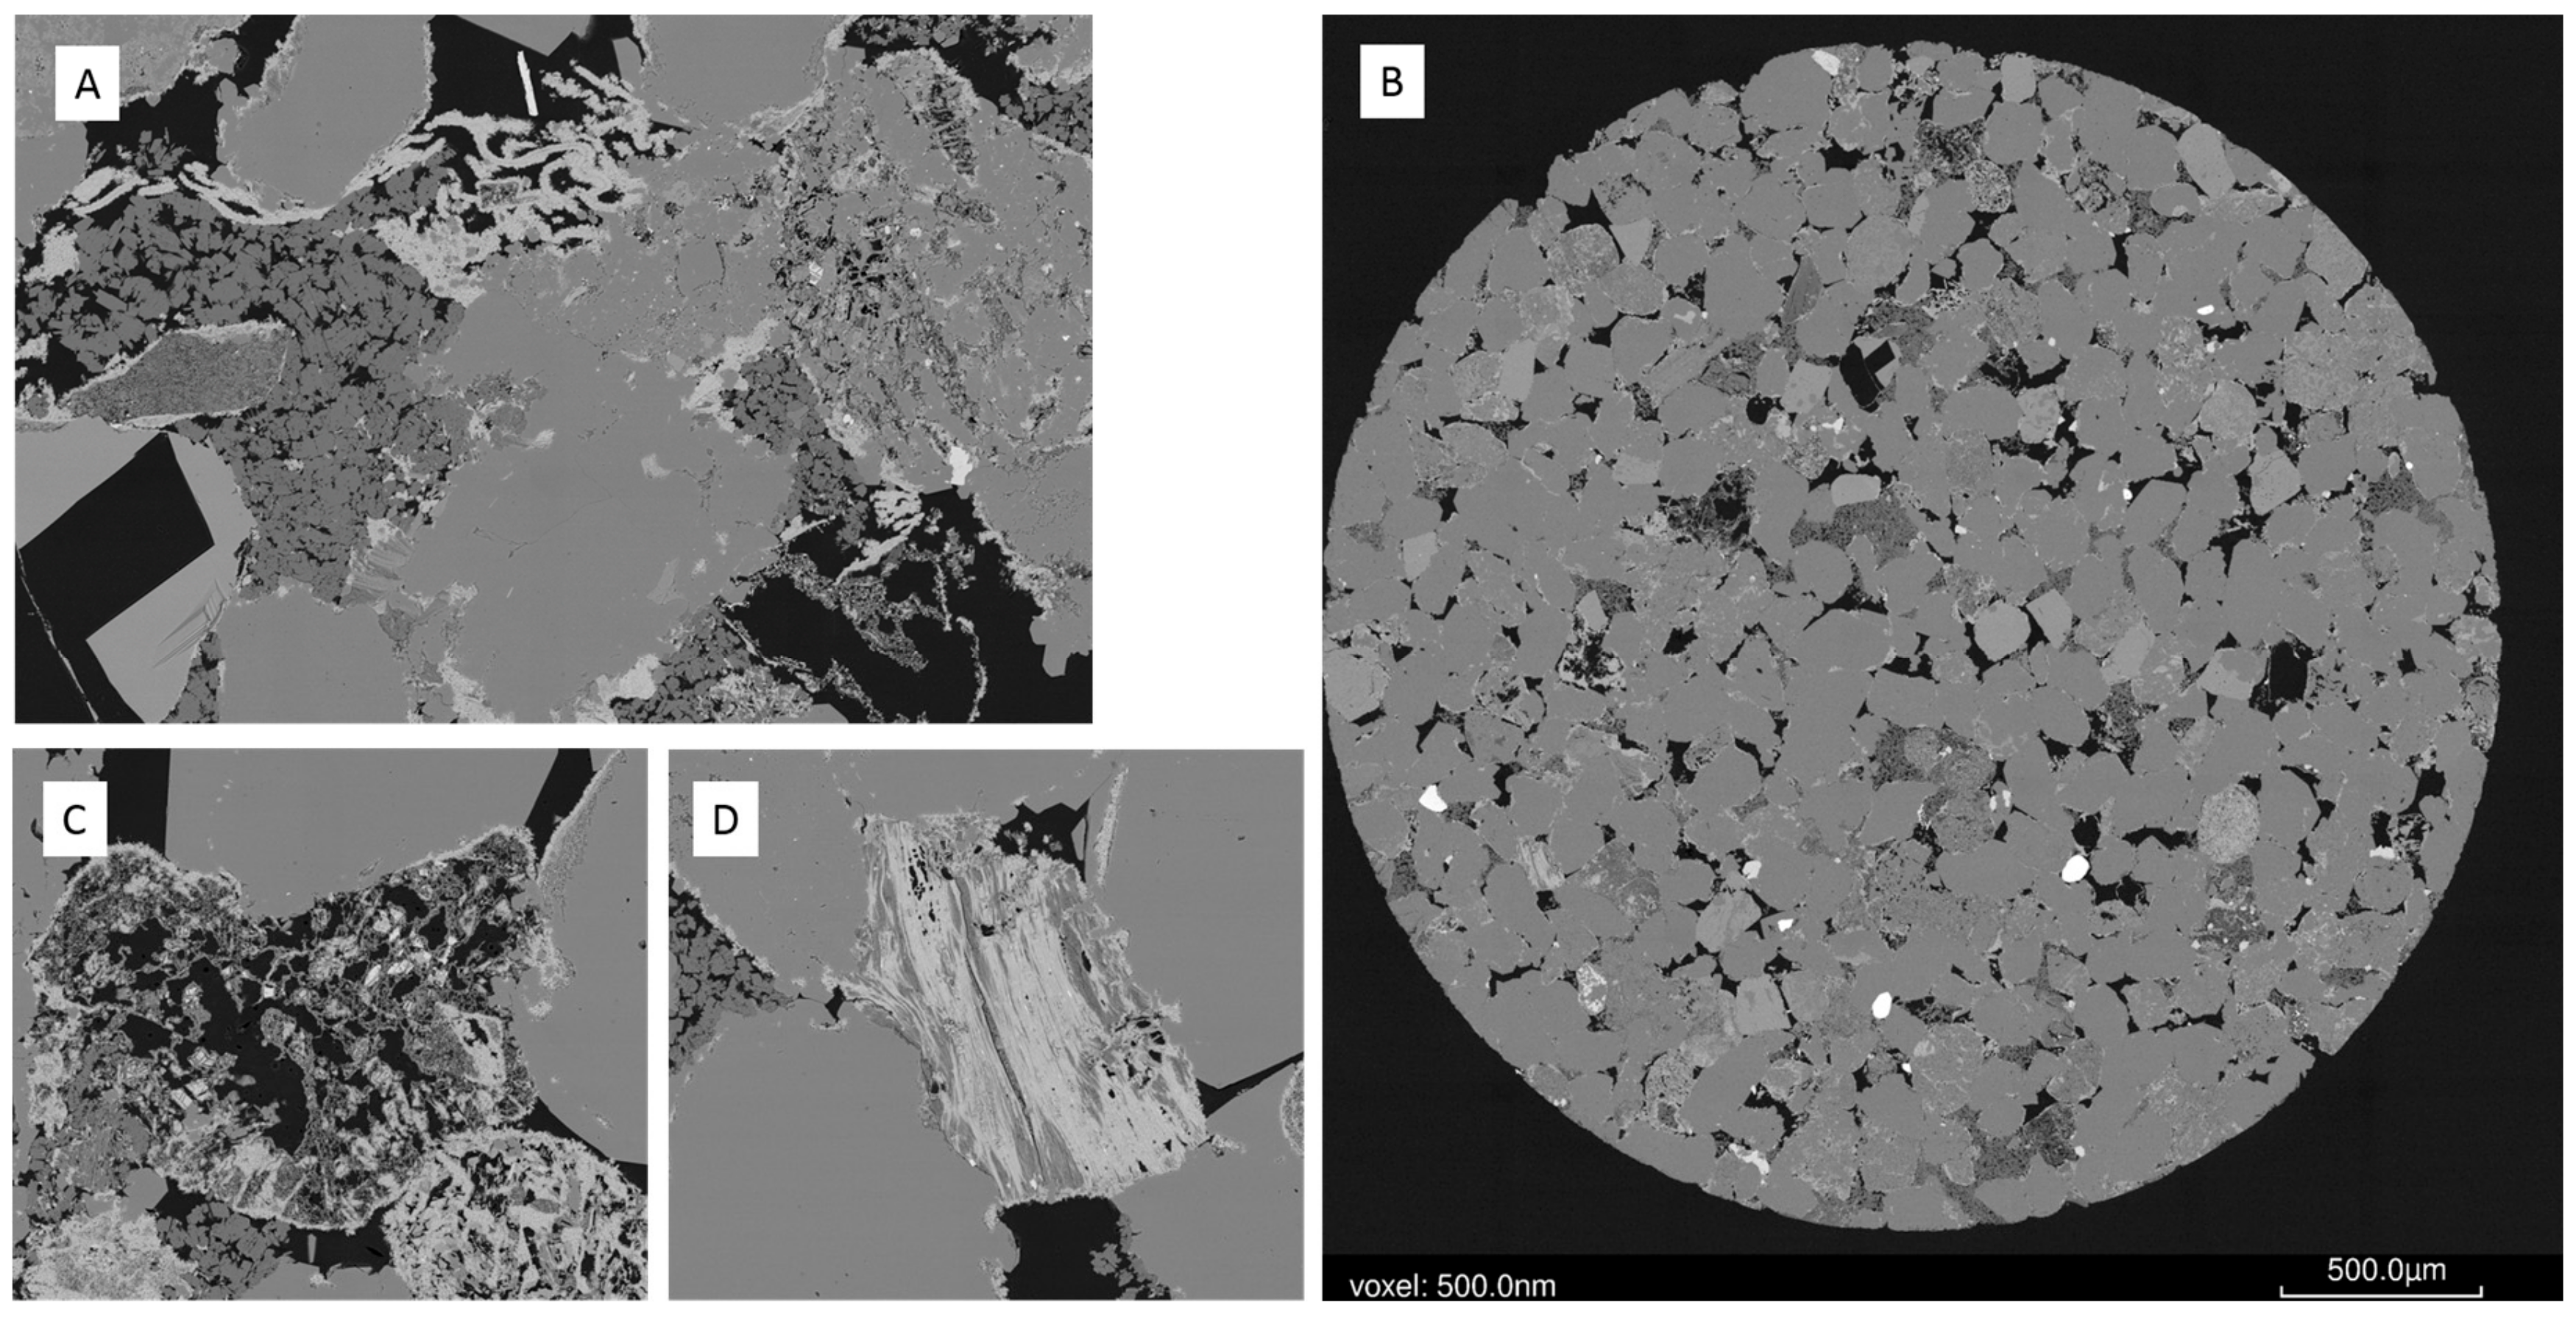
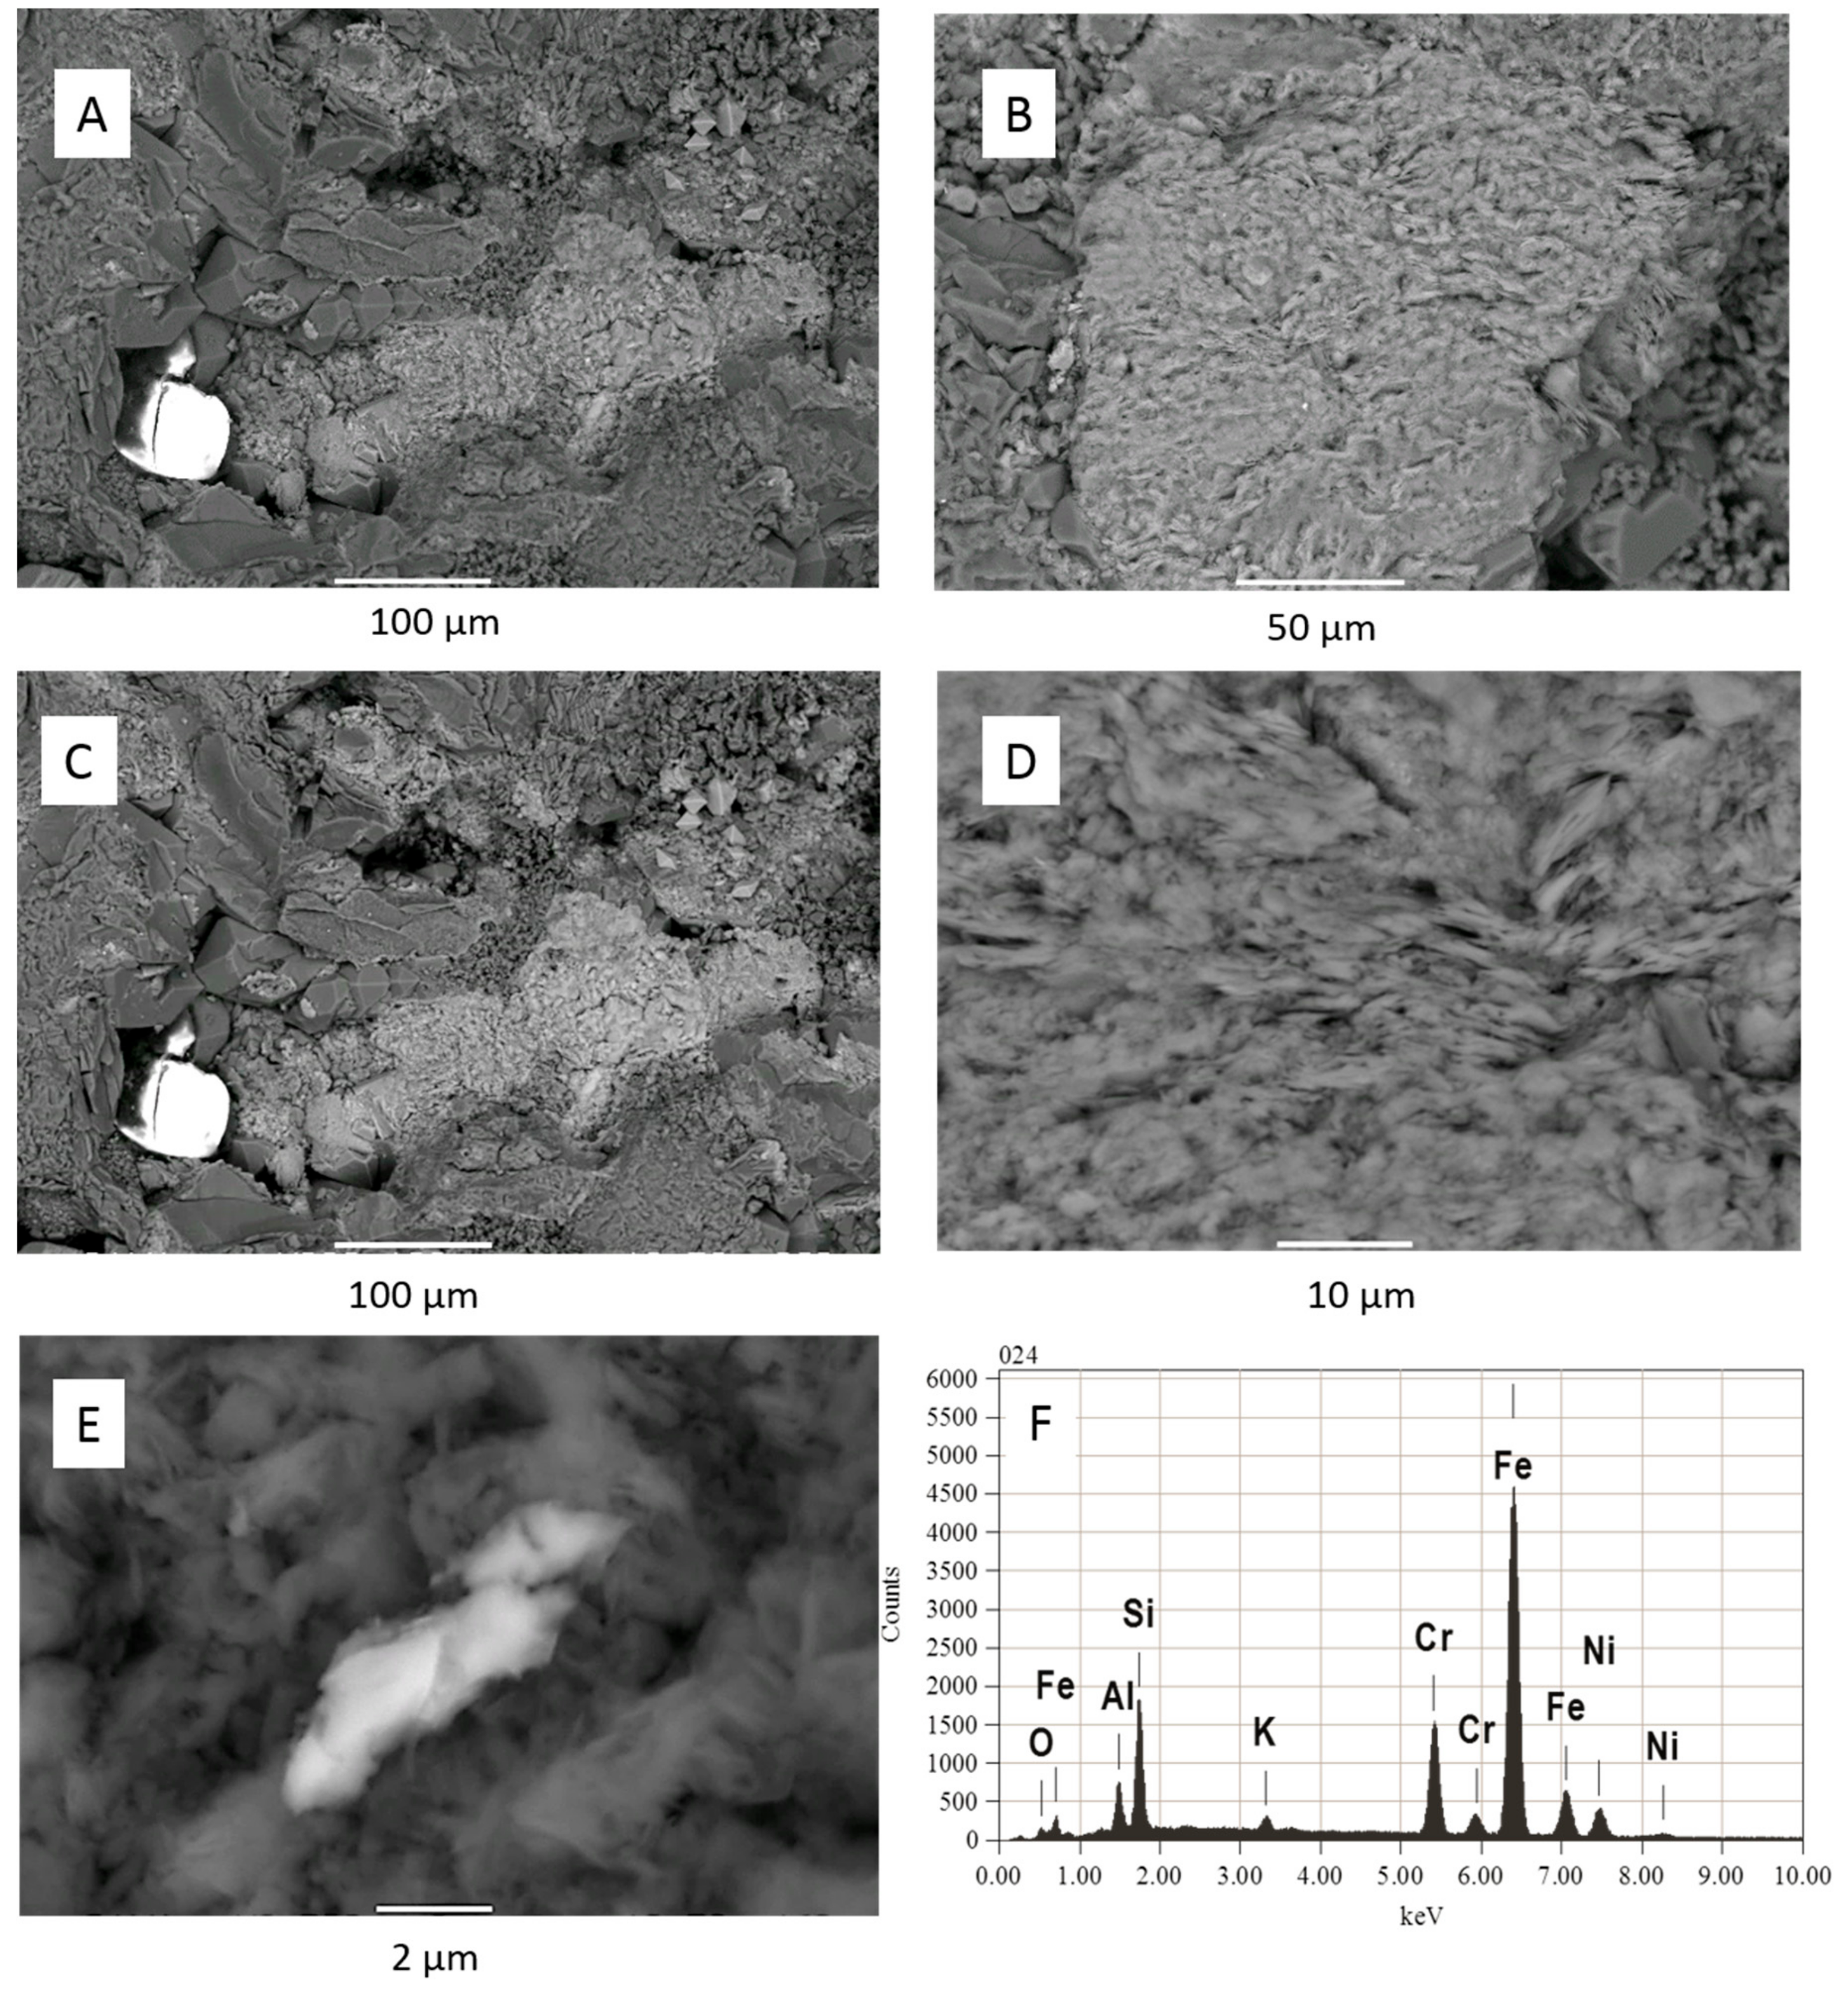
3.1. Core Characterisation

The Hutton Sandstone cores from the two wells show a variety of pore throat distributions (Figure 1A). The Chin 4828.76 m core with large pore throats corresponds to the coarsest grained sandstone with visible open pores (Figure 2A), and Chin 4835.48 m with a relatively high clay content has the majority in the range 0.01–0.1 µm (Figure 1A, Figure 2B, Figure 3). The Chin 4828.76 m sandstone corresponds to a region with high measured air permeabilities up to 1228 mD (Figure 1B). Table 1 compares the corresponding MICP porosities with those by µCT or helium (He) porosities (along with Table 2). The He porosities tend to give the highest estimates likely owing to the small size of the He molecule, with MICP and µCT values generally in reasonable agreement with each other. Selected µCT tomograms and SEM images of the Chinchilla 4 well cores are shown in Figure 2 and Figure 3. The 799.5 m core for example is calcite cemented, the 835.48 m core contains 10% chlorite which along with kaolinite fills and rims pores. QEMSCAN images and quantified mineral components by QEMSCAN or XRD are given in Supplementary Materials Figure S2, Tables S1 and S2, along with the volume % of X-ray distinct components Table S3. The WW1 cores are equally variable in lithology, including chlorite rich and calcite cemented sandstones, two also contain coal (Figure 4, and Supplementary Materials Figure S3).

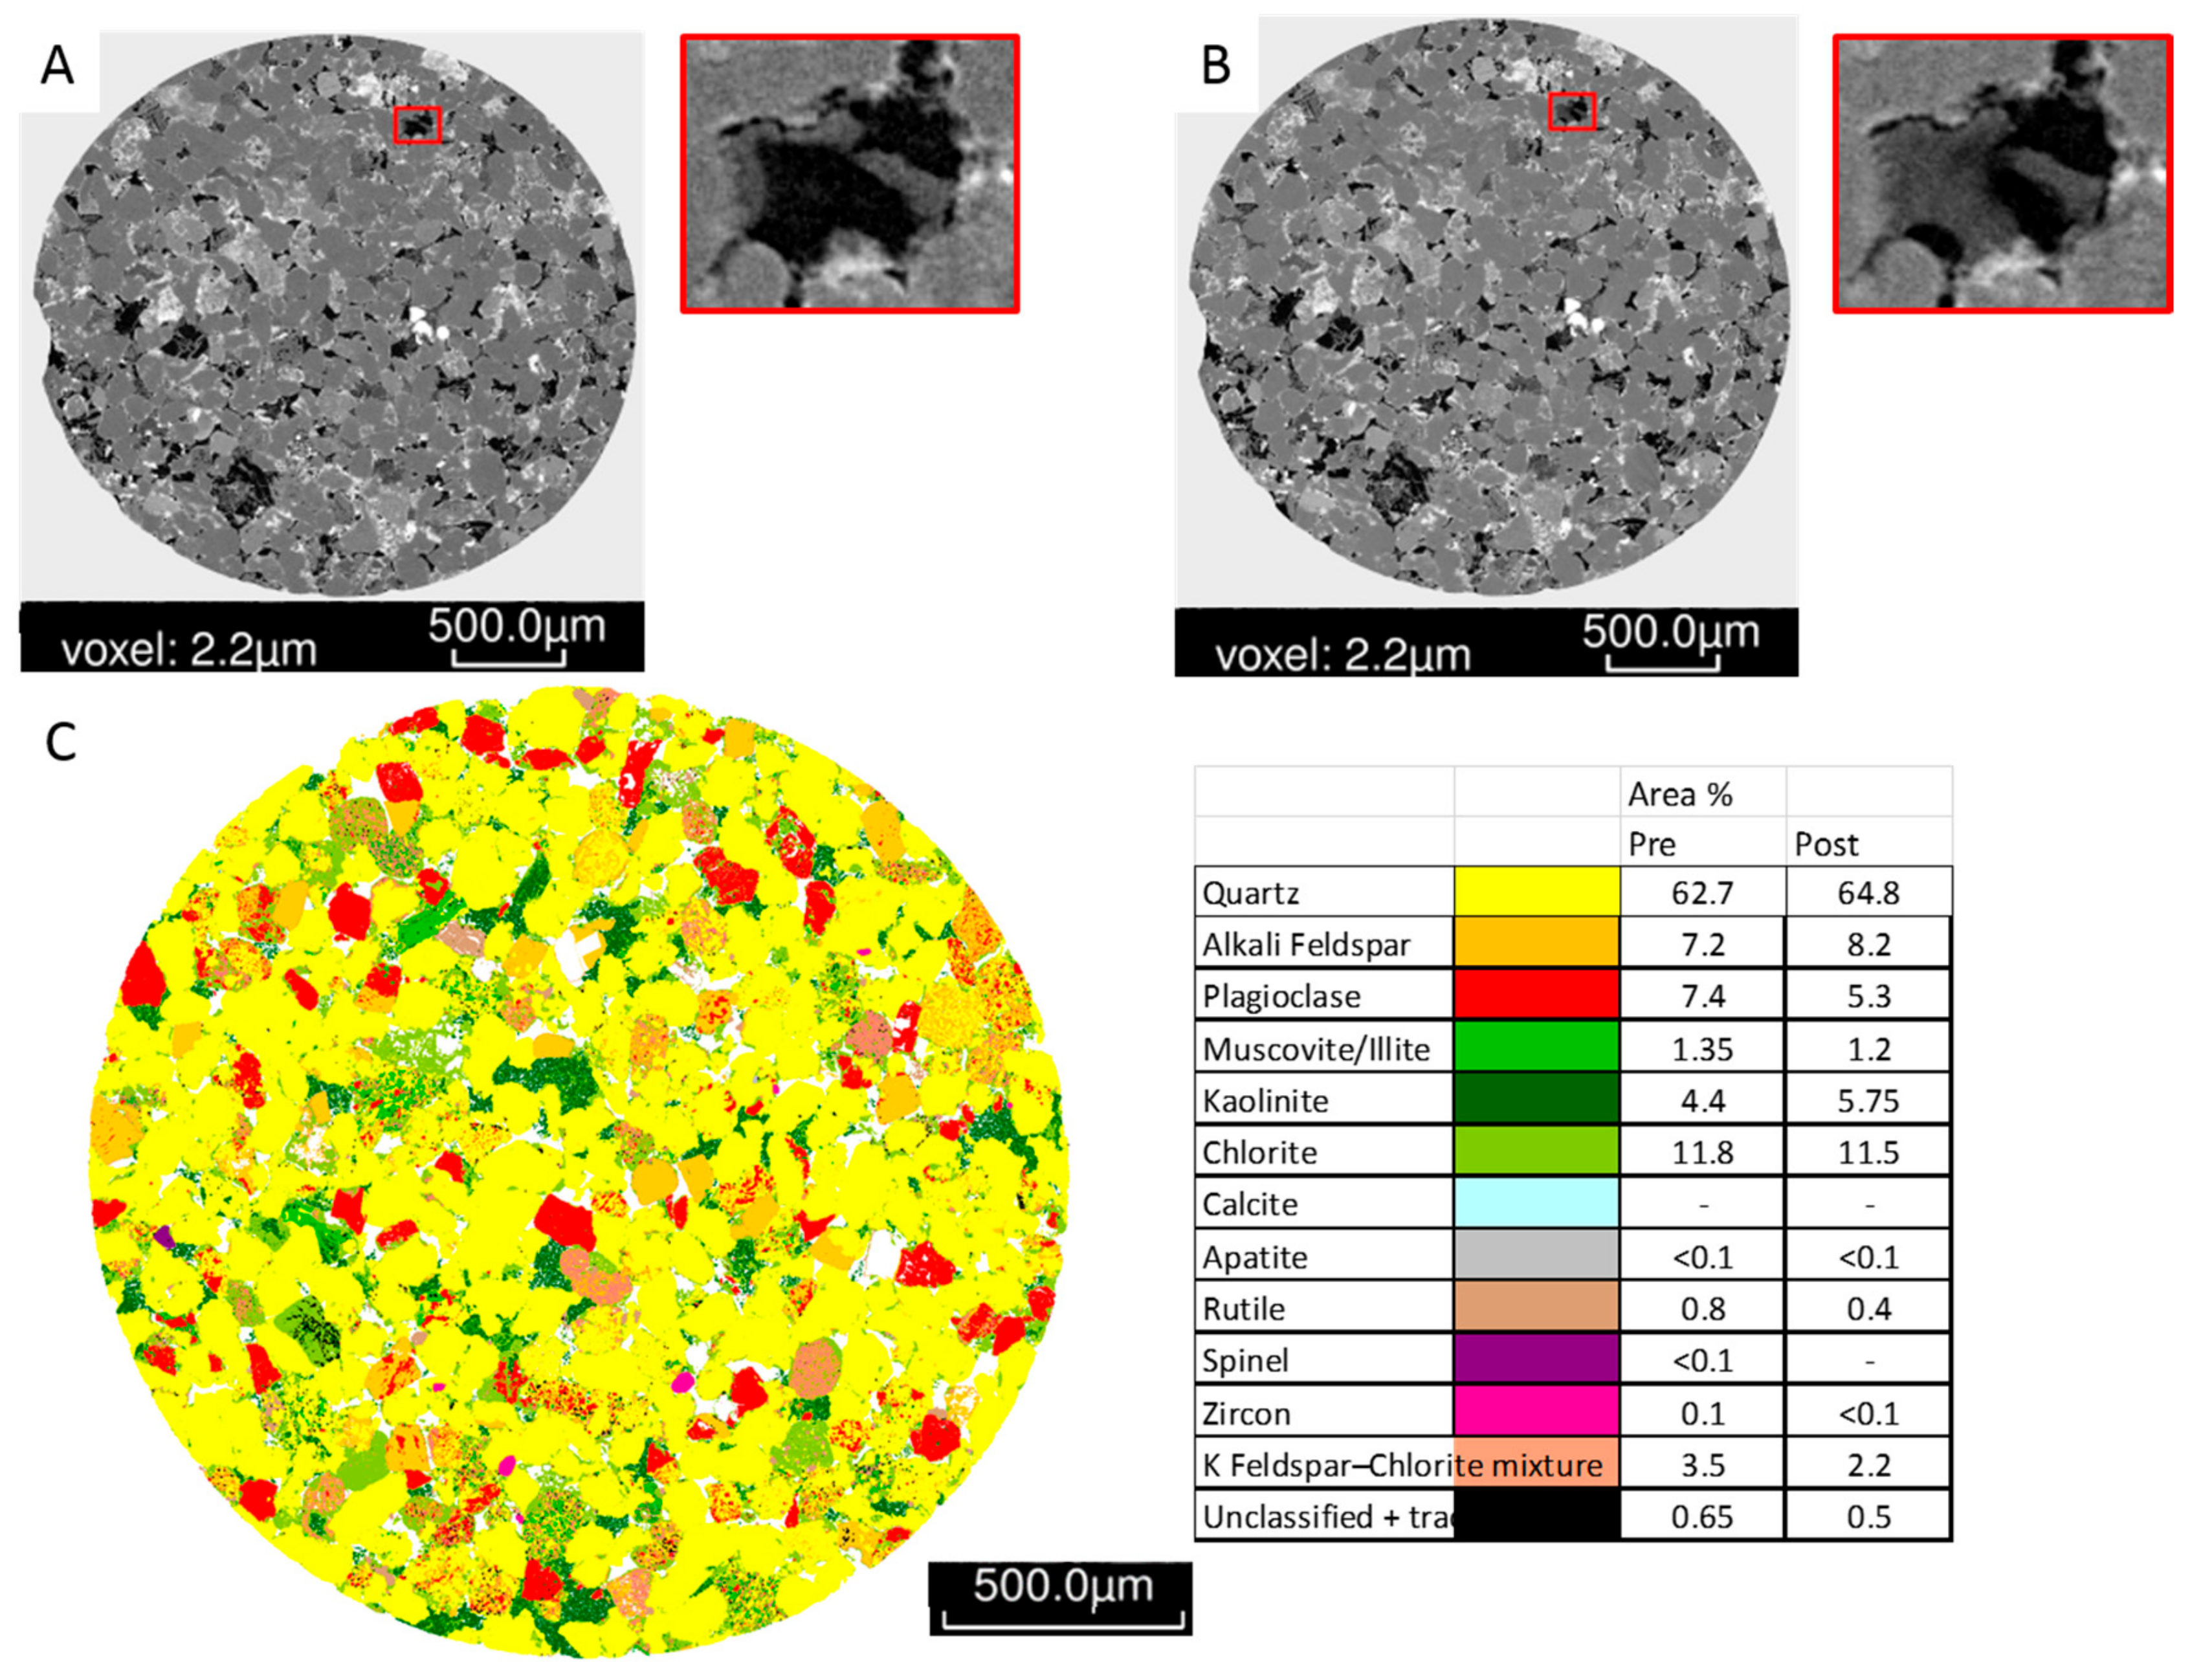
3.2. Hutton Sandstone WW1 724.1 m before and after Reaction

The chlorite rich sandstone WW1 724.1 m was reacted with CO2 and SO2 since chlorite is known to alter to siderite and ankerite mineral trapping CO2 in natural systems. The µCT image of the sub-plug before and after reaction is shown in Figure 5 along with the mineral segmentation image. The porosity did not change measurably after reaction (Table 2). SEM and QEMSCAN of a sub-plug slice before reaction show that chlorite tended to rim porosity, the sub-plug also contained ~7% plagioclase and K-feldspar (Figure 6, Figure 7). After reaction the mineral content by QEMSCAN did not appear to change significantly (Figure 7). Some movement of fine material was however observed in pores (Figure 7, and Supplementary Materials Figures S4–S6). SEM-EDS of a core block before and after reaction is shown in Figure 8. Along with the minerals identified in QEMSCAN of the sub-plug, other minerals present included Fe-Mg or Fe-Ti altered micas, phosphates containing rare earth elements, and coal. Zircon crystals were present in a band through the core, and chlorite was Fe-rich also containing Mg and Mn, S signatures were present in illite. After reaction only alteration to chlorite surfaces and loss of Fe and Ca signatures from chlorite and trace calcite/ankerite on illite were observed, with precipitation of Fe-Cr-Ni-oxides on chlorite. Rock mass decreased only slightly from 13.68 to 13.62 g after reaction.
Whole rock digest data for total metal content in the core is given in Supplementary Materials Table S5. Concentrations of U and As in the 724.1 m and other cores from WW1 were generally below 3 mg/kg. Concentrations of Pb were 9–11 mg/kg, Cr 6–40 mg/kg (with the highest in 724.1 m), and Ni 3–15 mg/kg (with again the highest concentration in 724.1 m). Rb and Li were 38–64 mg/kg (with the lowest in 724.1 m), and 9–21 mg/kg (with the highest in 724.1 m), respectively.

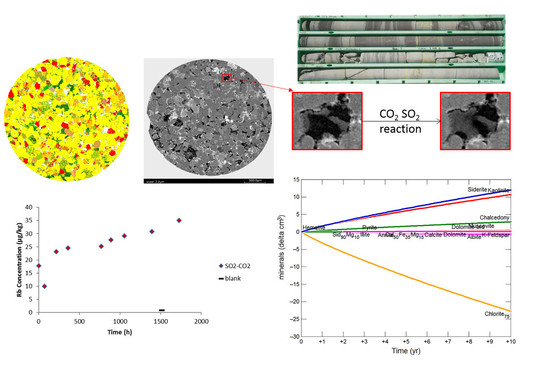
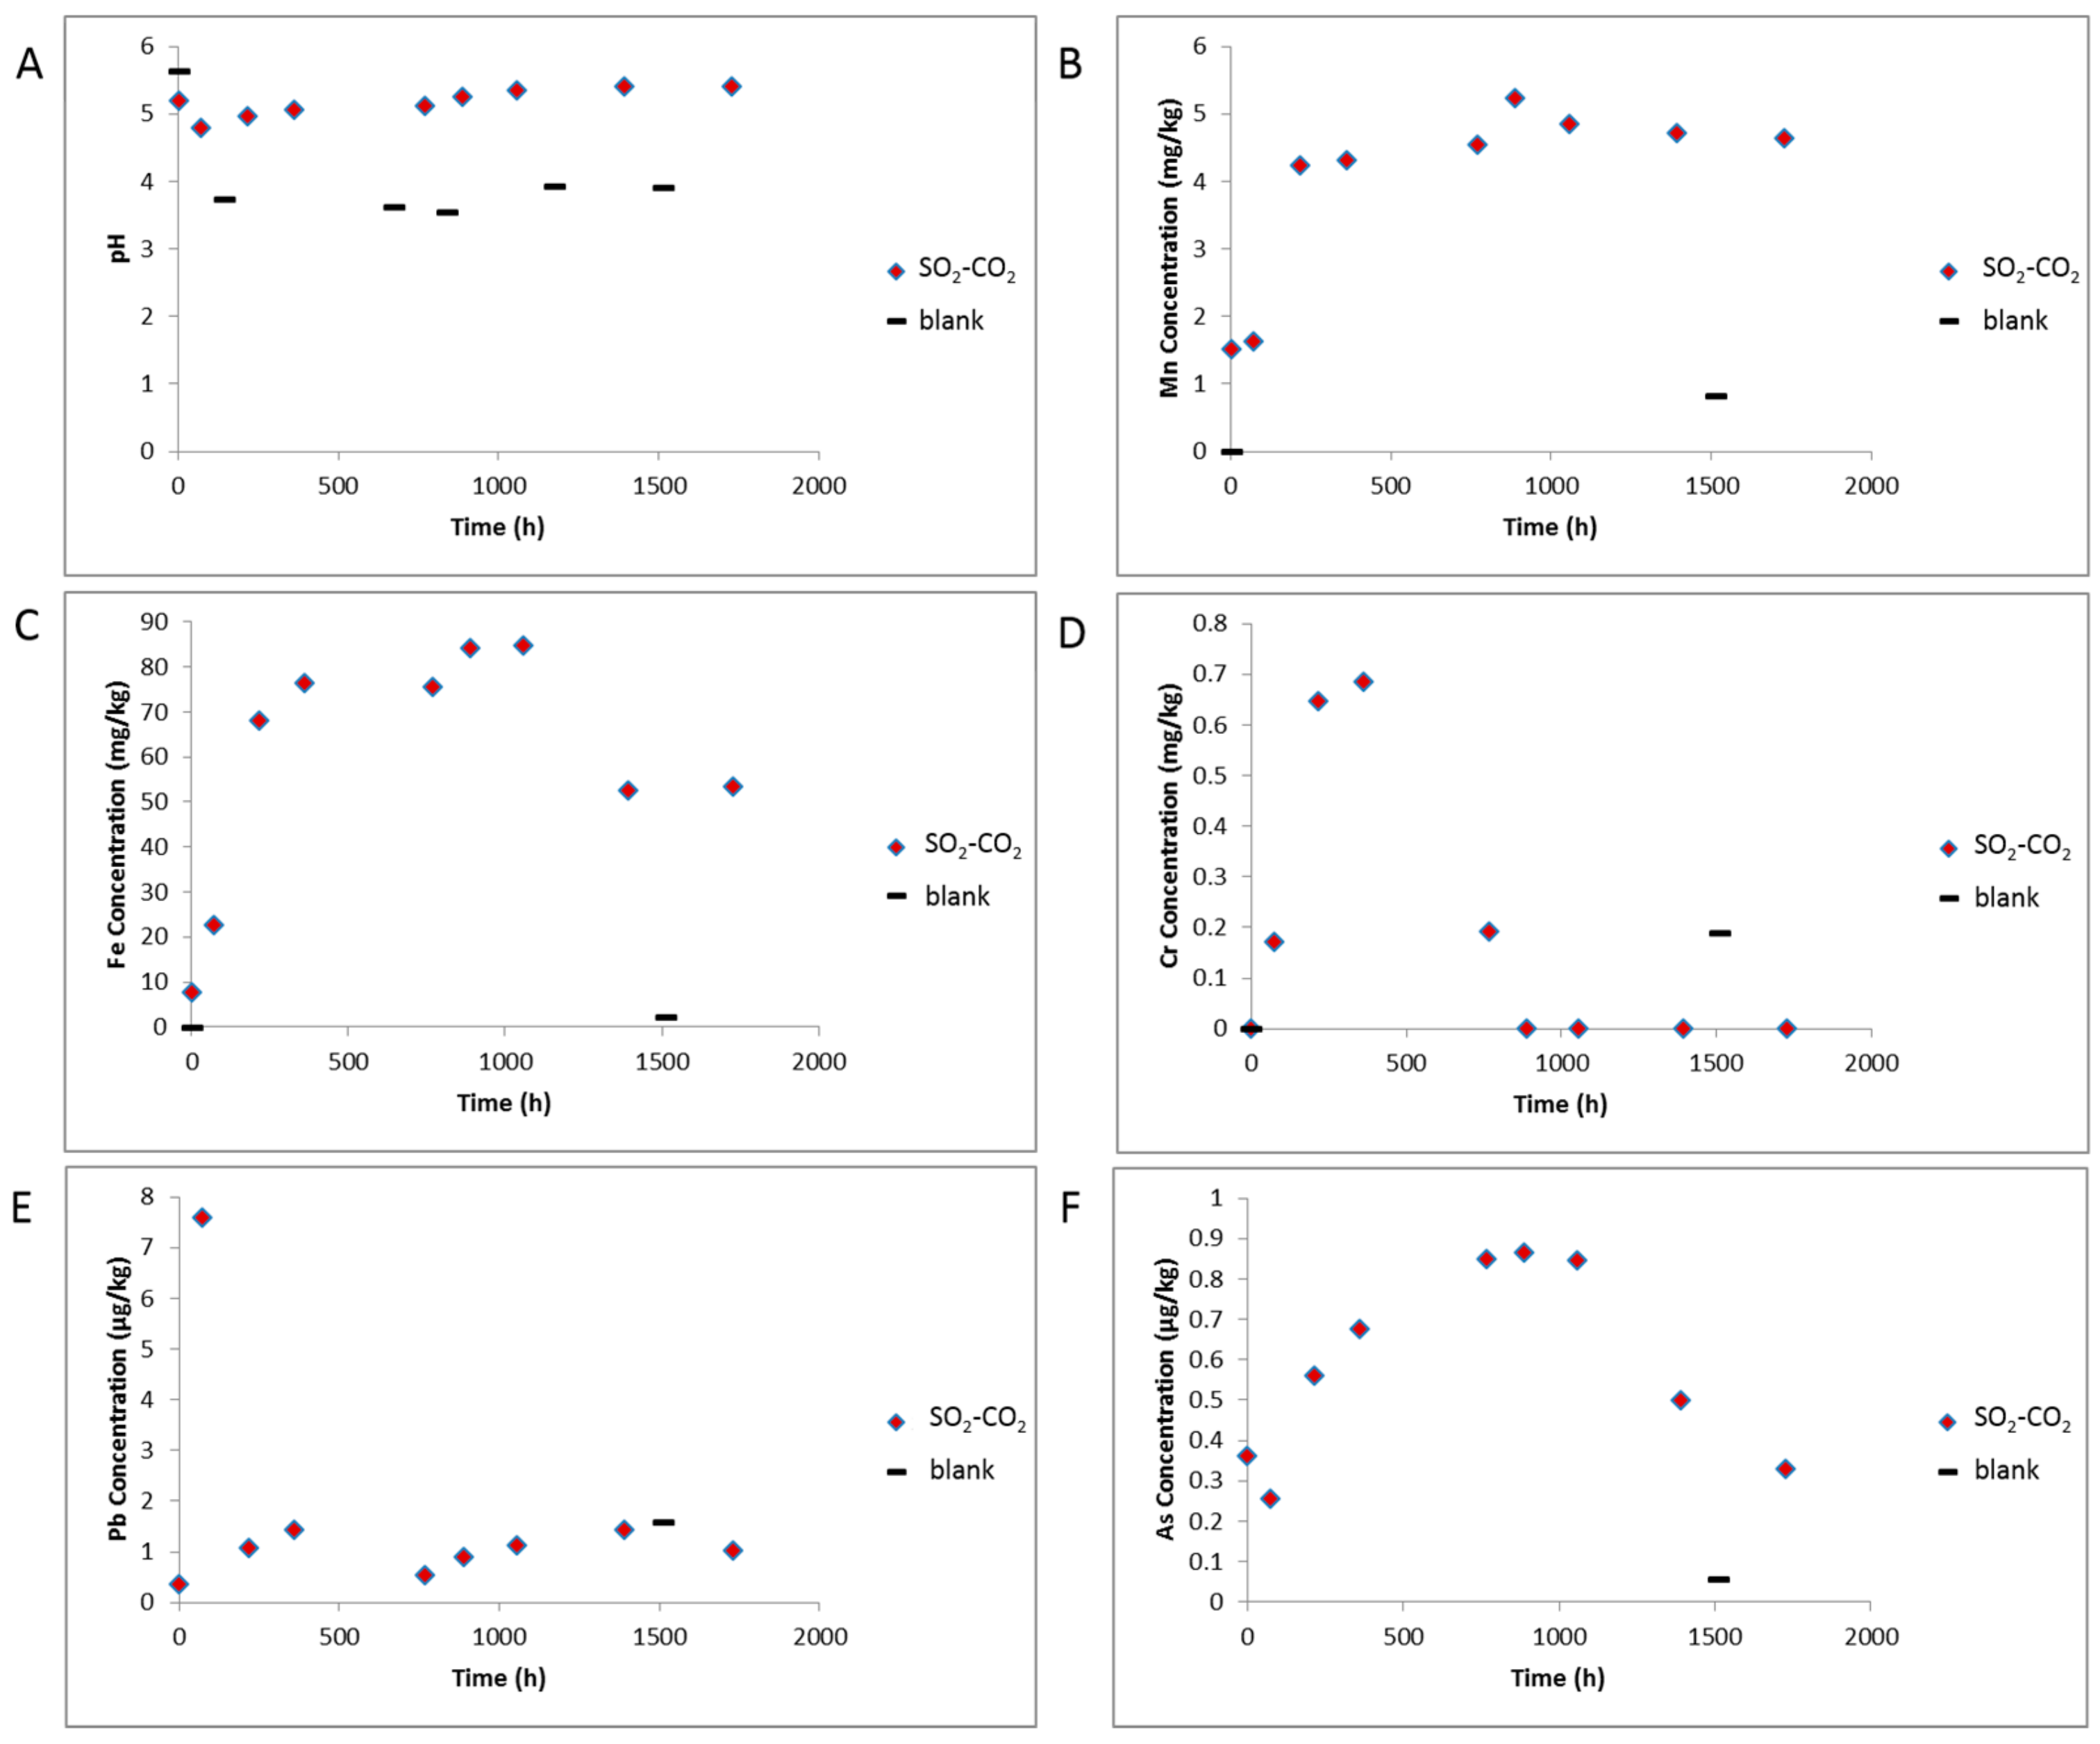
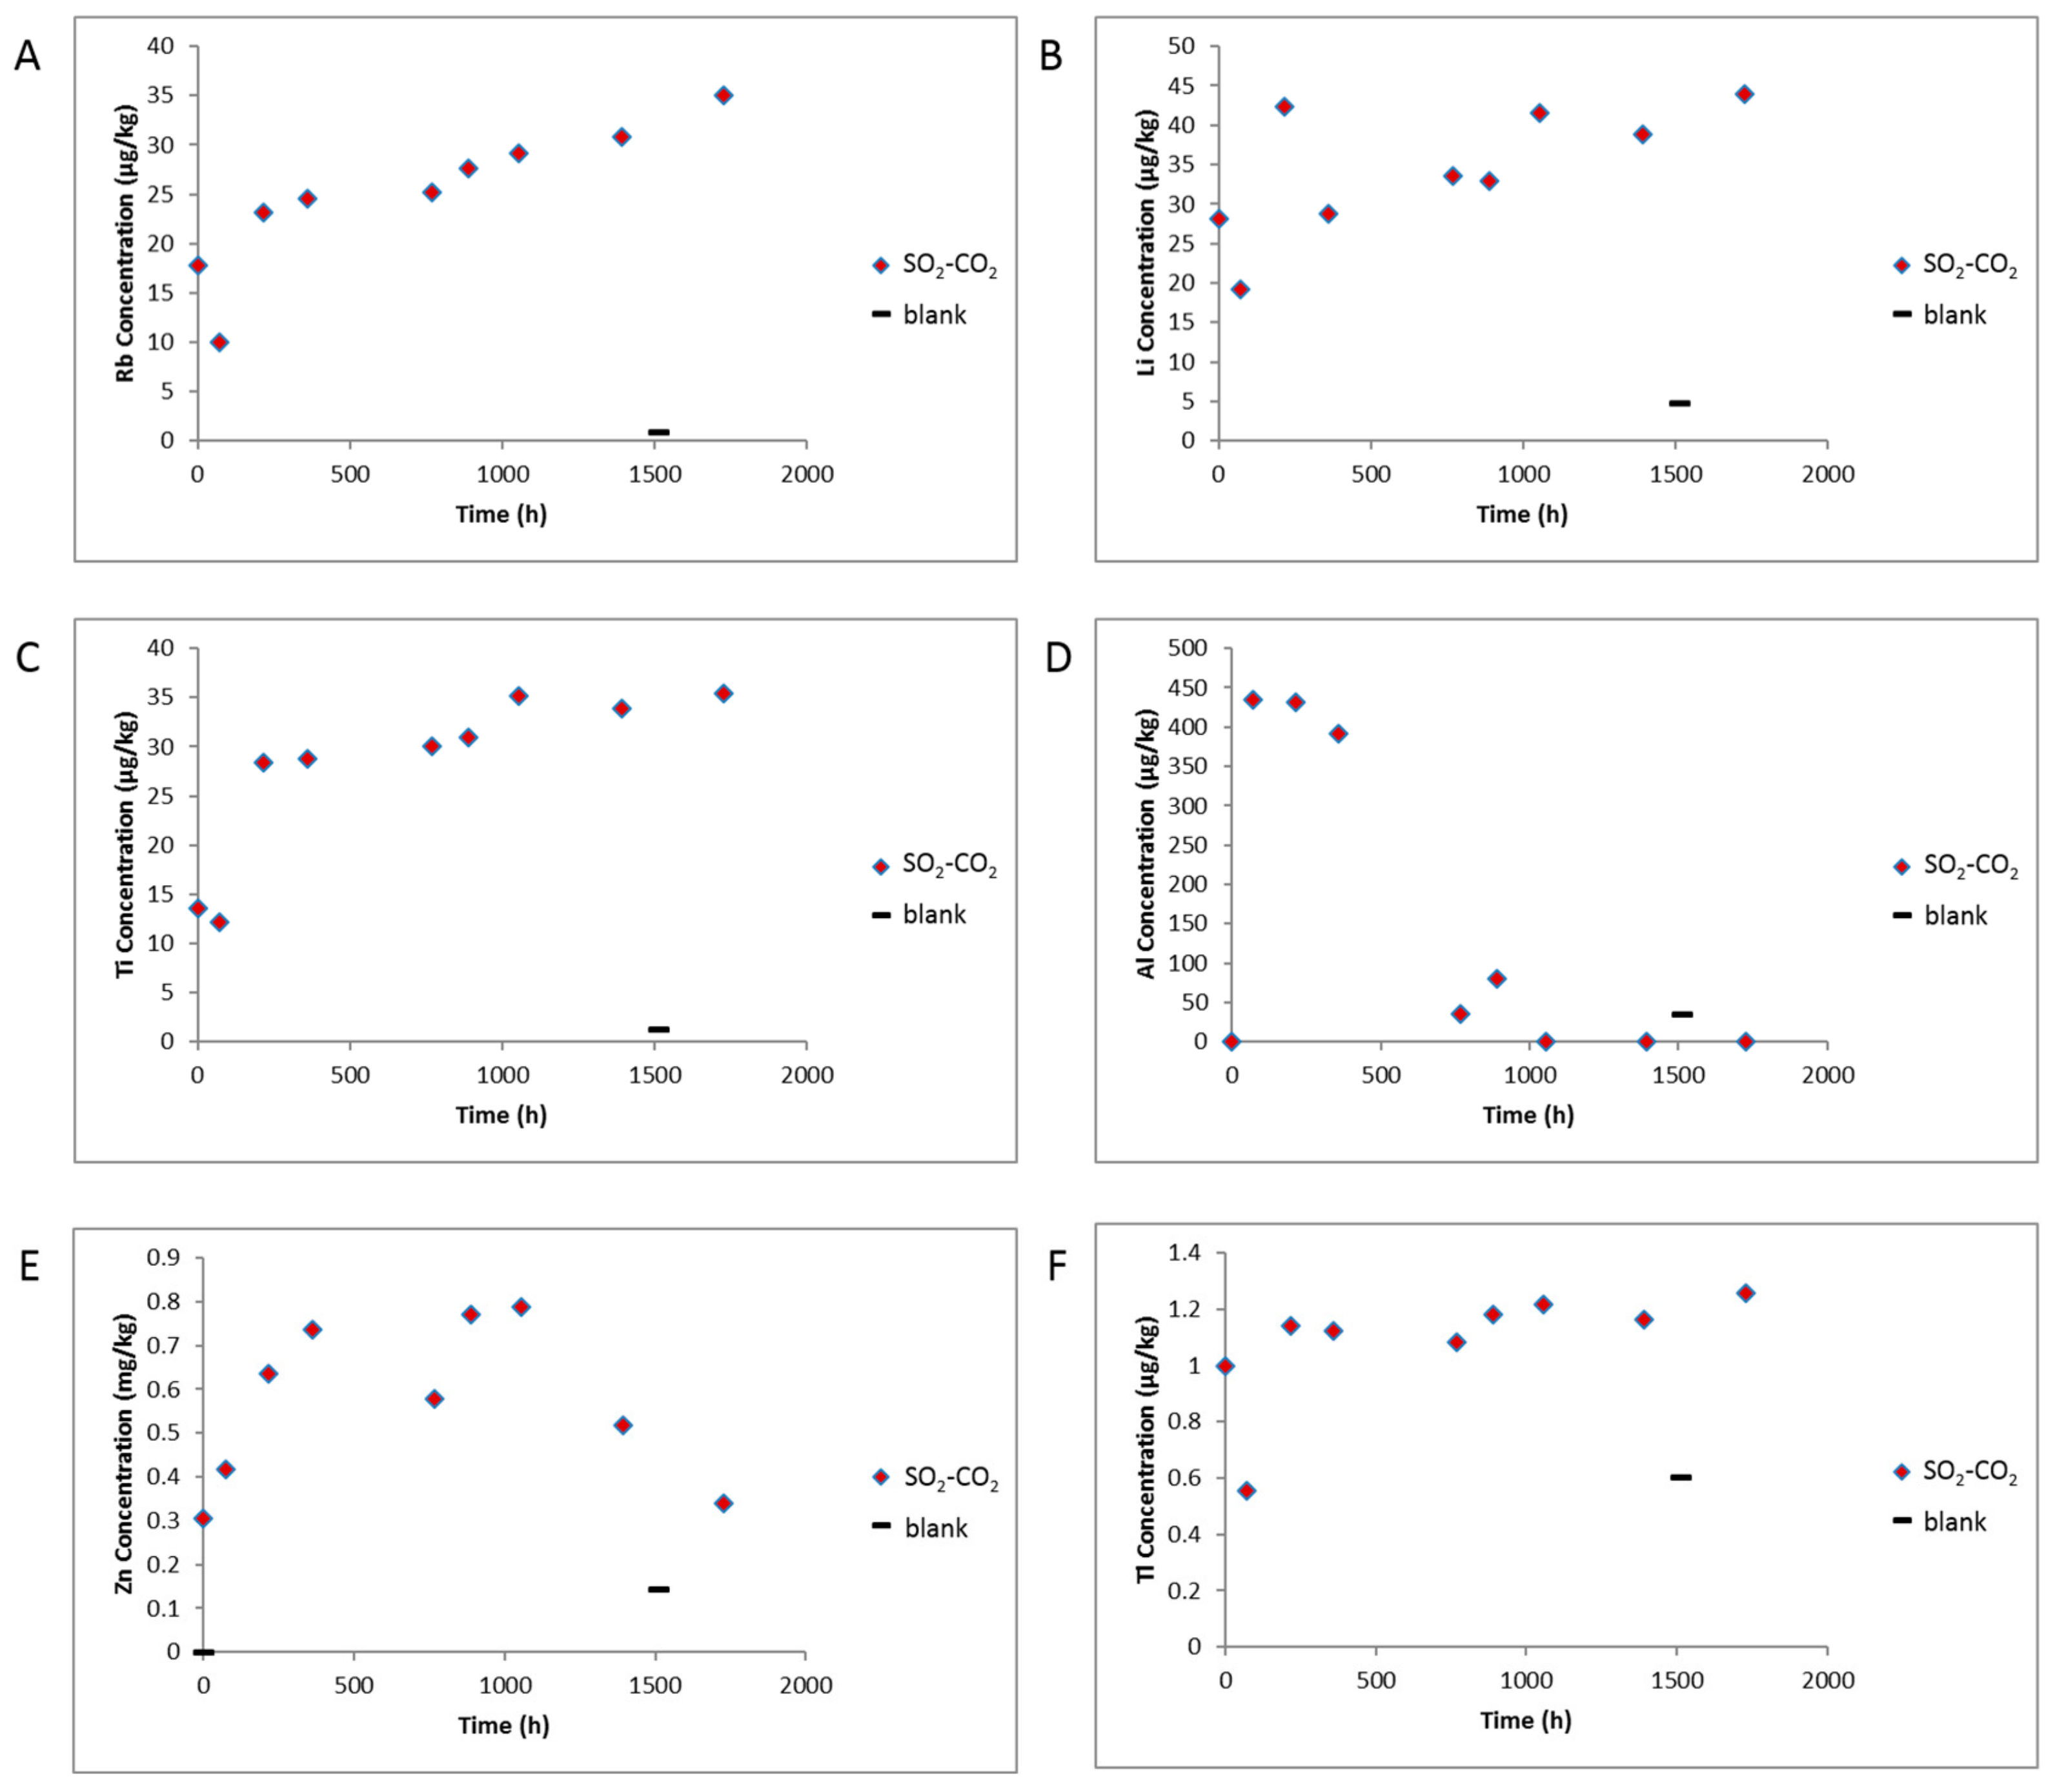
3.3. Water Chemistry during Reaction of WW1 724.1 m

The measured ex situ pH decreased from 7.5 to 5.2 after the rock—water soak period, and then to 4.8 after CO2-SO2 addition to reactors. The pH then increased slightly to 5.41 by the end of the reaction (Figure 9). The measured electrical conductivity decreased slightly from 2.79 to 2.48 ms/cm and increased to 3.57 ms/cm by the end of the experiment (Supplementary Materials Figure S7). The pH varied from 3.54 to 3.93 during the blank experiment without rock, and conductivity from 2.09 to 2.59 ms/cm indicating some pH buffering by minerals in the experiment containing the rock core. After CO2 -SO2 injection, several dissolved elements increased including Ca, Mn, Mg, Fe, Cr, As, Pb, Rb, Ti, Tl, Al, Zn, K, Si, S (Figure 9, Figure 10, Supplementary Materials Figures S7 and S8). Fe-Mg-(Mn)chlorite corrosion was observed directly in SEM images, and contributed to dissolved Fe, Mg, Mn, Si, and Al. Ni, Zn, Ti and Li can also substitute into the chlorite structure and may have been partly sourced from chlorite dissolution. Dissolution of trace amounts of calcite or ankerite/siderite would contribute to the Ca, Mg, Mn, and Fe. Tl has been shown elsewhere to substitute into and be sourced from carbonate mineral dissolution in CO2-water-rock reactions of calcite or dolomite [3]. The gradual increases in K and Rb indicate minor corrosion of feldspars or illite continuing over the reaction timescale. Several elements including Fe, As, Zn, Al, Ca, had a decreasing trend after ~1000 h, with dissolved concentrations of Cr, Pb, Al, Ba, decreasing significantly before ~500 h. These were likely either adsorbed or precipitated onto rock surfaces e.g., in the precipitated oxide minerals observed or as surface coatings. Barite precipitation was not directly observed however its low solubility, the decreasing dissolved Ba, and the presence of dissolved S indicates its likely precipitation. Barite precipitation has been directly observed in other CO2-SO2-water rock reactions of calcite cemented sandstone where higher concentrations of SO2 (0.16%) were used [25,37]. The rock surfaces had a brown coloration after reaction supporting precipitation of Fe-containing minerals as surface coatings that may not have been visible in SEM images (Supplementary Materials Figure S9). Dissolved Ni was variable and appeared to increase at the end of reaction with the blank experiment indicating some potential contribution from the reactor. Dissolved Cr concentration at the end of the blank experiment was higher than the experiment with the rock present also indicating some contribution from the reactor. The reason for the lower Cr concentration at the end of the experiment with rock present may be owing to the higher pH (therefore less reactor corrosion), or likely the precipitation of Cr containing minerals seen on the rock surface. The dissolved concentrations of Pb, U and As were relatively low at less than 8, 1 and 1 µg/kg, respectively, during the reaction.
Total S was 4.6 mg/kg after the N2-low salinity water-rock soak indicating some trace pyrite or sphalerite may have reacted or adsorbed S released, this may have also contributed to the decrease in pH. Sphalerite is acid reactive, and reaction would also have contributed to the increase in dissolved Zn and metals such as Pb and As. While it was not directly observed in 724.1 m core here, trace amounts of sphalerite have been observed sporadically in other Hutton Sandstone sections e.g., 800.7 m. Total S increased to 14.4 after CO2-SO2 injection and reached 18.5 mg/kg at the end of reaction. Alkalinity was in the bicarbonate form at 358 mg/kg, and Cl was 845 mg/kg on experiment termination. This is lower that might be expected from the initial salinity and indicates either minor salt precipitation, or adsorption onto clays and surfaces. Dissolved total carbon, total organic carbon, inorganic carbon and sulphate measured during reaction are shown in Supplementary Materials Figure S7.

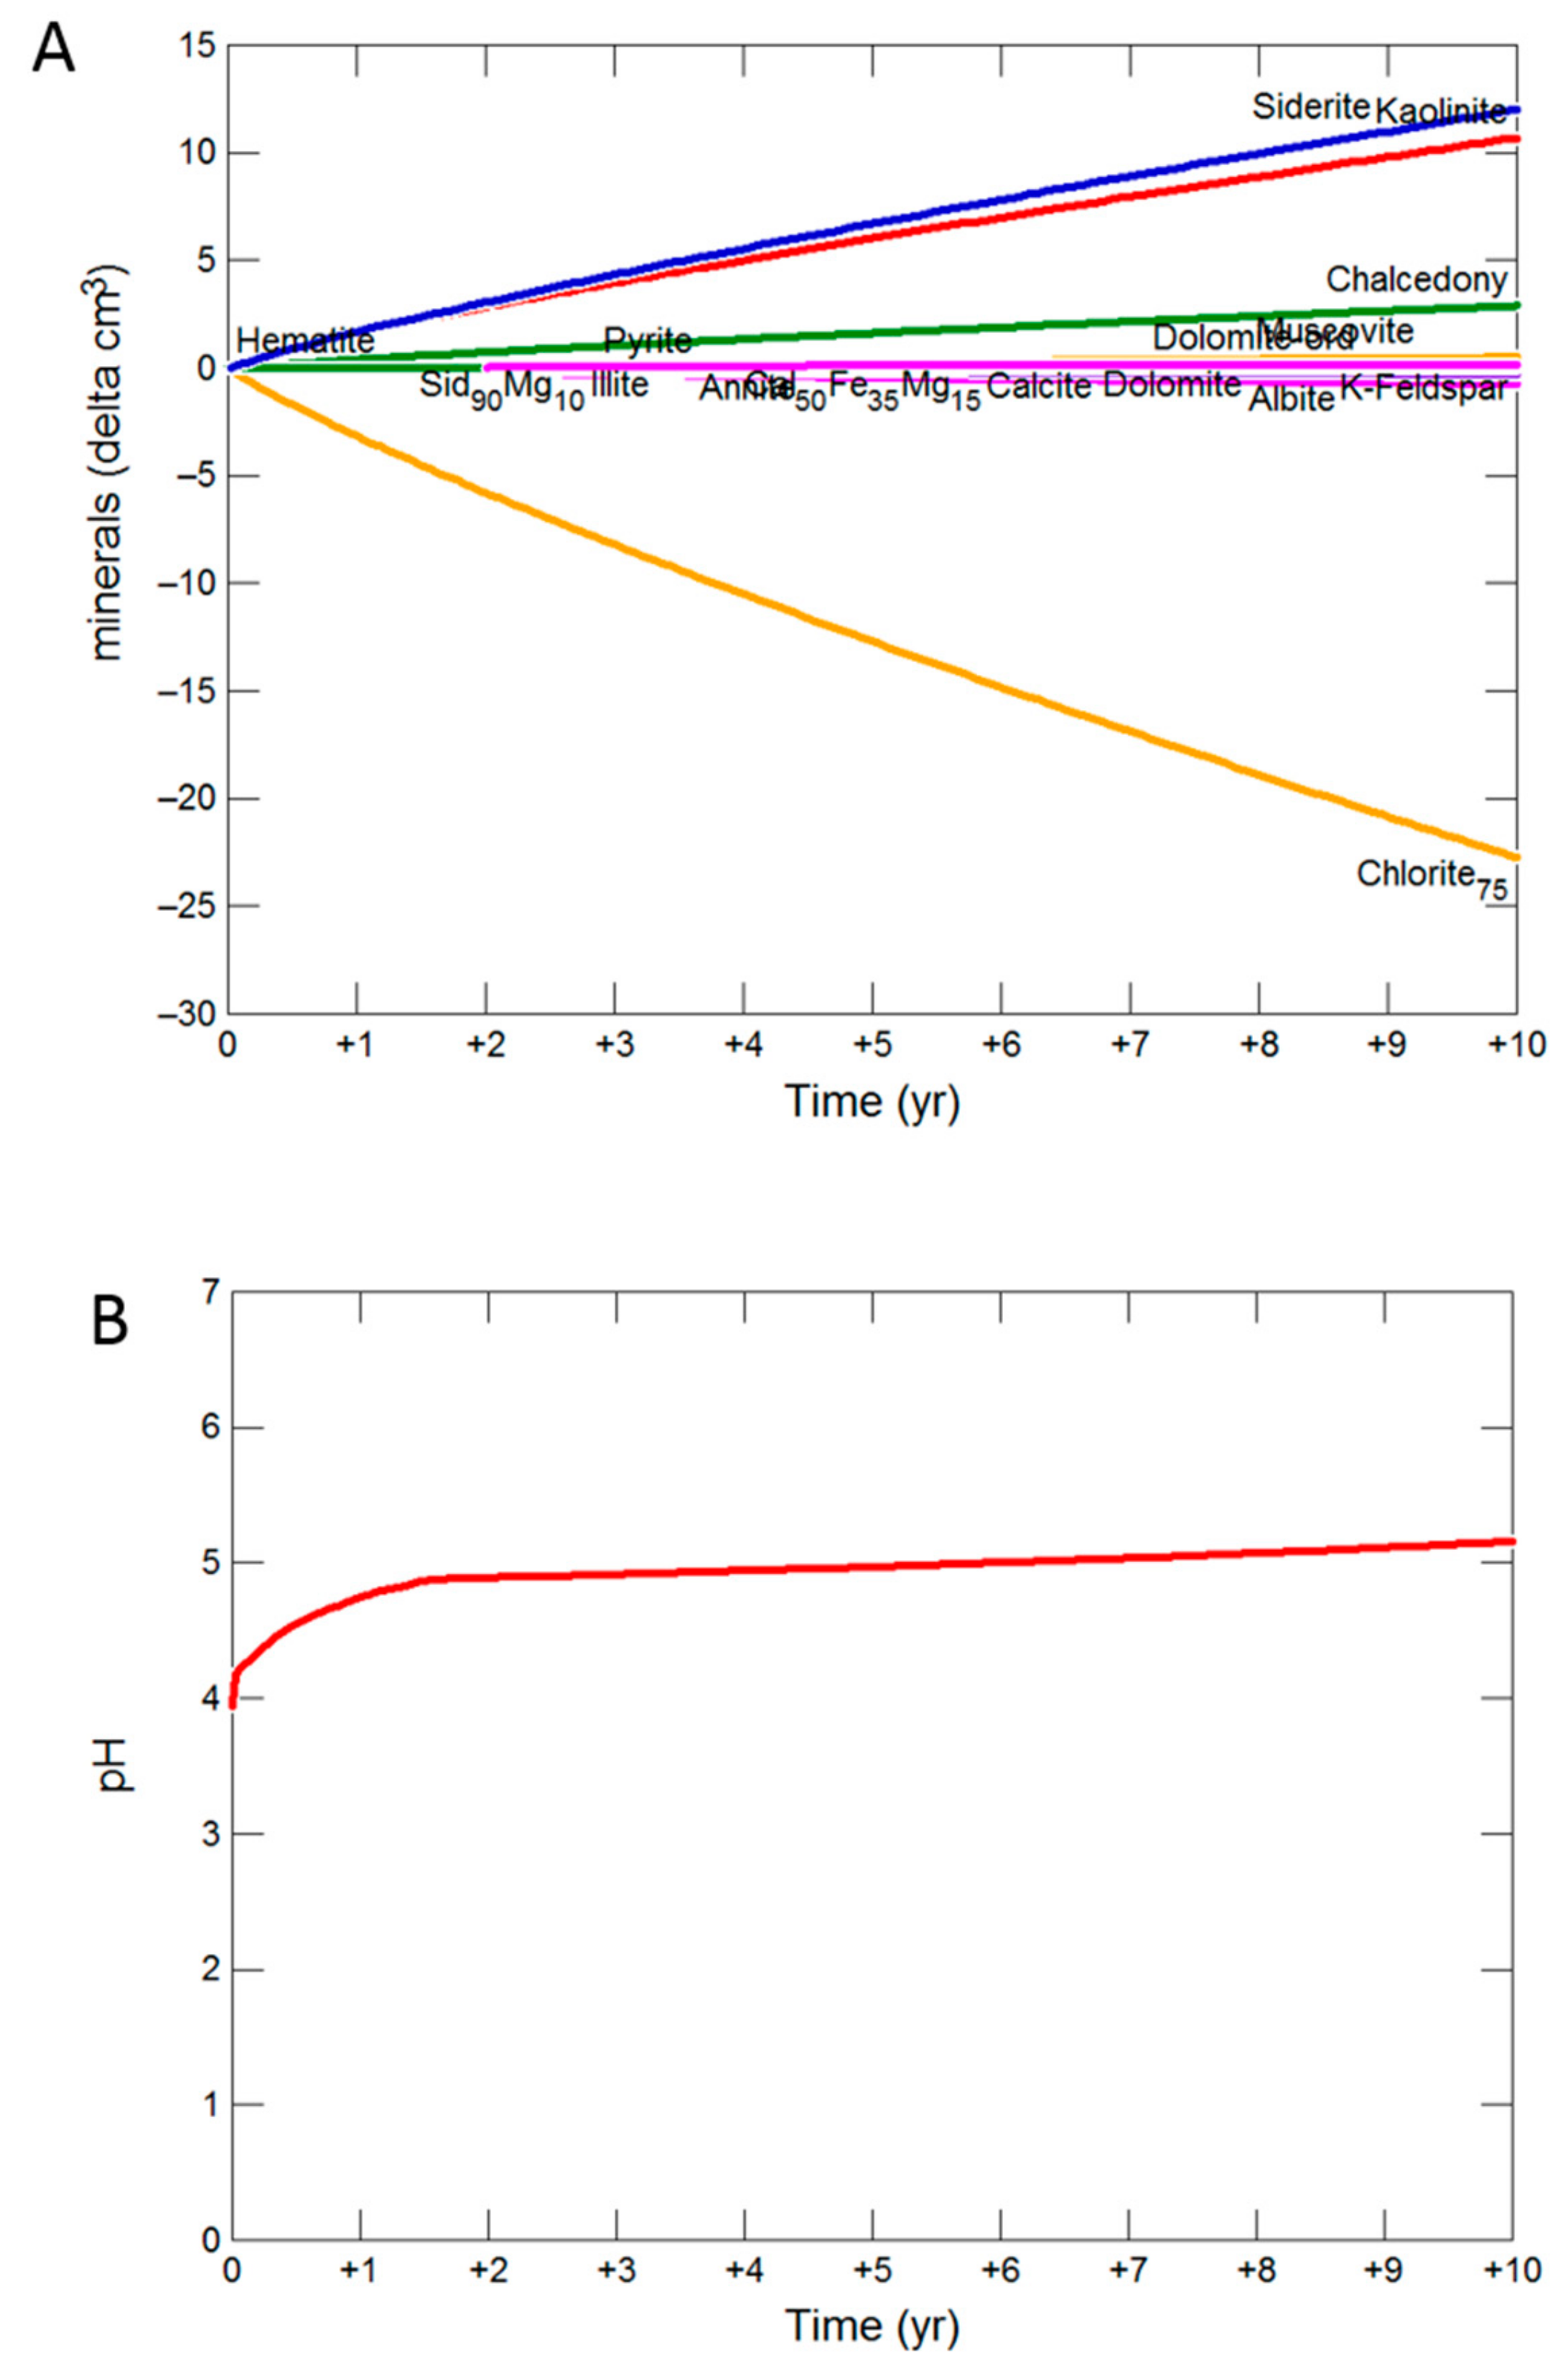
3.4. Geochemical Model

The kinetic geochemical model prediction of reaction of Hutton Sandstone with a mineral composition of the 724.1 m core is shown over 10 years in Figure 11. The alteration of chlorite to siderite, kaolinite and chalcedony is mainly predicted. Dissolution of albite, K-feldspar, siderite, ankerite, calcite and precipitation of pyrite and ankerite is also predicted. Pyrite was predicted to precipitate in Hutton Sandstone WW1 724.1 m, sourcing S from the co-injected SO2. In the current reaction of Hutton Sandstone WW1 724.1 m the predicted altering mineral volumes are relatively small, with only 25 cm3 of (original 1279 cm3 Supplementary Materials Table S4) chlorite dissolved, and 13 cm3 of siderite precipitated with 12 cm3 of kaolinite, and with no net change in volume (or porosity). A pH of 5.2 was predicted after 10 years, with the concentration of dissolved Fe only 4.18 mg/kg as Fe was mainly sequestered with CO2 as siderite. Net mineral trapping was predicted as 1.55 kg/m3 CO2 as siderite after 10 y (based on the method of Watson and Gibson-Poole ) [38]. Additional modelling scenarios for Hutton Sandstone WW1 724.1 m allowing precipitation of smectite are shown in (Supplementary Materials Figure S10), where precipitation of smectite occurs mainly replacing kaolinite precipitation.

4. Discussion

Overall the drill cores characterized from the Hutton Sandstone varied in mineral content, metal content, porosity, pore throat sizes, and permeability. Air permeability measurements of the Chinchilla 4 Hutton Sandstone core showed a high permeability section of ~50 m which is in agreement with the findings of [20,21], that suggested groundwater flow may be restricted to a ~50 m section of the Hutton Sandstone near the Mimosa syncline. Here a chlorite rich Hutton Sandstone, WW1 724.1 m was reacted with CO2 and SO2 in a low salinity water. Porosity measured by micro CT did not change measurably on reaction, although fines movement was observed. No increase to porosity would be favorable to avoid further leakage or migration of CO2. In contrast, an increase to porosity of 1.1% on pure CO2 reaction of calcite cemented Chinchilla 4 Hutton Sandstone 799 m at 60 °C was reported elsewhere [8]. In that case, however, dissolution of 2 vol% calcite cementing framework grains had caused the increased porosity. Two previous studies have reported the reaction of a calcite cemented Hutton Sandstone core from WW1 800.83 m with 1500 mg/kg NaCl and CO2 or CO2 containing 0.16% SO2 and 2% O2 at 60 °C [11,12]. They also reported calcite cement dissolution, and a porosity increase from 5.2 to 11.3% after CO2 reaction; or from 3.8 to 7.5% after CO2-SO2-O2 reaction. These studies indicate that the lithology of the section of the overlying aquifer receiving a potential leak may influence its extent of propagation, with carbonate cemented lithologies a higher potential risk than chlorite rich sandstone.
Precipitation of gypsum or anhydrite had been observed or predicted in CO2 reactivity studies with SO2 ± O2 reaction of rock containing calcite cements as a source of calcium [27,39,40,41,42]. The sandstone reacted here however had a small amount of calcium containing minerals, so a lower dissolved Ca concentration, therefore gypsum/anhydrite did not reach saturation and was not predicted to precipitate. In addition the experiment performed here was at 60 °C, below the stability for anhydrite. A feldspar rich sandstone from the Chinchilla 4 well 868 m was also recently reacted for 16 days with water and CO2 containing 0.16% SO2 and 2% O2, with reported corrosion of siderite and chlorite, precipitation of Fe-oxides with Cr and Ni signatures, and an Al-sulphate mineral jarosite [29]. While Fe-oxides were observed to precipitate in the current reaction reported here, no sulphate mineral precipitation was observed, in contrast FeS/pyrite was observed and predicted to form owing to the lack of co-injected O2. Precipitation of pyrite was observed elsewhere in a natural analogue system of CO2 and S co-sequestration in the Madison Limestone of the Moxa Arch, Wyoming, at current reservoir temperatures of 90–110 °C [34,43]. There a high natural CO2-rich reservoir with dissolved aqueous sulphur complexes contained pyrite, native sulphur, and anhydrite cementing pore space in the drill core. These were shown by the authors to be an example endpoint for CO2 and S co-sequestration. Anhydrite precipitation could be expected to dominate over gypsum precipitation at those higher temperatures (above 60 °C) in the presence of dissolved Ca from the dolomite, and dissolved S from H2S. The prediction in the work presented here of pyrite precipitation with SO2 co-injection is in agreement with that work, although the temperature of the current study is much lower.
During the experimental reaction of the chlorite rich Hutton Sandstone WW1 724.1 m reported here for the reaction with CO2 and SO2, dissolved Fe was somewhat correlated with Mg (R2 = 0.71), Fe was also correlated with Mn (R2 = 0.82) as the majority of these were sourced from the chlorite dissolution. The correlations also reflect subsequent precipitation of metals including Fe and Mn, likely into Fe-oxyhydroxides. Fe was also somewhat correlated with Ba (R2 = 0.73), and dissolved Ca with Fe (R2 = 0.69). This indicates that the dissolution of trace amounts of ankerite also contributed to dissolved cations and was likely the source of Ba. The correlations of Fe with Ca and Ba also reflect later decreases in concentrations through precipitation indicating their incorporation into similar precipitating minerals. Dissolved Rb was somewhat correlated with Li (R2 = 0.69) indicating a similar source mineral, likely plagioclase. The increase and subsequent decrease of dissolved Zn was also correlated with As (R2 = 0.72) likely from trace amounts of sulphides dissolving and re-precipitating. Published experimental reactions of core overlying CO2 storage sites have mainly included calcite cemented sandstone, dolomite or limestones [2,3,4,8]. In those cases the majority of dissolved cations or metals were released from calcite (or dolomite) dissolution and reflected metals substituted into the calcite structure including Ba, Sr, Mn, Mg. The current study has shown that Fe, Mg and Mn are also released from reactive clays such as chlorite in overlying sandstone aquifers. The Fe, Mg and Mn are then available for mineral trapping over longer time periods. After 10 years, mineral trapping of CO2 was predicted to be 1.55 kg/m3 in the form of siderite in models for our current study at 60 °C. Predictions of CO2 mineral trapping have been reported over longer time scales elsewhere. After 1000 y of CO2 reaction, the quartz rich Precipice Sandstone had a predicted mineral trapping from the reaction of trace amounts of chlorite to form siderite trapping only 1.24–1.30 kg/m3 CO2 [44]. No mineral trapping was predicted before 30 y reaction in that case. Up to 2.57 kg/m3 CO2 was predicted to be mineral trapped as siderite or ankerite after 30 y CO2 reaction of chlorite and plagioclase rich mudstones and sandstones of the Evergreen Formation caprock [44]. Watson and Gibson-Poole determined that 34.3 and 231.7 kg/m3 of net CO2 was trapped as siderite, ankerite and calcite in the quartz-rich Waare Sandstone reservoir and the chlorite/berthierine-rich Flaxman Formation respectively [38]. These much higher mineral trapping amounts were estimated from observations of natural mineral trapping in a CO2-rich well vs a low CO2 well (natural analogue system) reacted over unconstrained geological time scales (thought to be since ~5 Ka–1 Ma), with the CO2 sourced from magmatic activity, and at higher present day temperature ranges ~75–116 °C. The main process mineral trapping CO2 was alteration of Fe-rich chlorite/bertherine clay to form siderite and ankerite. Clay minerals were additionally observed to have precipitated in that natural system, mainly kaolinite from alteration of plagioclase, in agreement with the current study, and additionally smectite/illite from alteration of K-feldspar. The predictions of mineral trapping of CO2 as siderite from reaction of Fe-rich chlorite clay in the Hutton Sandstone 724.1 m presented here are reasonable given the above and other studies of natural systems [33,36,45,46,47]. A reactive transport modelling study of an arkose (20 vol% plagioclase), saline reservoir predicted Ca-Na-plagioclase (oligoclase) and chlorite alteration to ankerite, dawsonite, and siderite on reaction with CO2 and 1% SO2 at 75 °C. Predicted mineral trapping was 40–50 kg/m3 over 1000–10,000 y, with dawsonite predicted to be formed from the Na supplied by plagioclase dissolution. SO2 was trapped as alunite, anhydrite and pyrite. In general, although the studies above were at different temperatures, mineral trapping as siderite and ankerite has been observed in reservoirs with Fe-bearing reactive minerals present e.g., Fe-rich chlorite; with dolomite or calcite precipitated from Mg and Ca-rich source minerals such as Mg-chlorite or Ca-plagioclase. Siderite and ankerite are able to precipitate at lower pH than dolomite and calcite, therefore if Fe is present in reducing conditions these ferroan carbonates tend to precipitate first [33]. In sandstone reservoirs, the presence of chlorite and Ca-rich plagioclase are generally associated with higher mineral trapping capacities. Precipitation of dawsonite has been predicted or observed in a few systems with, for example, high Na-plagioclase content and persistent high CO2 partial pressures.

5. Conclusions

This study has shown that low salinity aquifers overlying CO2 storage sites may be very variable in porosity, permeability and mineral content. The response to a possible CO2 leakage is therefore dependent on the lithologies receiving the leak. A chlorite rich sandstone showed no measurable increase in micro CT porosity when reacted with CO2 and low concentrations of SO2 over experimental timescales. This is favorable to avoid an increase in porosity and potential further leakage or migration. Fines movement however was observed in experiments and has the potential to plug permeability. The likelihood of this occurring in a reservoir could be tested in future with flow-through or core flood experiments at a range of flow rates to simulate different potential leakage scenarios. Reaction of mainly Fe-rich chlorite and minor amounts of carbonates, plagioclase and sulphides were observed via changes in the experimental water chemistry. Dissolved elements increased in concentration after CO2-SO2 injection, however several including Fe, Cr, Al, Zn, Ba, As, Pb subsequently decreased with Fe-oxide precipitation in the experiment. Concentrations of Rb and Li increased steadily in the experiment and deserve further investigation as potential indicators for monitoring a leak. Simulations indicated that siderite may mineral trap CO2 in Fe-chlorite rich rocks after 5 to 10 years, with pyrite trapping dissolved S.
Future work is suggested to react different lithologies of core overlying potential CO2 sites (e.g., mudstones, sandstones, carbonate cemented core), such as the Hutton sandstone, and to directly compare reactions with pure CO2 or CO2 containing SO2, NOx or O2 to understand more broadly the potential impacts to porosity, permeability or water chemistry in the unlikely event that a leak were to occur. The use of both batch reactors and flow-through experiments is also suggested to determine if minor gases in CO2 streams such as SO2, NOx or O2 are transported or depleted by reaction with formation water and minerals when moving through the core subsurface.

Supplementary Materials

The following are available online at https://www.mdpi.com/2076-3263/9/12/513/s1, Figure S1: Stratigraphic column and map, Figure S2: QEMSCAN images of a section of sub-plugs, Table S1: QEMSCAN minerals (%), Table S2: XRD % semi quantitative mineral components, Figure S3: Photo of coal in Hutton Sandstone core, Figure S4: QEMSCAN selected areas of WW1 724.1 m, Figure S5: Pre-reaction tomogram and area, Figure S6: Post-reaction tomogram and movement of fines, Figures S7 and S8: Water chemistry during reaction of WW1 724.1 m, Figure S9: Photo of the rock surface before and after reaction with brown coloration. Table S3: Volume percentages of X-ray distinct components, Table S4: Geochemical model input. Figure S10: Geochemical models over 5 years, Table S5: Rock core acid digest total metal content or lithium metaborate fusion major elements and loss on ignition data.

Author Contributions

J.P. and S.G. conceived and designed the experiments; J.P. performed the experiments; J.P. and G.D. analyzed the data; S.S. analyzed micro CT and QEMSCAN before and after reaction; J.P. wrote the paper.

Acknowledgments

The authors wish to acknowledge financial assistance provided through Australian National Low Emissions Coal Research and Development (ANLEC R&D). ANLEC R&D is supported by COAL21 Ltd. and the Australian Government through the Clean Energy Initiative. CTSCo Pty Ltd., and especially Rob Heath, Nick Hall, and Darren Greer are thanked for access to core, data, and constructive discussions. M. Mostert and the UQ Environmental Geochemistry laboratory is thanked for geochemical analyses. We acknowledge the facilities, and the scientific and technical assistance, of the Australian Microscopy and Microanalysis Research Facility at the Centre for Microscopy and Microanalysis, The University of Queensland. A. Dymerko is thanked for performing MICP and He pychnometry of West Wandoan 1 core. D. Biddle is thanked for assistance with experiments, and V. Rudolph for lab and equipment access. Dirk Kirste is thanked for providing mineral script files for geochemical models. The staff of the GSQ Data Exploration Centre are thanked for access to drill core. C. Goodwin is acknowledged for technical assistance with micro CT and QEMSCAN. Three reviewers are thanked for their comments that improved this manuscript.

Conflicts of Interest

The authors declare no conflict of interest. The founding sponsors had no role in the design of the study; in the collection, analyses, or interpretation of data; in the writing of the manuscript, and in the decision to publish the results.

References

  1. Kharaka, Y.K.; Abedini, A.A.; Gans, K.D.; Thordson, J.J.; Beers, S.R.; Thomas, R.B. Changes in the chemistry of groundwater reacted with CO2: Comparison of results from laboratory experiments and the ZERT field site, Bozeman, Montana, USA. Appl. Geochem. 2018, 98, 75–81. [Google Scholar] [CrossRef]
  2. Wunsch, A.; Navarre-Sitchler, A.K.; Moore, J.; Ricko, A.; McCray, J.E. Metal release from dolomites at high partial-pressures of CO2. Appl. Geochem. 2013, 38, 33–47. [Google Scholar] [CrossRef]
  3. Wunsch, A.; Navarre-Sitchler, A.K.; Moore, J.; McCray, J.E. Metal release from limestones at high partial-pressures of CO2. Chem. Geol. 2014, 363, 40–55. [Google Scholar] [CrossRef]
  4. Wang, G.; Qafoku, N.P.; Lawter, A.R.; Bowden, M.; Harvey, O.; Sullivan, C.; Brown, C.F. Geochemical impacts of leaking CO2 from subsurface storage reservoirs to an unconfined oxidizing carbonate aquifer. Int. J. Greenh. Gas Control 2016, 44, 310–322. [Google Scholar] [CrossRef] [Green Version]
  5. Humez, P.; Lagneau, V.; Lions, J.; Negrel, P. Assessing the potential consequences of CO2 leakage to freshwater resources: A batch-reaction experiment towards an isotopic tracing tool. Appl. Geochem. 2013, 30, 178–190. [Google Scholar] [CrossRef]
  6. Humez, P.; Lions, J.; Négrel, P.; Lagneau, V. CO2 intrusion in freshwater aquifers: Review of geochemical tracers and monitoring tools, classical uses and innovative approaches. Appl. Geochem. 2014, 46, 95–108. [Google Scholar] [CrossRef]
  7. Little, M.G.; Jackson, R.B. Potential Impacts of Leakage from Deep CO2 Geosequestration on Overlying Freshwater Aquifers. Environ. Sci. Technol. 2010, 44, 9225–9232. [Google Scholar] [CrossRef] [Green Version]
  8. Farquhar, S.M.; Pearce, J.K.; Dawson, G.K.W.; Golab, A.; Kirste, D.; Biddle, D.; Golding, S.D. A fresh approach to investigating CO2 storage: Experimental CO2-water-rock interactions in a freshwater reservoir system. Chem. Geol. 2015, 399, 98–122. [Google Scholar] [CrossRef]
  9. Pearce, J.K.; Law, A.C.K.; Dawson, G.K.W.; Golding, S.D. SO2-CO2 and pure CO2 reactivity of ferroan carbonates at carbon storage conditions. Chem. Geol. 2015. [Google Scholar] [CrossRef]
  10. Pearce, J.K.; Dawson, G.K.W.; Golab, A.; Knuefing, L.; Sommacal, S.; Rudolph, V.; Golding, S.D. A combined geochemical and μCT study on the CO2 reactivity of Surat Basin reservoir and cap-rock cores: Porosity changes, mineral dissolution and fines migration. Int. J. Greenh. Gas Control 2019, 80, 10–24. [Google Scholar] [CrossRef] [Green Version]
  11. Pearce, J.K.; Golab, A.; Dawson, G.K.W.; Knuefing, L.; Goodwin, C.; Golding, S.D. Mineralogical controls on porosity and water chemistry during O2-SO2-CO2 reaction of CO2 storage reservoir and cap-rock core. Appl. Geochem. 2016, 75, 152–168. [Google Scholar] [CrossRef] [Green Version]
  12. Pearce, J.K.; Kirste, D.M.; Dawson, G.K.W.; Farquhar, S.M.; Biddle, D.; Golding, S.; Rudolph, V. SO2 Impurity Impacts on Experimental and Simulated CO2-Water-Reservoir Rock Reactions at Carbon Storage Conditions. Chem. Geol. 2015, 399, 65–86. [Google Scholar] [CrossRef]
  13. Hodgkinson, J.; Preda, M.; Hortle, A.; McKillop, M.; Dixon, O.; Foster, L. The Potential Impact of Carbon Dioxide Injection on Freshwater Aquifers: The Surat and Eromanga Basins in Queensland; Deptartment of Employment, Economic Development and Innovation, Geological Survey of Queensland: Brisbane, Australia, 2010; p. 133. [Google Scholar]
  14. Hodgkinson, J.; Grigorescu, M. Background research for selection of potential geostorage targets—Case studies from the Surat Basin, Queensland. Aust. J. Earth Sci. 2012, 60, 71–89. [Google Scholar] [CrossRef]
  15. Farquhar, S.M.; Dawson, G.K.W.; Esterle, J.S.; Golding, S.D. Mineralogical characterisation of a potential reservoir system for CO2 sequestration in the Surat Basin. Aust. J. Earth Sci. 2013, 60, 91–110. [Google Scholar] [CrossRef]
  16. Grigorescu, M. Mineralogy of the North-Eastern Bowen Basin and North-Eastern Surat Basin, Queensland; Queensland Geological Record: St. Lucia, Australia, 2011. [Google Scholar]
  17. Hamilton, S.K.; Golding, S.D.; Baublys, K.A.; Esterle, J.S. Stable isotopic and molecular composition of desorbed coal seam gases from the Walloon Subgroup, eastern Surat Basin, Australia. Int. J. Coal Geol. 2014, 122, 21–36. [Google Scholar] [CrossRef]
  18. Baublys, K.A.; Hamilton, S.K.; Golding, S.D.; Vink, S.; Esterle, J. Microbial controls on the origin and evolution of coal seam gases and production waters of the Walloon Subgroup; Surat Basin, Australia. Int. J. Coal Geol. 2015, 147, 85–104. [Google Scholar] [CrossRef]
  19. Feitz, A.J.; Ransley, T.R.; Dunsmore, R.; Kuske, T.J.; Hodgkinson, J.; Preda, M.; Spulak, R.; Dixon, O.; Draper, J. Geoscience Australia and Geological Survey of Queensland Surat and Bowen Basins Groundwater Surveys Hydrochemistry Dataset (2009–2011); Geoscience Australia: Canberra, Australia, 2014. [Google Scholar] [CrossRef]
  20. Raiber, M.; Suckow, A. Hydrochemical Assessment of the Hutton and Precipice Sandstones in the Northern Surat Basin; CSIRO: Canberra, Australia, 2017. [Google Scholar]
  21. Suckow, A.; Raiber, M.; Deslandes, A.; Gerber, C. Constraining Conceptual Groundwater Models for the Hutton and Precipice Aquifers in the Surat Basin through Tracer Data Final Report; CSIRO: Canberra, Australia, 2018. [Google Scholar]
  22. Bianchi, V.; Pistellato, D.; Job, A.; Esterle, J. Regional Geological Study of the Hutton Sandstone ANLEC 0711160294 Final Report; University of Queensland, ANLEC R&D: Barton, Australia, 2019. [Google Scholar]
  23. Dawson, G.K.W.; Biddle, D.; Farquhar, S.M.; Gao, J.; Golding, S.D.; Jiang, X.; Keck, R.; Khan, C.; Law, A.C.K.; Li, Q.; et al. Achieving Risk and Cost Reductions in CO2 Geosequestration through 4D Characterisation of Host Formations; University of Queensland, ANLEC R&D: Barton, Australia, 2015. [Google Scholar]
  24. Massarotto, P.; Golding, S.D.; Bae, J.S.; Iyer, R.; Rudolph, V. Changes in reservoir properties from injection of supercritical CO2 into coal seams—A laboratory study. Int. J. Coal Geol. 2010, 82, 269–279. [Google Scholar] [CrossRef]
  25. Golab, A.N.; Knackstedt, M.A.; Averdunk, H.; Senden, T.; Butcher, A.R.; Jaime, P. 3D porosity and mineralogy characterization in tight gas sandstones. Lead. Edge 2010, 29, 1476–1483. [Google Scholar] [CrossRef]
  26. Golab, A.; Knuefing, L.; Goodwin, C.; Sommacal, S.; Carnerup, A.; Dawson, G.; Pearce, J.K.; Golding, S.D. Milestone 5.7: Final Report on Geochemical Reactivity Studies of Core Material Using ScCO2; Report for ANLEC R&D; Lithicon FEI: Hillsboro, OR, USA, 2015. [Google Scholar]
  27. Kirste, D.; Pearce, J.; Golding, S. Parameterizing Geochemical Models: Do Kinetics of Calcite Matter? Procedia Earth Planet. Sci. 2017, 17, 606–609. [Google Scholar] [CrossRef]
  28. Palandri, J.L.; Kharaka, Y.K. A Compilation of Rate Parameters of Water-Mineral Interaction Kinetics for Application to Geochemical Modeling; USGS Open File Report 2004-1068; Geological Survey: Menlo Park, CA, USA, 2004; p. 64. [Google Scholar]
  29. Pearce, J.K.; Kirste, D.M.; Dawson, G.K.W.; Rudolph, V.; Golding, S.D. Geochemical modelling of experimental O2–SO2–CO2 reactions of reservoir, cap-rock, and overlying cores. Appl. Geochem. 2019, 109, 104401. [Google Scholar] [CrossRef]
  30. Bethke, C.M.; Yeakel, S. The Geochemist’s Workbench (Version 9.0): Reaction Modeling Guide. Available online: https://www.gwb.com/software_overview (accessed on 11 December 2019).
  31. Delany, J.M.; Lundeen, S.R. The LLNL Thermodynamic Database; Report UCRL-21658; Lawrence Livermore National Laboratory: Livermore, CA, USA, 1989. [Google Scholar]
  32. Duan, Z.; Sun, R. An improved model calculating CO2 solubility in pure water and aqueous NaCl solutions from 273 to 533 K and from 0 to 2000 bar. Chem. Geol. 2003, 193, 257–271. [Google Scholar] [CrossRef]
  33. Higgs, K.E.; Funnell, R.H.; Reyes, A.G. Changes in reservoir heterogeneity and quality as a response to high partial pressures of CO2 in a gas reservoir, New Zealand. Mar. Pet. Geol. 2013, 48, 293–322. [Google Scholar] [CrossRef]
  34. Kaszuba, J.P.; Navarre-Sitchler, A.; Thyne, G.; Chopping, C.; Meuzelaar, T. Supercritical carbon dioxide and sulfur in the Madison Limestone: A natural analog in southwest Wyoming for geologic carbon-sulfur co-sequestration. Earth Planet. Sci. Lett. 2011, 309, 131–140. [Google Scholar] [CrossRef]
  35. Watson, M.N.; Zwingmann, N.; Lemon, N.M. The Ladbroke Grove-Katnook carbon dioxide natural laboratory: A recent CO2 accumulation in a lithic sandstone reservoir. Energy 2004, 29, 1457–1466. [Google Scholar] [CrossRef]
  36. Farquhar, S. CO2–Water–Rock Interactions in Low-Salinity Reservoir Systems. Ph.D. Thesis, University of Queensland, St. Lucia, Australia, 2016. [Google Scholar]
  37. Pearce, J.K.; Dawson, G.K.W.; Blach, T.P.; Bahadur, J.; Melnichenko, Y.B.; Golding, S.D. Impure CO2 reaction of feldspar, clay, and organic matter rich cap-rocks: Decreases in the fraction of accessible mesopores measured by SANS. Int. J. Coal Geol. 2018, 185, 79–90. [Google Scholar] [CrossRef] [Green Version]
  38. Watson, M.; Gibson-Poole, C.M. Reservoir Selection for Optimised Geological Injection and Storage of Carbon Dioxide: A Combined Geochemical and Stratigraphic Perspective. In Forth Annual Conference on Carbon Capture and Sequestration DOE/NETL; US Department of Energy: Alexandria, VA, USA, 2005. [Google Scholar]
  39. Xu, T.F.; Apps, J.A.; Pruess, K.; Yamamoto, H. Numerical modeling of injection and mineral trapping of CO2 with H2S and SO2 in a sandstone formation. Chem. Geol. 2007, 242, 319–346. [Google Scholar] [CrossRef] [Green Version]
  40. Pearce, J.K.; Dawson, G.K.W. Gas-Water-Mineral Reactivity in Caprocks. In Geological Carbon Storage; Vialle, S., Ajo-Franklin, J., Carey, J.W., Eds.; Wiley: Hoboken, NJ, USA, 2018. [Google Scholar] [CrossRef]
  41. Wilke, F.D.H.; Vásquez, M.; Wiersberg, T.; Naumann, R.; Erzinger, J. On the interaction of pure and impure supercritical CO2 with rock forming minerals in saline aquifers: An experimental geochemical approach. Appl. Geochem. 2012, 27, 1615–1622. [Google Scholar] [CrossRef]
  42. Renard, S.; Sterpenich, J.; Pironon, J.; Chiquet, P.; Randi, A. Geochemical effects of an oxycombustion stream containing SO2 and O2 on carbonate rocks in the context of CO2 storage. Chem. Geol. 2014, 382, 140–152. [Google Scholar] [CrossRef]
  43. Chopping, C.; Kaszuba, J.P. Supercritical carbon dioxide–brine–rock reactions in the Madison Limestone of Southwest Wyoming: An experimental investigation of a sulfur-rich natural carbon dioxide reservoir. Chem. Geol. 2012, 322, 223–236. [Google Scholar] [CrossRef]
  44. Pearce, J.; Underschultz, J.; La Croix, A. Mineralogy, geochemical CO2-water-rock reactions and associated characterisation. In The University of Queensland Surat Deep Aquifer Appraisal Project (UQ-SDAAP); The University of Queensland: Brisbane, Australia, 2019. [Google Scholar]
  45. Golding, S.D.; Uysal, I.T.; Boreham, C.J.; Kirste, D.; Baublys, K.A.; Esterle, J.S. Adsorption and mineral trapping dominate CO2 storage in coal systems. Energy Procedia 2011, 4, 3131–3138. [Google Scholar] [CrossRef] [Green Version]
  46. Golding, S.D.; Uysal, I.T.; Bolhar, R.; Boreham, C.J.; Dawson, G.K.W.; Baublys, K.A.; Esterle, J.S. Carbon dioxide-rich coals of the Oaky Creek area, central Bowen Basin: A natural analogue for carbon sequestration in coal systems. Aust. J. Earth Sci. 2013, 60, 125–140. [Google Scholar] [CrossRef]
  47. Uysal, I.T.; Golding, S.D.; Bolhar, R.; Zhao, J.-X.; Feng, Y.-X.; Baublys, K.A.; Greig, A. CO2 degassing and trapping during hydrothermal cycles related to Gondwana rifting in eastern Australia. Geochim. Cosmochim. Acta 2011, 75, 5444–5466. [Google Scholar] [CrossRef]
Figure 1. (A) Pore throat distributions of Hutton Sandstone cores from the Chinchilla 4 (Chin 4) and West Wandoan 1 (WW1) wells by depth (m). (B) Core air permeability measured in the Chinchilla 4 well core Hutton Sandstone.
Geosciences 09 00513 g001
Figure 2. Micro CT tomogram images of Chinchilla 4 core sub-plugs (A) 828.76 m sandstone containing 9% clay (28 mm diameter sub-plug); (B) 835.48 m chlorite-rich sandstone (3 mm sub-plug); (C) photo of 835.48 m sub-plug; (D) 867.94 m (2 mm sub-plug).
Geosciences 09 00513 g002
Figure 3. SEM BSE images of Hutton Sandstone from the Chinchilla 4 well (A) calcite cemented sandstone from 799.5 m; (B) chlorite and Fe-oxide in 867.94 m; (CF) 835.48 m, chlorite and kaolinite have rimmed and filled porosity. Qz = quartz, Cl = calcite, Chl = chlorite, FeO = Fe-oxide, Ca-Pl = Ca-plagioclase, Na-Pl = Na-plagioclase/albite, Ka = kaolinite.
Geosciences 09 00513 g003
Figure 4. Core photo and SEM BSE images of Hutton Sandstone from the West Wandoan 1 well (A) photo of core from 723.5–727.43 m; (B) SEM BSE image of 724.1 m with a bright zircon layer; (C) 724.1 m blocky kaolinite; (D) 800.7 m calcite cemented sandstone containing minor coal; (E) 800.7 m detail of calcite cementing quartz grains, with bright sphalerite spot.
Geosciences 09 00513 g004
Figure 5. West Wandoan 1 Hutton Sandstone sub-plug from 724.1 m (A) Tomogram pre-reaction; (B) tomogram post-reaction (note the top section was used for QEMSCAN analysis); (C) mineral segmentation image pre-reaction.
Geosciences 09 00513 g005
Figure 6. West Wandoan 1 Hutton Sandstone sub-plug slice SEM BSE images from 724.1 m pre-reaction (A) Pore filling kaolinite and pore rimming chlorite, image width 500 microns with 30 nm voxel; (B) SEM BSE image of the full sub-plug slice; (C) detrital altered/weathered grain, image width 250 micron, 30 nm voxel; (D) muscovite/biotite partly altered to chlorite, image width 250 micron, 30 nm voxel.
Geosciences 09 00513 g006
Figure 7. West Wandoan 1 Hutton Sandstone sub-plug slice images from 724.1 m (A) Pre-reaction tomogram image, and inset pore detail (200 micron image width); (B) Post-reaction tomogram image and inset detail of a pore with fines movement/clay bridging (200 micron image width); (C) Pre-reaction QEMSCAN image, color legend, and pre and post reaction mineral quantification.
Geosciences 09 00513 g007
Figure 8. West Wandoan 1 Hutton Sandstone SEM-EDS images from 724.1 m core block pre- and post-reaction (A) Pre reaction quartz, Fe-Mg-silicate, zircon kaolinite; (B) Fe-Mg-chlorite pre-reaction; (C) same area in A post reaction with little obvious change; (D) post-reaction chlorite surface alteration; (E) post-reaction precipitated Fe-Cr-Ni-oxide on clay; (F) EDS spectrum of Fe-Cr-Ni-oxide, note there was a technical issue with the O peak being very low.
Geosciences 09 00513 g008
Figure 9. Water chemistry during reaction of West Wandoan 1 Hutton Sandstone 724.1 m, and the blank reaction without rock. The point at time 0 h is after the N2-low salinity water-rock soak, (A) pH; (B) Concentration of Mn; (C) Concentration of Fe; (D) Concentration of Cr; (E) Concentration of Pb; (F) Concentration of As. Note E and F are shown in µg/kg.
Geosciences 09 00513 g009
Figure 10. Water chemistry during reaction of West Wandoan 1 Hutton Sandstone 724.1 m, and the blank reaction without rock. The point at time 0 h is after the N2-low salinity water-rock soak (A) Concentration of Rb; (B) Concentration of Li; (C) Concentration of Ti; (D) Concentration of Al; (E) Concentration of Zn; (F) Concentration of Tl. Note E is shown in mg/kg.
Geosciences 09 00513 g010
Figure 11. Geochemical model of reaction of West Wandoan 1 Hutton Sandstone 724.1 m over 10 years (A) Change in minerals; (B) predicted pH.
Geosciences 09 00513 g011
Table 1. Chinchilla 4 well Hutton Sandstone core porosity measured by different techniques. Connected open porosity is a component of the total µCT porosity. He = helium. SS = sandstone, MS = mudstone.
Depth (m)Porosity
%
Porosity
%
Connected Open PorosityPorosity
%
He Density
(g/cm3)
MICPµCTµCTHe
745.1 11.92.64Carbonaceous MS
799.510.1 112.68Calcite cemented SS
828.7611.213.18.619.62.65SS
835.485.57.70.58.52.63Carbonaceous MS/sandy mudstone
867.9414153.516.12.67SS carbonate laminations
Table 2. West Wandoan 1 well Hutton Sandstone core porosity measured by different techniques. He = helium. Brine and N2 permeability (perm) are also shown where able to be measured on selected cores, H = horizontal 1 or 2 direction, V = vertical.
Depth (m)Porosity
%
Porosity
%
Post
Reaction
%
He Density
(g/cm3)
Brine Perm (mD)N2 Perm
(mD)
MICPµCTµCT
724.1 7.07.02.71 SS
727.4 2.65 MS
800.76.75.2, 3.8 2.65 0.2, 4.47 V Calcite cemented SS
821.556.4 2.6323 V, 18 H1 83 V, 123 H1, 125 H2Feldspathic SS
900.02 2.63 SS calcite laminations

