Article

High Resolution Characterization of Lithological Heterogeneity of the Paaratte Formation, Otway Basin (Australia), a Coastal to Shallow-Marine Deposit

1
Peter Cook Centre for CCS Research, School of Earth Sciences, The University of Melbourne, Victoria 3010, Australia
2
CO2CRC Ltd., 11–15 Argyle Place South, Carlton, Victoria 3053, Australia
*
Author to whom correspondence should be addressed.
Geosciences 2019, 9(6), 278; https://doi.org/10.3390/geosciences9060278
Submission received: 24 May 2019 / Revised: 19 June 2019 / Accepted: 21 June 2019 / Published: 24 June 2019
(This article belongs to the Special Issue Geochemical and associated Changes with Gas-Water-Rock Reactions)

Abstract

:
Coastal to shallow-marine deposits are inherently highly heterogeneous in sediment composition due to variable depositional conditions. Representation of heterogeneity at sub-seismic scales is required for understanding flow and geochemical processes and poses two challenges: Firstly, the representation of different rock types in geological models requires high resolution sampling vertically and laterally. Secondly, the heterogeneity in petrophysical, flow and mineralogical properties within each rock type needs to be sufficiently characterized in order to support (multiphase) flow and reactive transport simulations. This study addresses these challenges for the Paaratte Formation, Otway Basin (Australia), at the CO2CRC’s Otway Research Facility to enable detailed simulations of CO2 flow and reactions. Based on the analysis of wireline logs, hyperspectral core logs and discrete samples from wells CRC-2 and CRC-3, five rock types are defined and characterized for two coastal to shallow-marine parasequences comprising four depositional facies. A combination of wireline logs is used to derive rock type logs for the wells CRC-2 and CRC-3 at 10 cm vertical resolution and allows high resolution cross-well correlation providing insights into the lateral extent of deposits. Findings of this study will inform future desktop and field studies at the CO2CRC’s Otway Research Facility requiring information on sub-seismic lithological heterogeneity.

1. Introduction

Flow and reactive transport modelling have evolved to be an effective tool to reconstruct and predict the fluid flow and chemical evolution of a system [1]. To achieve meaningful results from such modelling studies, it is important to replicate realistic fluid flow paths in simulations. This is usually achieved by constructing static models and then using them as a basis in flow and reactive transport simulations. Various regional structural features are implemented in geostatic models followed by the population of flow and petrophysical properties using wireline and seismic data [2,3]. Such geostatic models often have dimensions of the order of kilometers. To computationally manage multiphase and coupled reactive transport simulation runs on such large scale, grid blocks with a vertical resolution of meters and a lateral resolution of tens of meters are implemented. While the use of geostatic models is helpful in replicating fluid flow paths based on field data, the limitation posed by large grid dimension persists. To further improve the results, it is important to implement sub-meter scale lithological heterogeneities in geostatic models [4,5]. Such high resolution lithological heterogeneity exists in the form of intercalated layers of fine and coarse sediments, cemented intervals and sedimentary structures such as cross, planar and massive bedding [6]. Any layers composed of low porosity-low permeability rock types are known as intraformational baffles, which occur within high porosity-high permeability reservoir rock [7]. Intraformational baffles can significantly affect fluid flow pathways as well as fluid-rock reactions due to their low porosity, low permeability, higher capillary entry pressures and relatively abundant reactive minerals such as clays [7,8,9,10]. The proportion of baffles in the reservoir can significantly alter the results from dynamic simulations [11]. Hence, it is critical to incorporate the properties of intraformational baffles in reservoir scale models in order to improve simulation results. This is not directly possible as the incorporation of intraformational baffles in reservoir scale models requires sub-meter scale grid sizes and, thereby, increases computational limitations. One possible way to accomplish this task is to study the processes at sub-meter scales and then upscale flow [12] and geochemical [13] responses in larger scale models. This allows lithological heterogeneity at sub-meter scale to be incorporated in reservoir scale models and should significantly improve the prediction of fluid plume migration and associated geochemical reactions.
The first important step towards implementing this approach is to define rock types based on lithological properties which are subsequently used to populate the geostatic models. The present study addresses this by developing a database of high resolution lithological properties in terms of rock type classes. Rock properties are analyzed on samples from the Paaratte Formation at the CO2CRC’s Otway Research Facility site, which is a test and demonstration site for geological CO2 storage in the state of Victoria, Australia [14]. The Paaratte Formation is a sedimentary unit consisting of three units, the lowermost of which comprises three parasequences [15,16]. Lithological properties have been analyzed for the lower two parasequences of the deepest unit (Unit A), which spans over approximately 100 meters in thickness. The two parasequences of interest are composed of four depositional facies: distributary channel, proximal mouthbar, distal mouthbar and delta front [16]. Each of these facies lithological heterogeneity vertically at sub-meter scale [17,18,19]. Rock properties used in this study to characterize the rock types are: porosity, permeability, capillary entry pressure, mineral composition and grain size distribution.
Porosity, permeability and capillary entry pressure have been measured on discrete cores and wireline logs and the data is published for the two wells in the study area, CRC-2 and CRC-3 [19,20,21,22]. Continuous semi-quantitative mineral composition was measured on 104-meters of core from CRC-3 using hyperspectral core logging as part of the current study. Quantitative mineral composition and mineral specific grain sizes were also analyzed on 30 discrete samples from CRC-3 using QEMSCAN analysis.
The aforementioned properties have been used to define five distinct rock type classes: coarse sandstone, fine sandstone, siltstone, mudstone and carbonate-cemented sandstone. The classification of rock type classes is geologically reasonable as it is based on the relationship of lithological properties and depositional environments in the Paaratte parasequences.
The rock type classes need to be spatially mapped in order to support dynamic simulations. For this purpose, a continuous depth log of the five rock type classes is derived for the wells CRC-2 and CRC-3 followed by their cross correlation to deduce the vertical and lateral continuity of rock types between the two wells.
The rock type classes within the two coastal to shallow-marine parasequences provide new insight into sub-seismic lithological heterogeneity and will support dynamic simulations accounting for sub-meter scale heterogeneity in multiphase flow and reactive transport simulations.

2. Study Area Overview and Geological Setting

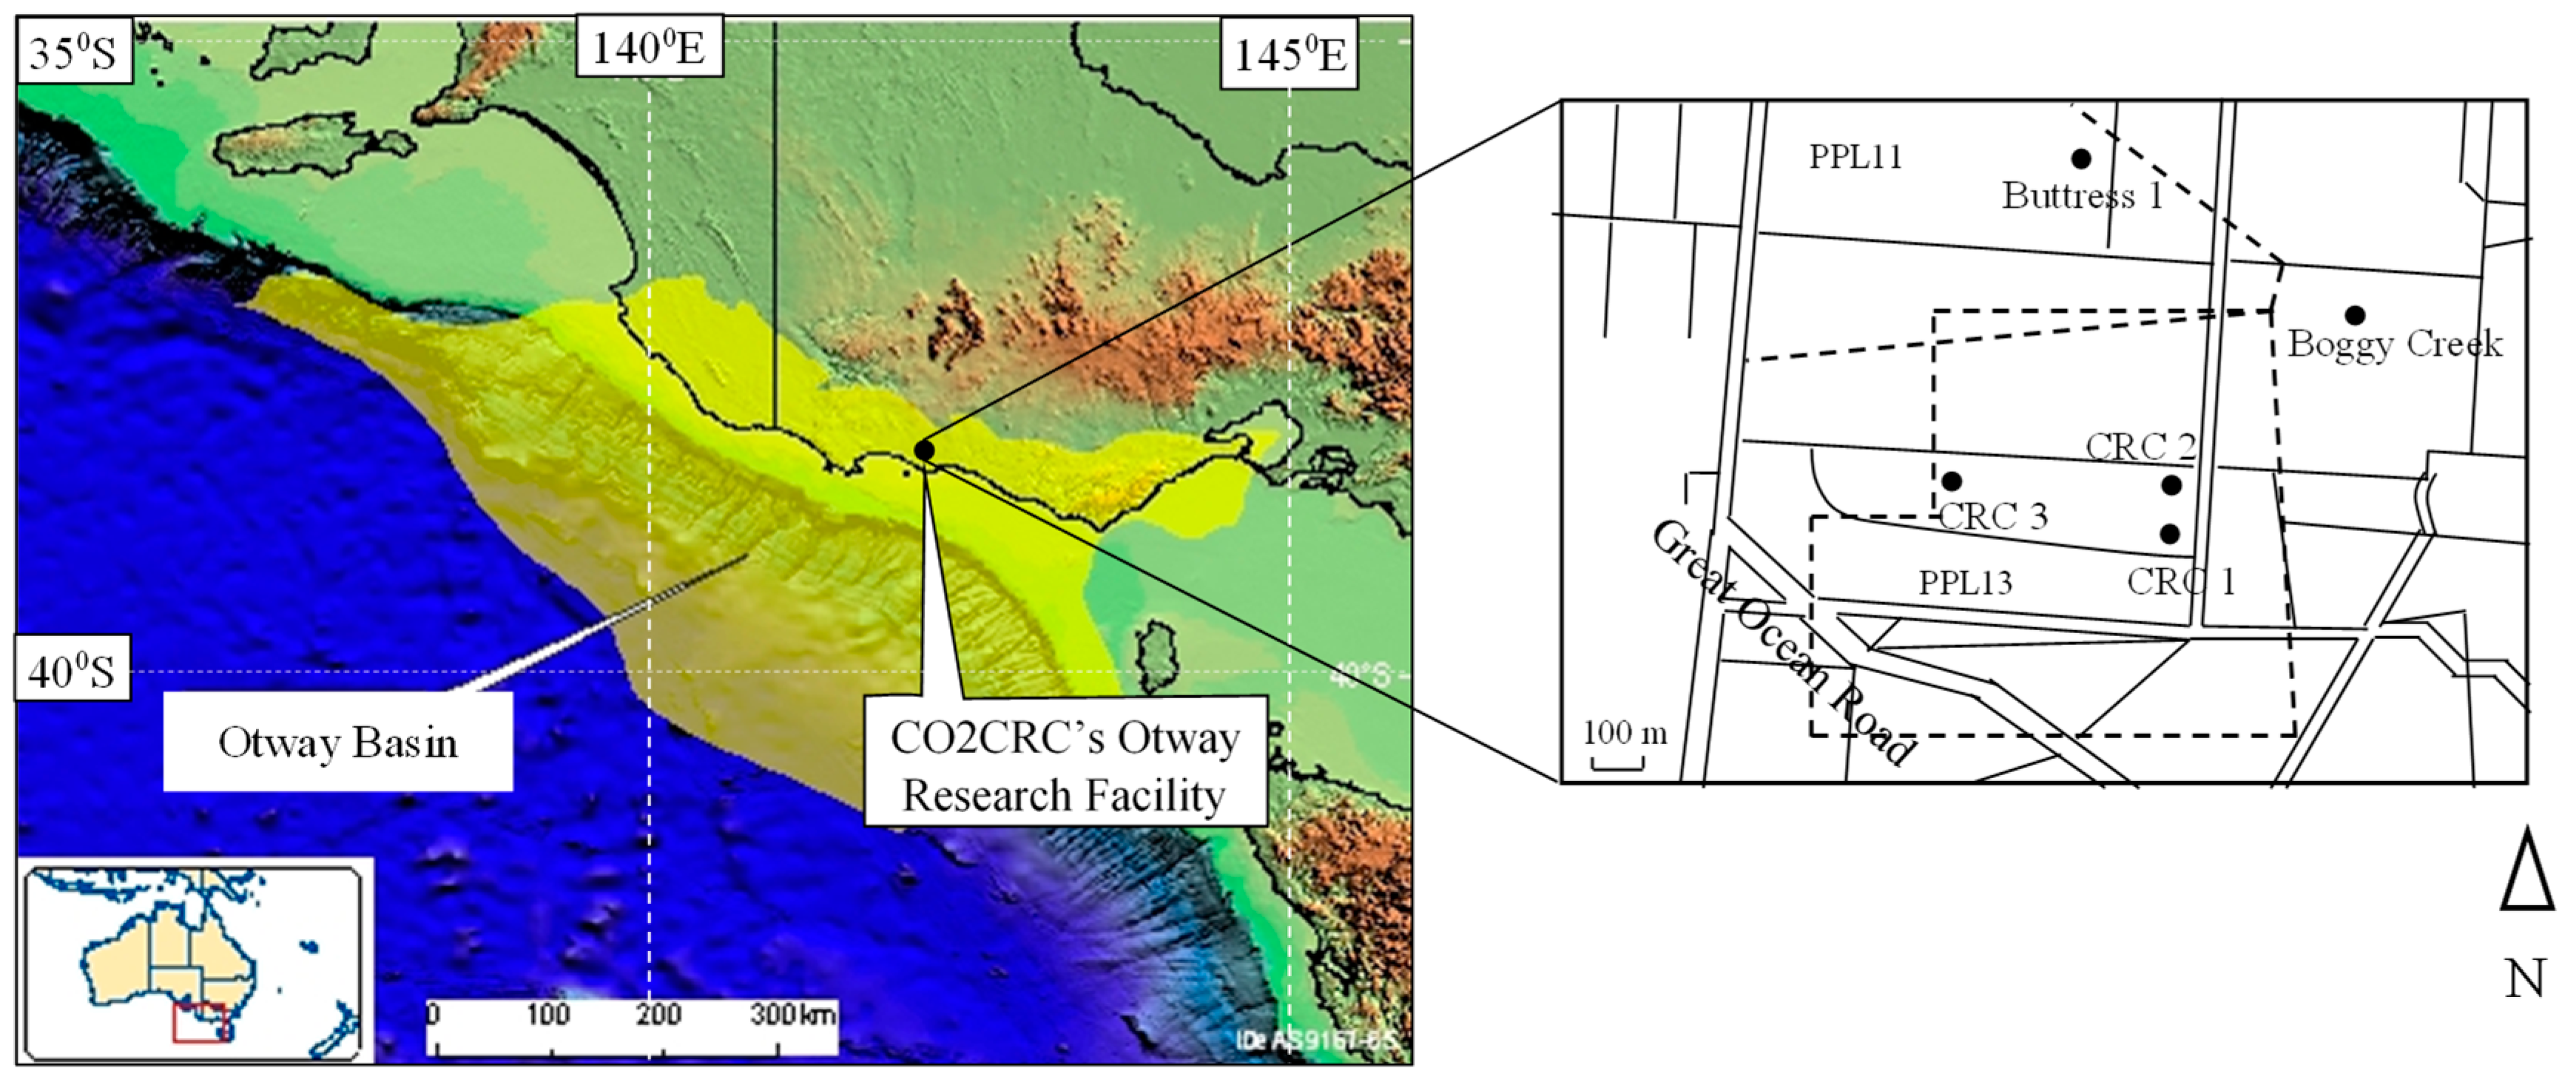
2.1. Study Area Overview

The CO2CRC’s Otway Research Facility site is located onshore of the Otway Basin. It is approximately 300 km southwest of Melbourne in Victoria, between the coastal towns of Port Campbell to the east, and Warrnambool to the west (Figure 1) [23]. The choice of the study area was determined by two factors. Firstly, the Paaratte Formation at the site contains abundant lithological heterogeneity [17,18,19] at sub-meter scale, and second, relevant field data on small scale lithological heterogeneity was made available through CO2CRC Limited.
While several wells exist at or nearby the CO2CRC’s Otway Research Facility, the current study focuses on data from the wells CRC-2 (38°31′50.06″ S, 142°48′41.45″ E) and CRC-3 (38°31′42.3″ S, 142°48′17.8″ E) [19,24], because of the abundance and type of data available. The wireline and core data from both the wells have been characterized very well [19,20,21,22]. The two wells are located about 630 meters apart.

2.2. Basin Location and Evolution

The Otway Basin, which is a rift-to-passive margin basin that extends from the southeastern boundary of South Australia to the northwestern boundary of Tasmania [23,25]. The basin is about 500 km long. It covers a surface area of 150,000 km2 and is up to 8 km thick. The majority of the basin (~120,000 km2) lies offshore up to 3000 m below sea surface [23,25,26,27,28,29].
An interplay of tectonic forces and sea level change shaped the present-day Otway Basin. The basin evolution began in Tithonian-Barremian stages with the first of the two rift events associated with the breakup of Australia and Antarctica [23,25,30,31,32,33]. The first rifting event led to thermal subsidence and regional sag during the Aptian to Albian stages [34], while the second rifting event was followed by passive margin subsidence [23,35].
The variation in tectonic forces over time led to a total of six major cycles of sea level change in the Otway Basin between Late Cretaceous and Quaternary. This resulted in the formation of five Groups in the Basin (oldest to youngest): Otway, Sherbrook, Wangerrip, Nirranda and Heytesbury [36]. The lowermost Otway Group precedes the first cycle of sea level change and the deposition was controlled by tectonic activity. The depositional environments of the Otway Group varied from volcaniclastic at the base to fluvial and shallow lacustrine at the top. The sediments deposited range from interbedded carbonaceous shale and basalts to interbedded volcaniclastic sandstone, mudstone and coal [36,37]. The effect of sea level change dominated the lithology with the commencement of the Sherbrook Group where the depositional environment varied from marginal marine within a low stand system tract at the base to upper deltaic plain environment within a high stand system tract at the top [15,36,38]. The sediments deposited include shale, black pyritic mudstone, siltstone, interbedded calcareous sandstone and coarse grained sandstone [36,39]. The Wangerrip Group consists of transgressive-regressive units [37] deposited under conditions varying from low energy marginal marine at the base to shallow-marine at the top. The sediments deposited include carbonaceous claystone, mudstone and sandstone [36,40,41,42]. The Nirranda Group developed in open marine conditions resulting in mixed carbonates and siliciclastic sedimentation [31,43], while the Heytesbury Group deposited during the sixth cycle of sea level change with a depositional environment varying from inner shelf at the base to mid-shelf at the top. The Heytesbury Group is composed of open marine carbonate sequences [36].

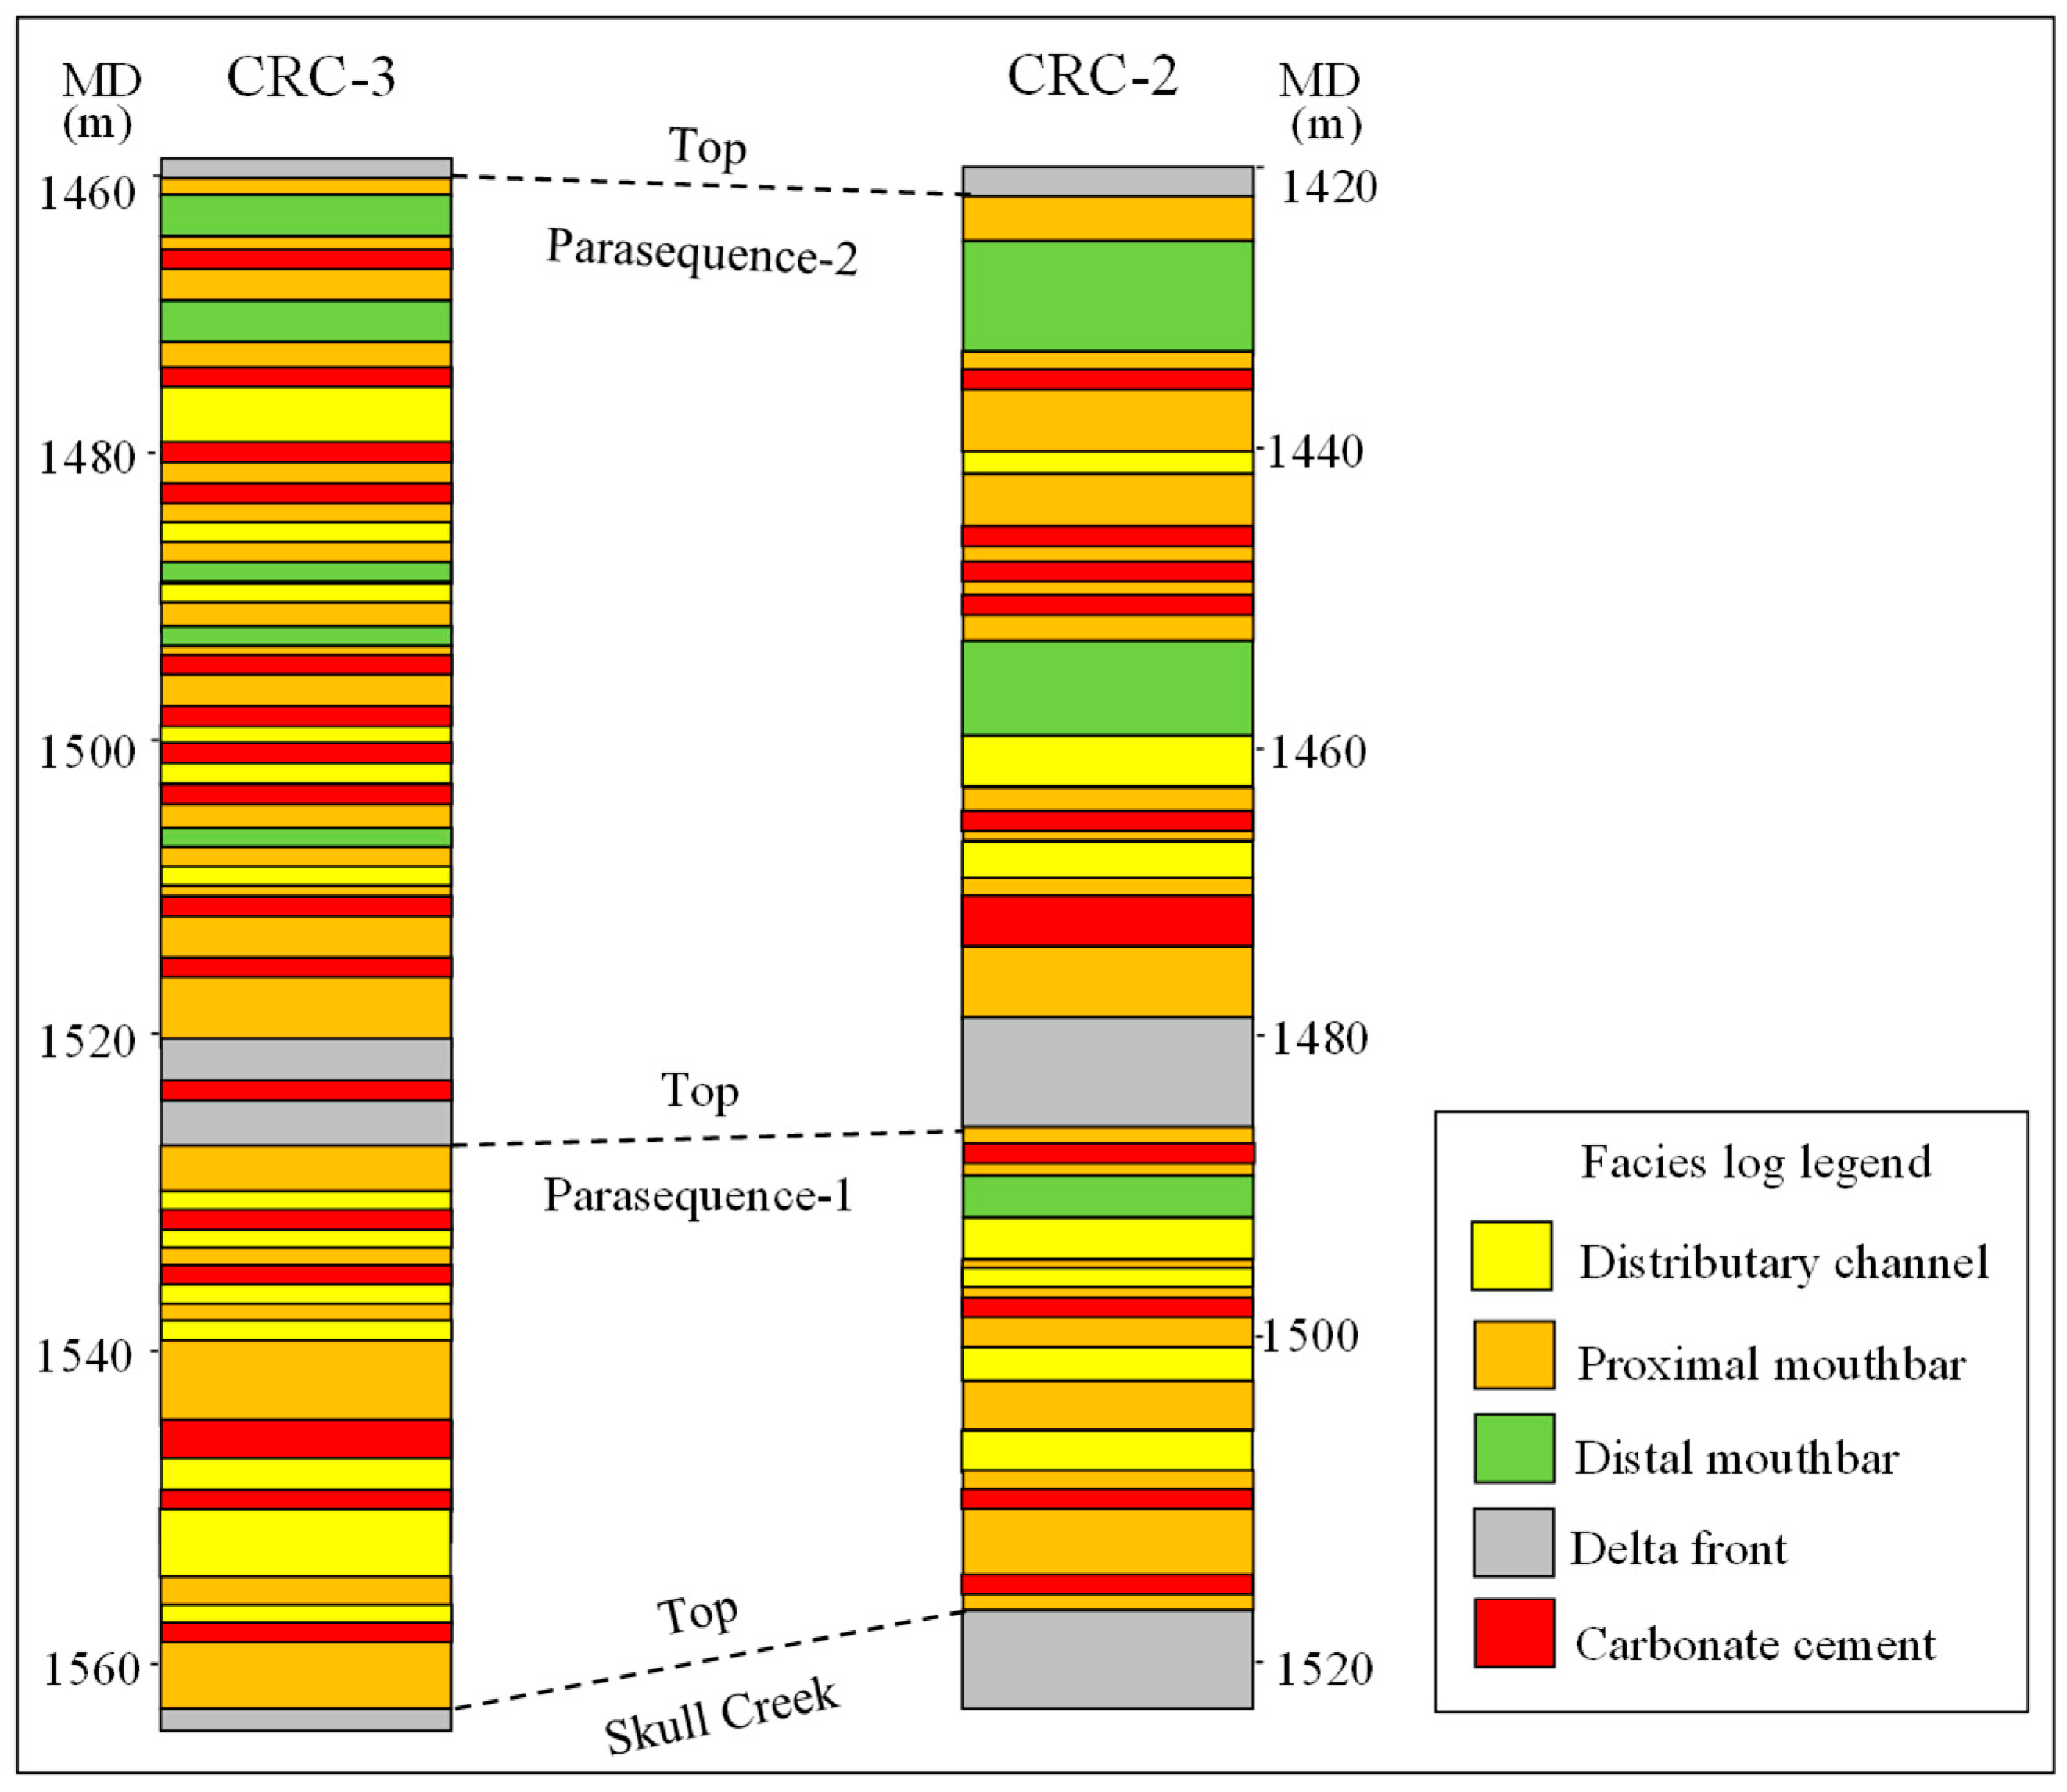
2.3. The Paaratte Formation

For the current study, the stratigraphic interval of interest at the CO2CRC’s Otway Research Facility site lies between the depth of 1461–1565 m in the CRC-3 well and is a part of the Paaratte Formation belonging to the Sherbrook Group. The formation occurs between depths of 1120–1570m with the depositional environment being lower delta plain belonging to a highstand system tract [15,16]. Lithologically, the Paaratte Formation is comprised of sandstone, siltstone and mudstone with carbonated intervals [17,18,36].
Structurally, the Paaratte Formation is a low dipping faulted anticline with dips ranging between 2°–5° towards the north [16]. The formation comprises three member units, Unit A, Unit B and Unit C. Unit A (lowermost) comprises three fourth order parasequences with Parasequence-1 at the bottom and Parasequence-3 at the top [22]. The current study focuses on Parasequence-1 and -2. Wireline data and core samples belonging to the two parasequences from wells CRC-2 and CRC-3 have been published previously [19,20,21] and the data interprested for sedimentary facies (Figure 2). The available wireline data used in the current study includes neutron porosity, apparent matrix density and gamma ray logs. The interpreted sedimentary facies have also been used, and comprise delta front, distal mouthbar, proximal mouthbar and distributary channel facies [15,16,19]. The delta front facies forms the bottommost facies in each of the two Parasequences and is overlain by distal mouthbar, proximal mouthbar and distributary channel facies.
The above-mentioned facies characterization and the previously published flow properties form the foundation of the work presented in this paper.

3. Methodology

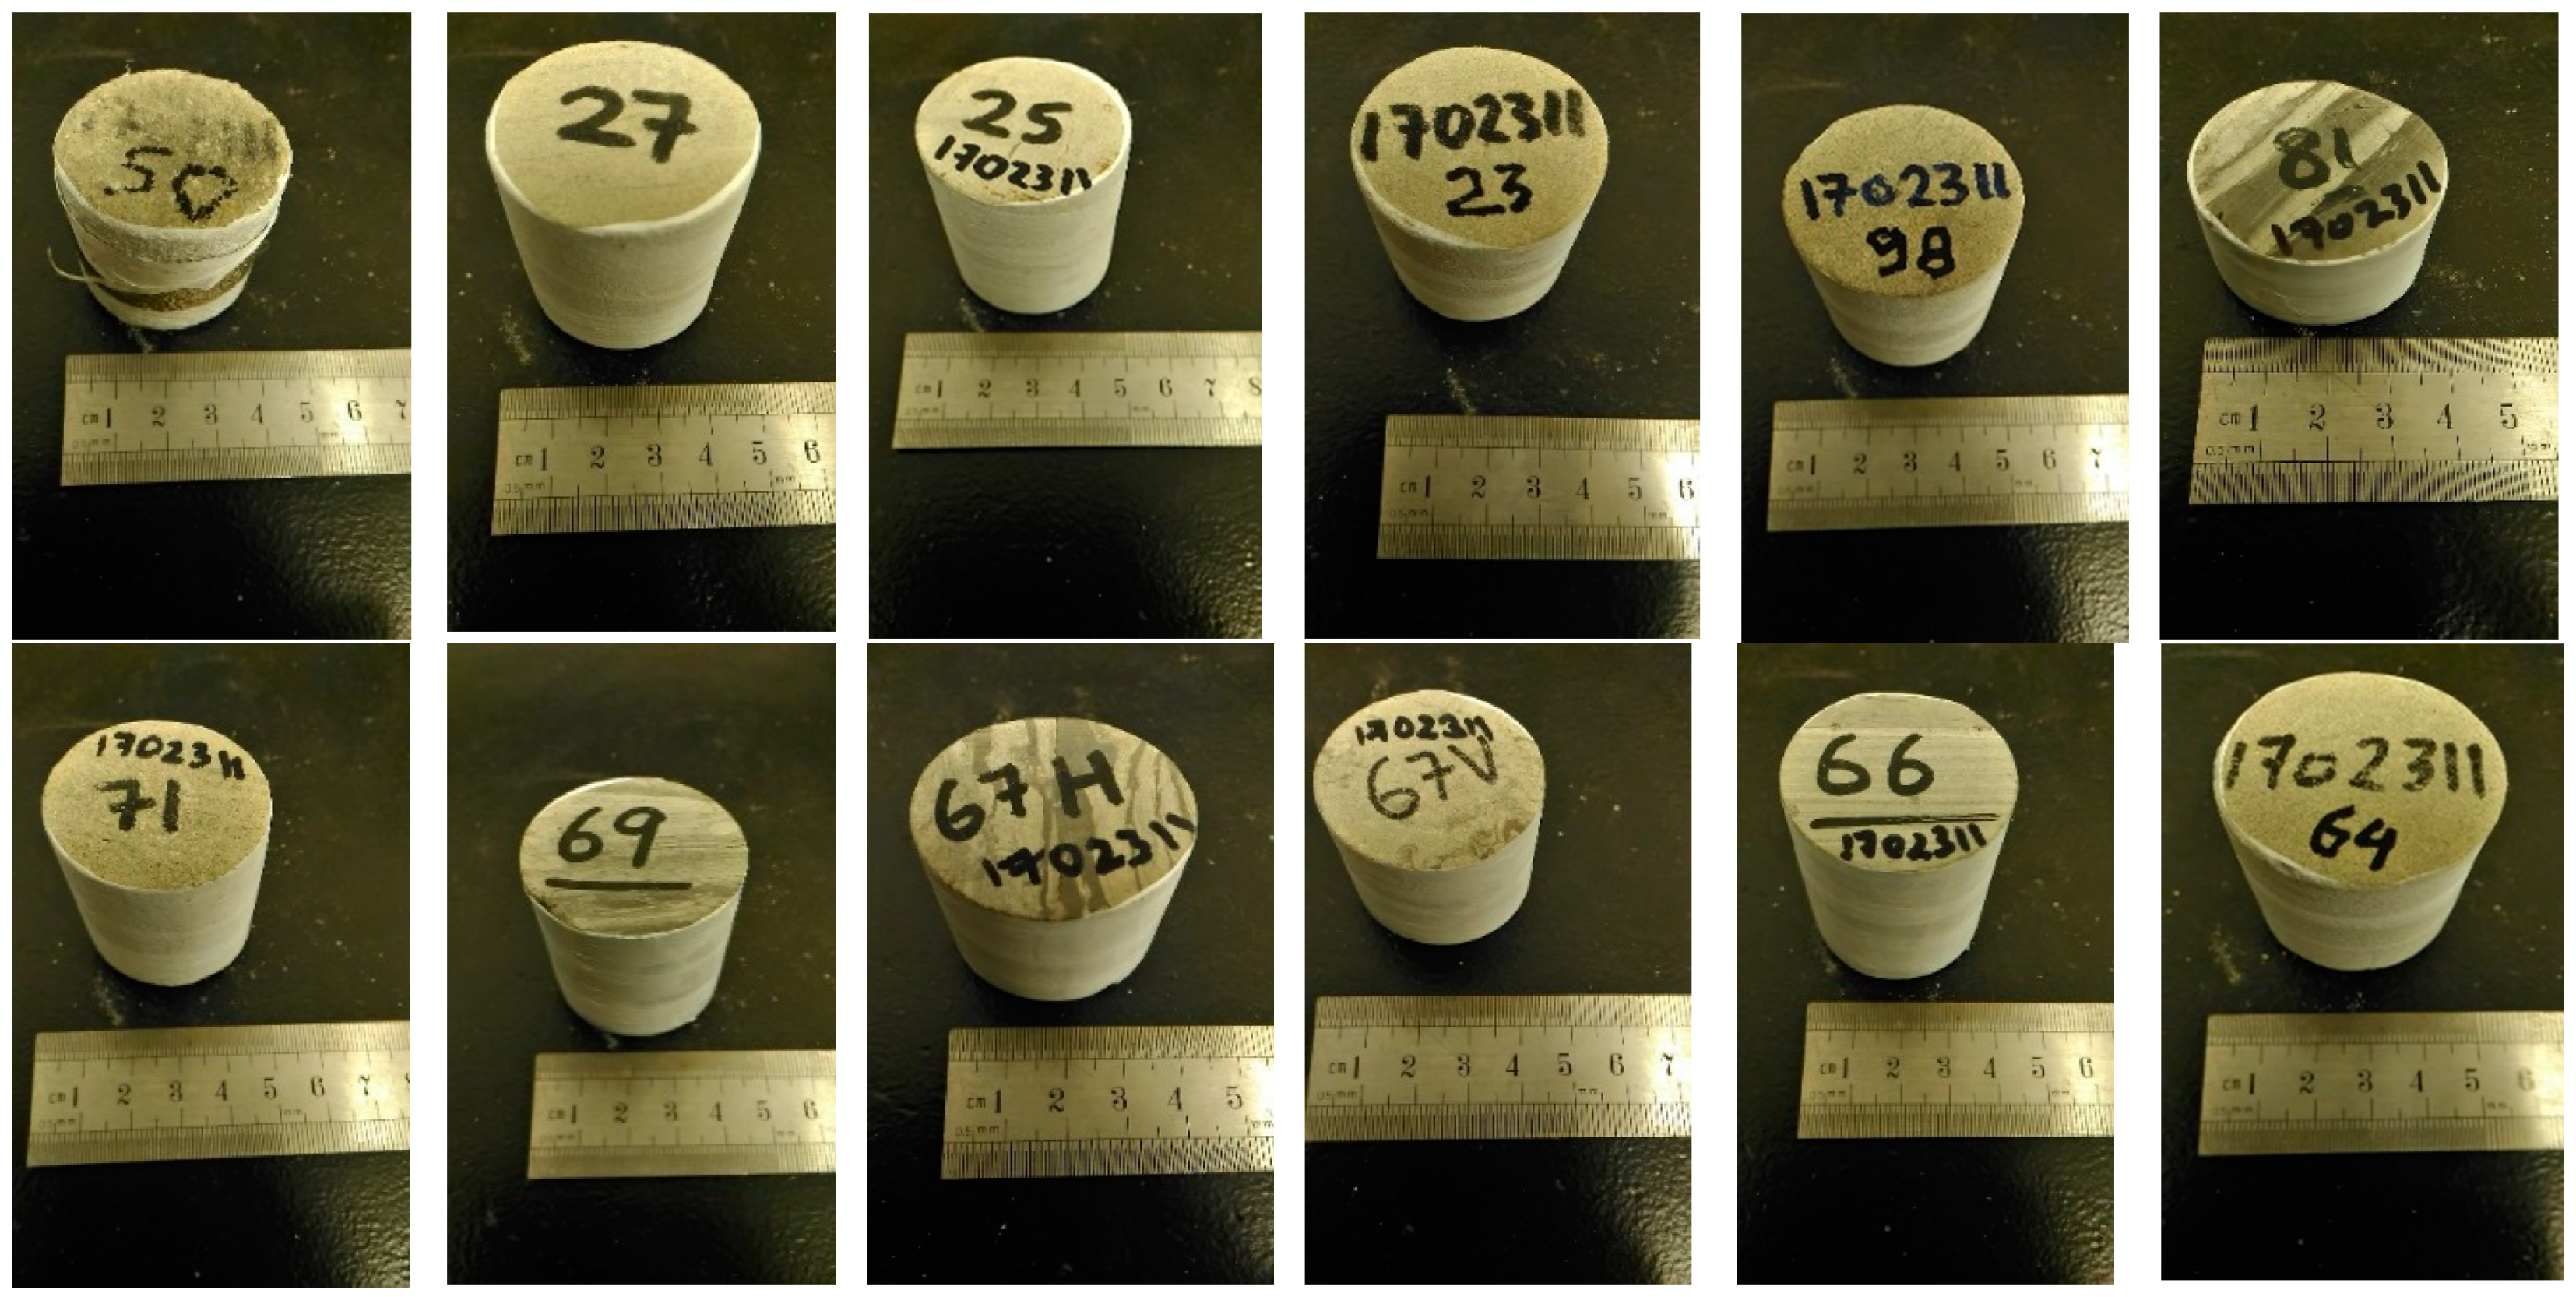
3.1. Core Sampling and Analysis

Cores of 100 meter length from the wells CRC-2 and CRC-3 were inspected visually and lithological variations described. Lithological heterogeneity was found to be abundant at sub-meter scales in the form of sedimentary structures. Broadly, three major types of sedimentary structures were identified: cross-bedding, planar bedding and massive bedding (Figure 3). The visual observation of grain sizes in the cores indicated the presence of three broad categories of lithological units: coarse grained, fine grained and cemented. Cross-bedding structures were characteristic of distributary channel facies and were dominated by coarse grained matrix and laminas of fine grained rock types. Core sections characterized by planar bedding were dominated by two different fine grained lithological units and were characteristic of the transition zone between the high energy facies such as distributary channel and proximal mouthbar and the low energy facies such as distal mouthbar and delta front. Massive bedding was typically tightly cemented and was characteristic of carbonate-cemented facies intervals. A visual grain size inspection was carried out in conjunction with the existing porosity and permeability data in order to select 30 representative samples for analysis such that they covered lithological units from all the observed grain sizes. The chosen core samples are described in Appendix A.

3.1.1. Porosity, Permeability and Capillary Entry Pressure Analysis

Porosity and permeability data used in this study were published elsewhere [19,22] and were analyzed here in terms of their abundances in different facies. Frequency plots were constructed for the two properties for each of the four facies where number of data values were 30, 105, 9 and 30 for distributary channel, proximal mouthbar, distal mouthbar and delta front facies, respectively, from the entire Paaratte Formation. Out of these, 82 data values belong to the two parasequences of interest (Appendix B, Table A3). The frequency plots provide insights into the distribution of porosity and permeability within each depositional facies which in turn, is genetically related to changes in energy in varying depositional environments and potential diagenetic cementation. Published MICP data has been used to derive the equivalent height of a CO2 column that the given sample can hold before CO2 enters the sample [20,21]. Under this condition, the capillary entry pressure (Pe) becomes equal to the buoyancy pressure (Pbu), which can be expressed in terms of CO2 column height (Equation (1)) [46].
P e   =   P b u =   0.433 Δ ρ h F W L ,
where Δρ is the density difference between brine and supercritical CO2, hFWL is the height of CO2 above free water level (FWL) and 0.433 is the pressure gradient in psi/ft.
The sample specific values of entry pressures have been used to determine the broad range of entry pressures for each rock type class.

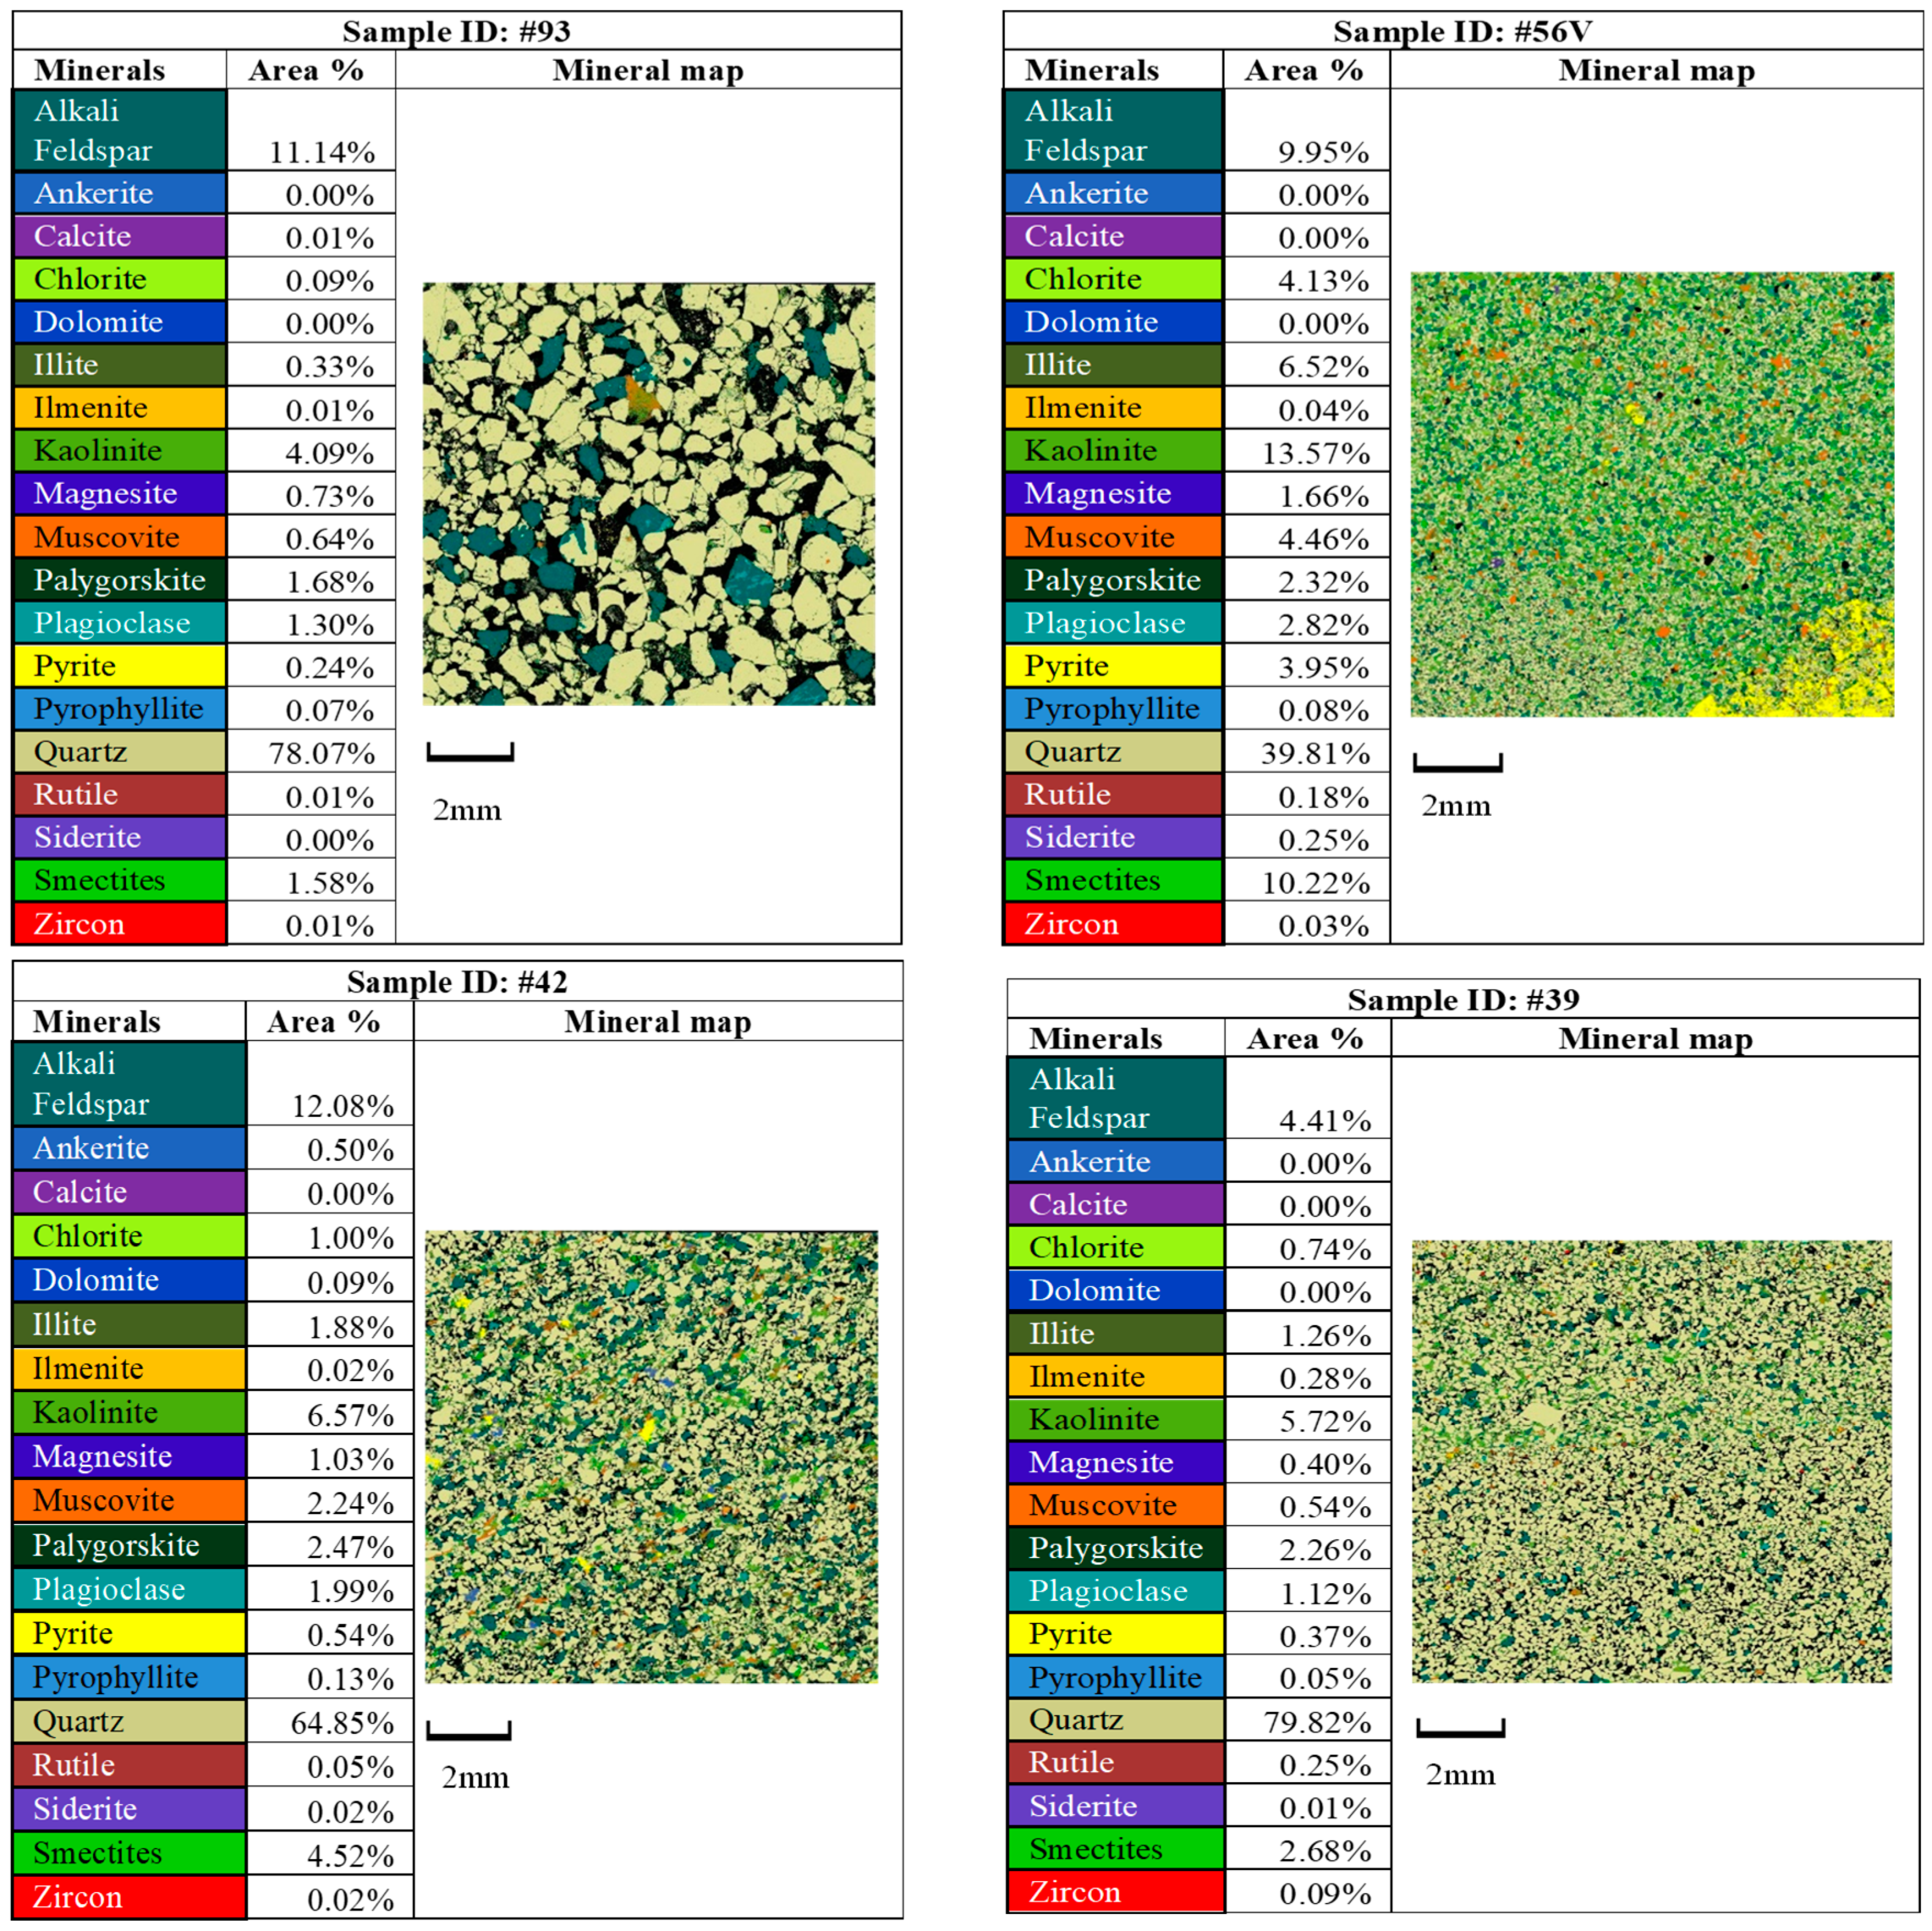
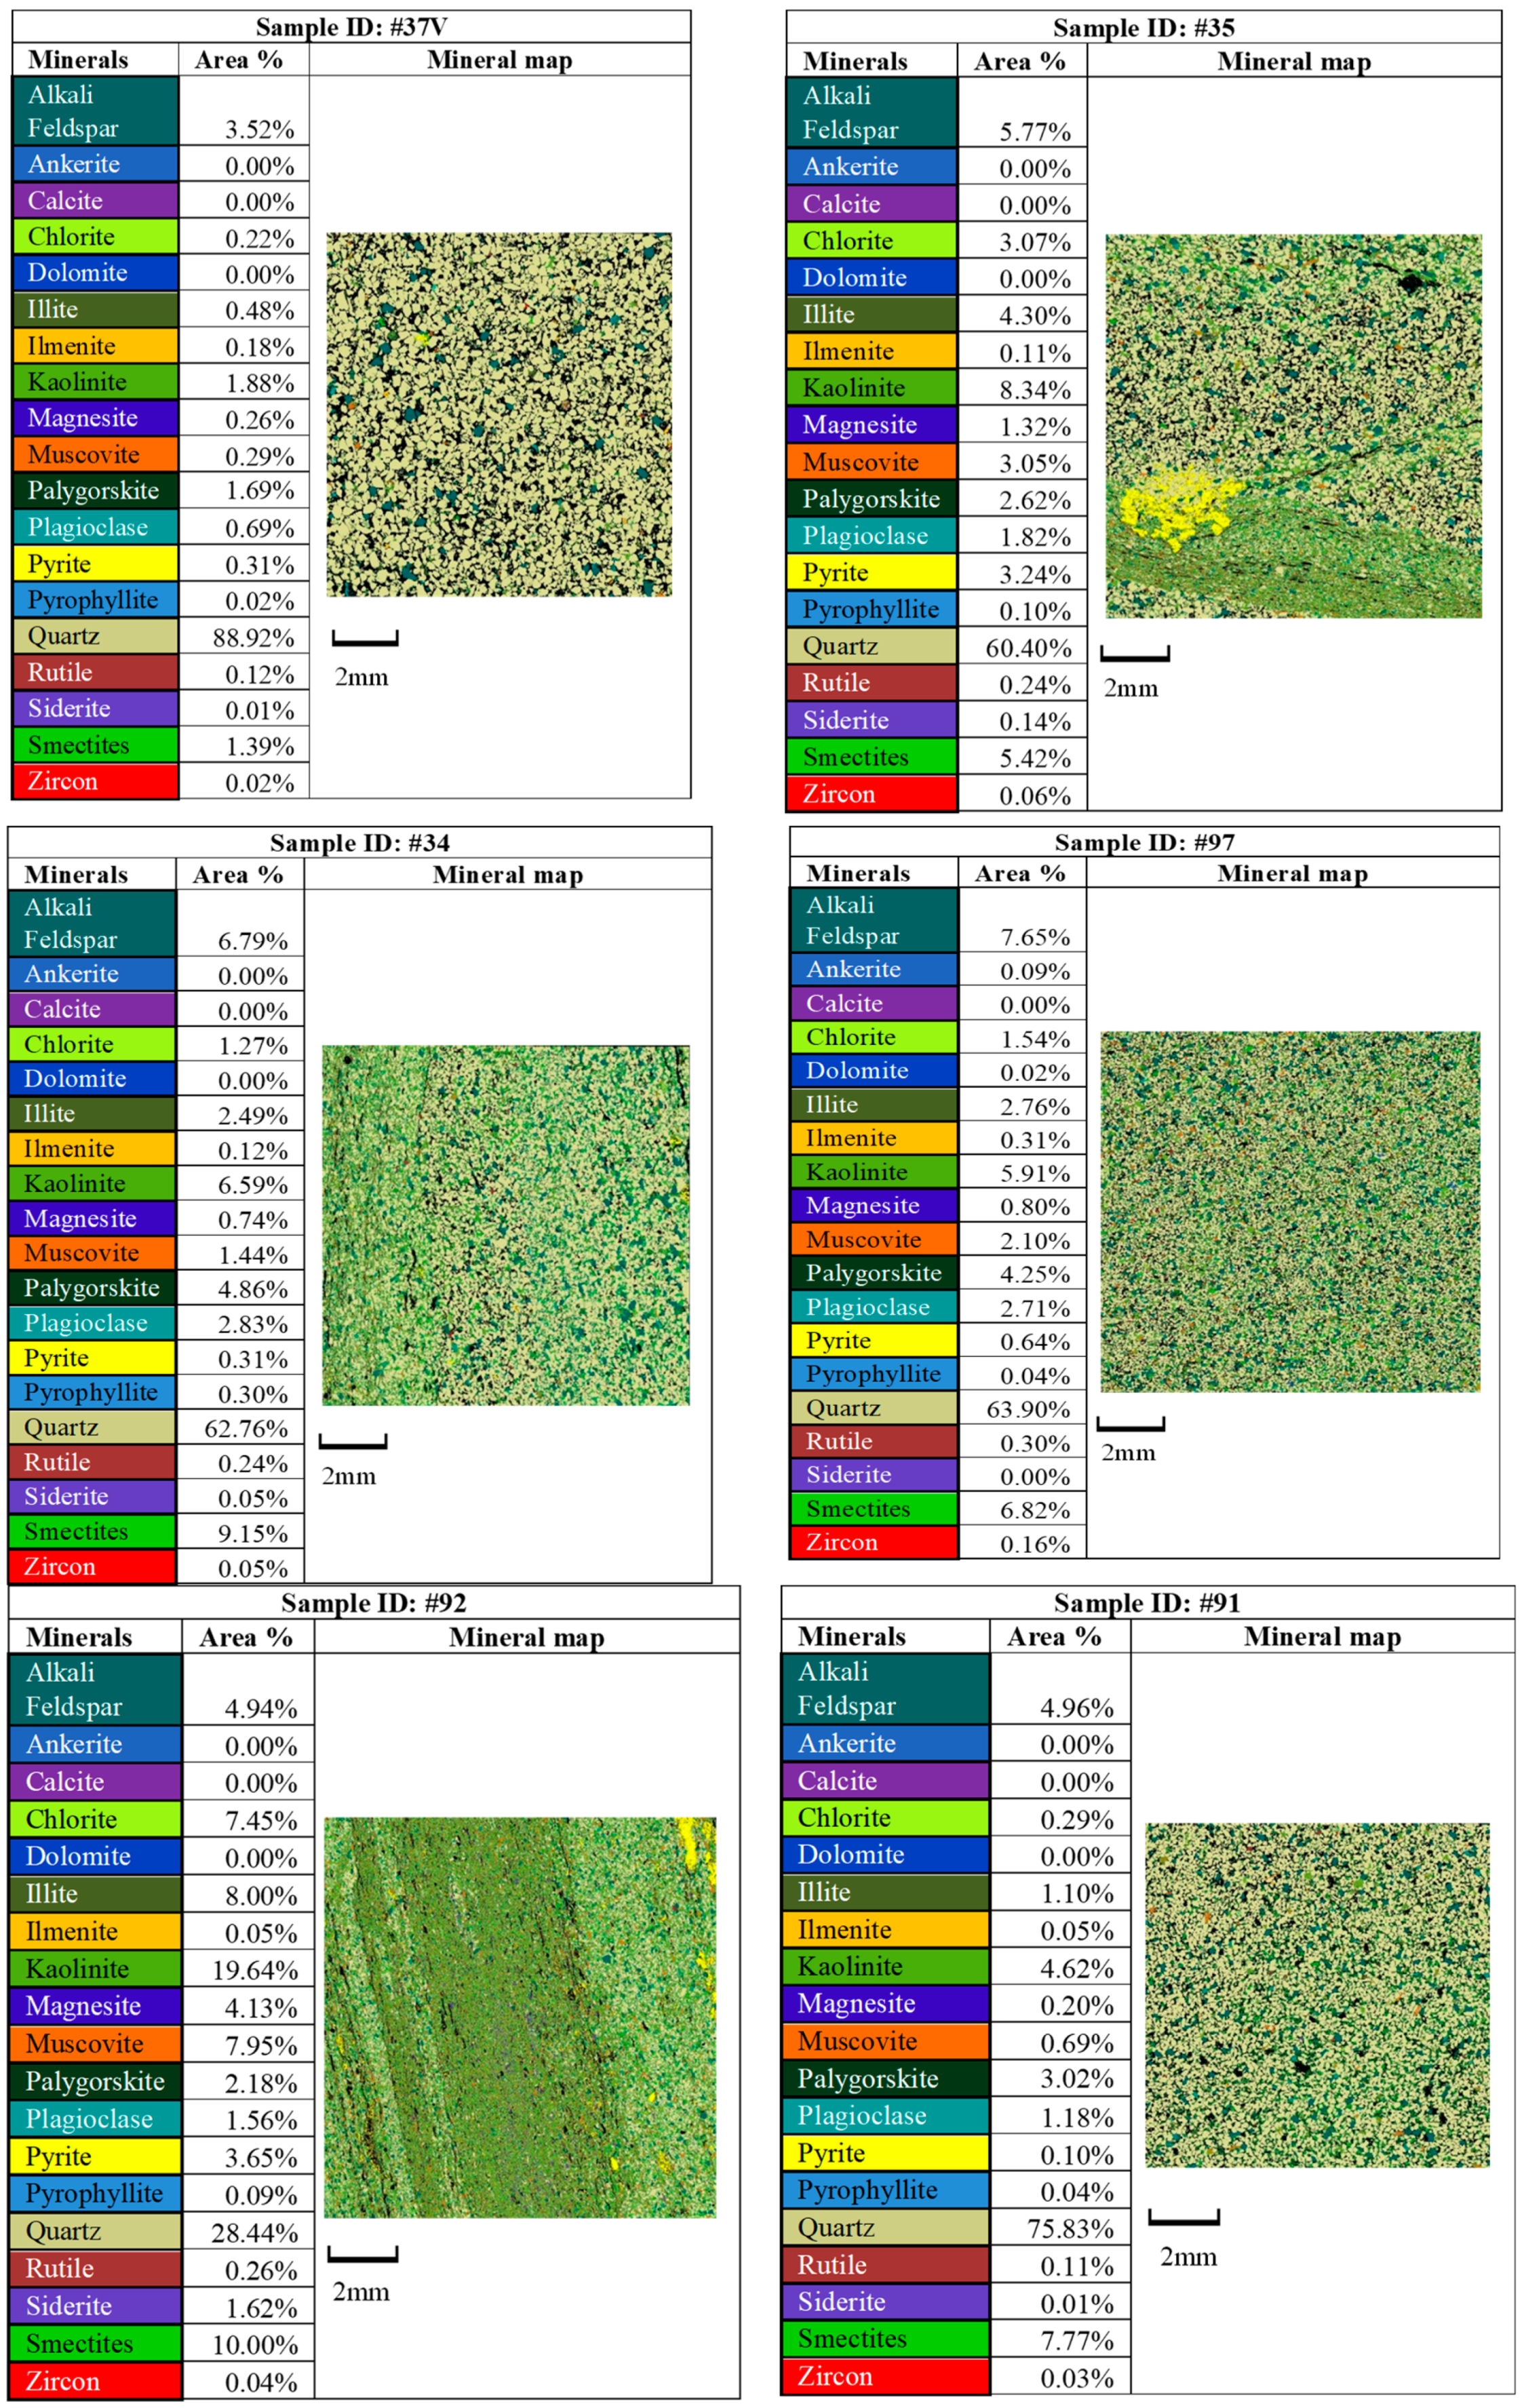
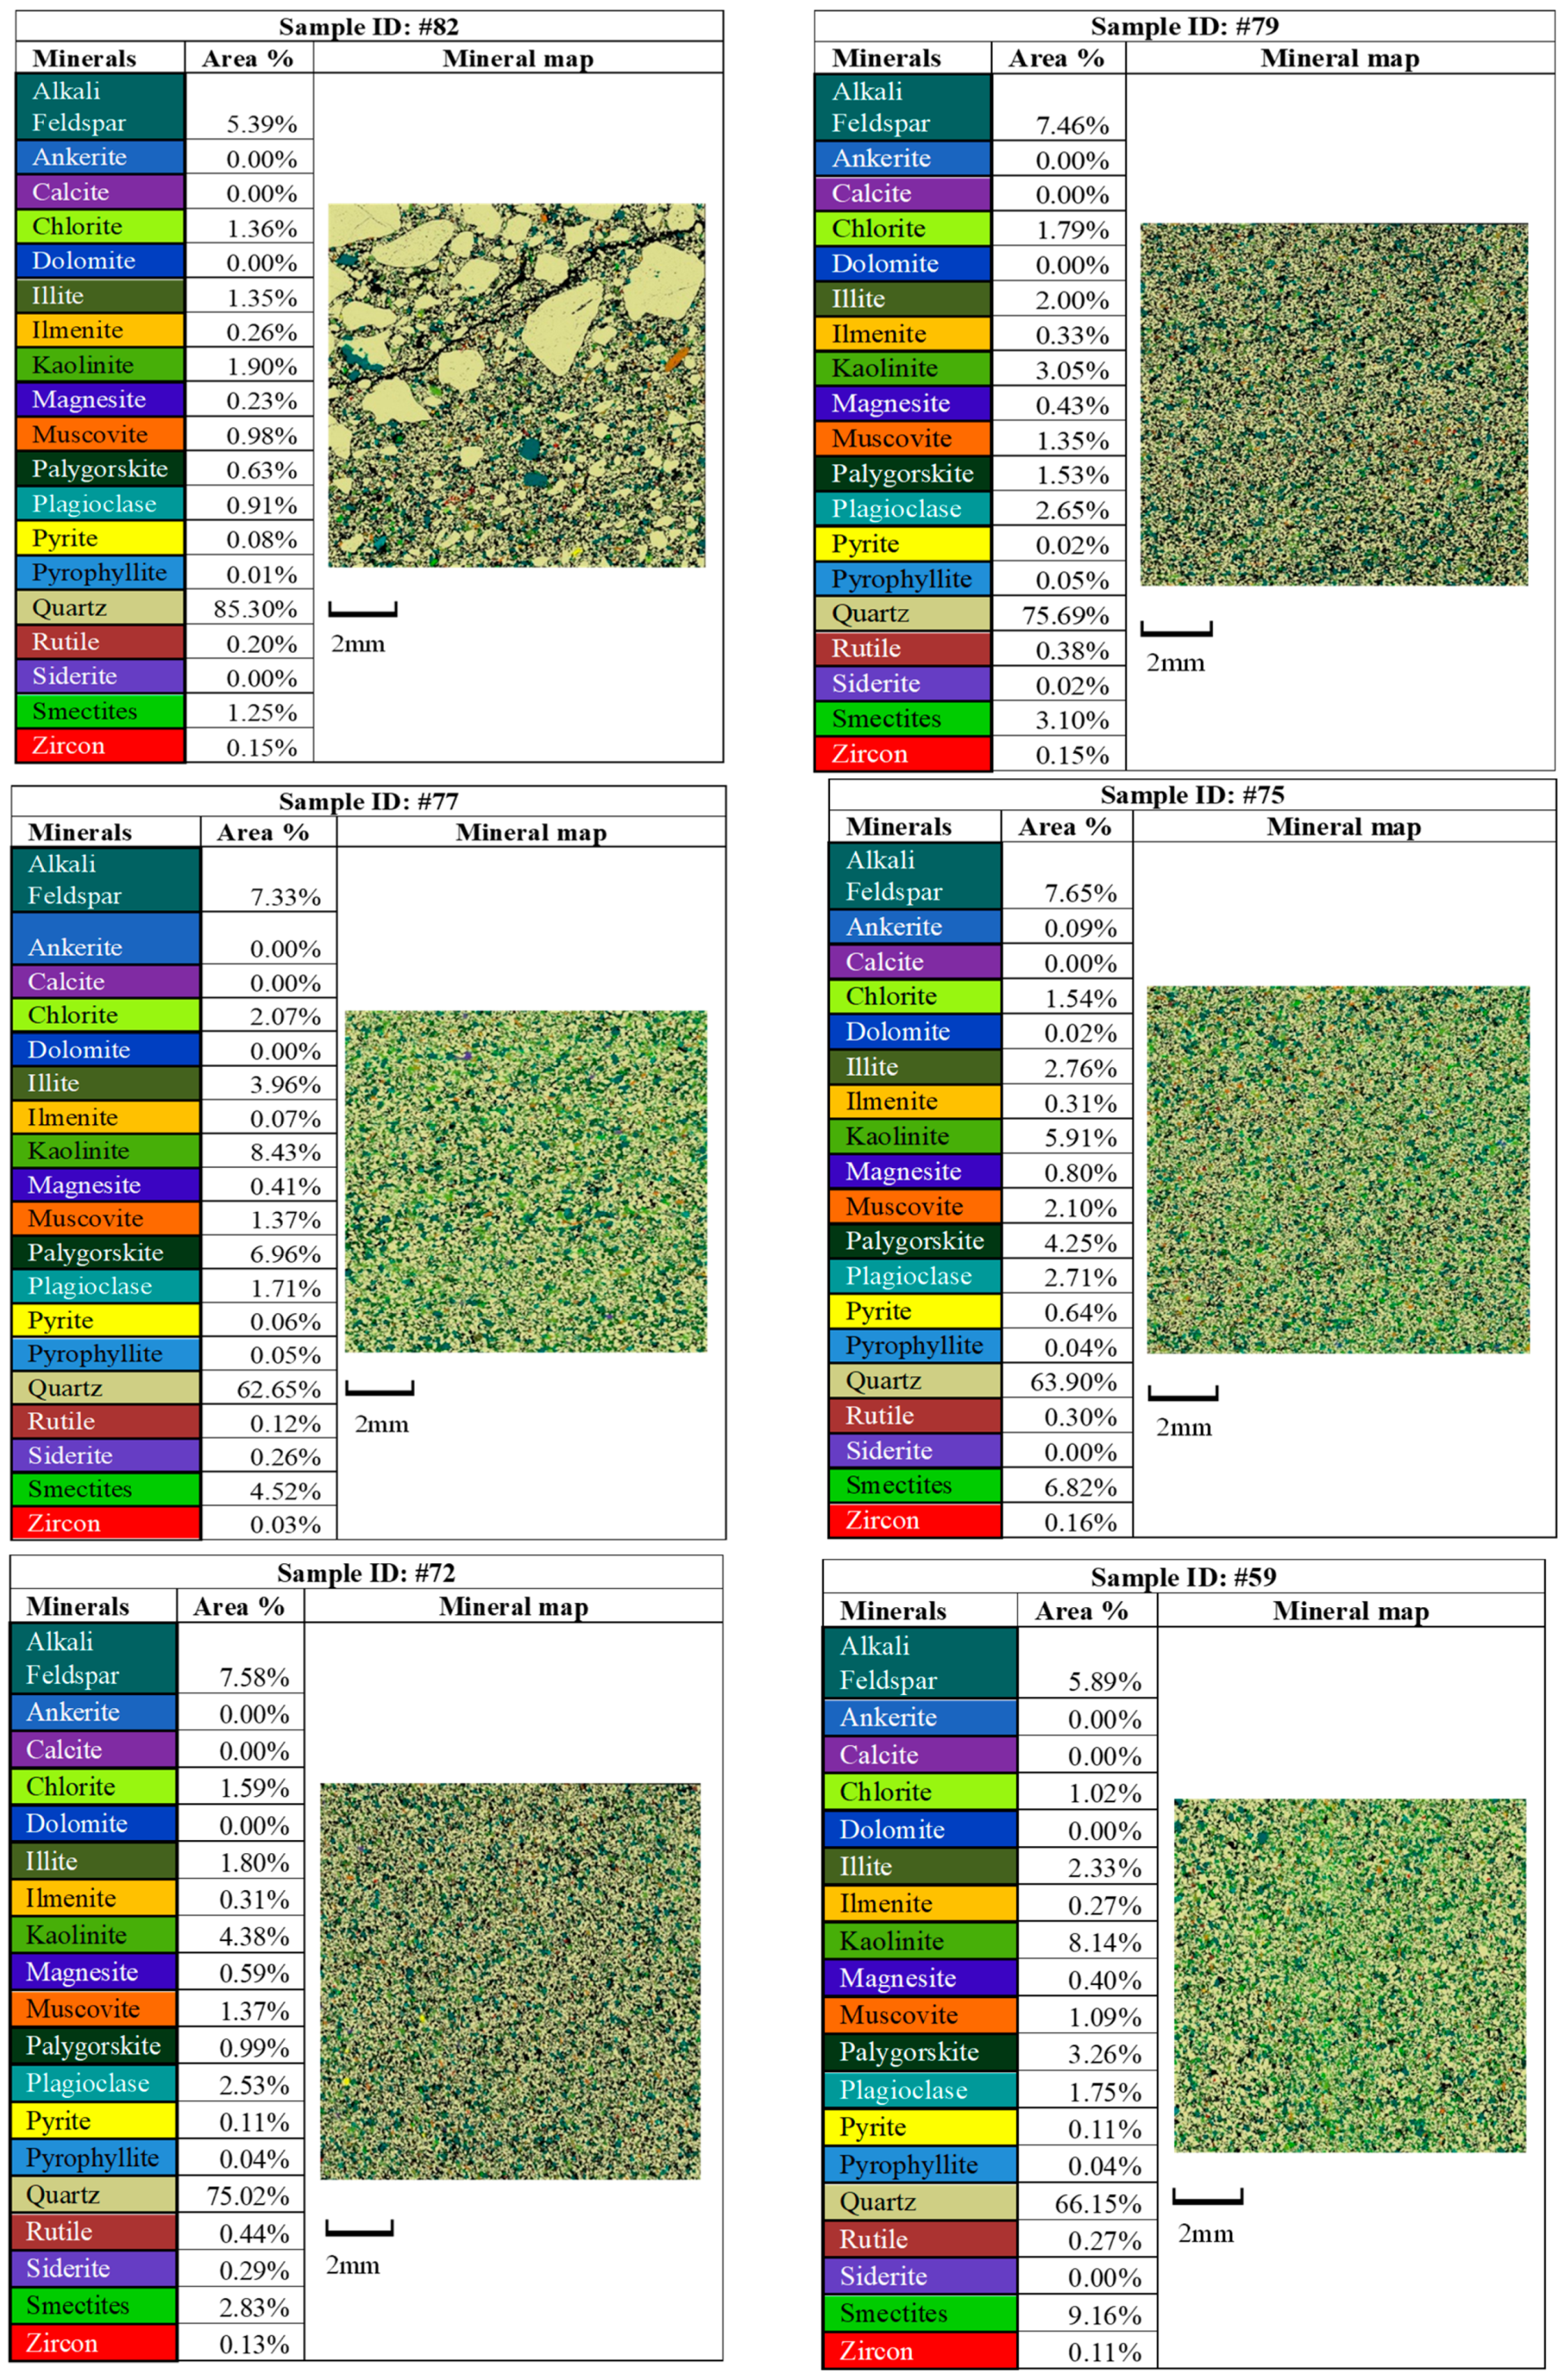
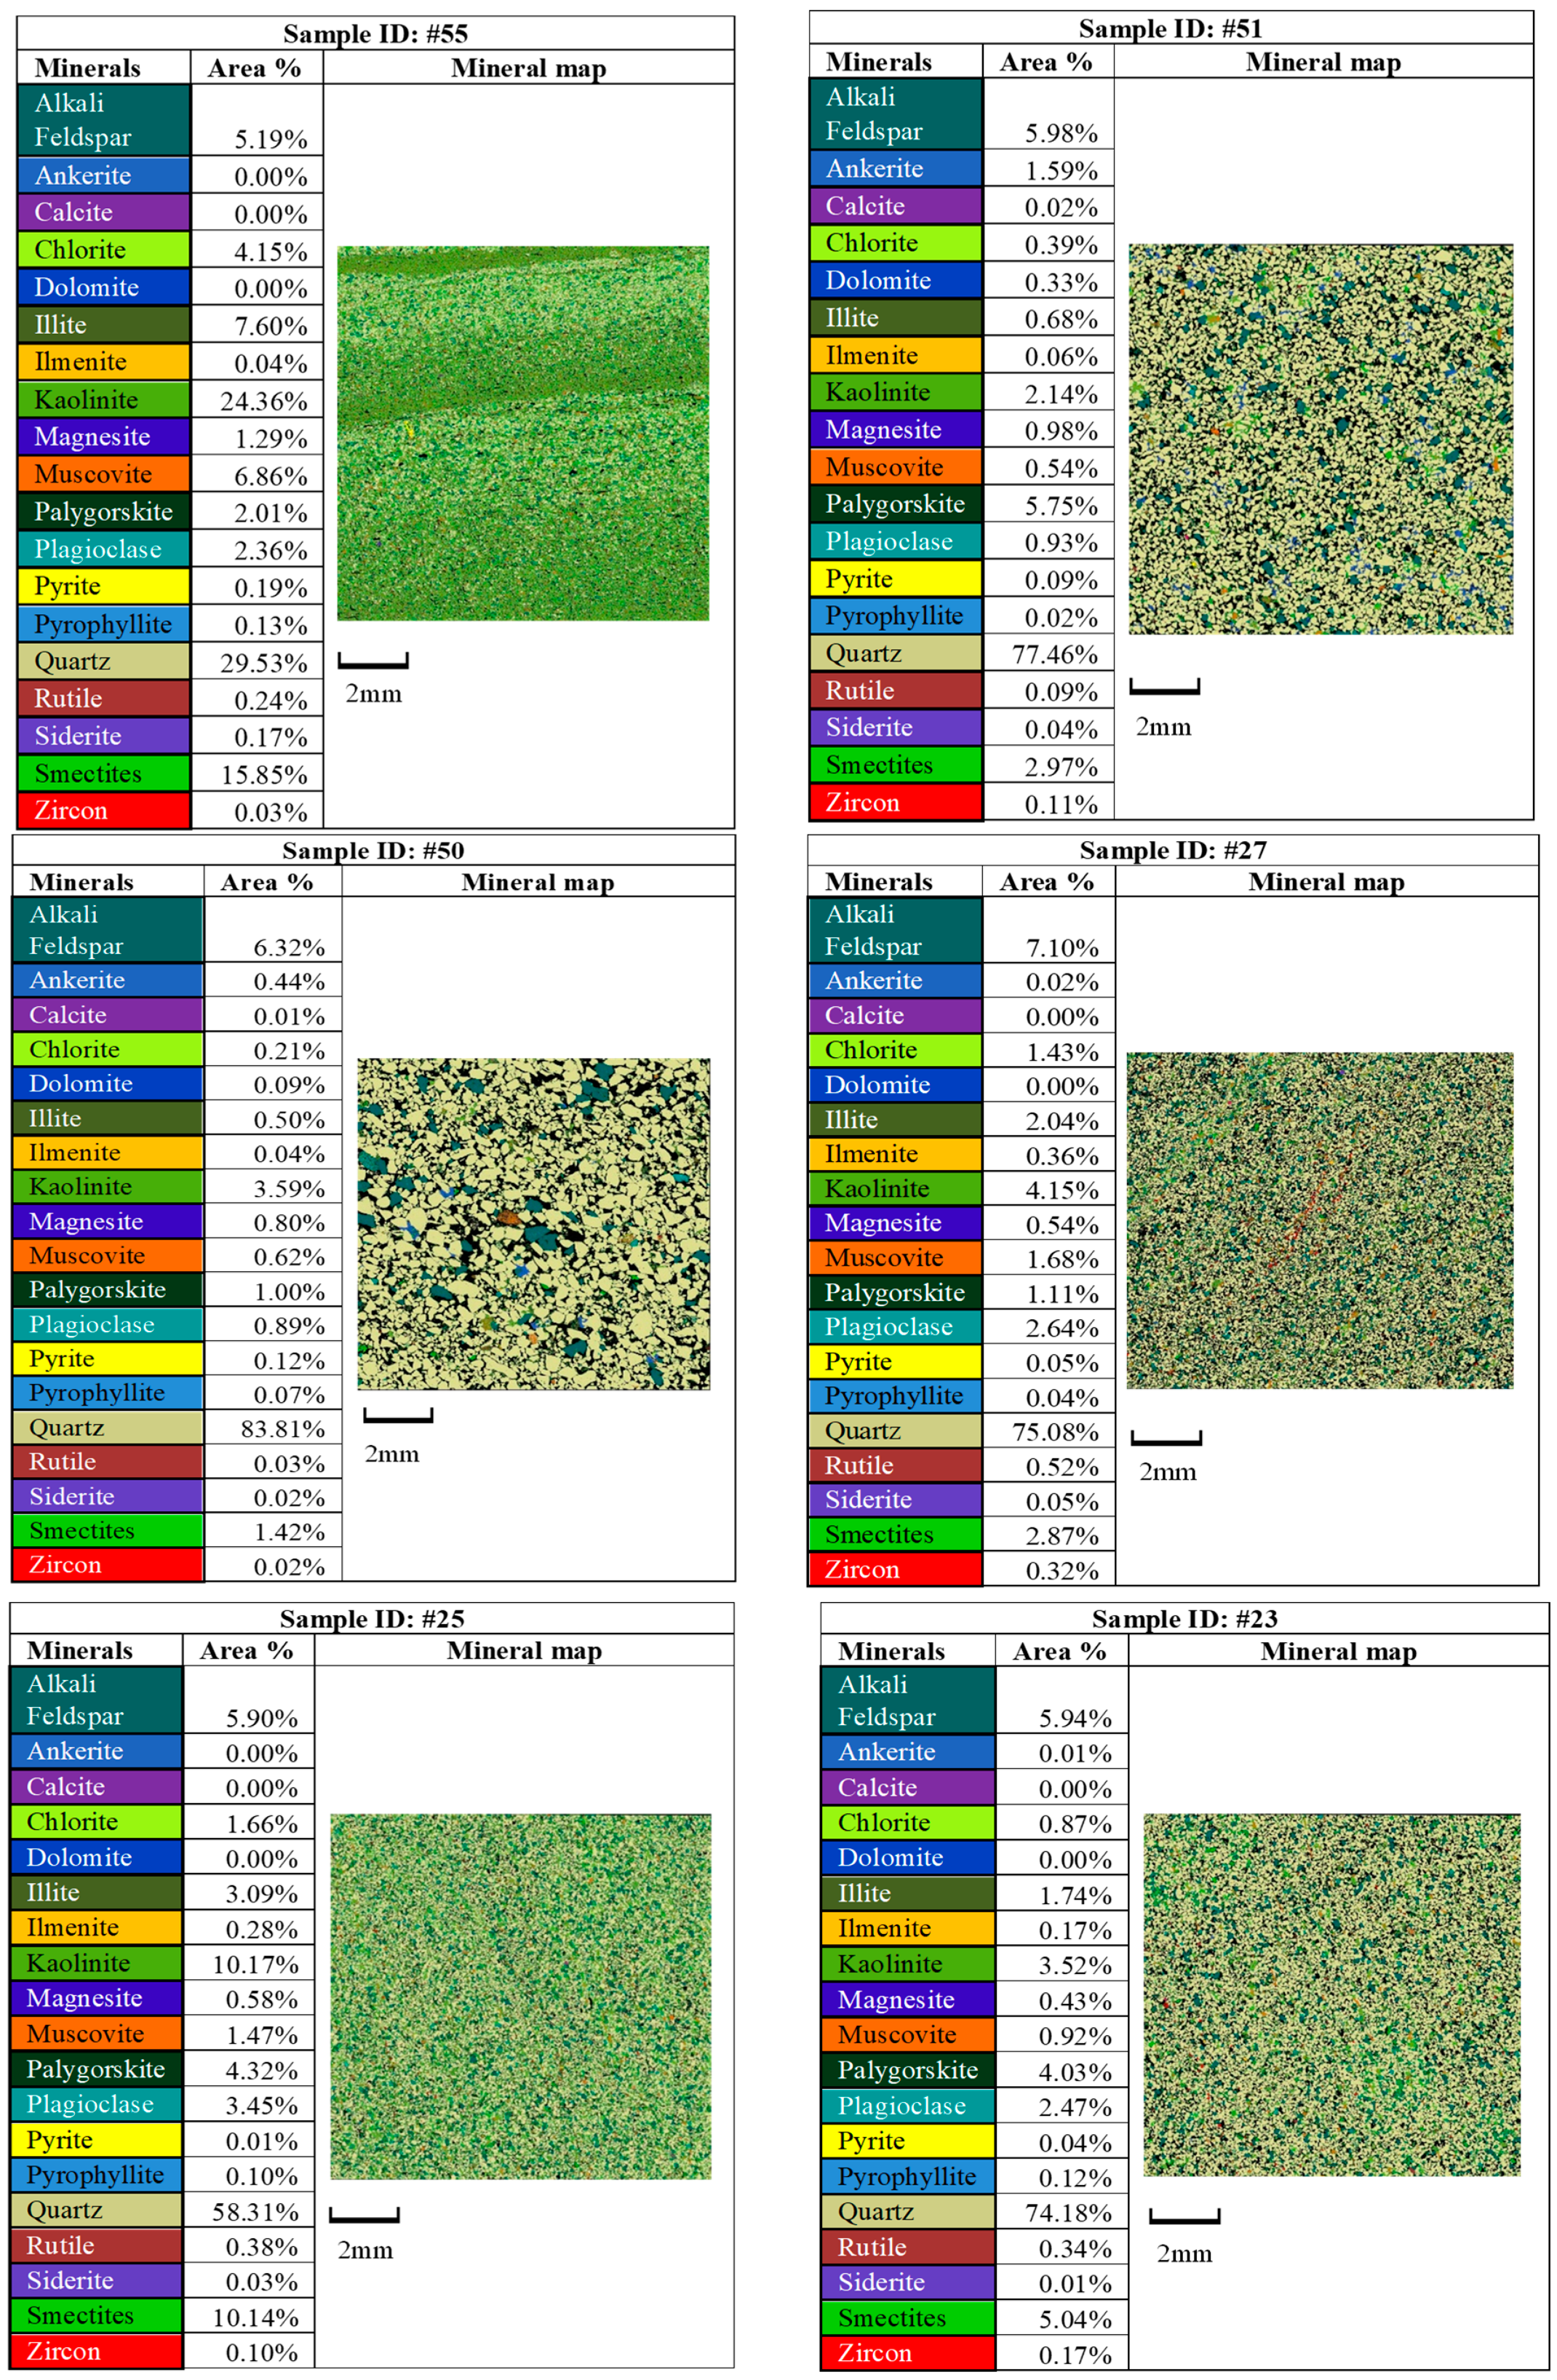
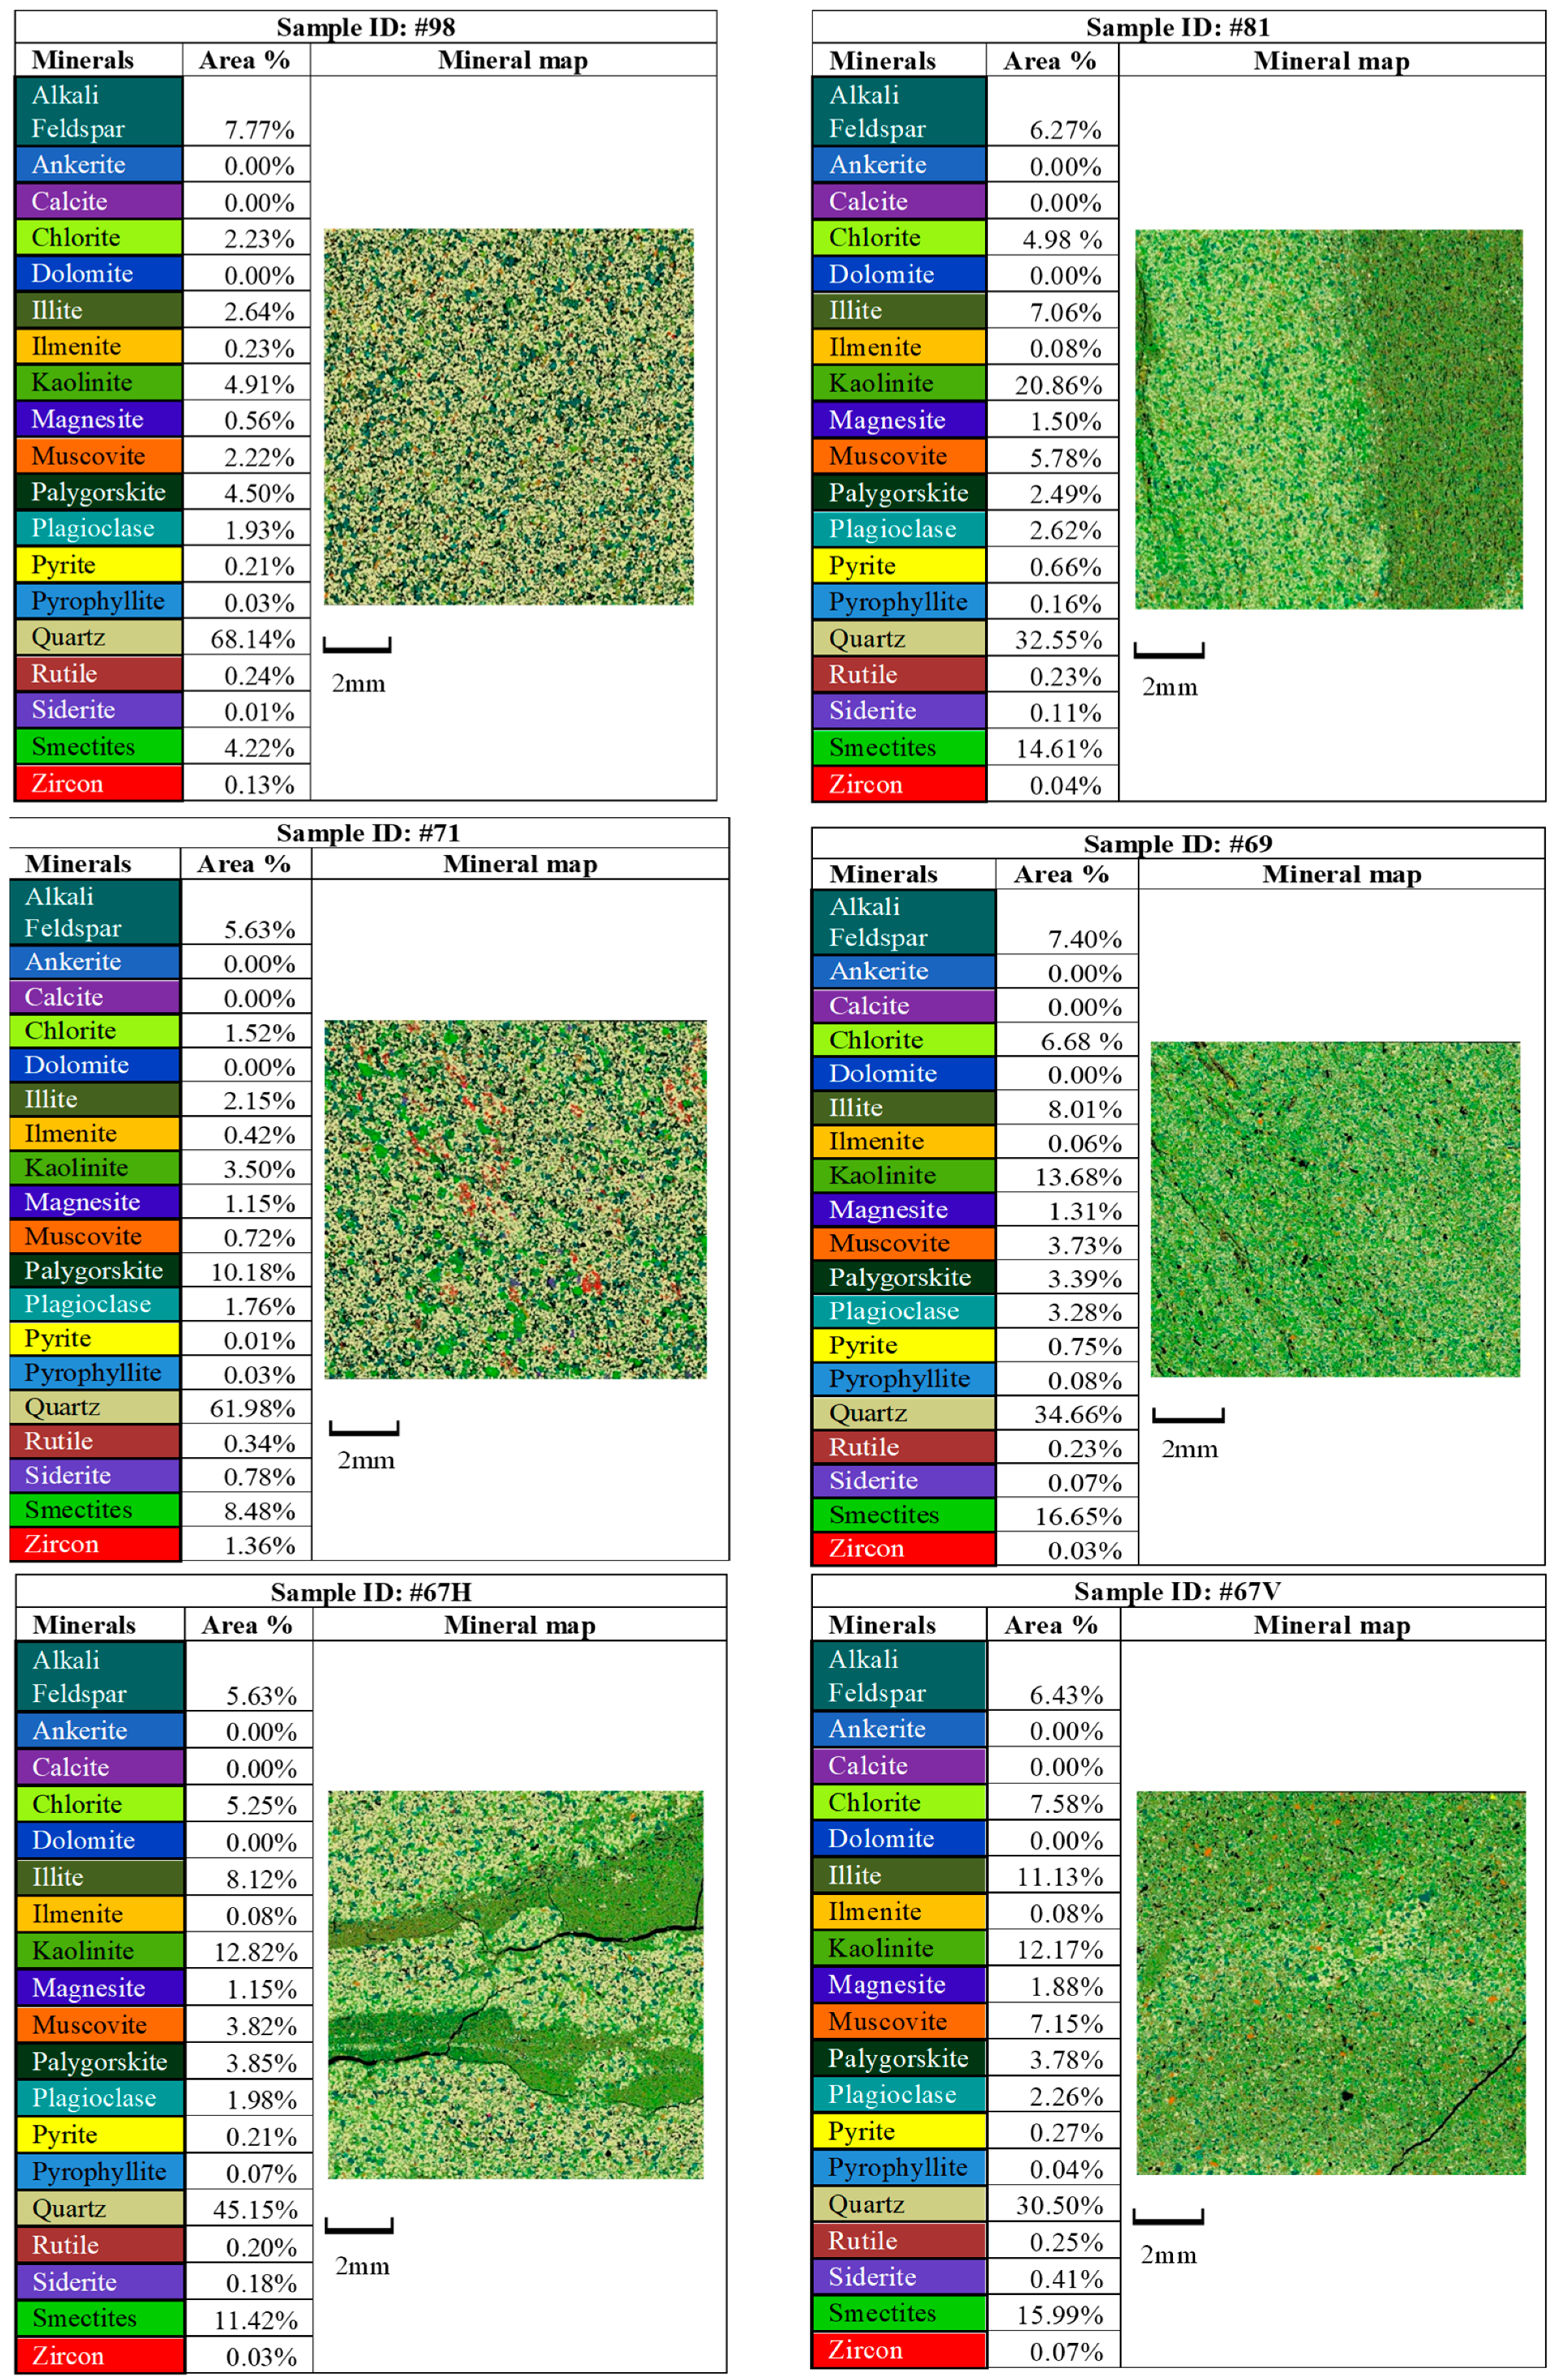
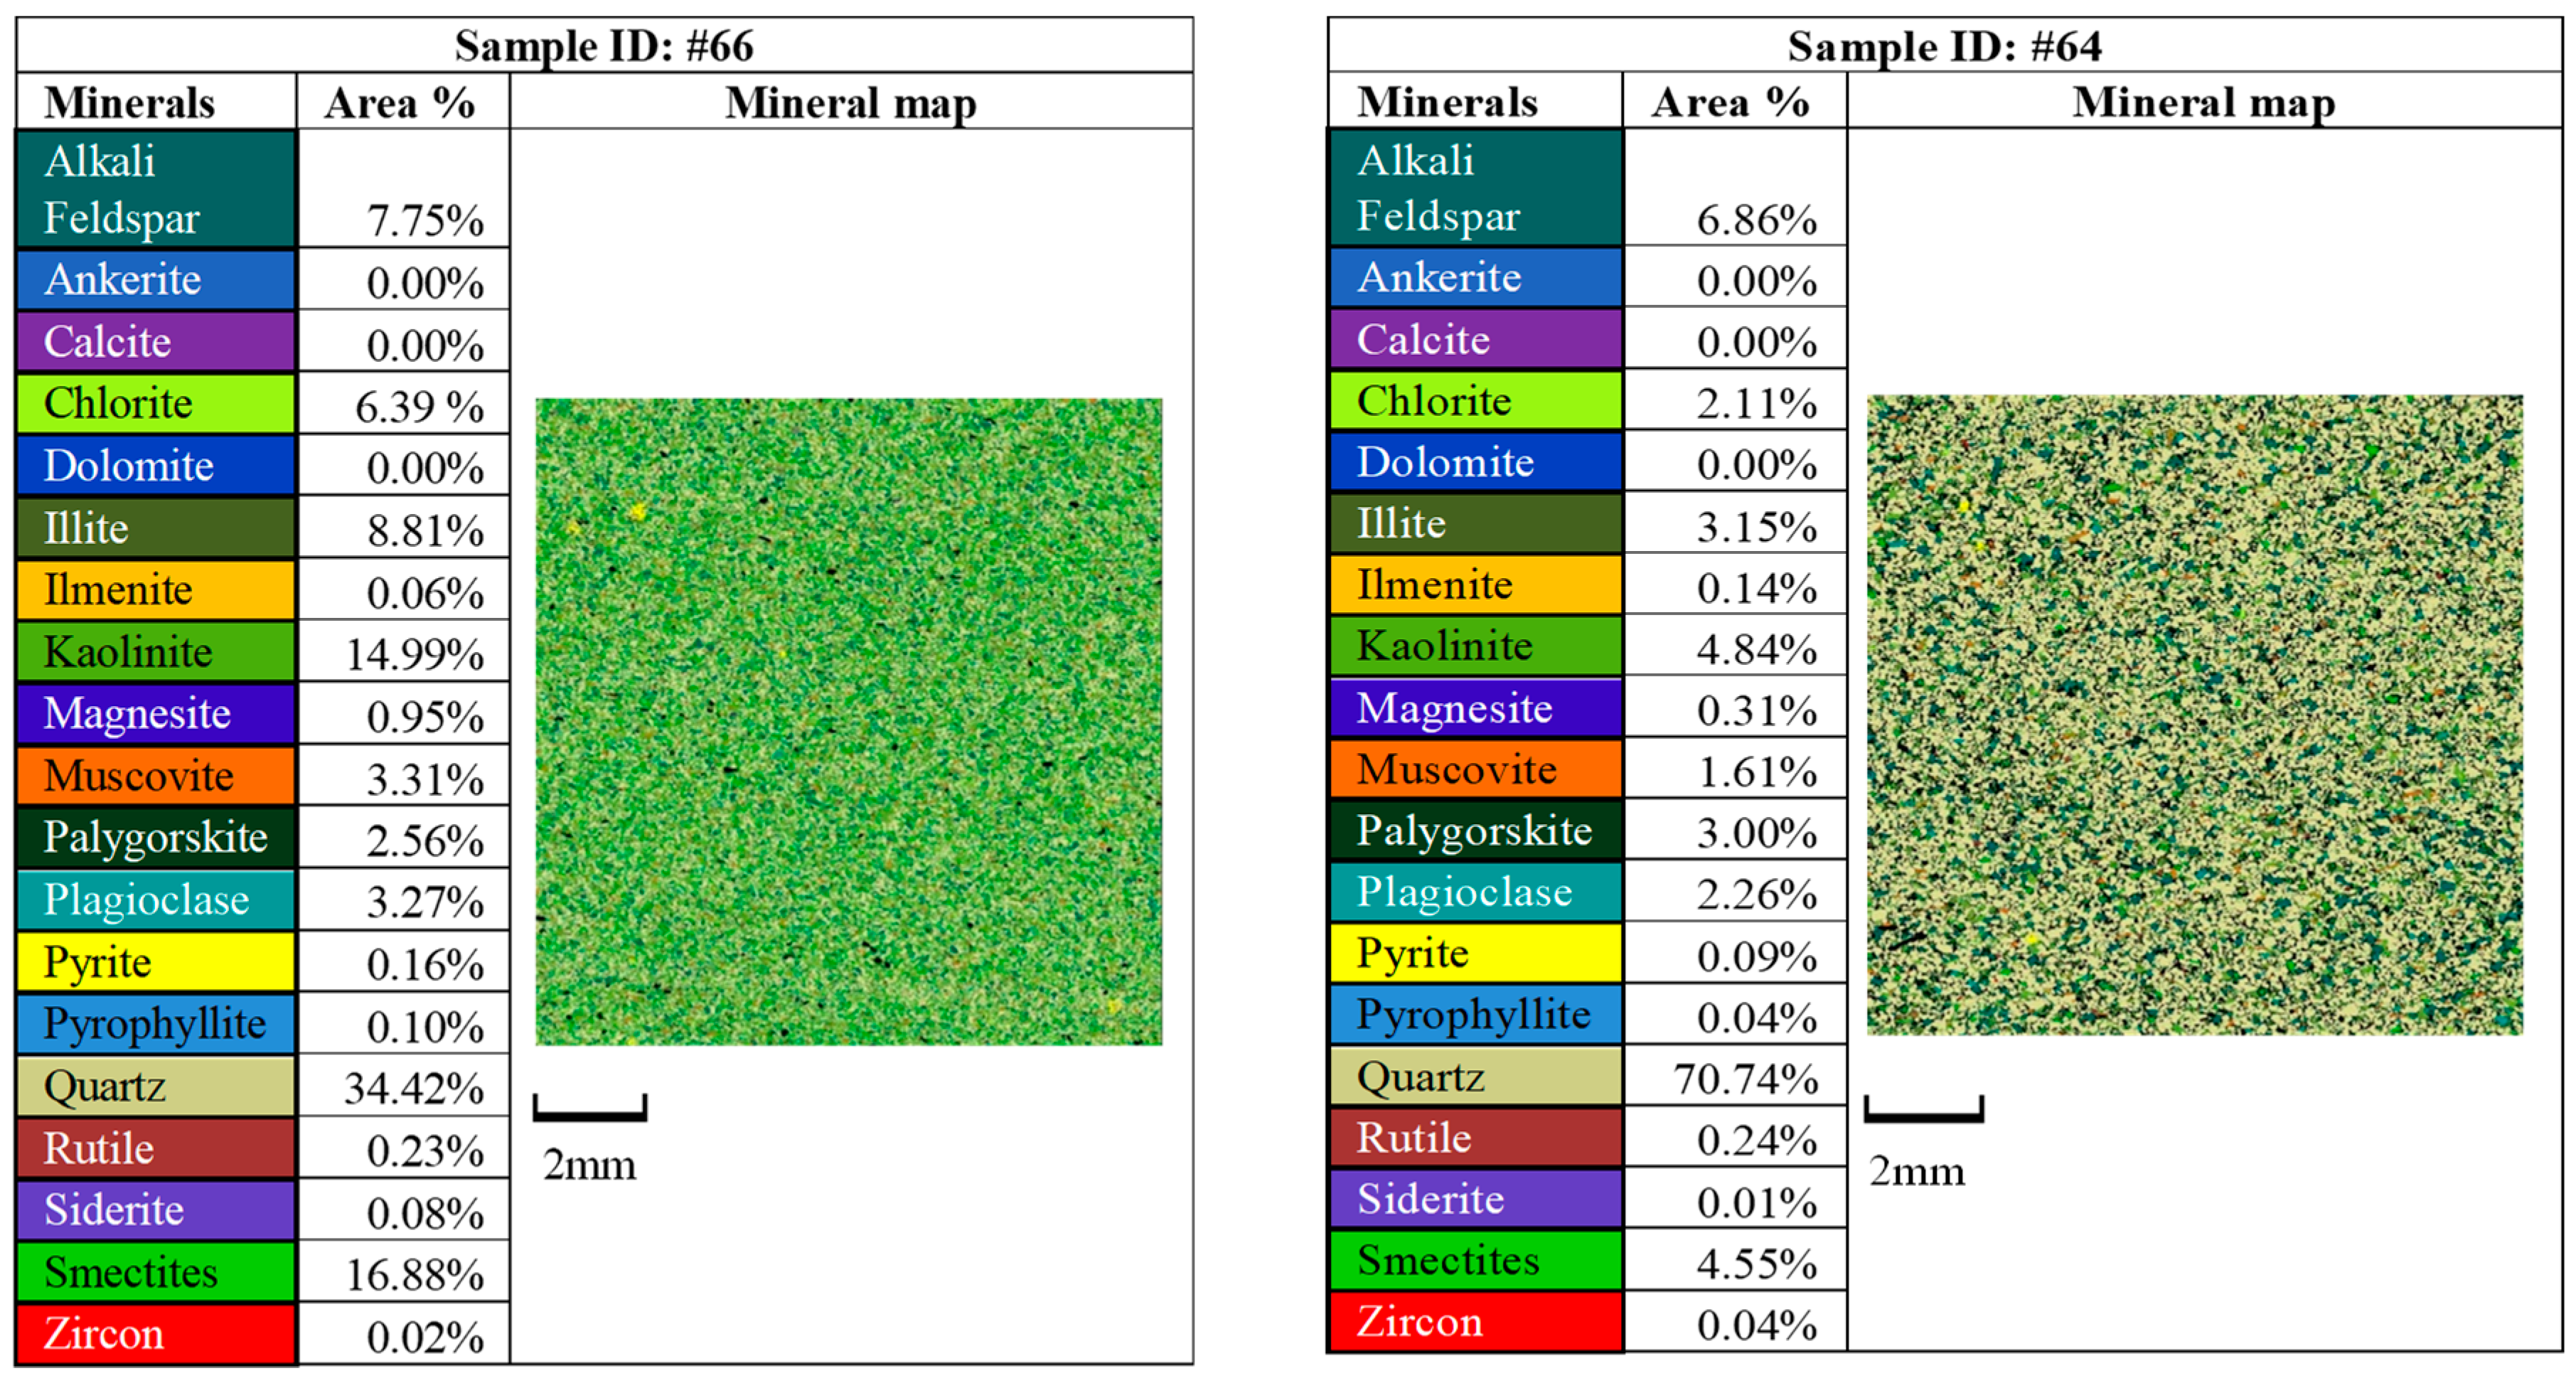
3.1.2. Quantitative Mineral Composition Analysis

Quantitative Evaluation of Minerals by Scanning Electron Microscopy is referred to as QEMSCAN and is an automated technique that combines SEM and energy dispersive X-ray spectroscopy analysis and produces a high resolution 2D mineral map of a polished rock surface. The technique is used to quantify the mineral composition in terms of the area occupied by the minerals [47,48]. The results from QEMSCAN analysis are used to distinguish rock type classes based on their mineral content. The analysis was done on a sample area of 1cm2 where each pixel on the mineral map corresponds to a length of 5.93 µm.
The QEMSCAN analysis was done on 30 thin sections prepared on samples from the CRC-3 core (Section 3.1, Appendix A). The proportion of major minerals in the four facies is evaluated using the QEMSCAN results corresponding to samples from each facies. As the samples are chosen from all four facies, it is possible to obtain an average value of the volume fraction of different minerals for each facies along with an estimate of their respective deviations.

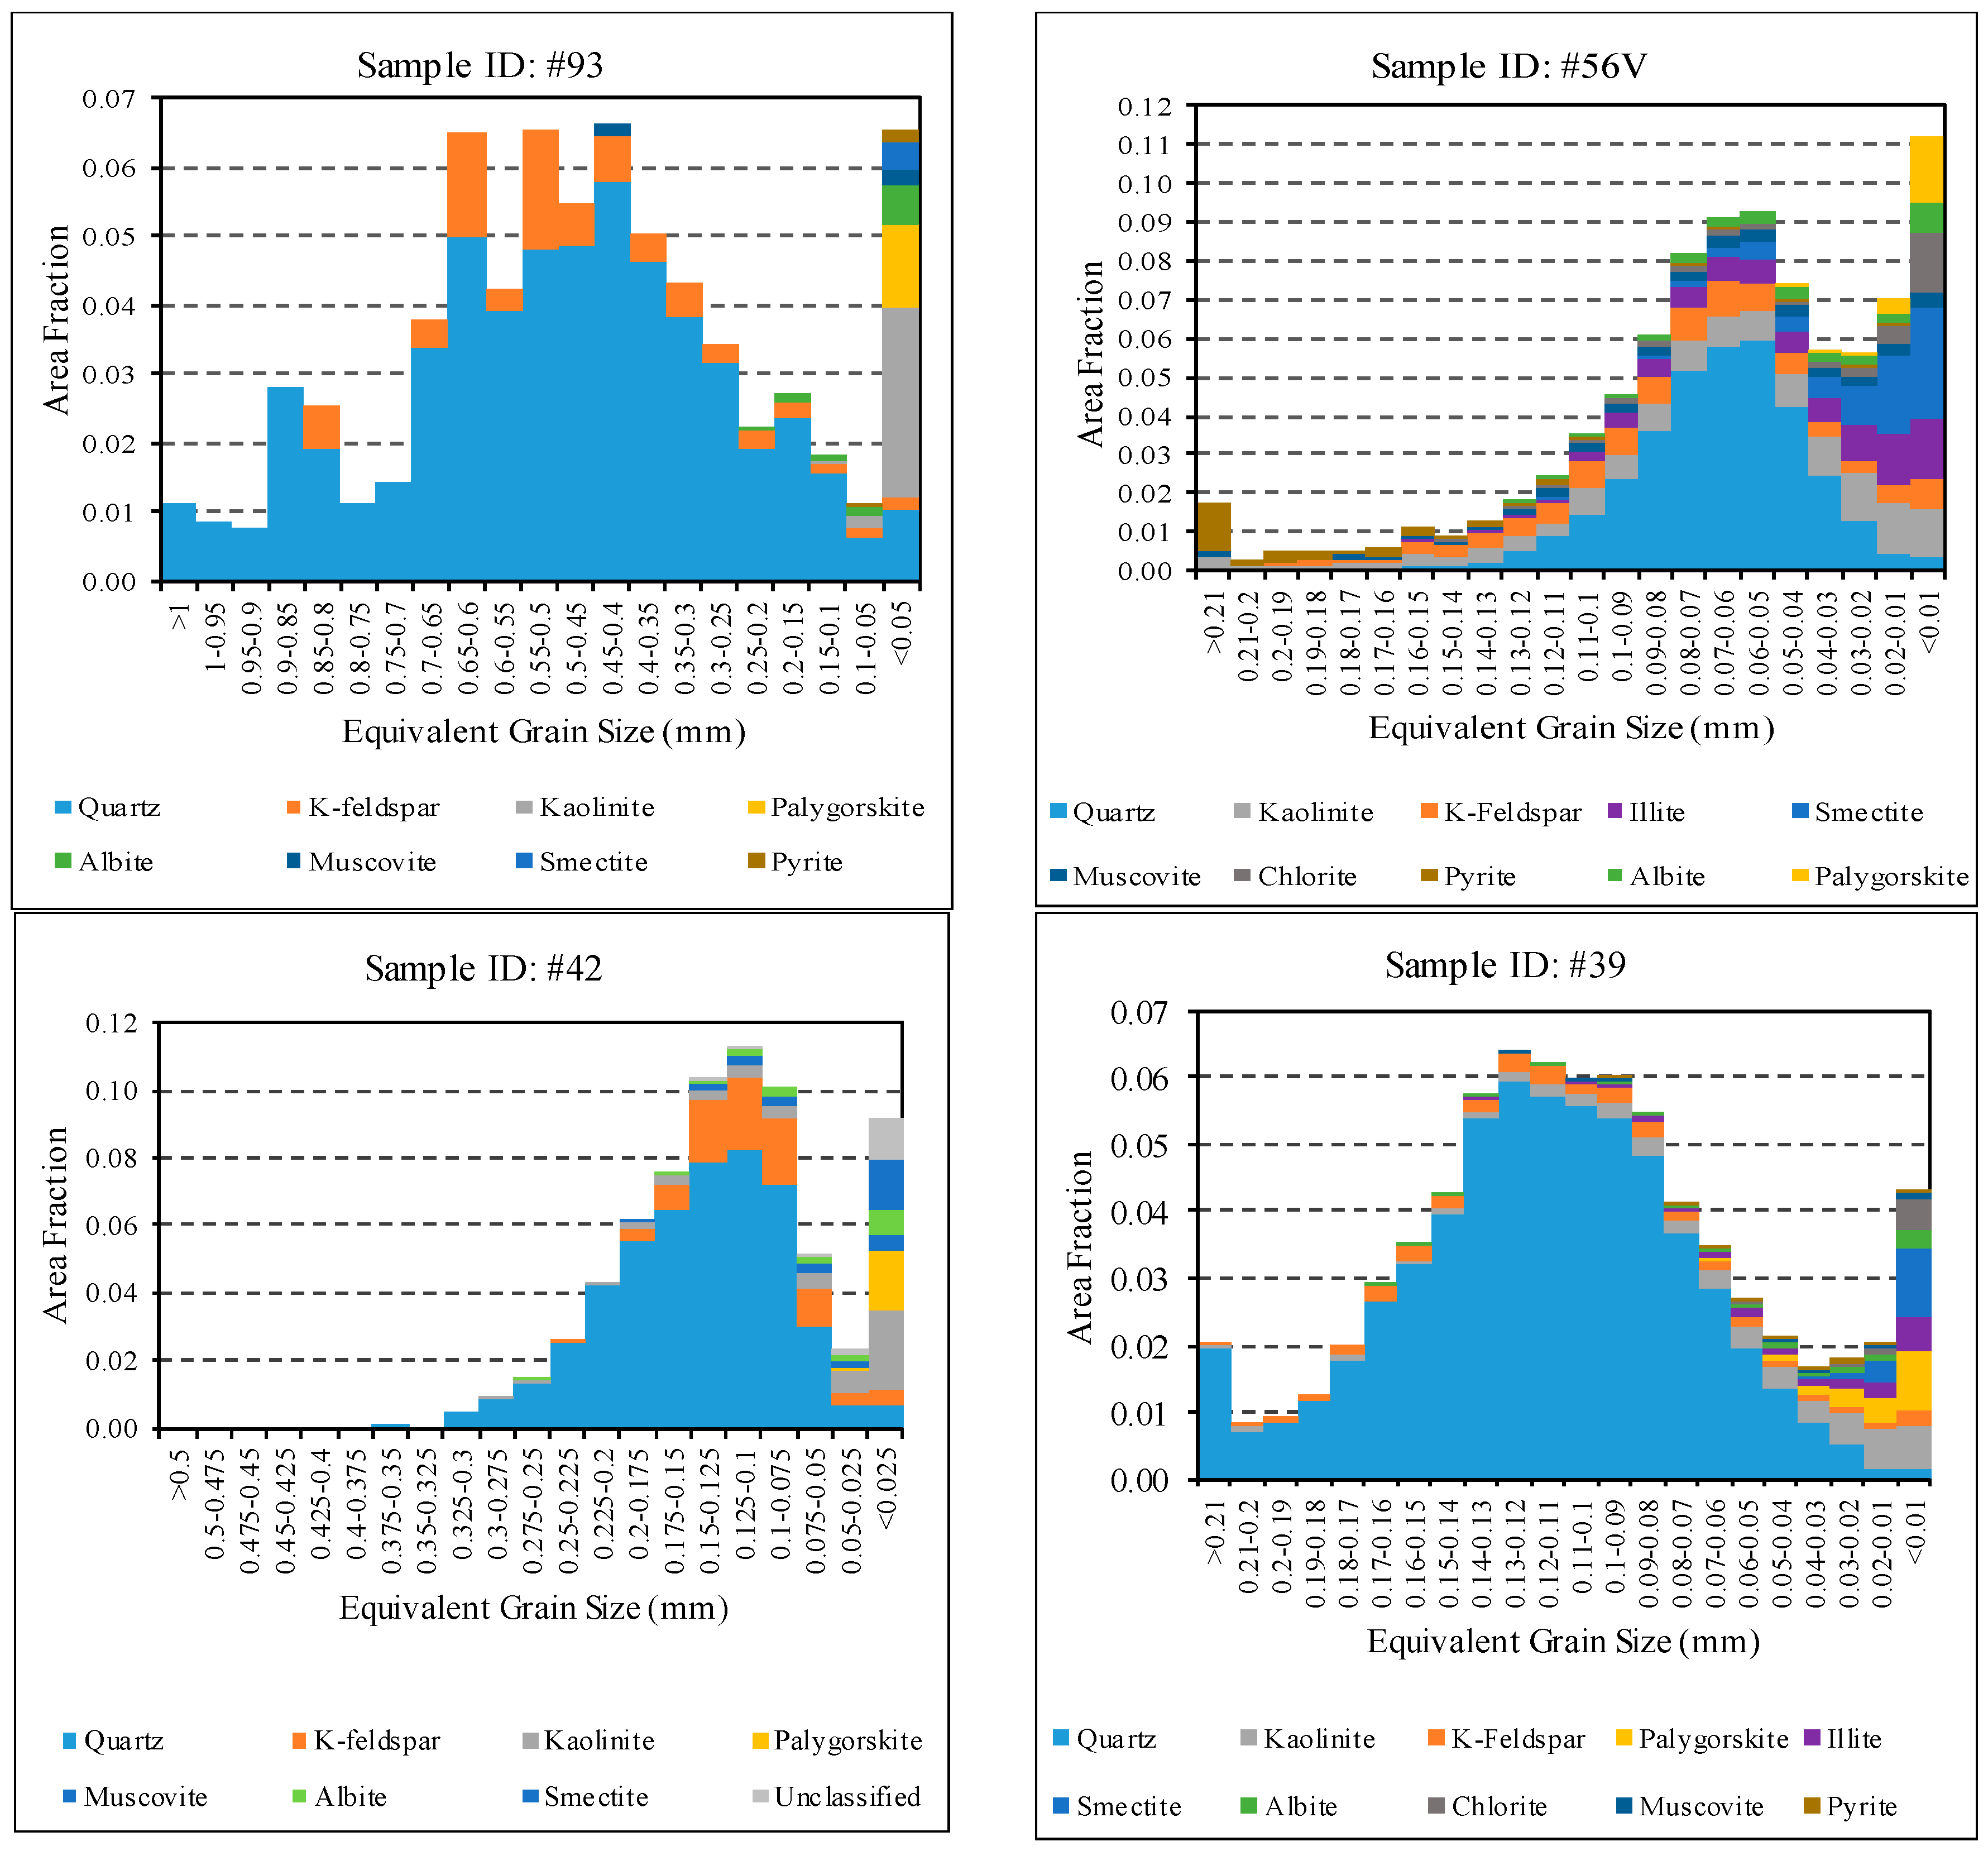
3.1.3. Mineral Specific and Total Grain Size Analysis

The 2D mineral maps derived by QEMSCAN were further used to determine the spectrum of equivalent grain diameter for each mineral. The grain size analysis was conducted using the Avizo software package (Thermo Scientific™). Backscattered electron images and QEMSCAN mineral maps were imported into Avizo with a resolution of 6 micrometers and converted to their RGB components to help distinguish segmented mineral phases. Specific values of RGB were then used to separately segment the area occupied. A threshold of 0.1% was applied as the minimum segmented area of each mineral. The Separate Objects algorithm in Avizo was used to create artificial grain boundaries for separating the grains which were too close. The artificial grain boundaries were validated using the backscattered electron image. The grain boundaries were manually adjusted where a mismatch was observed from the backscattered electron image. The number of pixels segmented to each mineral were used to calculate their respective area fractions using the Volume Fraction algorithm in Avizo. The size of separated grains was determined using the Label Analysis algorithm in Avizo and the EqDiameter (EqD) measure, which determines the equivalent circular diameter of a grain based on the segmented area (SA) it occupies (Equation (2)).
E q D =   4   X   S A π ,
Mineral specific grain size distributions were produced for each sample by binning the area fraction occupied by mineral grains within specific limits of EqD (Equation (2)). The modal grain sizes for different samples are then used to determine facies specific grain size distribution.

3.1.4. Hyperspectral Core Logging

Hyperspectral core logging is a method used to derive a continuous log of semi-quantitative mineral composition in cores. The system used here is referred to as Hylogger™. It is a non-invasive, non-destructive method and measures the reflectances in the Visible-Near InfraRed (VNIR), Short-Wave InfraRed (SWIR), and Thermal InfraRed (TIR) wavelengths [47,49]. The reflectances are then analyzed in The Spectral Geologist™ (TSG) which is a software platform for interpreting the mineral reflectance [50]. It is based on the optimization of fitting individual mineral spectra to a measured spectra from a rock sample. Consequently, it is possible to estimate the most dominant minerals at cm scale resolution. These algorithms are built on a library of approximately 500 end member reflectance spectra for commonly occurring minerals [47].
Previous validation work of TIR data suggests a successful correlation with other sample analysis methods like X-ray diffraction (XRD), X-ray fluorescence (XRF) and microprobe data [51,52]. The main limitation of hyperspectral logging data is that it only provides counts for the identified minerals and that the technique does not pick up minerals occurring in trace amounts [47].
Hyperspectral core logging was performed on the 104-meter section of the core from the CRC-3 well covering Parasequence-1 and -2 and TIR data were used for further analysis. The hyperspectral logging resulted in depth continuous measurement of mineral counts at a resolution of 4 cm. The data has then been binned into depth intervals of 20 cm, thus averaging five mineral count values in this interval. The counts are converted into mineral proportions, which were then grouped into three end member mineral classes characteristic of siliciclastic reservoirs [52]. The mineral classes are: framework minerals (quartz and feldspar), clay minerals (mica, kaolinite, smectite, chlorite) and carbonate minerals (calcite and dolomite). The minerals detected in trace amounts have not been assigned to any end member mineral class. These mineral proportions were accounted for when the rock type classification was developed.

3.2. Wireline Logging and Data Analysis

3.2.1. Available Wireline Log Data Analysis

Neutron porosity, apparent matrix density and gamma ray wireline logs from CRC-2 and CRC-3 [22] were used in this study. The wireline logs express porosity, density and clay abundance and have been used to derive rock type classes at 10 cm resolution (Section 3.2.2). Additionally, this study makes use of the Elemental Capture Spectroscopy (ECS) log for CRC-3 [44]. The ECS is a technique developed by Schlumberger which provides relative abundance of common elements such as silicon, iron, calcium, titanium, sulfur and gadolinium based on the principles of pulsed neutron spectroscopy [53]. The data from the ECS log is used to further cross validate mineral abundance derived from other methods presented in this study.

3.2.2. Deriving Lithotype Logs

Three wireline log data sets (apparent matrix density, neutron porosity and gamma ray) were combined to derive lithotype logs using the Kimeleon software [54,55].
Kimeleon improves on the differentiation and identification of lithologies by integrating more than one log; thus avoiding a bias caused by fluid volume that is associated with single porosity readings. Relative dispositions of the three input logs are reliably indicative of the mineralogy and by extension of the rock type, which is reflected in the color gradient pictured by lithotype log [55].
The apparent matrix density log is implemented as the red channel, neutron porosity log is implemented as the green channel and gamma ray log is implemented as the blue channel. The three logs are then combined to produce a composite representative color known as the colourlith. The combination of magnitudes from of apparent matrix density, neutron porosity and gamma ray from wireline data for each depth is unique. The information of individual log curves is transferred and preserved in the colourlith where variation in hue reflects the magnitude of the combined logs.
The lithotype analysis was undertaken for Parasequences-1 and -2 between the depths of 1461 and 1565 m in CRC-3 and between 1422 and 1518 m in CRC-2. Wireline log LAS files were corrected for variations in distances between individual measurements and for duplicate measurements before importing them into Kimeleon. The three false color representations were combined in an in-built model within Kimeleon known as the Rhomaa-NPHI model. The model estimates absolute density by combining apparent density and neutron porosity and integrates this information with gamma ray values to result in the colourlith log. The advantage of using the Rhomaa-NPHI model is that it is known to perform well in discriminating between shale, carbonate-rich rock (dolomite and limestone) and sandstones [55]. Kimeleon allows limit manipulation for each of the properties, which can enhance or diminish the detail as more extreme magnitudes are being included or excluded. This is reflected in the recognition of more subtle differences between rock properties and thus increased or decreased color variety. Some limit adjustments were required to enhance the difference between siltstone and mudstone and thus the color coding is different from Kimeleon’s default.
To confirm the results, the colourlith log derived for CRC-3 was compared to the mineral composition derived by ECS. Even though these outputs are not strictly independent as they are both based on the same dataset, the colourlith and the ECS logs are based on different techniques.
The colourlith log was analyzed for the differences in hues which are then interpreted as specific rock types. CRC-3 served as the primary rock record as it provided the most abundant data (hyperspectral core log, wireline log, sample analysis). Hence, based on the similarity in the colourlith logs of the two wells, the CRC-2 colourlith is assigned rock types equivalent to those in CRC-3. The vertical resolution of the rock record is 10 cm due to the in-built limitations of Kimeleon. The output results in the vertical extent of each rock type class in the two wells in the form of rock type logs. The patterns in the two rock type logs were then used to deduce the lateral extent of rock types between the wells.

4. Results

4.1. Sample Analysis Results

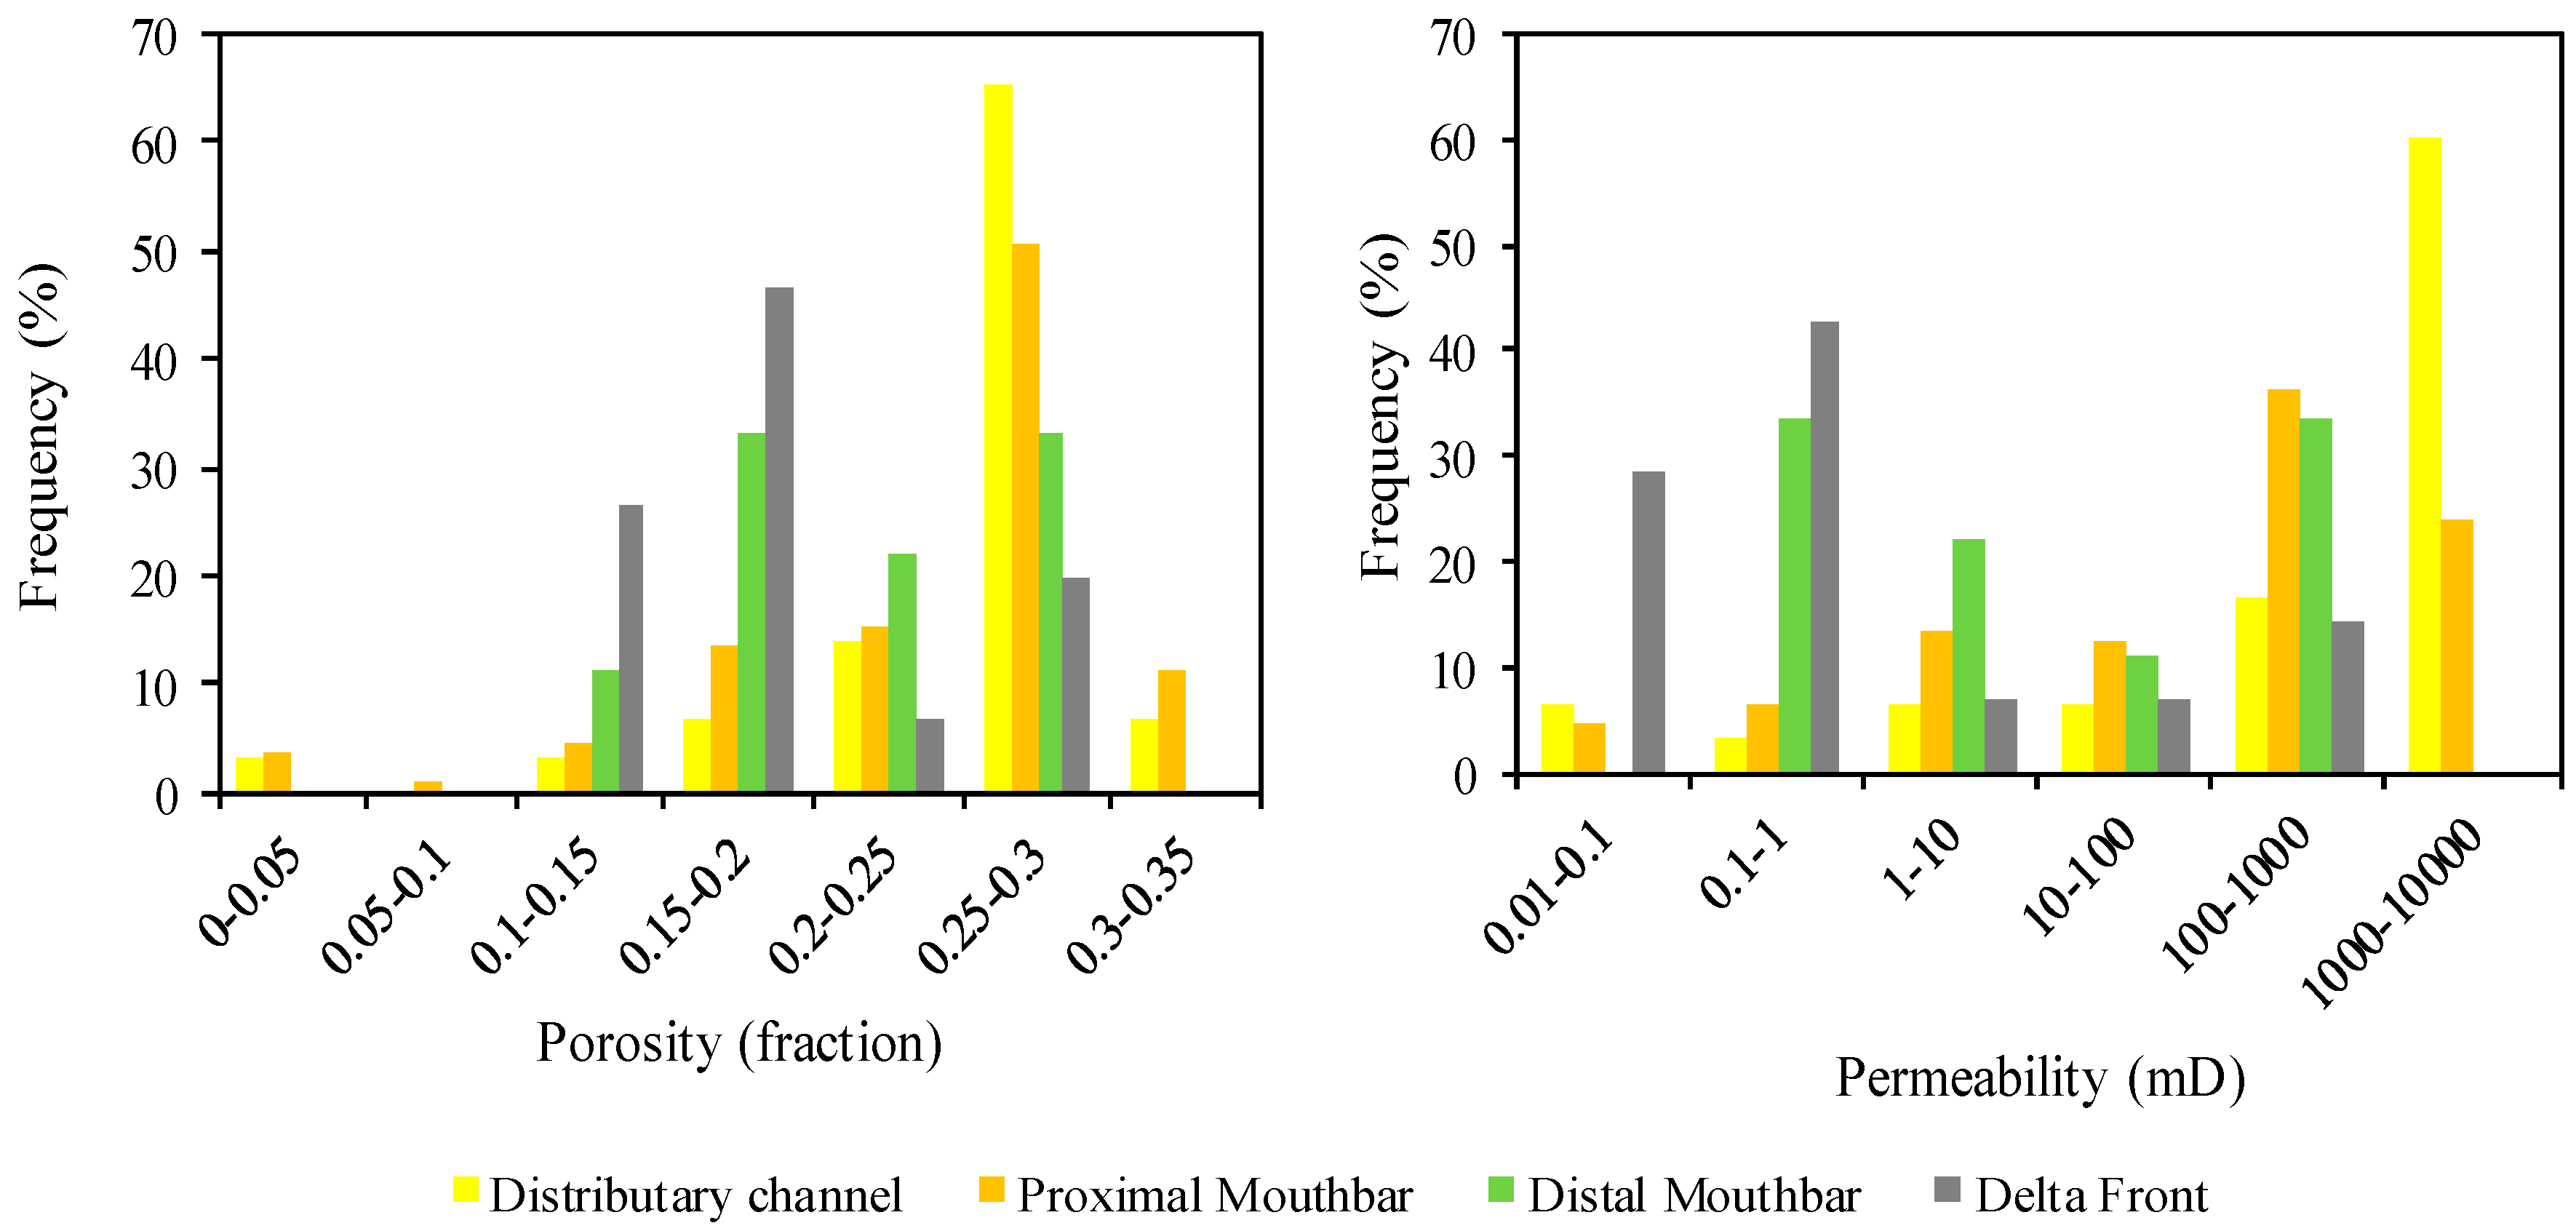
4.1.1. Porosity, Permeability and Entry Pressure Analysis

The frequency distribution plots (Figure 4) show a bimodal distribution of porosity and permeability for distal mouthbar and delta front facies and a normal distribution for the distributary channel facies. A minor bimodal distribution is found for the proximal mouthbar facies. The highest porosity and permeability values are observed for distributary channel while the lowest values are observed for delta front facies. Two classes of dominant porosity and permeability can be defined corresponding to the bimodal distribution: a first class with porosity greater than 0.25 and permeability greater than 100 mD and a second class with porosity and permeability smaller than these values.
The previously reported equivalent CO2 column height data from CRC-2 for samples belonging to the depths 1434.70 m, 1435.31 m, 1439. 72 m, 1440.21 m, 1448.58 m, 1485.39 m, 1491.43 m, 1504.45 m, 1507.65 m and 1509.88 m [20,21] is used to calculate capillary entry pressures for the respective samples (Equation (1)). The calculated entry pressure varied between 300 Pa and 160,000 Pa (Table 1) and is expected to represent the entry pressure for the range of rock types. A conversion factor of 6894.76 was used convert the units from psi to Pa.

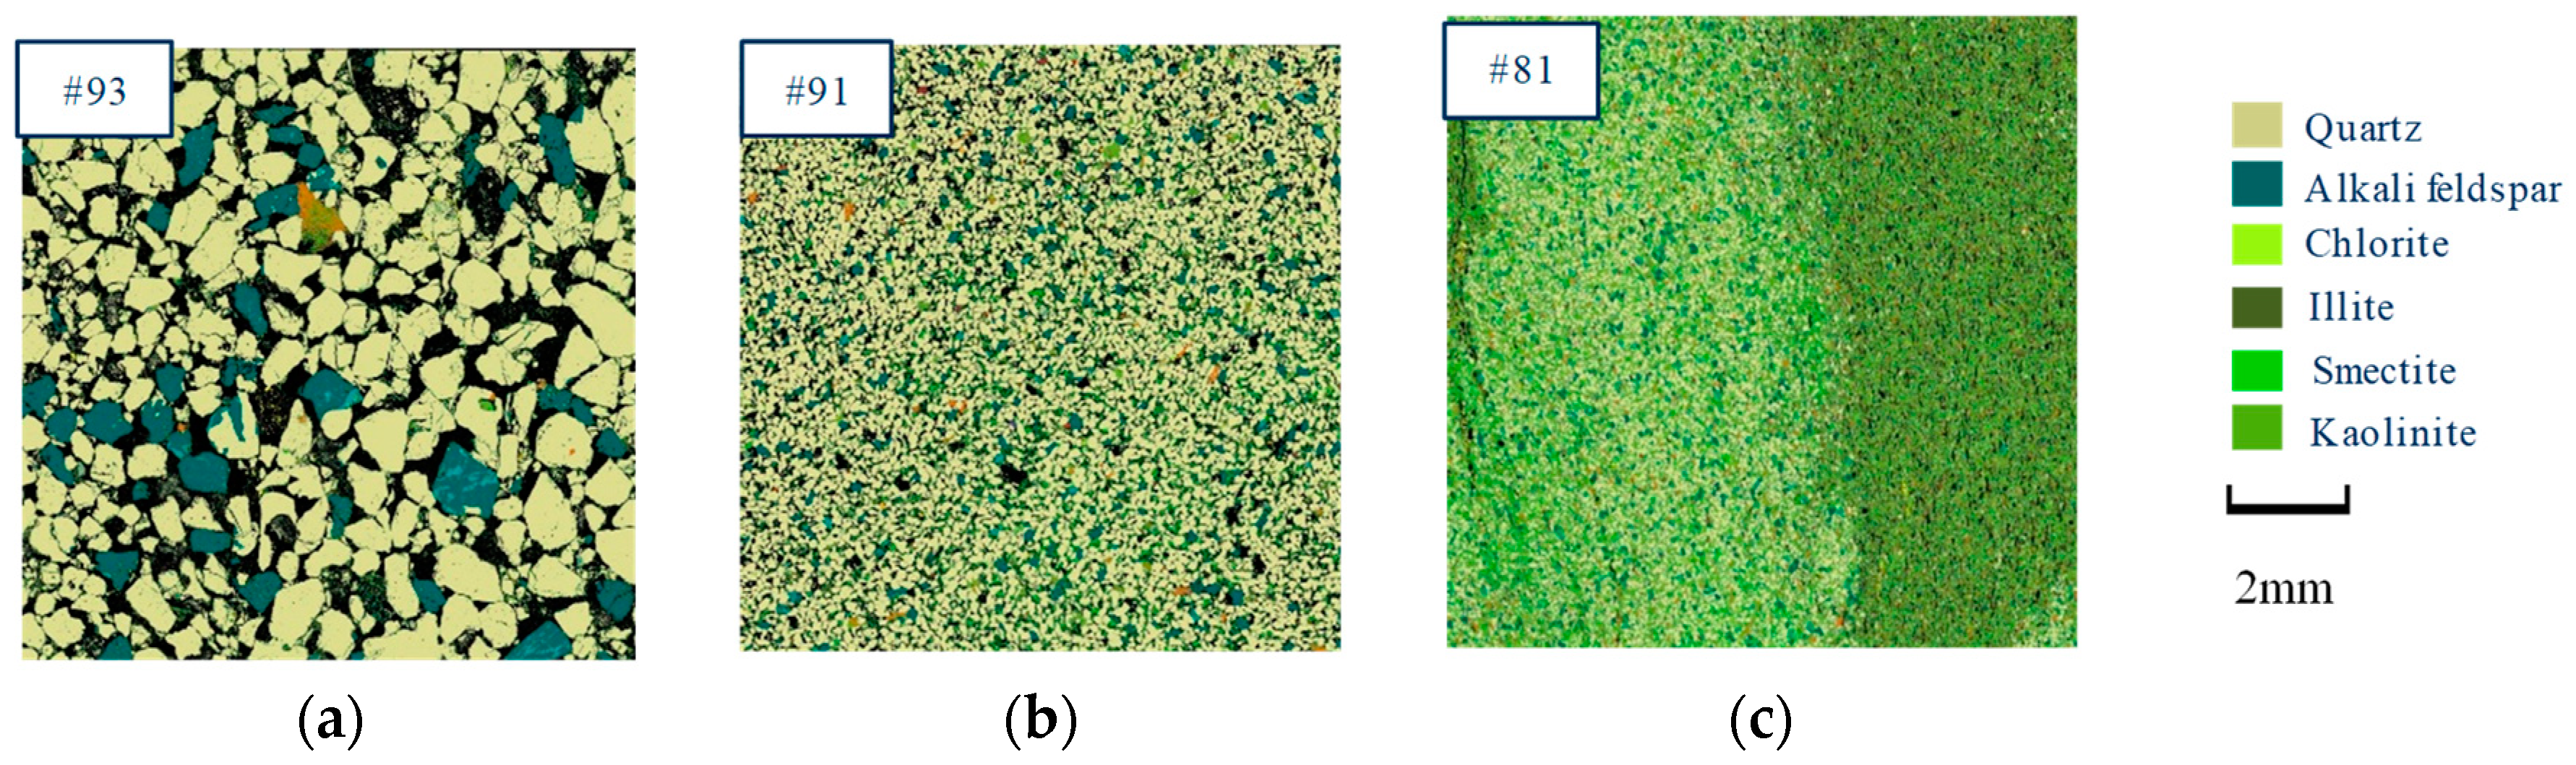
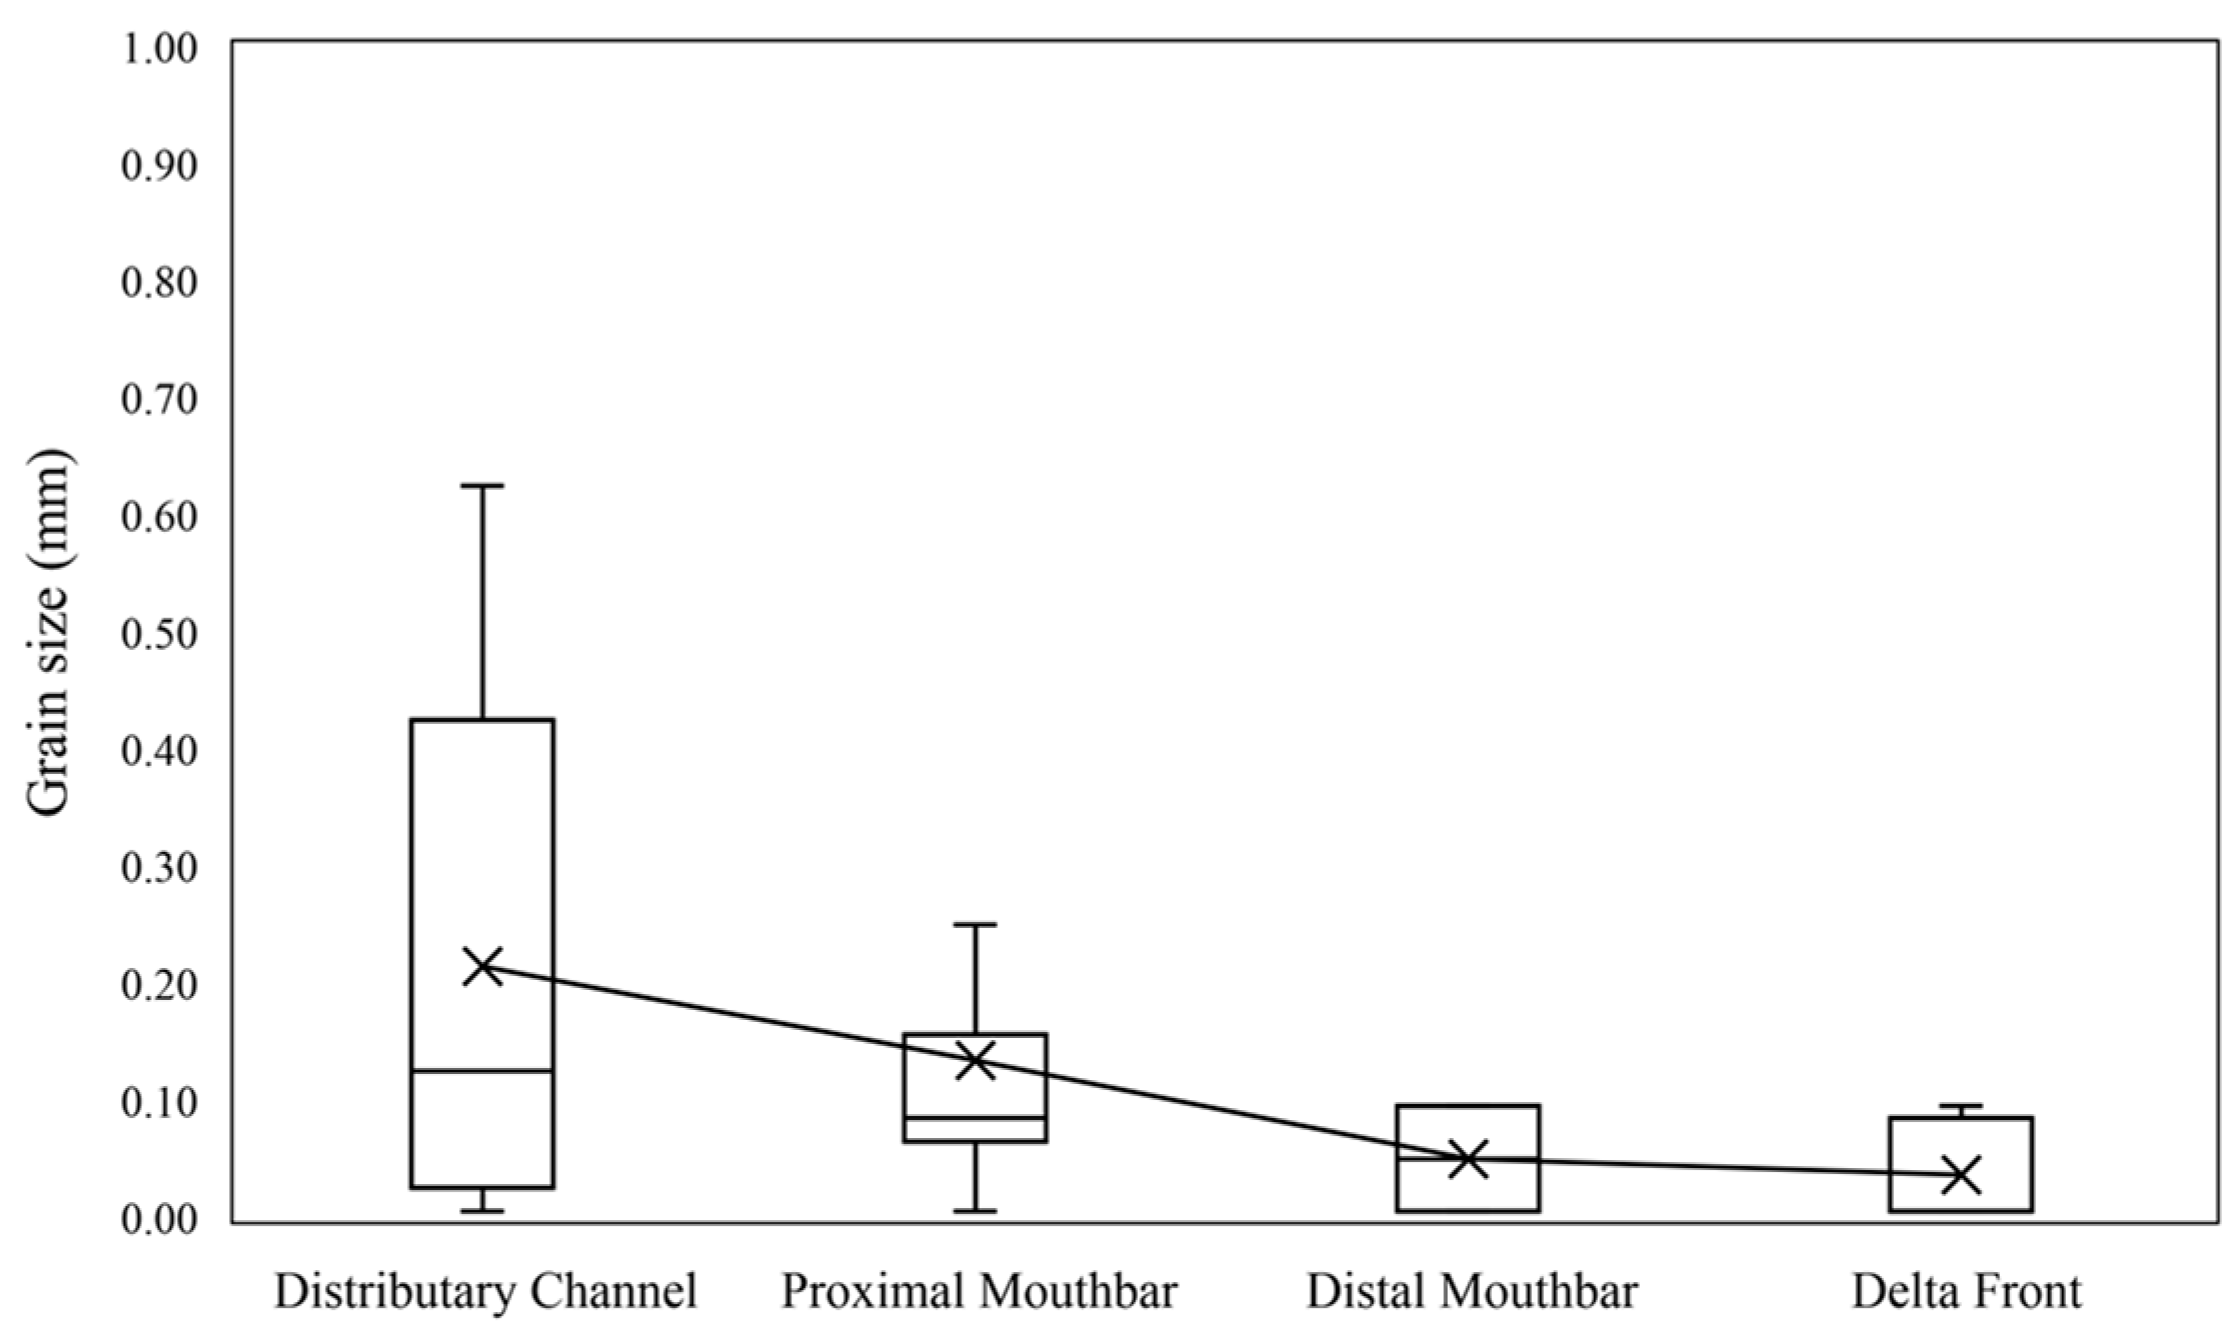
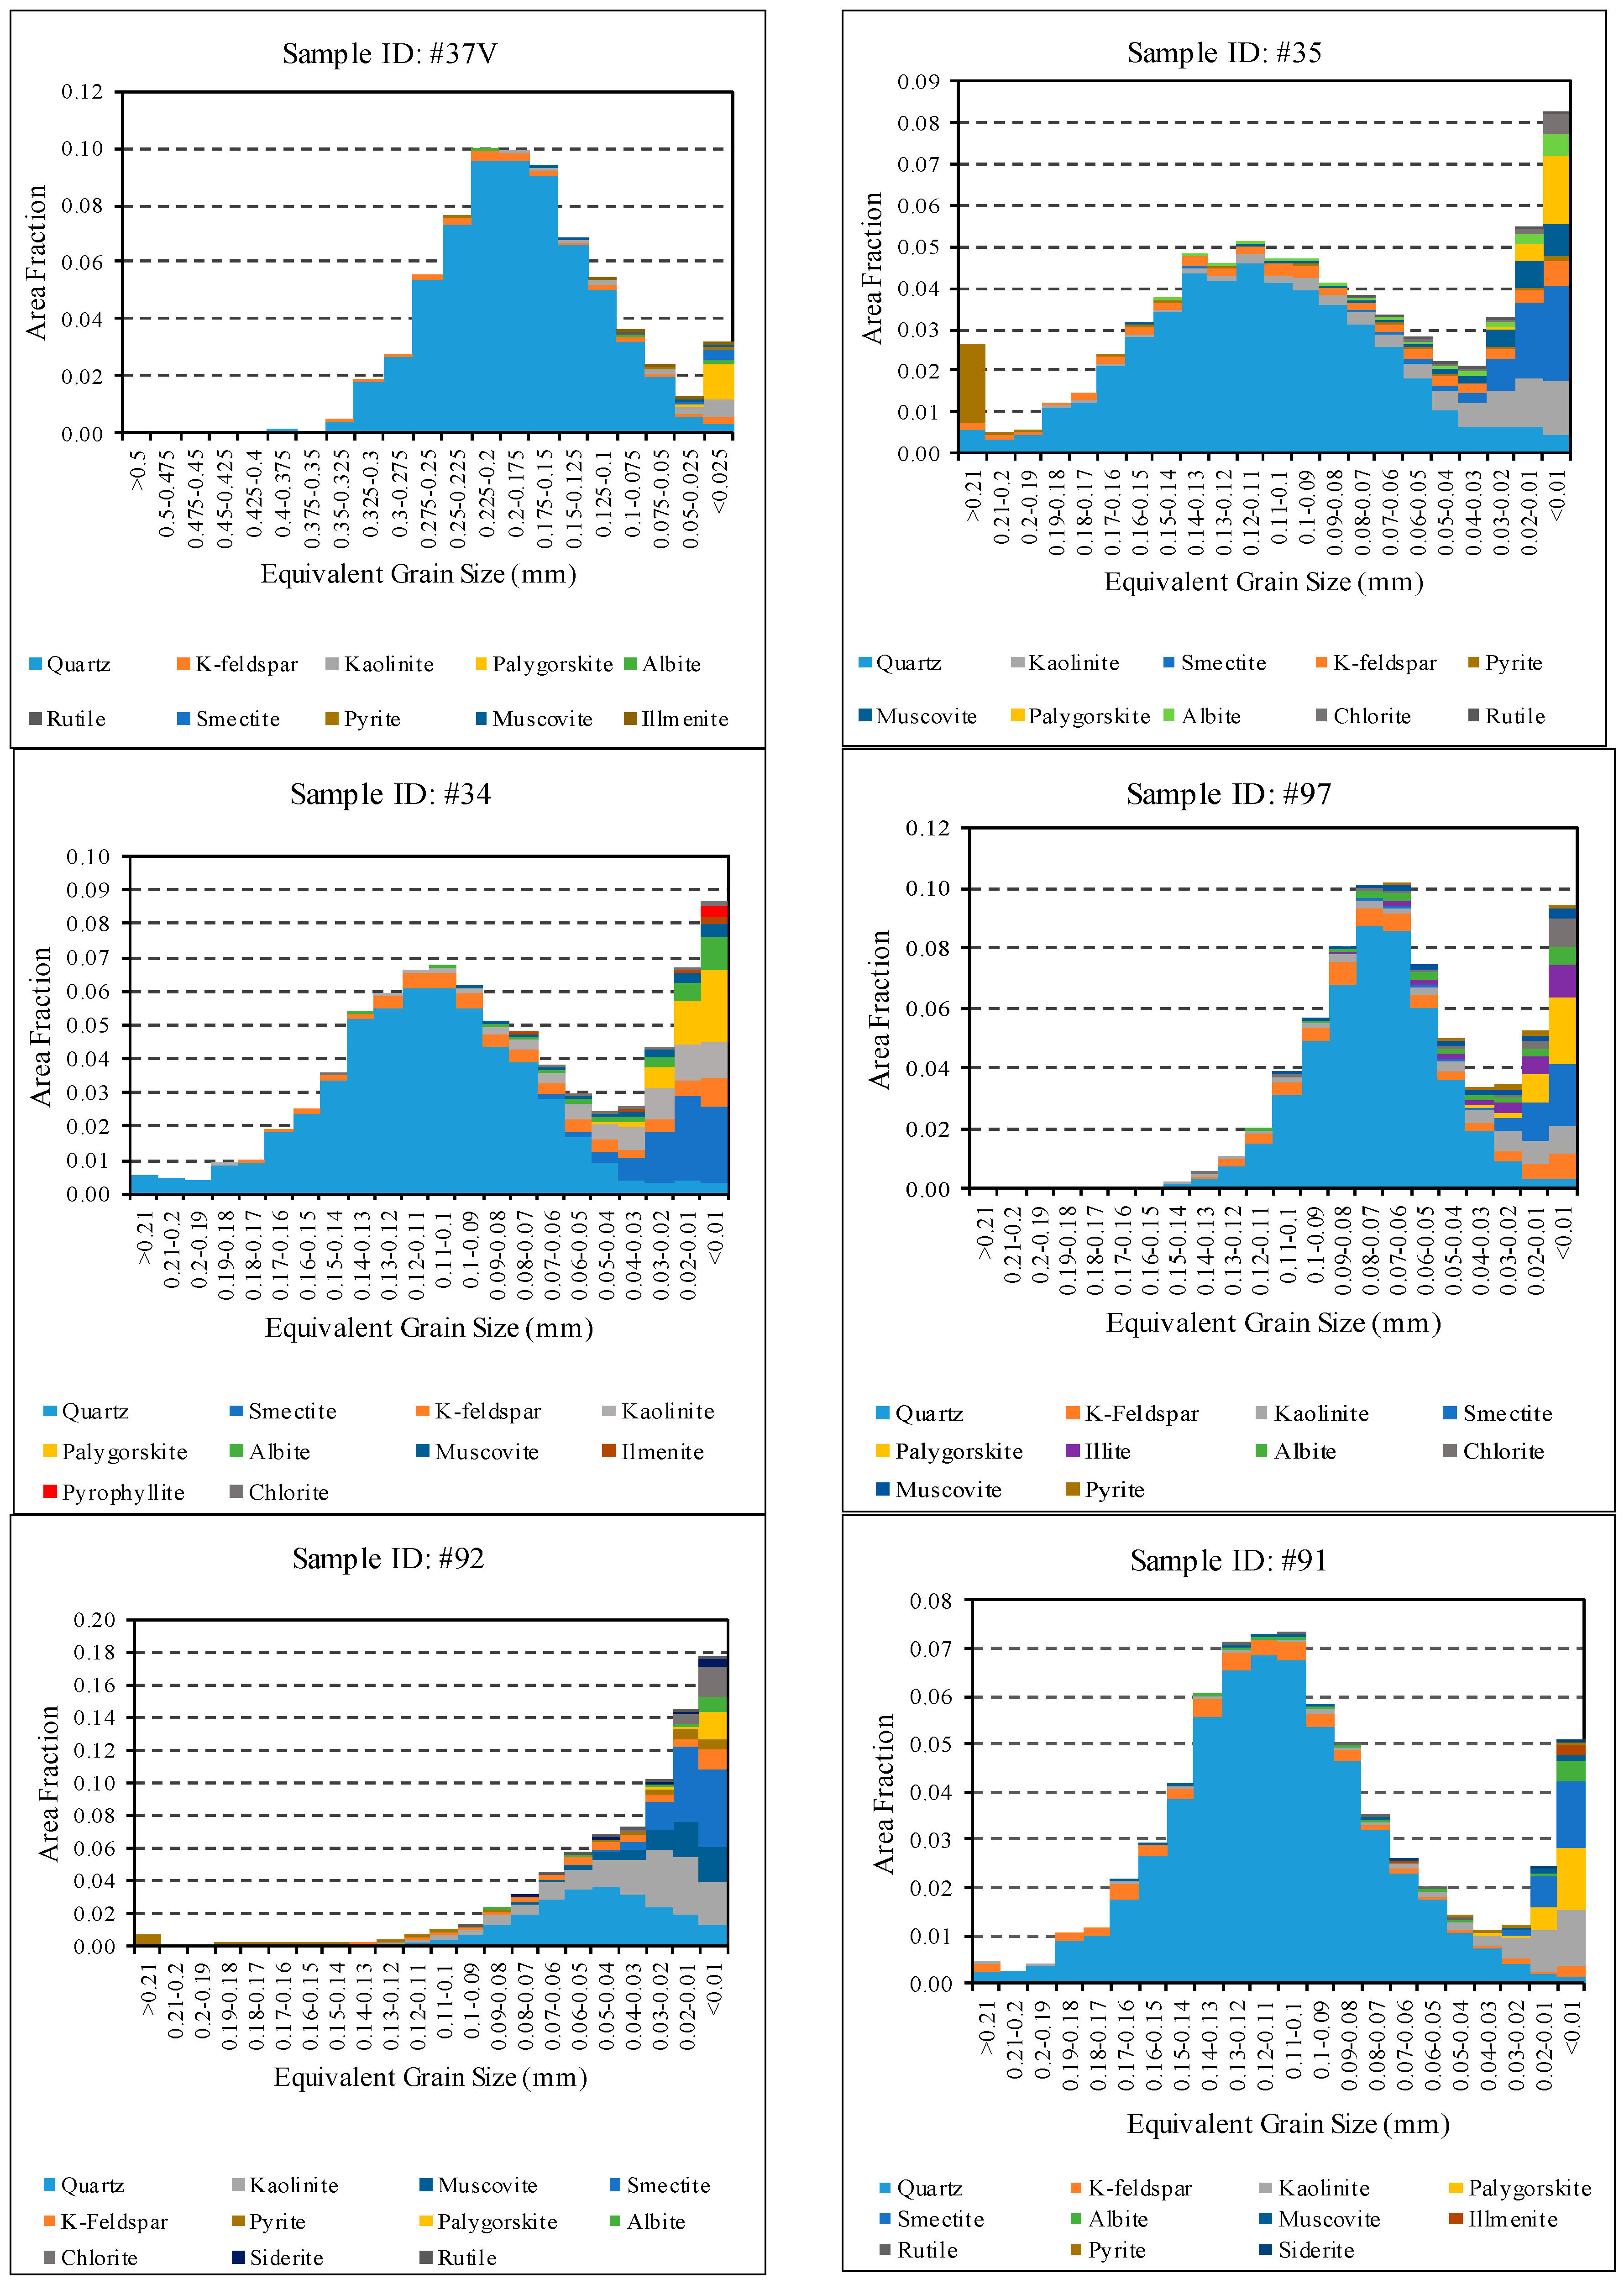
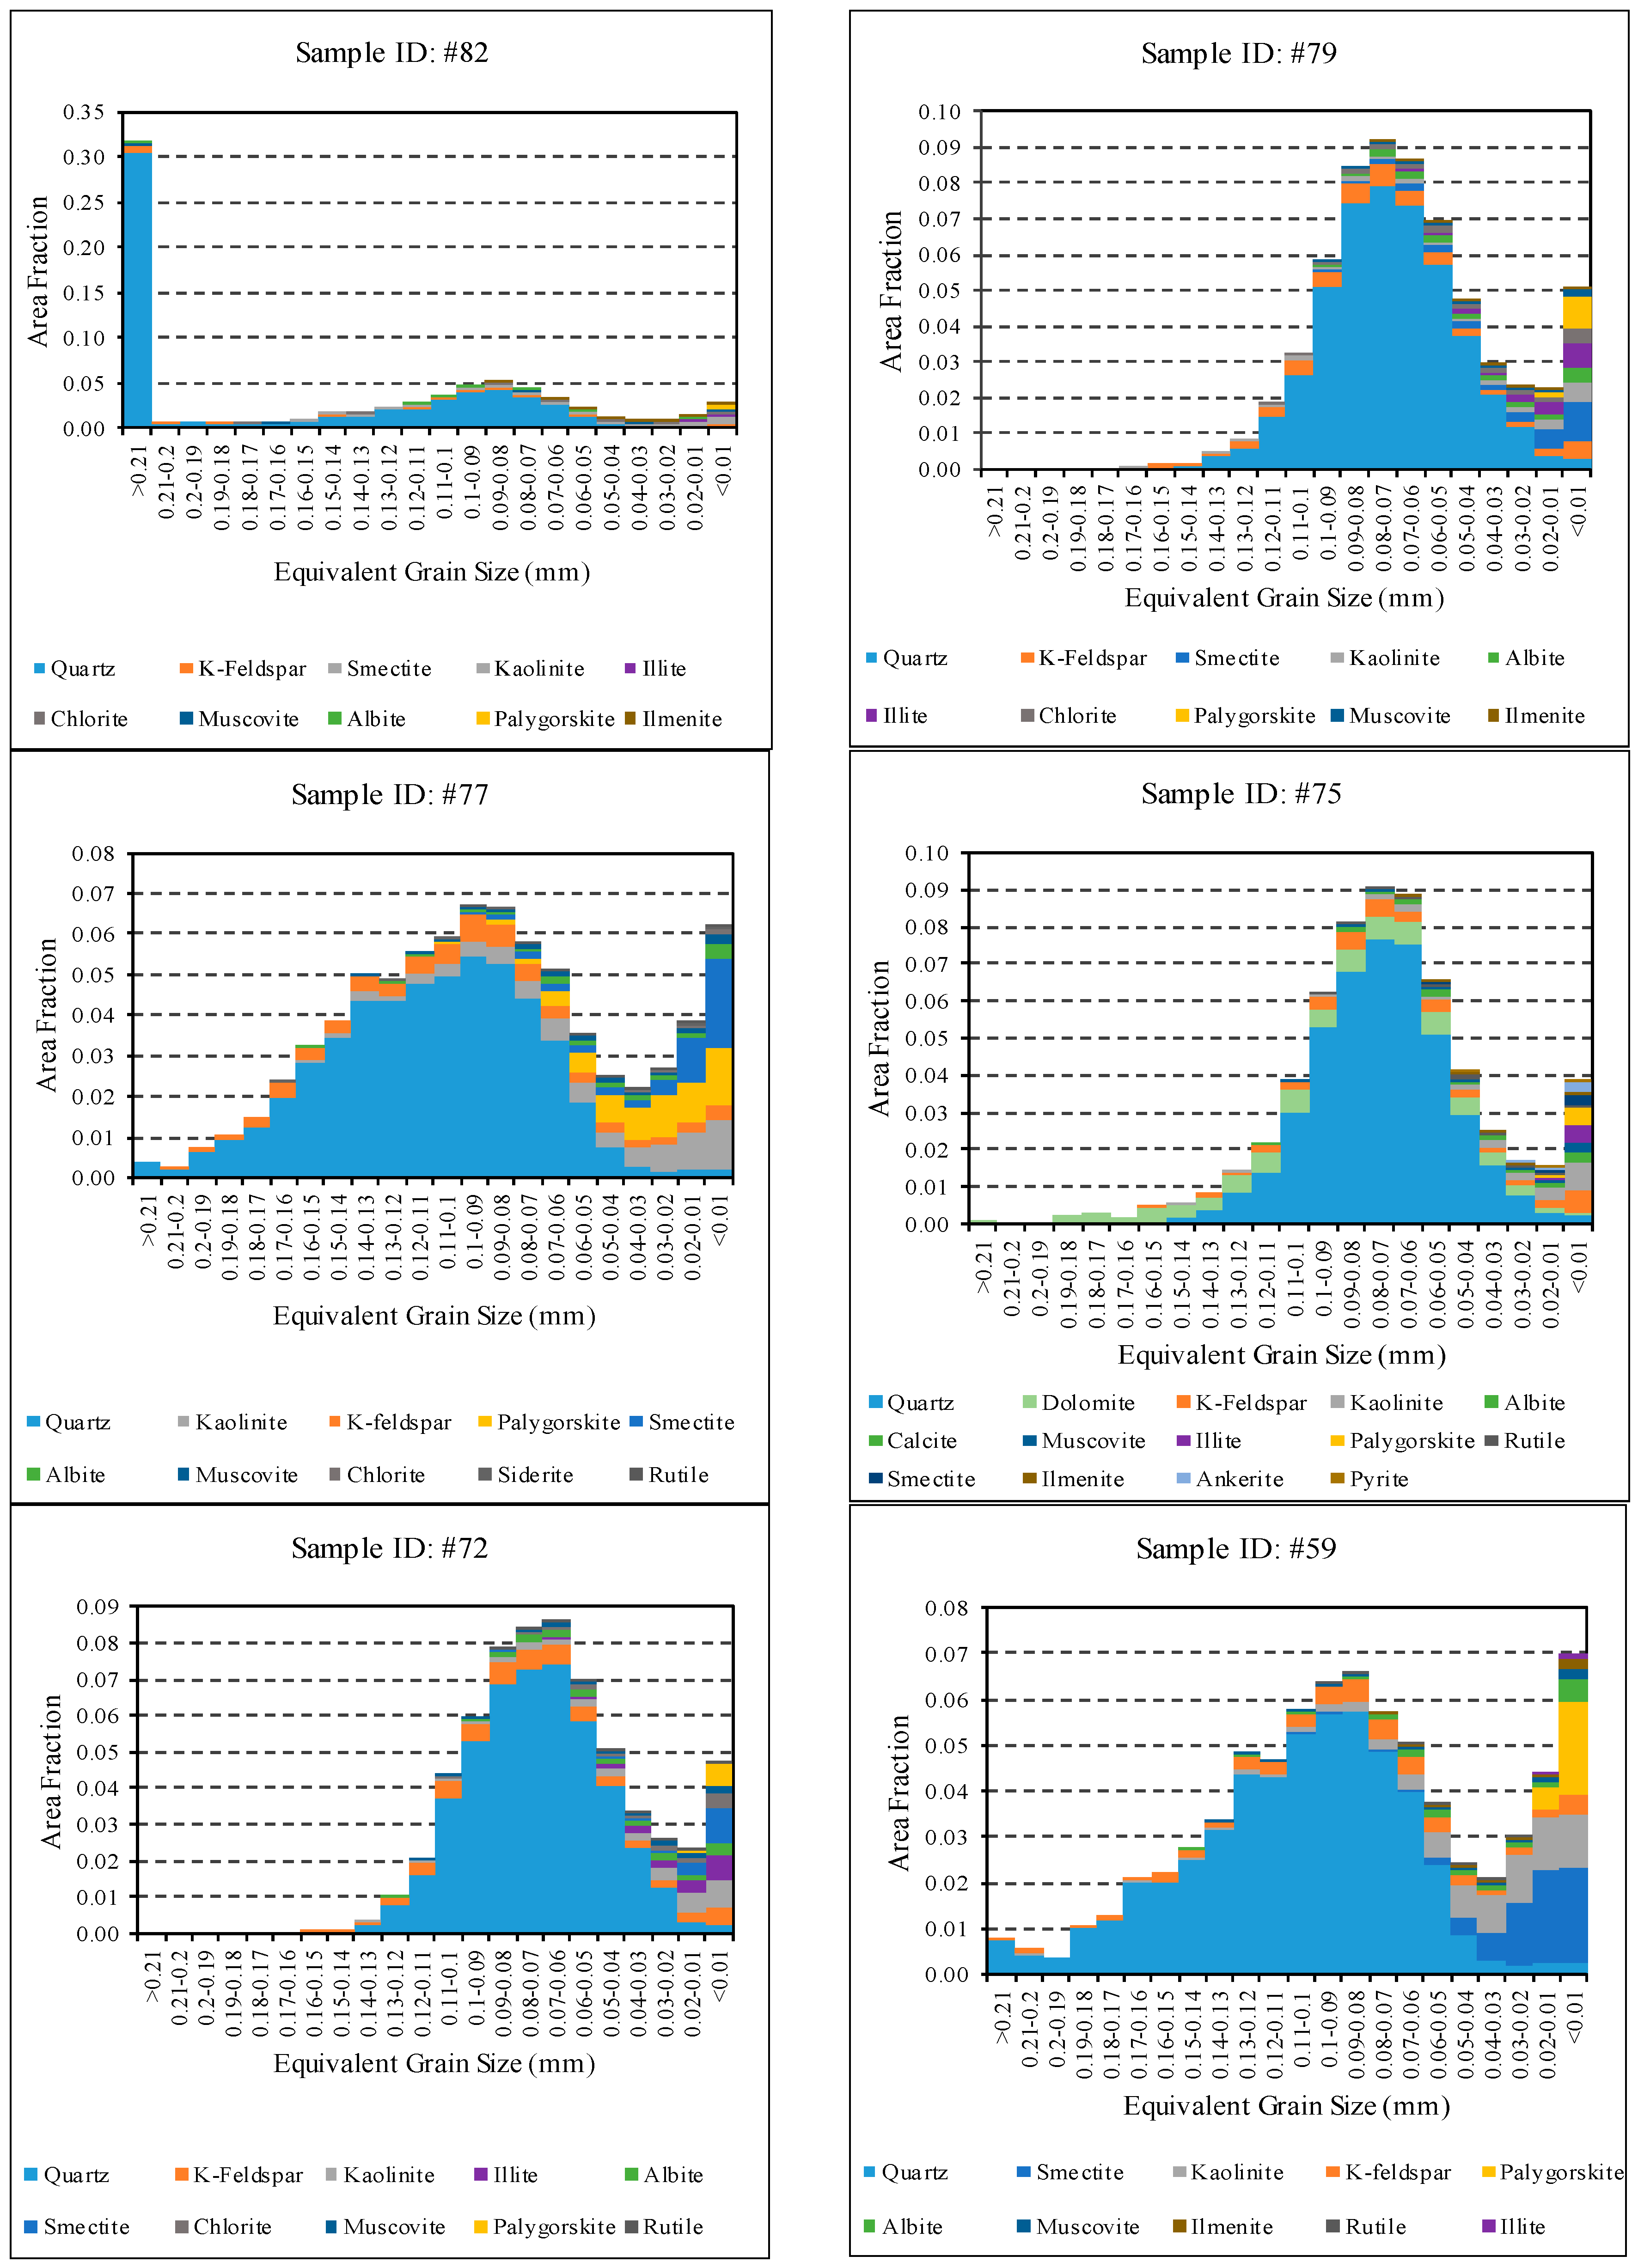
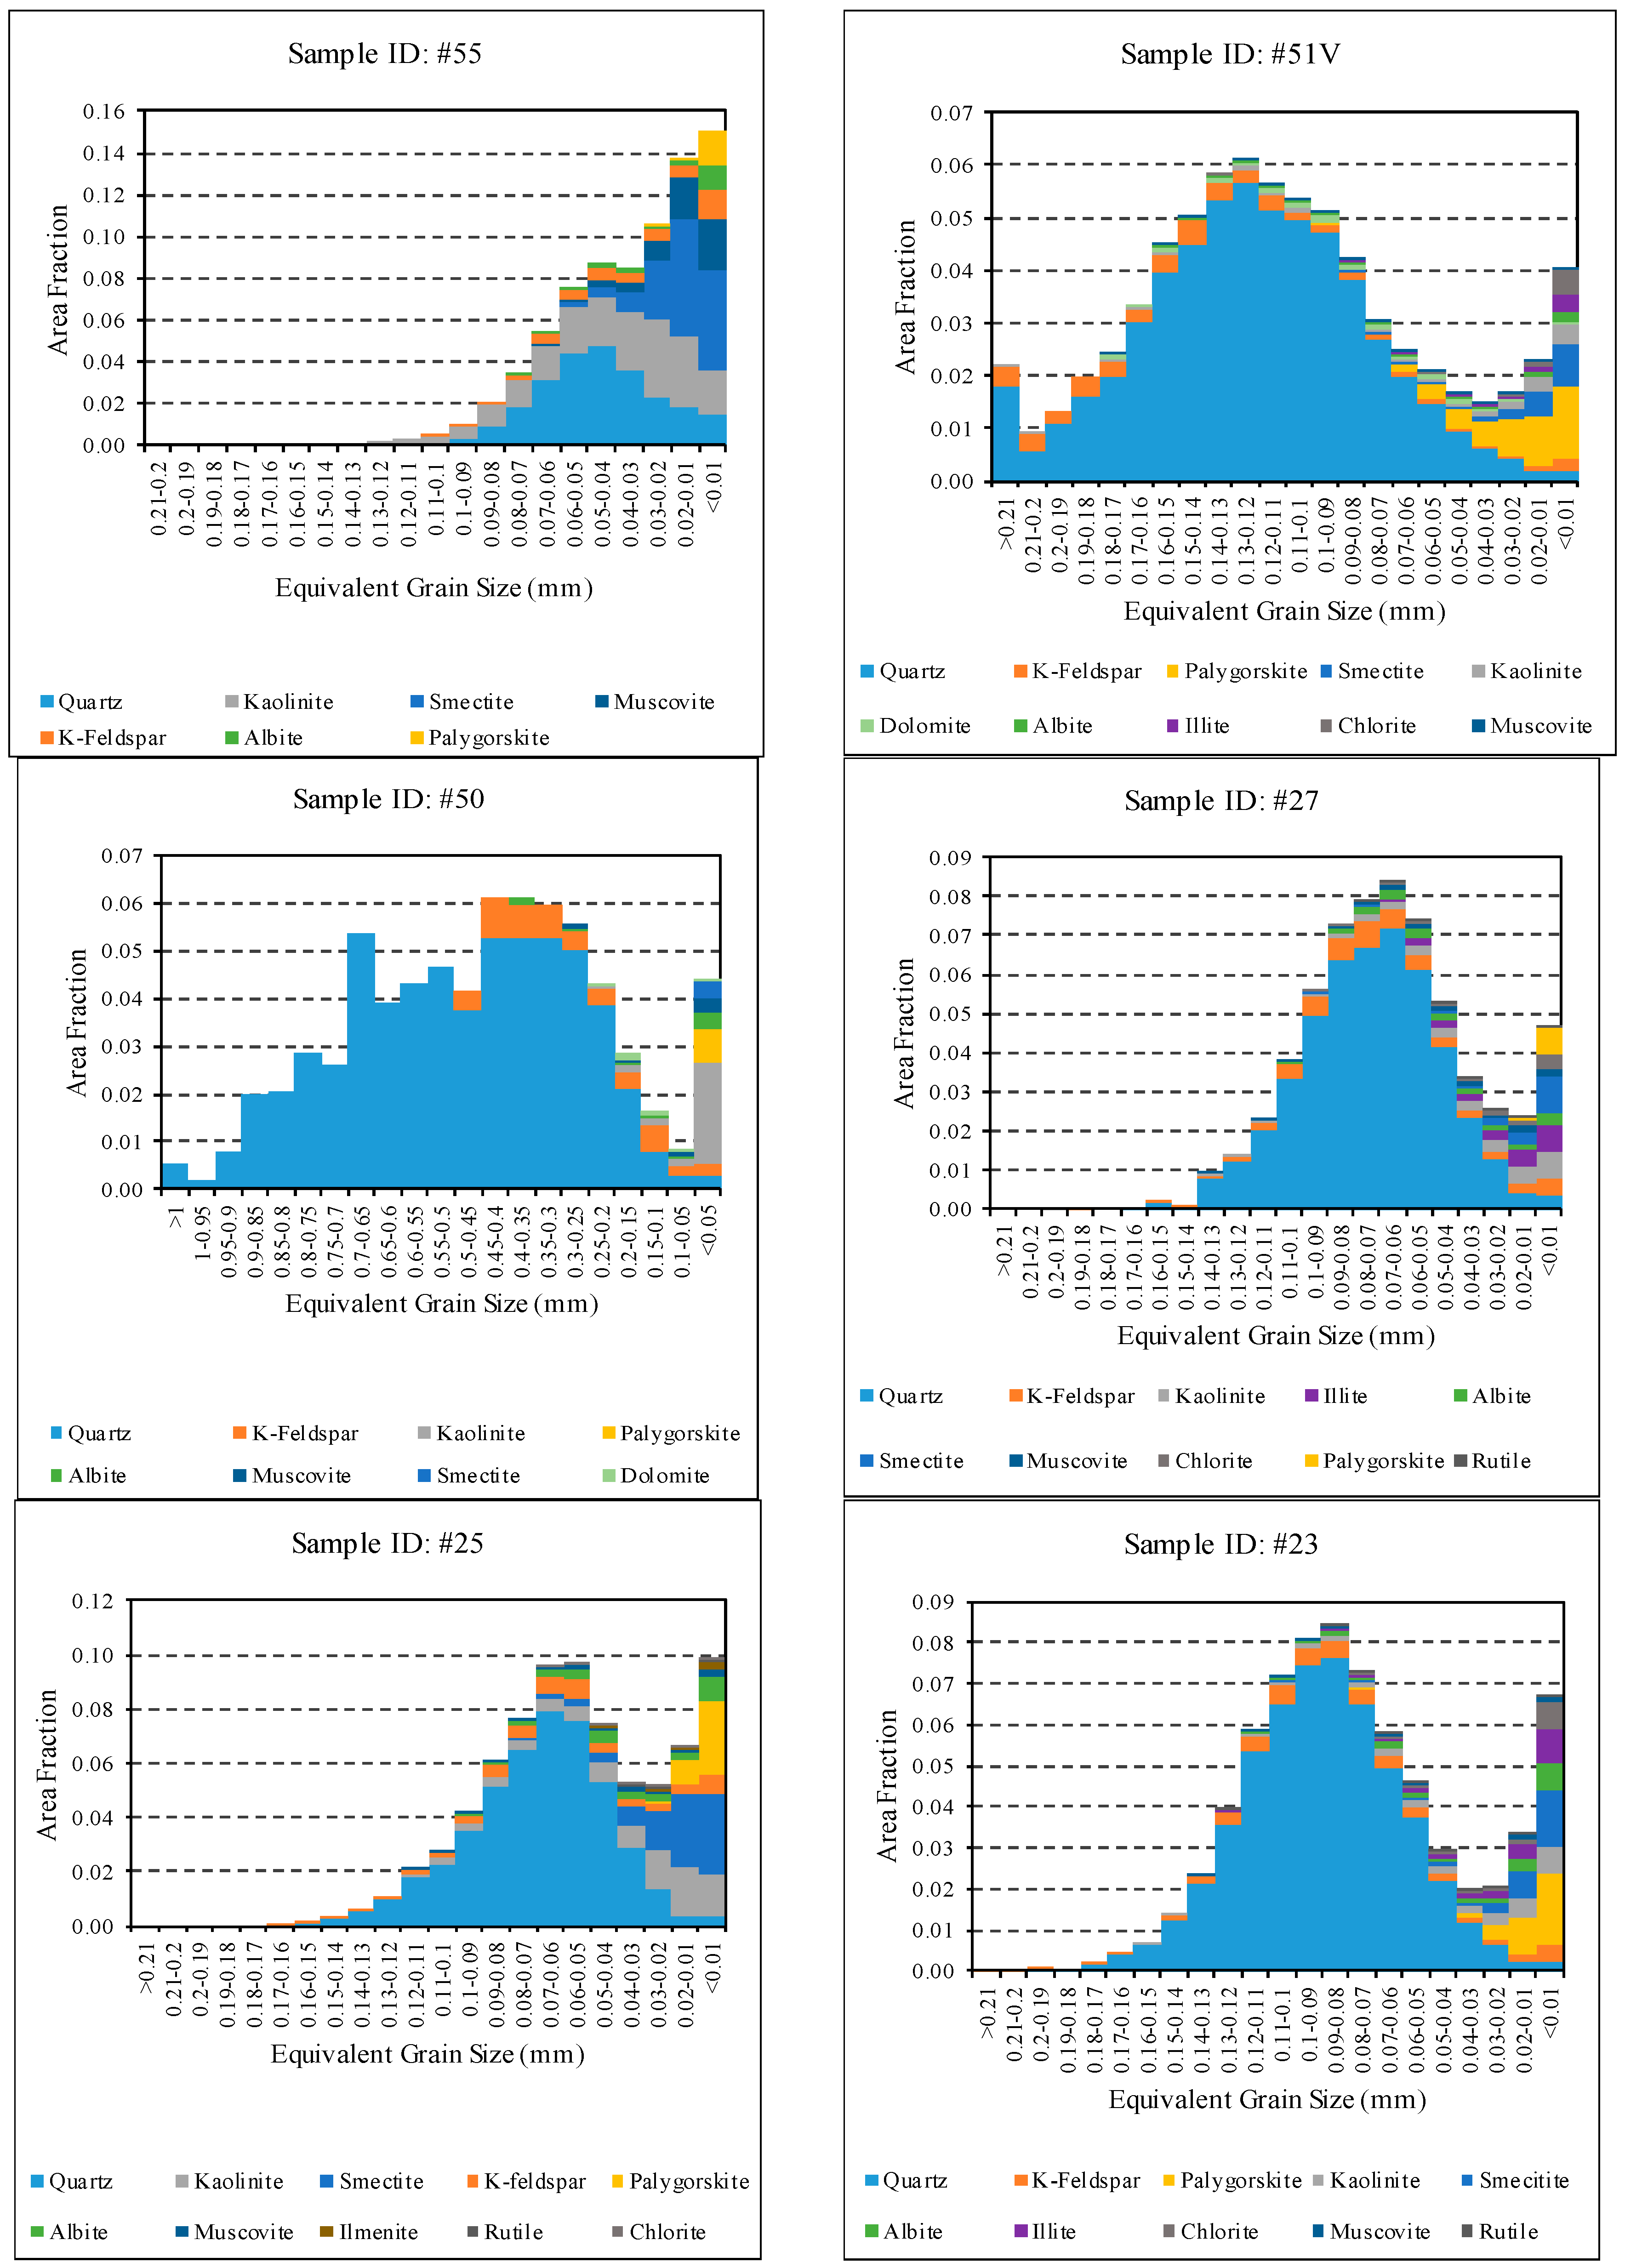
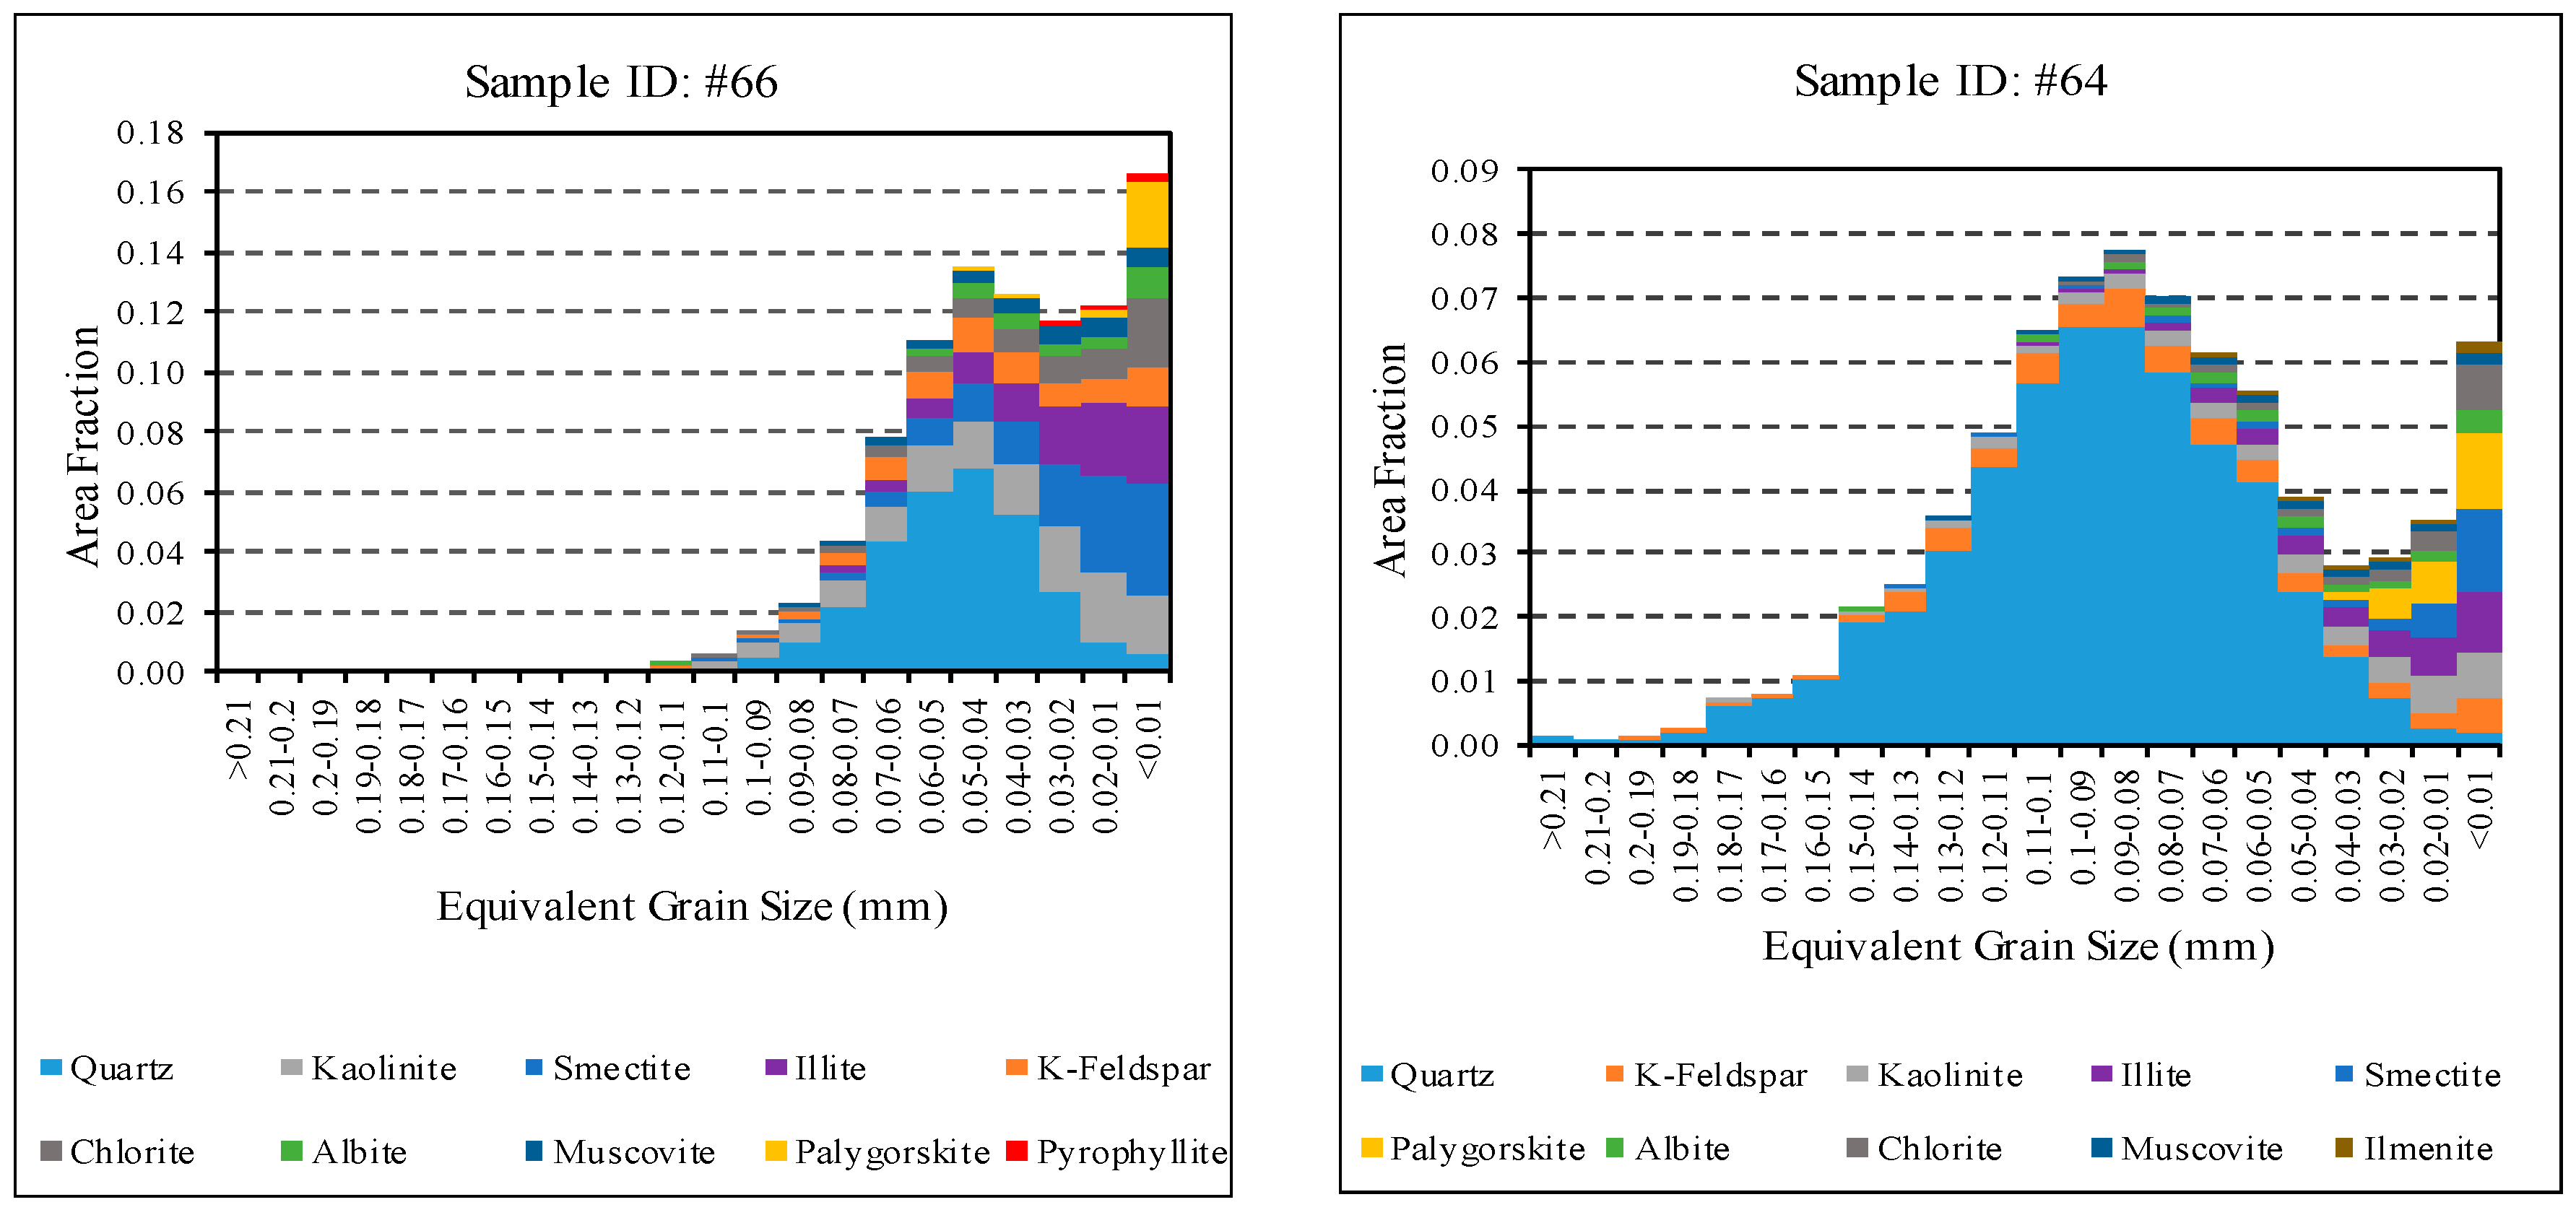
4.1.2. Quantitative Mineral and Mineral Specific Grain Size Analysis

Results obtained from the QEMSCAN analysis include identification of mineral phases making up the respective samples, the areal proportion each mineral occupies on the polished 2D thin section surface and the mineral map of the polished surface. Figure 5 shows mineral maps and major mineral phases for the representative samples from distributary channel (sample #93), proximal mouthbar (sample #91) and distal mouthbar (sample #81) facies. The mineral maps provide visual mineralogical and textural information. Clay content increases from sample #93 to Sample #81 while the grain sizes decrease in the same order. The black area on the mineral maps represents porosity.
The minerals detected include framework minerals such as quartz, alkali feldspar and plagioclase; clay minerals such as chlorite, illite, kaolinite, muscovite, pyrophyllite, palygorskite and smectite; and carbonate minerals such as calcite, ankerite, dolomite, siderite and magnesite along with trace minerals such as rutile, pyrite, ilmenite and zircon. Figure 6 shows the proportion of major minerals in each facies. The QEMSCAN results for samples chosen from distributary channel and proximal mouthbar facies are dominated by framework minerals like quartz and feldspar while the samples chosen from distal mouthbar and delta front facies show a higher proportion of clay minerals like kaolinite, illite, chlorite and smectite. The proportion of quartz ranges between 60–90% in distributary channel samples and decreases to 30–70% in distal mouthbar and delta front samples. The proportion of clay minerals such as chlorite, illite, smectite and kaolinite is higher in distal mouthbar and delta front facies where it varies between 10–20% as compared to distributary channel and proximal mouthbar facies where their maximum amount is less than 10%. From the results, the bulk clay mineral proportion for distributary channel and proximal mouthbar varies between ~10% to ~30% and for distal mouthbar and delta front varies between 25%–60%. A detailed description of the mineral maps of all the 30 samples along with quantitative mineralogy is given in Appendix C.
The equivalent grain diameter of minerals varies between 0.01mm to ~0.6 mm. Figure 7 shows the modal grain size distribution characteristic of each facies. The modal grain size is as high as 0.6 mm for distributary channel facies. The modal grain size decreases subsequently in proximal mouthbar, distal mouthbar and delta front facies. The latter two facies are characterized by modal grain size smaller than 0.1 mm. The data was further used to plot area fraction covered against equivalent grain diameter for each mineral. The results for all the samples are presented in Appendix D.

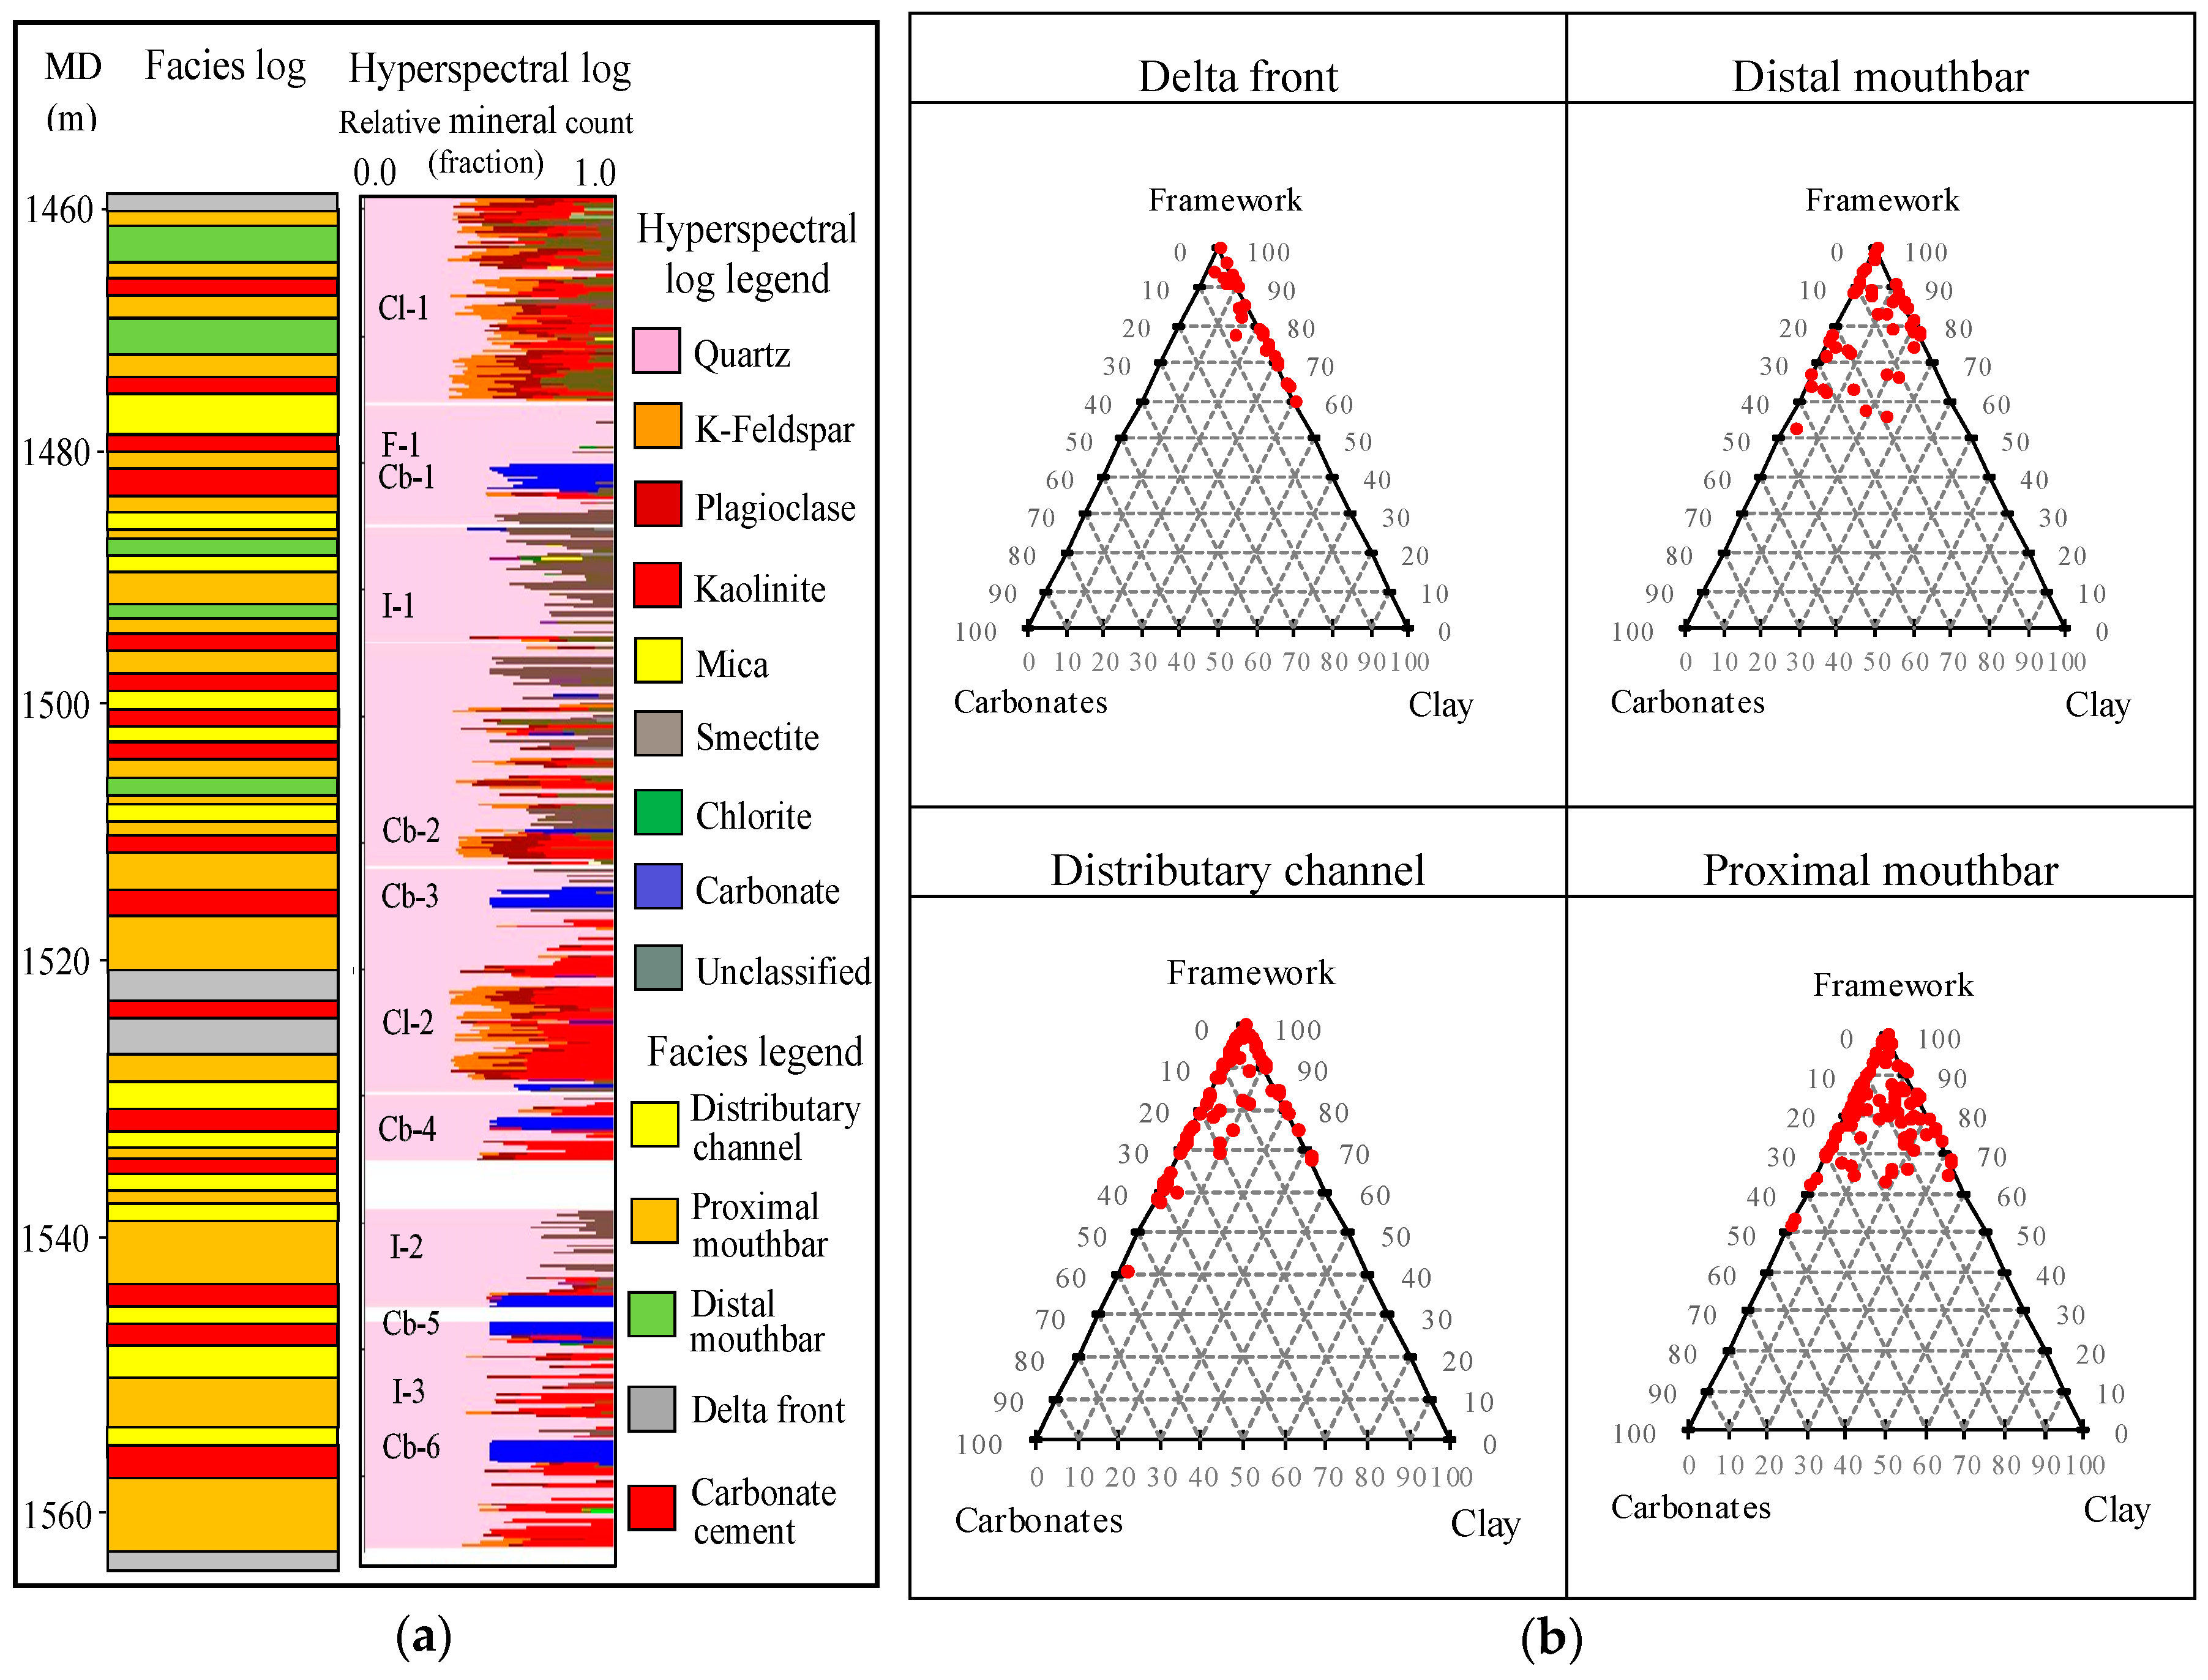
4.2. Hyperspectral Reflectance Analysis

Figure 8a shows the results obtained from the hyperspectral (TIR) core analysis for CRC-3. The minerals detected include framework minerals like quartz and alkali feldspar; clay minerals such as mica, kaolinite, smectite and chlorite; and carbonate minerals such as dolomite and calcite along with some minerals present in trace amounts like illite, siderite, magnesite, ankerite, rutile and ilmenite. Quartz is the most dominant mineral detected in the core. Among the clay minerals, kaolinite and smectite are the most dominant. Their proportion varies through depth. Six different carbonate-cemented layers have been observed between the depths of 1480 and 1482 m (Cb-1), 1508 m (Cb-2), 1514 and 1515 m (Cb-3), 1532 and 1533 m (Cb-4), 1547 and 1549 m (Cb-5) and 1556 and 1558 m (Cb-6). Clay minerals are dominant between depths of 1461 and 1475 m (Cl-1) and between 1520 and 1530 meters (Cl-2), while framework minerals dominate between depths of 1475 and 1480 m (F-1). Intercalations of clay minerals with the framework minerals occur between the depths 1483 and 1507 m (I-1), 1535 and 1545 m (I-2) and between 1548 and 1557 m (I-3). These intercalated zones depict the depths of intraformational baffles.
Figure 8b shows the proportion of the three end member mineral classes for each of the four facies as obtained from normalizing the respective contents of the major minerals. The proportion of the clay minerals is less than 30% in distributary channel while it is as high as 40% in delta front deposits. The proximal and distal mouthbars have intermediate clay content. The proportion of carbonates is less than 10% in delta front but reaches up to 60% in distributary channel sediments.

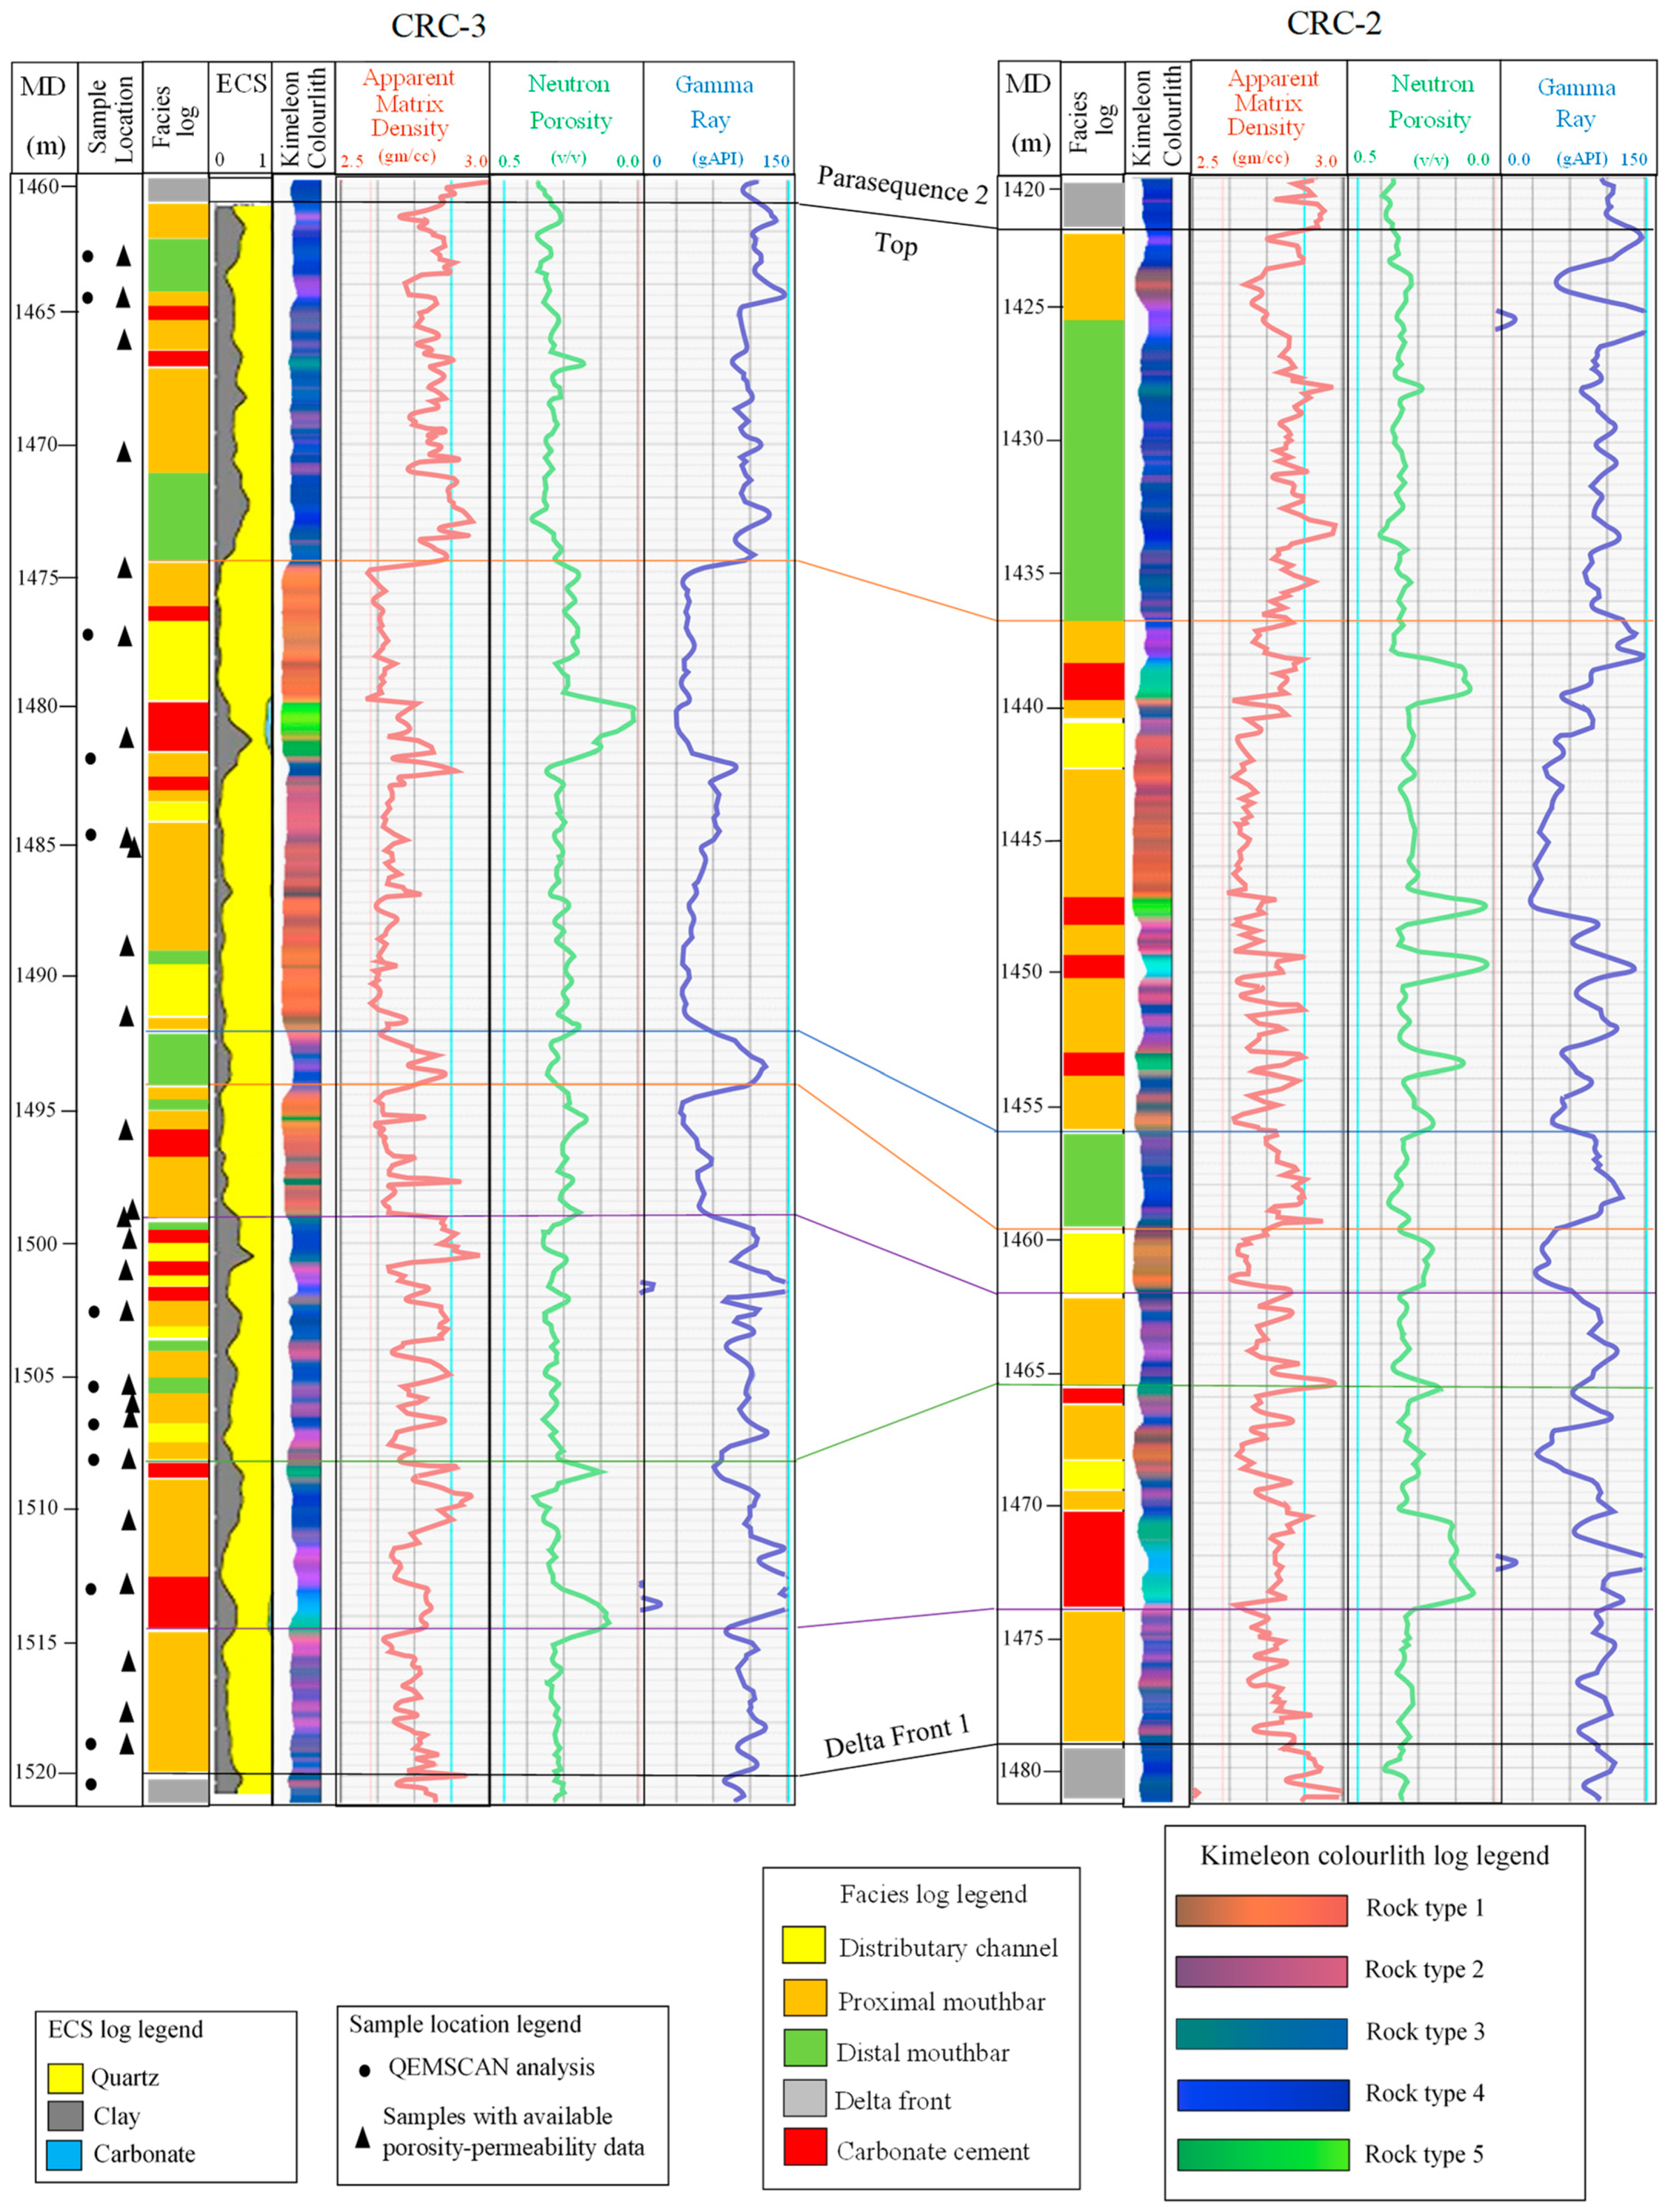
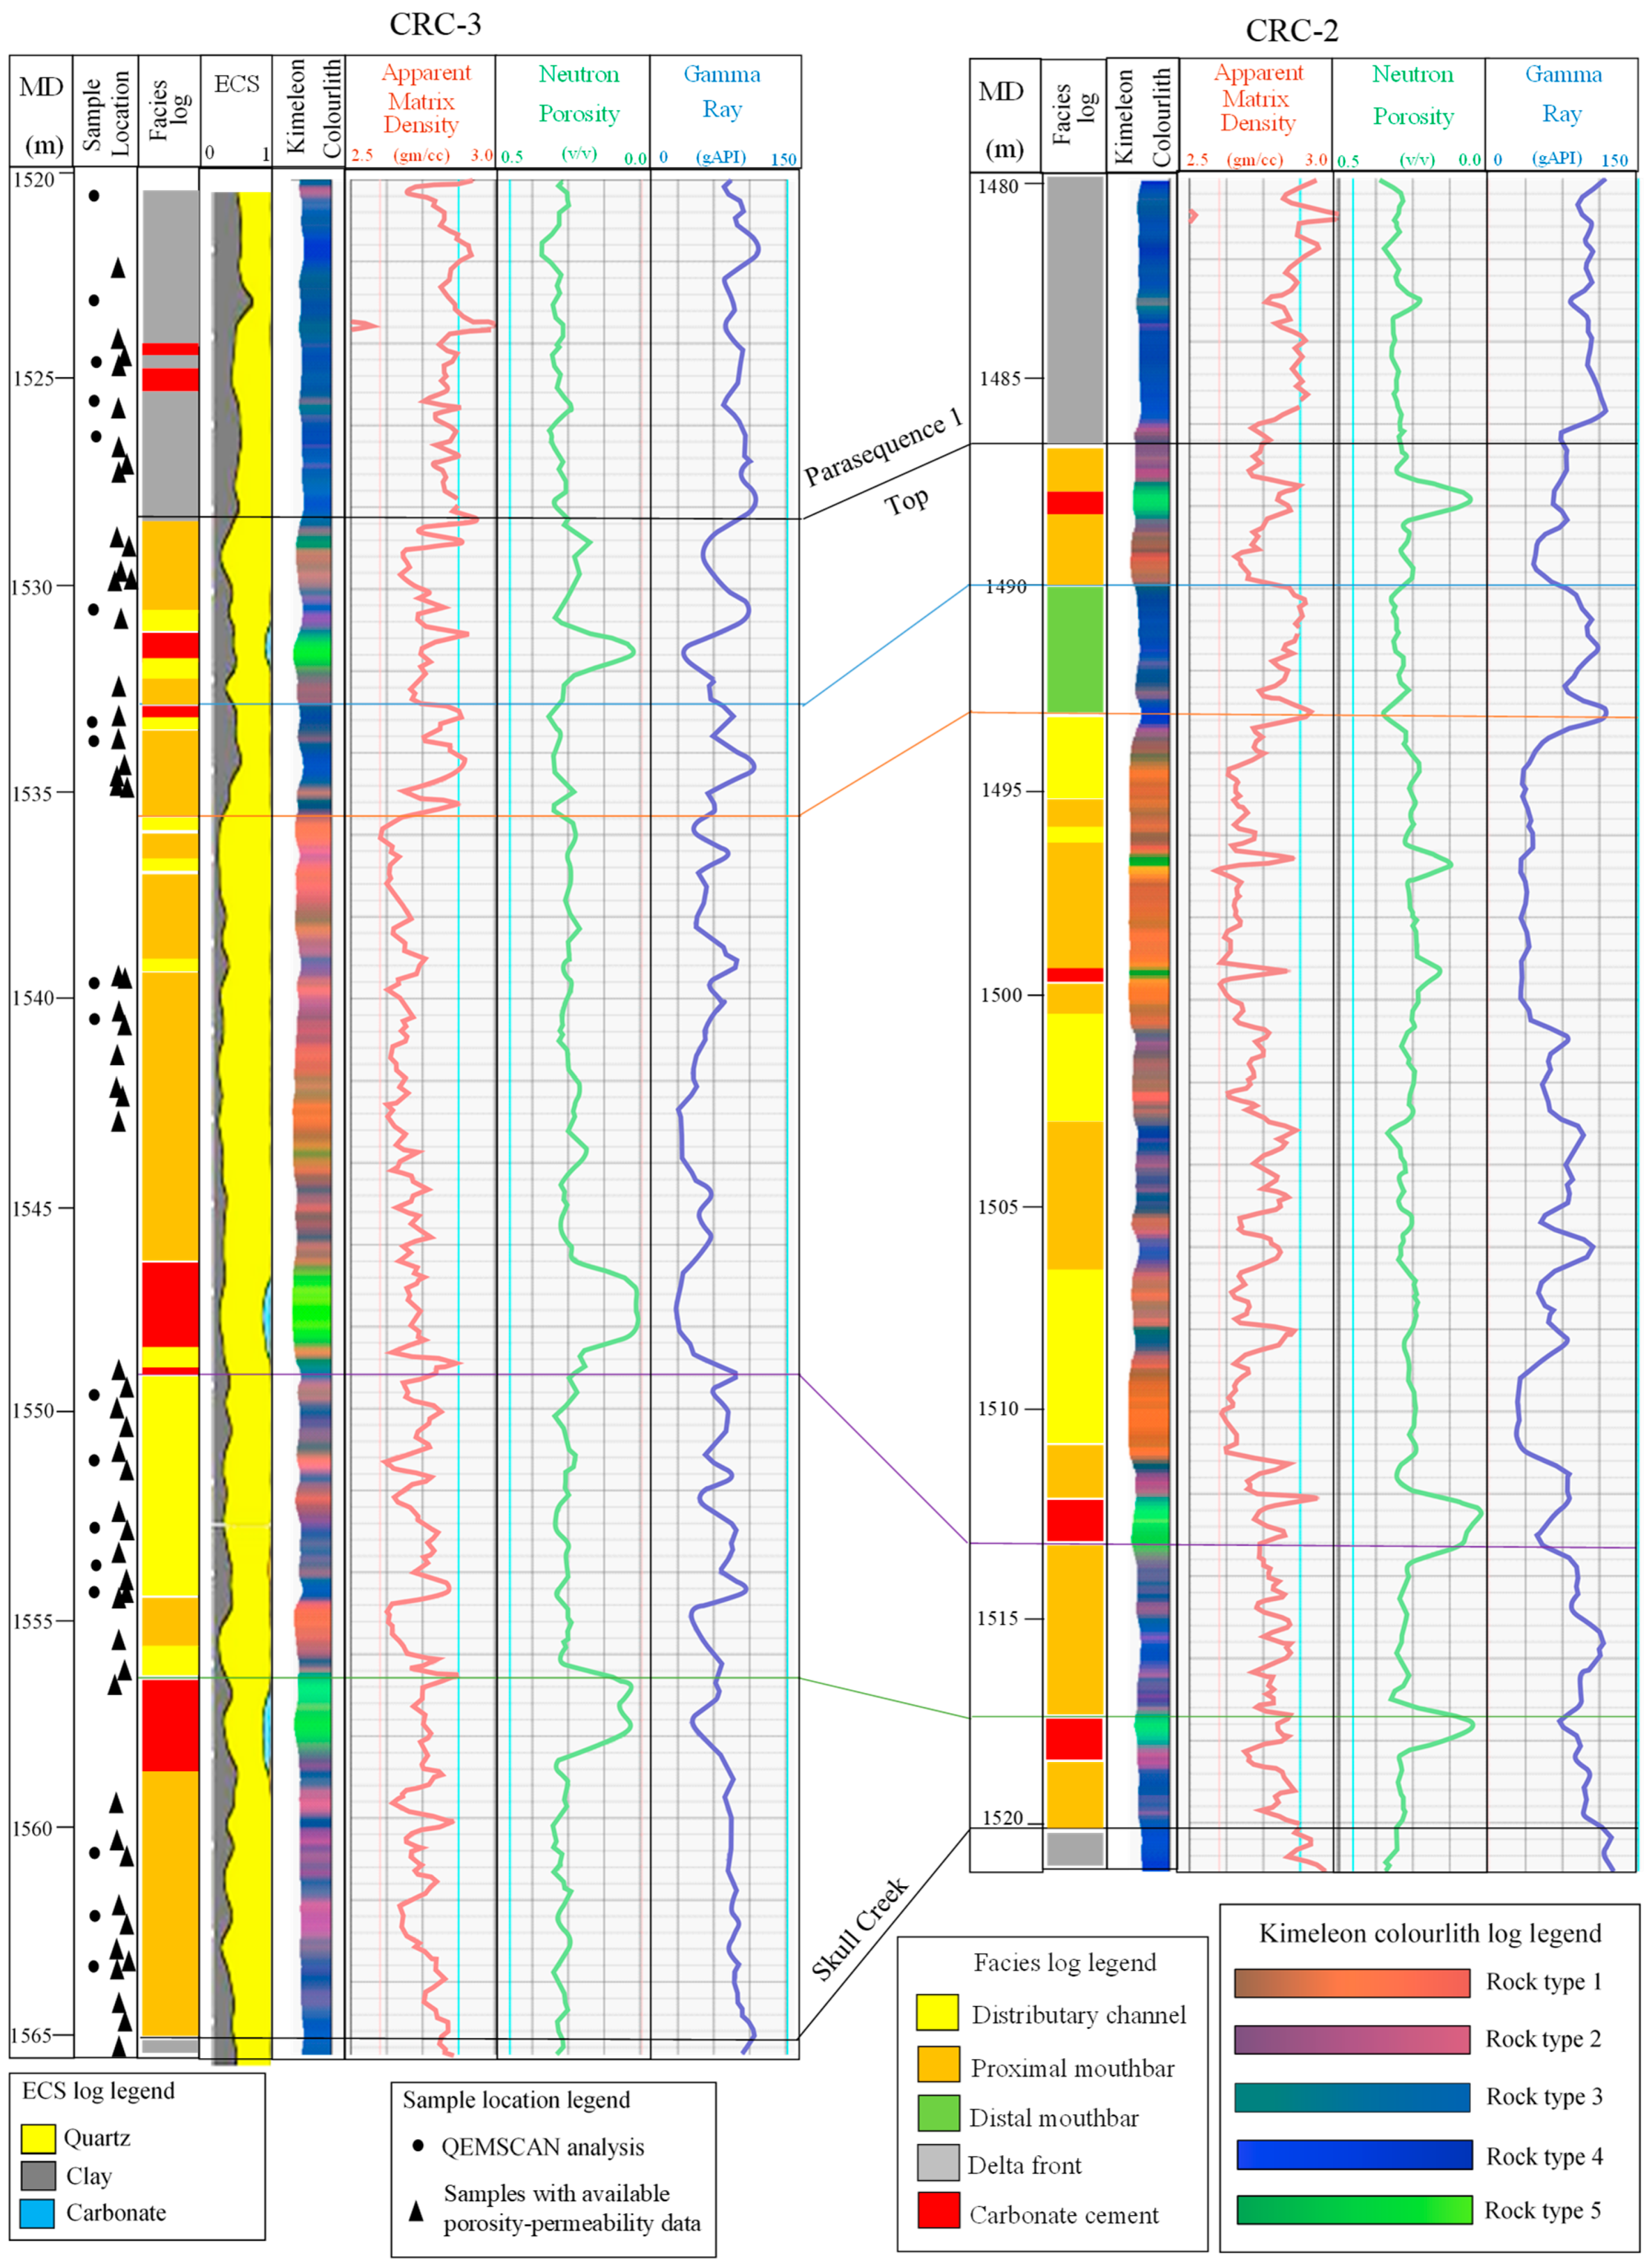
4.3. Colourlith and ECS Logs and Their Correlation

Colourlith logs are compared with the ECS log [24] (Figure 9 and Figure 10) showing that high proportions of quartz and feldspar correspond with red hue, while sequences with higher clay content agree with a blue hue. The presence of carbonates closely corresponds with a green hue. The three major shades also indicate the presence of three broad rock types. Furthermore, the red hue transitions into purple and greenish blue shades before merging with the blue hue, which is representative of clay rich intervals. This indicates the presence of two additional rock types between the framework and clay rich end members.
Hence, the analysis of colourlith logs leads to five rock type classes observed in the two parasequences: rock type 1 (red), rock type 2 (purple), rock type 3 (greenish blue), rock type 4 (blue) and rock type 5 (green).
Parasequence-2 (Figure 9) in CRC-3 ranges between 1461.6 and 1525 m depth. Overall, there are three distinctive sections, two clay dominated sections at the top and the bottom with a sand dominated section in the middle. The top clay section starts at 1461.6 m but extends to the overlying delta front facies and terminates at 1474.6 m. There are occasional interbedded sands and thin carbonated layers. The sand dominated section between 1474.6 and 1499.2 m is interrupted twice by clays at 1482 and 1492.4 m, which are 0.4 and 1.8 m thick respectively. Parasequence-2 in CRC-2 ranges from 1420 to 1486 m depth. It starts with a 15 m thick clay dominated layer with occasional sand extending to the overlying delta front facies. A 2 m thick carbonate-rich layer is identified at 1438 m. A 15 m thick sand bed ranges between 1440 and 1455 m depth. Towards the bottom of the interval, the lithology is clay dominated with minor intervals of sand. Additional carbonate-rich layers are identified at 1447 m, 1454 m, 1465m and 1472 m. Parasequence-2 terminates at the base of delta front facies, which is clay dominated.
Parasequence-1 (Figure 10) in CRC-3 ranges between 1525 and 1565.2 m depth. The changes between lithologies are progressive. The profile starts at the top with a clay dominated sequence (1525-1535.4 m) that overlies a delta front facies with numerous sand interbeds; two carbonate layers occur at 1528.8 and 1531.6 m. The interbedded sand layer transitions into mudstone with depth, which transitions towards the base into the underlying Skull Creek Formation. Two carbonate-rich layers have been identified at 1546.4 and 1556.4 m, which are 2.8 and 2 m thick respectively. Parasequence-1 in CRC-2 ranges from 1486 to 1518 m depth. It starts with a clay layer and transitions into a 2.7 m thick layer of sand. The remaining part of Parasequence-1 consists of interbedded clay and sand layers. Similar to CRC-3, the abundance of clay increases with depth and into the Skull Creek. There are two carbonate-rich layers at 1512 and 1517.3, which are 1.4 and 0.8 m thick respectively.
The sequence of rock types reflected in the two colourlith logs is similar for both parasequences and is traceable between the wells. As the distance between the well is only 630 m, the similarity in the rock type pattern is reasonable and lends confidence in the cross-well correlation of mud rich facies such as delta front and distal mouthbar (Figure 9 and Figure 10). The rock types constituting sand rich facies such as distributary channel cannot be confidently correlated as channels are known to be discontinuous between the two wells [22].

5. Discussion

5.1. Rock Types and Properties

Hyperspectral core logging, the combined wireline logs and discrete sample analysis show that there is significant lithological heterogeneity within Parasequence-1 and Parasequence-2 of the Paaratte Formation at the CO2CRC’s Otway Research Facility. The porosity and permeability analysis shows a bimodal distribution within the distal mouthbar and the delta front facies (Figure 4), which suggests that the depositional environment was characterized by phases of low and high energy. The bimodal distribution of porosity and permeability for distributary channel and proximal mouthbar are skewed towards higher porosity and permeability values indicating their primary deposition under higher energy conditions where medium to coarse sand is deposited. Grain size analysis confirms a coarse grained quartz and feldspar rich lithology with a modal grain size of 0.21 mm and 0.13 mm for distributary channel and proximal mouthbar, respectively (Figure 5, Figure 6 and Figure 7). The larger grain size for the samples belonging to distributary channel facies is expected as proximal mouthbars are located further downstream of the distributary channel facies and consequently experiences lower depositional energy conditions. Low porosity and permeability is more common in distal mouthbar and delta front facies (Figure 4) indicating sediment deposition under lower energy conditions. Clay size particles are expected to be dominant under such low energy conditions. This is confirmed by grain size analysis as the samples belonging to distal mouthbar and delta front facies show a higher proportion of clay minerals with modal grain size less than 0.05 mm (Figure 5, Figure 6 and Figure 7). The clay content increases while grain size decreases from distributary channel to proximal mouthbar and further to distal mouthbar and delta front facies. It is clear that the variations in physical properties and the mineral composition result from changes in the energy of the depositional environment.
The porosity and permeability results are coupled with the results from grain size analysis, semi-quantitative and quantitative mineral compositions to define rock type classes.
The bimodal distribution of porosity and permeability (Figure 4) suggests to subdivide the entire porosity spectrum into two categories or rock type classes: a. rocks with a porosity and permeability greater than 0.25 and 100 mD, respectively, and b. rocks with a porosity and permeability values less than 0.25 and 100 mD, respectively. However, the range in permeability for the two rock types is large and would lead to a large uncertainty in flow simulations. We have therefore further classified the data. The former class is subdivided into two subcategories: a. with permeability values less than 10 mD, and b. with permeability values between 10–100 mD. Similarly, the latter permeability class is subdivided into two subcategories: a. with permeability values between 100–1000 mD, and b. with permeability values greater than 1000 mD.
Rock types were further constrained in terms of their mineral composition using the semi-quantitative and quantitative mineral analysis. The results from hyperspectral analysis were used to characterize the rock types in terms of bulk carbonate content as the Hylogger output helps in the identifies carbonate-cemented zones (Figure 8). A threshold of 5% carbonate mineral fraction was chosen as a distinguishing criteria between the carbonate and non-carbonate samples for the purpose of rock type characterization. This criteria is later confirmed by the results obtained from QEMSCAN analysis.
The combined criteria of porosity and permeability and the semi-quantitative mineral composition as described above was applied to the five preliminary rock type classes from the colourlith analysis. The resultant rock type classes and their respective properties are described as: coarse sandstone (porosity > 0.25; permeability > 1000 mD; carbonate mineral proportion < 5%), fine sandstone (porosity > 0.25; permeability between 100–1000 mD; carbonate mineral proportion < 5%), siltstone (porosity < 0.25; permeability between 10–100 mD; carbonate mineral proportion < 5%), mudstone (porosity < 0.25; permeability < 10 mD; carbonate mineral proportion < 5%), carbonate-cemented sandstone (porosity < 0.25; permeability < 1000 mD; carbonate mineral proportion > 5%). 80 out of the total 82 samples fall into one of the five categories (Table A3, Appendix B). The remaining 2 data points remain unclassified.
The five preliminary rock type classes are further constrained in terms of bulk clay content based on QEMSCAN results. Quantitative mineralogy data from the 30 samples (Appendix C) was first assigned to one of the five 5 preliminary rock type classes based on the knowledge of available porosity and permeability data (Table A2, Appendix B). Hence, 5 samples fell under rock type 1, 13 under rock type 2, 4 under rock type 3, 7 under rock type 4 and 1 under rock type 5 (Table A2, Appendix B). The mean proportion of each mineral was calculated based on the QEMSCAN analysis for each rock type class along with their standard deviations (Table 2).
As can be seen from Table 2, the standard deviations of different mineral fractions for each rock type class are typically small. The mineral composition data from QEMSCAN analysis is added to rock type classes in terms of the range of bulk clay mineral content obtained for all samples belonging to each rock type class. Clay mineral content for coarse sandstone rock type class varies between 5–20%; for fine sandstone rock type class varies between 10–30%; for siltstone rock type class varies between 25–60%; for mudstone rock type class varies between 40–60% and for carbonate-cemented sandstone rock type class is less than 10%. Hence, each rock type class has a distinct range of clay mineral content, which adds another unique and significant criteria to the rock type classification.
Rock type classes were further constrained in terms of the modal grain size class for each rock type. Given the variability in the modal grain size distribution, the most recurring modal grain size among samples of the same rock type has been chosen to differentiate one rock type class from the other. The coarse sandstone rock type class has the largest grain size with the most recurring modal grain size class being 0.40–0.45mm. The fine sandstone class has the second highest grain size values with the most recurring modal grain size class being 0.08–0.09mm. Siltstone and mudstone both have the most recurring modal grain size classes smaller than 0.01mm. Though modal grain size classes of siltstone and mudstone are both <0.01 mm, the siltstones have a bimodal distribution while mudstones strictly have only one dominant grain size class (Appendix D). The carbonate-cemented sandstone has the modal grain size class of 0.07–0.08mm.
Rock type classes and their representative properties are presented in Table 3. Characteristic capillary entry pressure ranges are added for each rock type class (Table 1). The given rock type names reflect relative differences in modal grain size, but do not strictly comply with the Wentworth classification for detrital sediments (1922).
The five rock type classes (Table 3) were assigned to the 82 classifiable core samples and their sampling depth was assigned to the respective depth in the hyperspectral and colourlith logs of CRC-3 (Table A3, Appendix B). This resulted in a 1-D distribution of rock types at discrete depths. The correlation between the rock types at discrete depths and the respective color shade in the colourlith log (Figure 9 and Figure 10) validated the preliminary rock types as determined from the colourlith logs (Section 4.3). It now becomes clear that rock type 1 identified on the colourlith log is coarse sandstone, rock type 2 is fine sandstone, rock type 3 is siltstone, rock type 4 is mudstone and rock type 5 is carbonate-cemented sandstone. Based on the colourlith logs, the vertical variation of the five rock type classes and their respective properties is obtained at a resolution of 10 cm.

5.2. Correlation of Hyperspectral, ECS and Colourlith Logs

Hyperspectral, ECS and colourlith logs for the CRC-3 well were compared to each other to investigate the robustness of the different approaches and report any inconsistencies in the output obtained from the respective techniques. The hyperspectral log in Figure 8a shows clay dominated intervals between the depths of 1461 and 1475 m and between 1520 and 1530 m which is reflected in the colourlith output where the same intervals are dominated by mudstone. The ECS log in the same intervals shows a higher proportion of clay. The hyperspectral log shows a framework dominated interval between 1475 and 1480 m. This observation is again reflected in colourlith and the ECS log which show higher proportions of coarse sandstone and quartz, respectively, in the same interval. The hyperspectral log shows six intervals strongly enriched in carbonate, namely between the depths of 1480 and 1482 m, 1508 and 1509 m, 1514 and 1515 m, 1532 and 1533 m, 1547 and 1549 m and 1556 and 1558 m. These intervals are dominated by carbonate-cemented sandstone in the colourlith log and show a small proportion of carbonates in the ECS log. The correlation is also tested for the framework and clay intercalated intervals on the hyperspectral log between the depths of 1483 and 1498 m, 1535 and 1545 m and 1548 and 1555 m. The respective intervals show hues of red, purple and blue on the colourlith log indicating the intercalation of coarse sandstone, fine sandstone and mudstone. These intervals are expected to be lithologically heterogeneous and consist of intraformational baffles. This information is difficult to deduce from the ECS log. Additionally, the colourlith identifies thin carbonate-rich sequences that do not seem to be pictured in the ECS log.
Overall, the distribution of lithology on the three logs agrees very well. Our approach to use three independent data sets for the characterization of a heterogeneous sedimentary reservoir is successful.

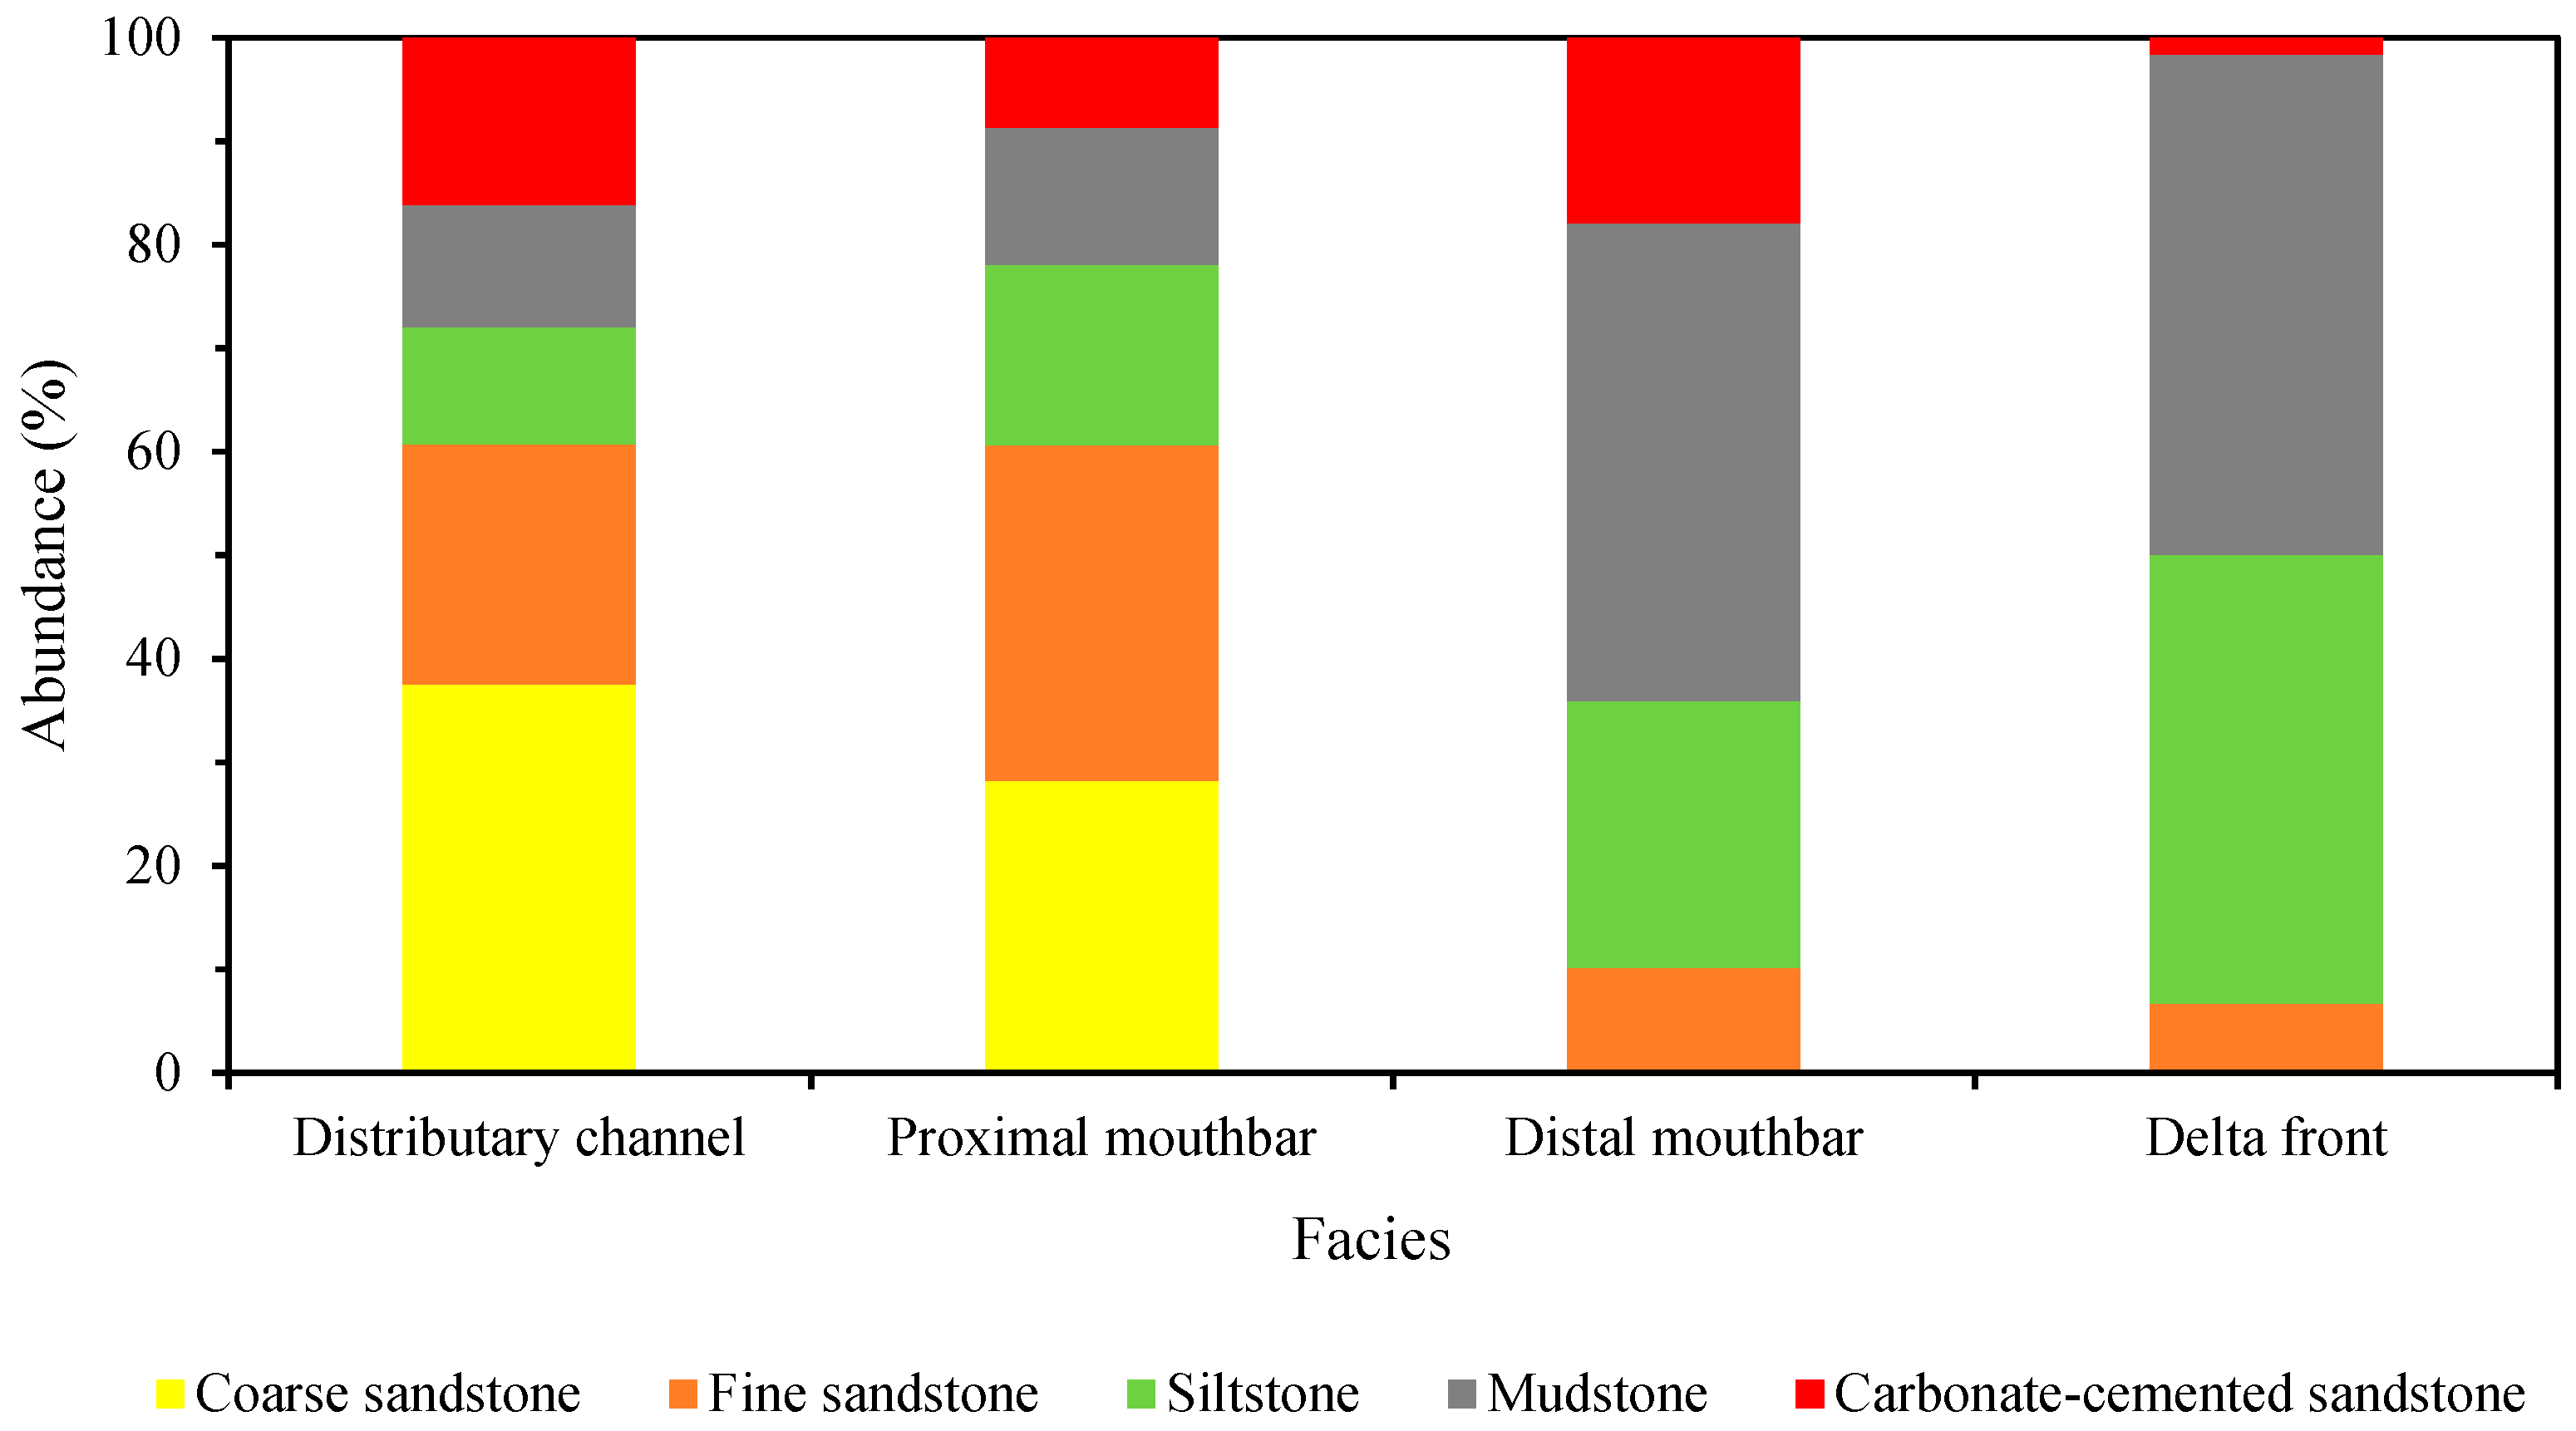
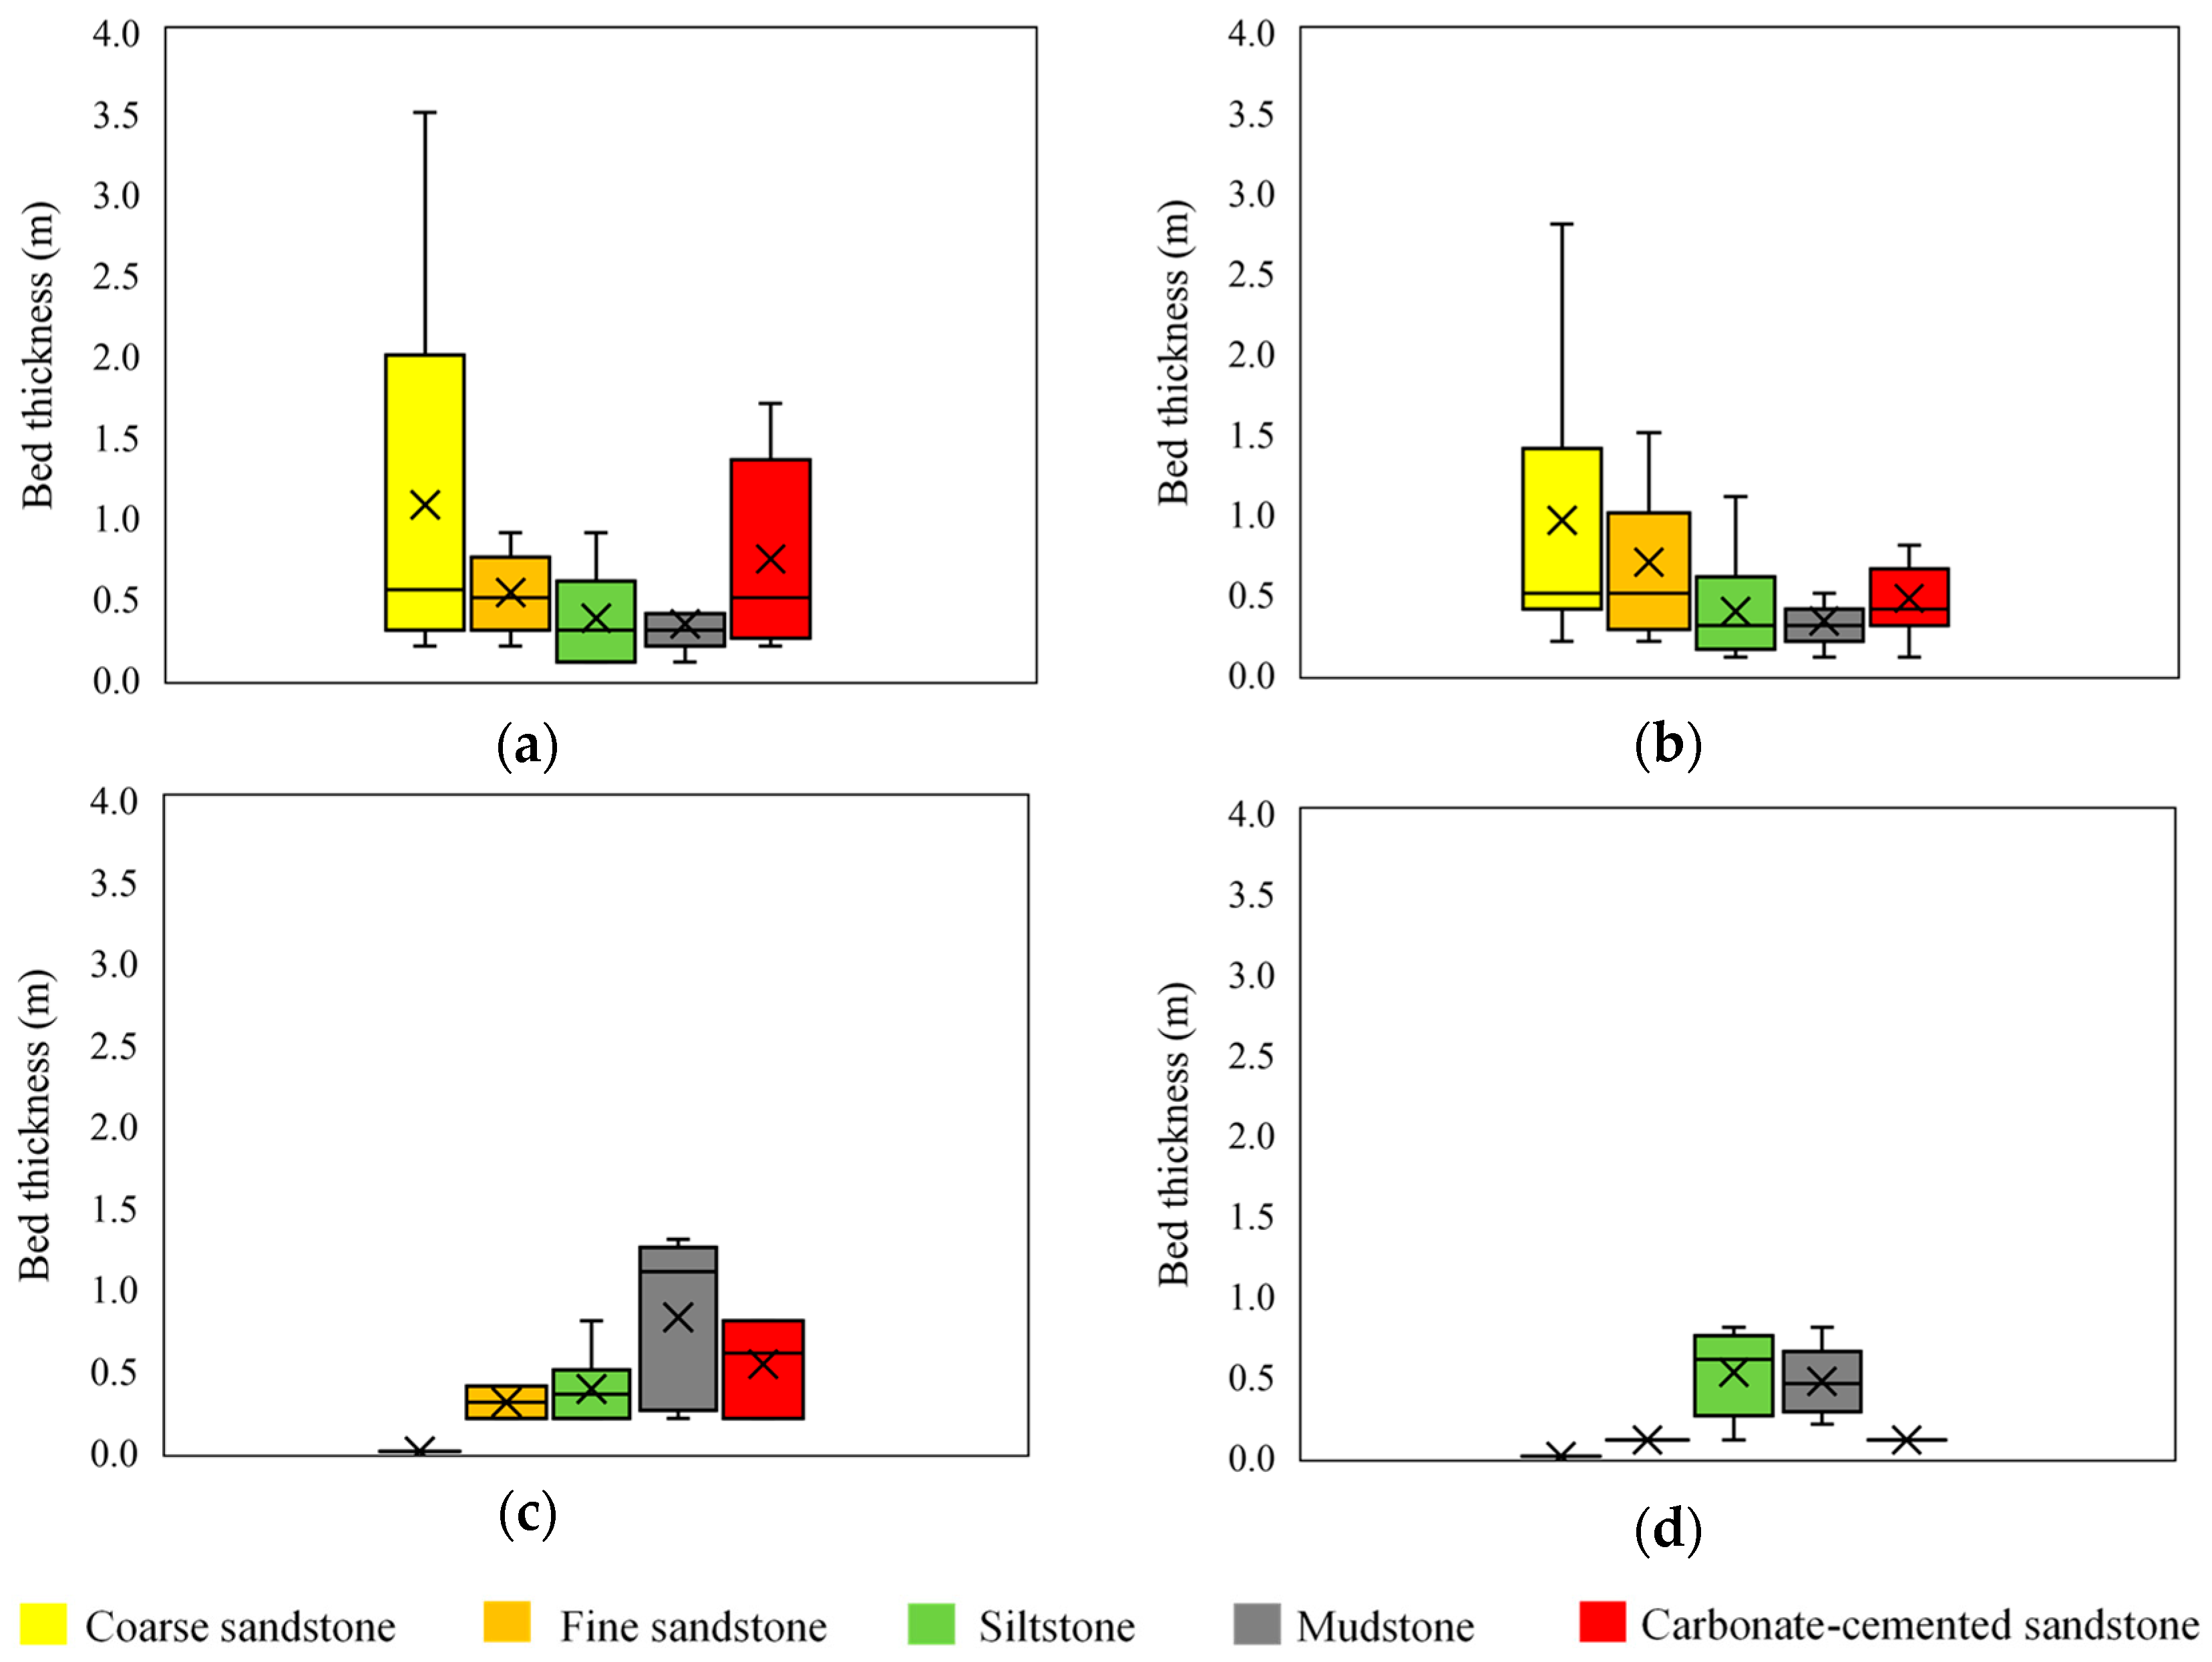
5.3. Rock Type Abundance and Variability

The colourlith logs (Figure 9 and Figure 10) are compared to the facies logs (Figure 2) for CRC-2 and CRC-3 to obtain the abundance of different rock types within the four sedimentary facies (Figure 11). The rock type abundances are found to be similar for the two wells. The abundance of the rock types in different facies shows a relationship with the characteristic energy of the depositional environments. Coarse sandstone and fine sandstone constitute more than 50% of distributary channel and proximal mouthbar. The abundance of coarse sandstone decreases from distributary channel to proximal mouthbar and reduces to a nil in distal mouthbar and delta front facies. The proportion of siltstone and mudstone increases subsequently in the facies deposited under low energy conditions. Volumetrically, siltstone and mudstone together account for more than 70% of distal mouthbar and more than 90% of delta front facies.
Cross-well correlation gives the lateral variability of the rock types (Figure 9 and Figure 10). The high energy facies terminate between the two wells [22] and, hence, limit the lateral extent of the constituent rock types. The vertical variability of rock types is given in terms of the range of their bed thickness in the two wells (Figure 12). The bed thickness for a given rock type is seen to vary for different facies. The facies deposited under higher energy conditions like distributary channel and proximal mouth bar show greater thickness of rock types characterized by larger grain sizes such as coarse sandstone and fine sandstone. Coarse sandstone makes the bulk of the high energy facies and its bedding thickness ranges between 20 cm to 3.5 m in distributary channel and between 20 cm to 2.8 m in proximal mouthbar (Figure 12a,b). The thickness of siltstone and mudstone is higher in low energy facies and varies between 20 cm to 1.5 m in distal mouthbar and between 20 cm and 1 m in delta front (Figure 12c,d).

5.4. Implications of High Resolution Rock Typing

The vertical distribution of rock types, their cross-well correlation and abundance in different facies has important implications. The cross-well correlation of rock properties adds significant details to the already existing facies correlation between the wells (Figure 2). As already discussed, the cm to meter scale heterogeneity plays an important role in fluid flow and geochemical reactions [4,5,7,8,9,10]. In coarse gridded geostatistical models, the geometry of geobodies is usually determined by using data from analogue sites in order to better constrain the geological model [55]. However, such an approach may not always be accurate. In the absence of analogue data, lithological properties are usually populated using variograms based on wireline logs. Such an approach may be impractical in reservoir models populated with large number of rock properties as variograms are required as an input for each property [3]. The independent population of different properties might also result in some grid cells with an unrealistic combination of various flow and petrophysical properties. Also, this approach is not suitable for populating mineral data into the geostatistical model. The high resolution rock typing presented in this study overcomes these challenges by using abundant data from two closely spaced wells. By coupling different flow, petrophysical and mineralogical properties in one rock type class, the number of variograms reduces to just one for each rock type class. The quantitative estimates of lateral and vertical variability of rock types and their abundance in different facies is useful in building better informed variograms as well as a more confident determination of the geometry of the geobodies. The variograms can then be used to populate coarse and fine sandstones in reservoir and siltstone and mudstone in seals based on the abundance of each rock type in each facies. Ultimately this improves the accuracy of reservoir models. The rock type classes and their correlation is useful in constructing high resolution and more confident accurate geostatic models which will consequently contribute towards improving dynamic simulation results and perhaps our understanding of the results.

6. Conclusions

The lowermost two parasequences of the Paaratte Formation Unit A, composed of coastal to shallow-marine sediments were used to derive a rock type classification scheme accounting for porosity and permeability, mineral composition and grain size distribution. All properties presented in this work are statistically distinct for each rock type class. The fact that the properties are derived from real samples while honoring concepts of depositional environments makes the presented rock type characterization practical and geologically consistent. The scheme can be further improved by including properties like relative permeability-saturation curves, capillary pressure-saturation curves and reactive mineral surface areas for each rock type. A major advantage of the rock typing presented here is that it meaningfully integrates the available flow, petrophysical and mineralogical properties. The rock type correlation between wells presents a high resolution extent of lithological heterogeneity vertically as well as laterally for the CO2CRC’s Otway Research Facility. The results uniquely provide a fine scale structural framework for running detailed simulations addressing CO2 flow and reactions. The correlation serves to ascertain the extent and geometry of geobodies which is important information for constructing the variograms in geostatistical modelling. The work presented in this study shall contribute to the existing geostatistical models of the CO2CRC’s Otway Research Facility and may support geostatic modelling at other sites composed of coastal to shallow-marine sediments as well for the purpose of flow and reactive transport simulations.

Author Contributions

Conceptualization, R.R.H.; Data curation, A.M. and L.P.; Formal analysis, A.M. and L.P.; Funding acquisition, R.R.H.; Supervision, R.R.H.; Writing–original draft, A.M. and L.P.

Funding

This research was funded by BHP Billiton.

Acknowledgments

This study is a contribution to GeoCquest, a BHP-supported collaborative project of The University of Melbourne (Australia), the University of Cambridge (UK) and Stanford University (USA), aimed at developing a better understanding of small-scale heterogeneity and its influence on CO2 trapping mechanisms. The authors would like to thank the CO2CRC Ltd. for giving access to data from the CO2CRC’s Otway Research Facility and BHP for providing project funding. The authors also thank Tess Dance from CSIRO for helping to compile the data, for providing core descriptions including facies interpretations of CRC-3 and for discussing the data. The authors thank Jay Black for conducting the grain size analysis on 2D mineral maps, a service provided through the Trace Analysis for Chemical, Earth and Environmental Sciences (TrACEES) platform, which receives funding from the Melbourne Collaborative Research Infrastructure Program (MCRIP) at the University of Melbourne. The Geological Survey of Western Australia in Perth provided the hyperspectral core logging for CRC-3. QEMSCAN analysis was done at the Centre for Advanced Microscopy, Australian National University.

Conflicts of Interest

The authors declare no conflict of interest.

Appendix A

This section presents the 30 core samples chosen for QEMSCAN and grain size analysis. The samples cover the range of lithological heterogeneity found in the different sedimentary facies. Table A1 provides a description of depth, depositional environment and all available flow data. Sample IDs are marked on the samples.
Figure A1. The core samples chosen for quantitative mineral analysis.
Geosciences 09 00278 g0a1aGeosciences 09 00278 g0a1b
Table A1. 30 core samples from CRC-3 well.
Sedimentary FaciesCore Sample IDSample Depth (m)Porosity (%)Permeability (mD)
Distributary Channel#931477.2026.97410.00
#56V1533.7821.21.07
#421549.7528.41110.00
#391551.2526.5615.00
#37V1552.8229.61930.00
#351553.4821.2130.00
#341554.0716.427.50
Proximal Mouthbar#971464.8028.5141.00
#921481.5513.10.55
#911484.4529.71010.00
#821502.9024.0357.00
#791506.9229.3262.00
#771508.8026.6353.00
#751513.6023.4198.00
#721518.4527.1109.00
#591531.5029.0357.00
#551533.8612.633.40
#51V1539.5026.8407.00
#501540.3028.34160.00
#271560.9528.0249.00
#251562.6022.717.00
#231563.6029.1535.00
Distal Mouthbar#981462.8528.8324.00
#811505.0014.10.90
Delta Front#711520.5028.4182.00
#691523.9017.20.08
#67H1524.6521.50.64
#67V1524.6521.5NA
#661525.6416.30.47
#641526.0527.6268.00

Appendix B

The following section presents the samples assigned to the five rock type classes (Table A2) and the analysis of Hylogger data (Table A3).
Table A2. 30 samples chosen for QEMSCAN analysis as assigned to different rock type classes.
Rock Type ClassesSample ID for QEMSCAN Analysis
Rock Type 1 (Coarse Sandstone)#93, #50, #37V, #42, #91
Rock Type 2 (Fine Sandstone)#23, #27, #39, #51, #64, #71, #72, #79, #82, #98, #59, #97, #77
Rock Type 3 (Siltstone)#25, #34, #35, #55
Rock Type 4 (Mudstone)#56V, #66, #67V, #69, #81, #92, #67H
Rock Type 5
(Carbonate-cemented Sandstone)
#75
Table A3. Hylogger data from CRC-3 well and corresponding rocktype classes.
Geosciences 09 00278 i001 Distributary channel Geosciences 09 00278 i002 Proximal mouthbar Geosciences 09 00278 i003 Distal mouthbar Geosciences 09 00278 i004 Delta front
Depth (m)Porosity (Fraction)Permeability (mD)Framework (%)Clay (%)Carbonate (%)Rock Type Class Assigned
1462.850.29324.0078.470.0021.53Carbonate-cemented sandstone
1464.800.29141.0086.919.533.56Fine sandstone
1466.800.201.0362.6618.5618.78Carbonate-cemented sandstone
1470.800.202.2583.6616.340.00Mudstone
1474.550.150.0674.8318.406.77Carbonate-cemented sandstone
1477.200.277410.00100.000.000.00Coarse sandstone
1481.550.130.5576.100.0023.90Carbonate-cemented sandstone
1484.450.314930.00100.000.000.00Coarse sandstone
1484.450.301010.00100.000.000.00Coarse sandstone
1488.700.2310300.00100.000.000.00Coarse sandstone *
1492.640.292810.00100.000.000.00Coarse sandstone
1495.900.282040.00100.000.000.00Coarse sandstone
1499.030.2619.60100.000.000.00Unclassified
1499.100.28747.00100.000.000.00Fine sandstone
1499.400.301140.0081.748.739.53Carbonate-cemented sandstone
1501.000.130.8359.603.6536.75Carbonate-cemented sandstone
1502.900.24357.00100.000.000.00Fine sandstone *
1505.000.140.9088.944.466.60Carbonate-cemented sandstone
1505.850.191.4697.212.790.00Mudstone
1506.920.29262.00100.000.000.00Fine sandstone
1508.120.29476.00100.000.000.00Fine sandstone
1508.800.27353.00100.000.000.00Fine sandstone
1510.750.212.8263.9933.522.50Mudstone
1513.600.23198.0092.750.007.25Carbonate-cemented sandstone
1516.650.196.3576.8923.110.00Mudstone
1517.800.29205.0095.033.231.74Fine sandstone
1518.450.27109.0092.397.610.00Fine sandstone
1522.750.150.0263.9636.040.00Mudstone *
1523.900.170.0876.6223.380.00Mudstone *
1524.600.190.5577.6222.380.00Mudstone *
1524.650.220.6485.3814.620.00Mudstone *
1525.640.160.4778.6321.370.00Mudstone *
1526.050.28268.0091.468.540.00Fine sandstone
1526.250.150.1670.0829.920.00Mudstone *
1526.800.150.0363.2136.790.00Mudstone *
1528.500.160.0560.4739.530.00Mudstone *
1528.530.160.0360.4739.530.00Mudstone *
1529.600.27751.0092.600.007.40Carbonate-cemented sandstone
1529.650.27814.00100.000.000.00Fine sandstone
1529.700.26373.00100.000.000.00Fine sandstone
1531.500.29357.0094.405.600.00Fine sandstone
1532.850.167.1492.647.360.00Mudstone
1533.230.281200.0096.243.760.00Coarse sandstone
1533.780.211.0774.2425.760.00Mudstone
1533.860.1333.4061.9938.010.00Siltstone
1534.100.2315.3087.3112.690.00Siltstone
1534.820.120.1571.4128.590.00Mudstone
1539.500.27407.00100.000.000.00Fine sandstone
1539.600.281190.00100.000.000.00Coarse sandstone
1540.300.284160.00100.000.000.00Coarse sandstone
1540.550.291820.00100.000.000.00Coarse sandstone
1541.350.292200.00100.000.000.00Coarse sandstone
1542.350.302010.00100.000.000.00Coarse sandstone
1542.420.302410.00100.000.000.00Coarse sandstone
1543.750.282380.00100.000.000.00Coarse sandstone
1548.900.020.0274.250.0025.75Carbonate-cemented sandstone
1549.250.171.0582.9317.070.00Mudstone
1549.750.281110.0098.430.001.57Coarse sandstone
1550.300.28799.00100.000.000.00Fine sandstone
1550.750.231030.0067.6832.320.00Unclassified
1551.250.27615.0096.913.090.00Fine sandstone
1551.650.249670.0097.440.002.56Coarse sandstone *
1552.820.301930.00100.000.000.00Coarse sandstone
1552.950.302550.00100.000.000.00Coarse sandstone
1553.480.21130.0074.7125.290.00Siltstone *
1554.070.1627.5067.7532.250.00Siltstone
1554.120.160.0367.7532.250.00Mudstone *
1554.250.275250.0078.3421.660.00Coarse sandstone
1555.350.302840.0091.578.430.00Coarse sandstone
1556.420.29556.00100.000.000.00Fine sandstone
1556.550.303420.00100.000.000.00Coarse sandstone
1559.570.28195.0089.5910.410.00Fine sandstone
1560.950.28249.0084.8315.170.00Fine sandstone
1561.020.29318.00100.000.000.00Fine sandstone
1562.600.2317.0079.3820.620.00Siltstone
1562.640.2889.1069.6230.380.00Fine sandstone *
1563.350.29380.00100.000.000.00Fine sandstone
1563.450.29378.0086.2013.800.00Fine sandstone
1563.600.29535.0076.0423.960.00Fine sandstone
1564.250.170.5763.1836.820.00Mudstone *
1564.700.223.7365.0534.950.00Mudstone
1565.390.170.1577.9522.050.00Mudstone *
Rock type classes marked * do not strictly fall into the porosity and permeability range defined in Table 2.

Appendix C

Figure A2. The following section presents the QEMSCAN results for the 30 samples from CRC-3 well.
Geosciences 09 00278 g0a2aGeosciences 09 00278 g0a2bGeosciences 09 00278 g0a2cGeosciences 09 00278 g0a2dGeosciences 09 00278 g0a2eGeosciences 09 00278 g0a2f

Appendix D

Figure A3. The following section presents the results of the grain size analysis of the 30 samples from CRC-3. The analysis is done in terms of area fraction covered on the minerals maps as a function of the equivalent grain size of different mineral phases.
Geosciences 09 00278 g0a3aGeosciences 09 00278 g0a3bGeosciences 09 00278 g0a3cGeosciences 09 00278 g0a3dGeosciences 09 00278 g0a3eGeosciences 09 00278 g0a3f

References

  1. Steefel, C.I.; DePaolo, D.J.; Lichtner, P.C. Reactive transport modeling: An essential tool and a new research approach for the Earth sciences. Earth Planet. Sci. Lett. 2005, 240, 539–558. [Google Scholar] [CrossRef]
  2. Doyen, P. Seismic Reservoir Characterization: An Earth Modelling Perspective; EAGE publications: Houten, The Netherlands, 2007; Volume 2. [Google Scholar]
  3. Ringrose, P.; Bentley, M. Reservoir model types. In Reservoir Model Design; Springer: Dordrecht, The Netherlands, 2015; pp. 173–231. [Google Scholar]
  4. Gershenzon, N.I.; Ritzi, R.W.; Dominic, D.F.; Mehnert, E.; Okwen, R.T. Capillary trapping of CO2 in heterogeneous reservoirs during the injection period. Int. J. Greenh. Gas. Con. 2017, 59, 13–23. [Google Scholar] [CrossRef]
  5. Trevisan, L.; Krishnamurthy, P.G.; Meckel, T.A. Impact of 3D capillary heterogeneity and bedform architecture at the sub-meter scale on CO2 saturation for buoyant flow in clastic aquifers. Int. J. Greenh. Gas. Con. 2017, 56, 237–249. [Google Scholar] [CrossRef]
  6. Miall, A.D. Facies Models Stratigraphy: A Modern Synthesis; Springer: Berlin/Heidelberg, Germany, 2016; pp. 161–214. [Google Scholar]
  7. Ennis-King, J.; Bradshaw, J.; Gibson-Poole, C.; Hennig, A.; Lang, S.; Paterson, L.; Root, R.; Sayers, J.; Spencer, L.; Streit, J. Long-term numerical simulation of a portfolio of possible sites for geological storage of carbon dioxide in Australia. Greenh. Gas Con. Technol. 7 2005, 1, 711–719. [Google Scholar]
  8. Liang, C.; Cao, Y.; Liu, K.; Jiang, Z.; Wu, J.; Hao, F. Diagenetic variation at the lamina scale in lacustrine organic-rich shales: Implications for hydrocarbon migration and accumulation. Geochim. Cosmochim. Acta 2018, 229, 112–128. [Google Scholar] [CrossRef]
  9. Ringrose, P.S.; Sorbie, K.S.; Corbett, P.W.M.; Jensen, J.L. Immiscible flow behaviour in laminated and cross-bedded sandstones. J. Pet. Sci. Eng. 1993, 9, 103–124. [Google Scholar] [CrossRef]
  10. Yang, L.; Xu, T.; Yang, B.; Tian, H.; Lei, H. Effects of mineral composition and heterogeneity on the reservoir quality evolution with CO2 intrusion. Geochem. Geophy. Geosy. 2014, 15, 605–618. [Google Scholar] [CrossRef]
  11. Flett, M.; Gurton, R.; Weir, G. Heterogeneous saline formations for carbon dioxide disposal: Impact of varying heterogeneity on containment and trapping. J. Pet. Sci. Eng. 2007, 57, 106–118. [Google Scholar] [CrossRef]
  12. Mikes, D.; Barzandji, O.H.M.; Bruining, J.; Geel, C.R. Upscaling of small-scale heterogeneities to flow units for reservoir modelling. Mar. Pet. Geol. 2006, 23, 931–942. [Google Scholar] [CrossRef]
  13. Wen, H.; Li, L. An upscaled rate law for magnesite dissolution in heterogeneous porous media. Geochim. Cosmochim. Acta 2017, 210, 289–305. [Google Scholar] [CrossRef]
  14. Cooperative Research Centre for Greenhouse Gas Technologies. Available online: http://www.co2crc.com.au/otway-research-facility-2/ (accessed on 17 June 2019).
  15. Boyd, G.A.; Gallagher, S.J. The sedimentology and palaeoenvironments of the Late Cretaceous Sherbrook Group in the Otway Basin. East. Aust. Basins Symp. 2001, 475–484. [Google Scholar]
  16. Dance, T.; Arnot, M.; Bunch, M.; Hortle, A.; Lawrence, M.; Ennis-King, J. Geocharacterisation and Static Modelling of the Lower Paaratte Formation; CO2CRC Otway Project Stage 2; Cooperative Research Centre for Greenhouse Gas Technologies: Canberra, Australia, 2012; CO2CRC Publication Number RPT12-3481. [Google Scholar]
  17. Geary, G.C.; Constantine, A.E.; Reid, I.S.A. New Perspectives on Structural Style and Petroleum Prospectivity, Offshore Eastern Otway Basin; Petroleum Exploration Society of Australia (PESA): Adelaide, Australia, 2001. [Google Scholar]
  18. Geary, G.C.; Reid, I.S.A. Geology and Prospectivity of the Offshore Eastern Otway Basin, Victoria - for the 1998 Acreage Release; Department of Natural Resources and Environment: Palmerston, Australia, 1998. [Google Scholar]
  19. Lawrence, M.J.F.; Arnot, M.; Browne, G.H.; Bunch, M.; Dance, T. Geological Interpretation of Core and Wireline Data from Otway Project Wells CRC-1 and CRC-2; CO2CRC Publication Number RPT12-3481; Cooperative Research Centre for Greenhouse Gas Technologies: Canberra, Australia, 2013. [Google Scholar]
  20. Daniel, R. Containment/Injectivity Results from MICP Analysis for Seals, Intraformational Barriers and Reservoir Samples, CRC-2, Otway Basin; CO2CRC Publication Number: TBN 12-3830; Cooperative Research Centre for Greenhouse Gas Technologies: Melbourne, Australia, 2012. [Google Scholar]
  21. Daniel, R.F.; Menacherry, S.; Bunch, M. Characterisation of Dolomitic Intraformational Barriers, CRC-2B Injection Interval, Paaratte Formation; CO2CRC Publication Number: RPT12-3532; Cooperative Research Centre for Greenhouse Gas Technologies: Melbourne, Australia, 2012. [Google Scholar]
  22. Dance, T. Characterisation of the Late Cretaceous Paaratte Formation, a heterogeneous saline aquifer, for an Australian CO2 Storage Project. J. Pet. Geol. 2018. (submitted). [Google Scholar]
  23. Dance, T. Assessment and geological characterisation of the CO2CRC Otway Project CO2 storage demonstration site: From prefeasibility to injection. Mar. Pet. Geol. 2013, 46, 251–269. [Google Scholar] [CrossRef]
  24. Combinable Magnetic Resonance Report; Schlumberger and CO2CRC Limited: Perth, Australia, (unpublished).
  25. Moore, A.M.G.; Stagg, H.M.J.; Norvick, M.S. Deep-water Otway Basin: A new assessment of the tectonics and hydrocarbon prospectivity. APPEA J. 2000, 40, 66–85. [Google Scholar] [CrossRef]
  26. Exon, N.F.; Lee, C.S. Seabed sampling off southeast Australia. BMR Res. Newsl. 1987, 2–4. [Google Scholar]
  27. Miyazaki, S.; Lavering, I.H.; Stephenson, A.E.; Pain, L. Otway Basin, South Australia, Victoria and Tasmania. Aust. Bur. Miner. Resour. Geol. Geophys. Pet. Accumul. Rep. 1990, 6, 62–66. [Google Scholar]
  28. Robertson, C.S.; Cronk, D.K.; Mayne, S.J.; Townsend, D.G. A review of petroleum exploration and prospects in the Otway Basin region. Canberra: Geosci. Aust. 1978, 49. [Google Scholar]
  29. Stacey, A.; Mitchell, C.; Nayak, G.; Struckmeyer, H.; Morse, M.; Totterdell, J.; Gibson, G. Geology and petroleum prospectivity of the deepwater Otway and Sorell basins: new insights from an integrated regional study. APPEA J. 2011, 51, 692. [Google Scholar] [CrossRef]
  30. Holford, S.; Hillis, R.; Duddy, I.; Green, P.; Stoker, M.; Tuitt, A.; Backé, G.; Tassone, D.; MacDonald, J. Cenozoic post-breakup compressional deformation and exhumation of the southern Australian margin. APPEA J. 2011, 51, 613–638. [Google Scholar] [CrossRef] [Green Version]
  31. Krassay, A.A.; Cathro, D.L.; Ryan, D.J.; Boult, P.J.; Johns, D.R.; Lang, S.C. A Regional Tectonostratigraphic Framework for the Otway Basin; Petroleum Exploration Society of Australia (PESA): Adelaide, Australia, 2004; pp. 97–116. [Google Scholar]
  32. Norvick, M.S. Plate Tectonic Reconstructions of Australia’s Southern Margins; Geoscience Australia: Canberra, Australia, 2005. [Google Scholar]
  33. Willcox, J.B.; Stagg, H.M.J. Australia’s southern margin: a product of oblique extension. Tectonophysics 1990, 173, 269–281. [Google Scholar] [CrossRef]
  34. Geoscience Australia. Available online: www.ga.gov.au/scientific-topics/energy/province-sedimentary-basin-geology/petroleum/offshore-southern-australia/otway (accessed on 11 January 2019).
  35. Cande, S.C.; Mutter, J.C. A revised identification of the oldest sea-floor spreading anomalies between Australia and Antarctica. Earth Planet. Sci. Lett. 1982, 58, 151–160. [Google Scholar] [CrossRef]
  36. Woollands, M.A.; Wong, D. Petroleum Atlas of Victoria, Australia; Department of Natural Resources and Environment: Palmerston, Australia, 2001.
  37. Morton, J.G.G.; Hill, A.J.; Parker, G.; Tabassi, A. Towards a unified stratigraphy for the Otway Basin. In Proceedings of the NGMA/Petroleum Exploration Society of Australia Otway Basin Symposium, Melbourne, Australia, 20 April 1994. [Google Scholar]
  38. Buffin, A.J. Waarre sandstone development within the Port Campbell Embayment. APPEA J. 1989, 29, 299–311. [Google Scholar] [CrossRef]
  39. Hawkins, P.J.; Dellenbach, J. A Review of the Otway Basin; Reynolds, M.A., Ed.; Bureau of Mineral Resources: Canberra, Australia, 1971; pp. 7–22.
  40. Morgan, R.P. Palynology review of selected oil drilling. Otway Basin, South Australia, for Ultramar Australia. Aust. Morgan Palaeo Assoc. 1985. Unpublished. [Google Scholar]
  41. Morton, J.G.G. Revisions to stratigraphic nomenclature of the Otway Basin, South Australia. In Quarterly Geological Notes/Issued by the Geological Survey of South Australia; Parkside: Auckland, New Zealand, 1990. [Google Scholar]
  42. White, M.R. Micropalaeontological analysis of 26 petroleum wells in the Gambier Basin, South Australia. South Aust. Dep. Mines Energy Rep. Book 1995, 95, 6. [Google Scholar]
  43. O’Brien, G.W.; Thomas, J.H. A Technical Assessment of the Yet-to-Find Hydrocarbon Resource Inventory, Offshore & Onshore Otway Basin, Victoria, Australia; Department of Primary Industries: New South Wales, Australia, 2007.
  44. Dance, T. Personal Communication; CSIRO: Canberra, Australia, 2017. [Google Scholar]
  45. Knackstedt, M.; Saadatfarm, M.; Herring, A.; Turner, M.; Sok, R.; Deakin, L.; Knuefing, L.; Eric Oren, P.; Ruspini, L. Multiphase flooding dynamics of Otway core. Phase 1. Cooperative Research Centre for Greenhouse Gas Technologies, Melbourne, Australia, CO2CRC Report No: RPT18-5867; CO2CRC Limited: Carlton, Australia, 2018. [Google Scholar]
  46. Kaldi, J.; Daniel, R.; Tenthorey, E.; Michael, K.; Schacht, U.; Nicol, A.; Underchultz, J.; Backe, G. Caprock Systems for CO2 Geological Storage; Report No.: 2011/01; IEAGHG: Cheltenham, UK, 2011. [Google Scholar]
  47. Higgs, K.E.; Haese, R.R.; Golding, S.D.; Schacht, U.; Watson, M.N. The Pretty Hill Formation as a natural analogue for CO2 storage: an investigation of mineralogical and isotopic changes associated with sandstones exposed to low, intermediate and high CO2 concentrations over geological time. Chem. Geol. 2015, 399, 36–64. [Google Scholar] [CrossRef]
  48. Ayling, B.; Rose, P.; Petty, S.; Zemach, E.; Drakos, P. QEMSCAN (Quantitative evaluation of minerals by scanning electron microscopy): Capability and application to fracture characterization in geothermal systems. In Proceedings of the 37th Workshop on Geothermal Reservoir Engineering, Stanford, CA, USA, 30 January–1 February 2012. [Google Scholar]
  49. Schodlok, M.C.; Whitbourn, L.; Huntington, J.; Mason, P.; Green, A.; Berman, M.; Coward, D.; Connor, P.; Wright, W.; Jolivet, M. HyLogger-3, a visible to shortwave and thermal infrared reflectance spectrometer system for drill core logging: functional description. Aust. J. Earth Sci. 2016, 63, 929–940. [Google Scholar]
  50. Huntington, J.; Whitbourn, L.; Mason, P.; Berman, M.; Schodlok, M.C. HyLogging—Voluminous industrial-scale reflectance spectroscopy of the Earth’s subsurface. In Proceedings of the ASD and IEEE GRS; Art, Science and Applications of Reflectance Spectroscopy Symposium, Boulder, CO, USA, 23–25 February 2010. [Google Scholar]
  51. Cudahy, T.J.; Hewson, R.D.; Caccetta, M.; Roache, A.; Whitbourn, L.B.; Connor, P.; Coward, D.; Mason, P.; Yang, K.; Huntington, J.F. Drill core Logging of plagioclase feldspar composition and other minerals associated with Archaean gold mineralisation at Kambalda, Western Australia using a bidirectional thermal infrared reflectance system. In Remote Sensing and Spectral Geology; Society of Economic Geologists: Littleton, CO, USA, 2009; pp. 223–235. [Google Scholar]
  52. Haese, R.R.; Jiang, G.; Ooi, S.; Black, J.R. Enhanced reservoir characterization using hyperspectral core logging. J. Sediment. Res. 2019, 89, 187–198. [Google Scholar] [CrossRef]
  53. Schlumberger. Available online: www.glossary.oilfield.slb.com/en/Terms/e/elemental_capture_spectroscopy.aspx (accessed on 6 March 2019).
  54. Kansas Geological Survey. Available online: http://www.kgs.ku.edu/stratigraphic/KIMELEON/history.html (accessed on 11 January 2019).
  55. Collins, D.R.; Doveton, J.H. Color images of Kansas subsurface geology from well logs. Comput. Geosci. 1986, 12, 519–526. [Google Scholar] [CrossRef]
Figure 1. Location of the CO2CRC’s Otway Research Facility, Otway Basin (modified after Geoscience Australia and CO2CRC Limited).
Geosciences 09 00278 g001
Figure 2. Representative facies logs against measured depth (MD) for wells CRC-3 and CRC-2. The four facies are: delta front, distal mouthbar, proximal mouthbar and distributary channel. The facies marked in red correspond to cemented zones [19,22,44].
Geosciences 09 00278 g002
Figure 3. X-ray images showing the major sedimentary structures observed in the cores between 1535 and 1538 m from CRC-3 well at the CO2CRC’s Otway Research Facility [45]. (a) Cross-bedding; (b) Planar bedding; (c) Massive bedding. Thin laminae of fine grained rock type (light gray) can be identified between more coarse grained rock type (dark gray) in cross beddings (a). The planar bedding (b) consists of a bimodal distribution of finer grain sizes (dark and light gray). The massive bedding (c) is tightly cemented and structureless. Each image measures 25 cm (vertical) and 10 cm (horizontal).
Geosciences 09 00278 g003
Figure 4. Frequency distribution of porosity and permeability values measured for discrete core samples from wells CRC-2 and CRC-3 for each facies.
Geosciences 09 00278 g004
Figure 5. Results from QEMSCAN analysis for samples: (a) #93 (distributary channel); (b) #91 (proximal mouthbar); (c) #81 (distal mouthbar).
Geosciences 09 00278 g005
Figure 6. Proportion of major minerals in: (a) Distributary channel; (b) Proximal mouthbar; (c) Distal mouthbar; (d) Delta front. Box-and-whisker plots show mean (cross within the box), median (bar within the box), 25th and 75th quartile (lower and upper boundary of the box) and lower and upper limit of the data range (ends of the whisker).
Geosciences 09 00278 g006
Figure 7. Modal grain size distribution characteristic of the four facies. Box-and-whisker plot shows mean (cross within the box), median (bar within the box), 25th and 75th quartile (lower and upper boundary of the box) and lower and upper limit of the data range (ends of the whisker).
Geosciences 09 00278 g007
Figure 8. (a) Relative mineral count log as obtained by hyperspectral logging compared with the facies log for the CRC-3 core. The hyperspectral log shows various layers rich in framework (F), clay (Cl) and carbonate (Cb) minerals. The layers rich in clay intercalated within the framework minerals (I) are also shown; (b) Ternary plots showing the relative abundance of the three end member mineral classes in each of the four facies.
Geosciences 09 00278 g008
Figure 9. Colourlith logs for Parasequence-2 of well CRC-2 and CRC-3. The ECS log [24] is matched against the colourlith log and the hues in the two wells are cross correlated.
Geosciences 09 00278 g009
Figure 10. Colourlith logs for Parasequence-1 of wells CRC-2 and CRC-3. The ECS log [24] is matched against the colourlith log and the hues in the two wells are cross correlated.
Geosciences 09 00278 g010
Figure 11. Abundance of the five rock type classes in the four depositional facies.
Geosciences 09 00278 g011
Figure 12. Range of bed thickness of the five rock types in (a) Distributary channel; (b) Proximal mouthbar; (c) Distal mouthbar; (d) Delta front. Box-and-whisker plots show mean (cross within the box), median (bar within the box), 25th and 75th quartile (lower and upper boundary of the box) and lower and upper limit of the data range (ends of the whisker).
Geosciences 09 00278 g012
Table 1. Capillary entry pressures (Pe) calculated from given CO2 column height above the free water level (hFWL) for discrete samples.
Depth (m)1434.71435.31439.71440.21448.61485.41491.41504.51507.71509.9
hFWL (m)40.215.182.7742.1245.315.219.150.210.180.27
Pe (kPa)142.318.59.7149.8160.118.532.10.70.60.9
Table 2. Mean mineral composition and standard deviations the five rock type classes based on QEMSCAN data. The mean is based on the data from 5 samples for rock type 1, 13 samples for rock type 2, 4 samples for rock type 3, 7 samples for rock type 4 and 1 sample for rock type 5.
MineralsRock Type 1Rock Type 2Rock Type 3Rock Type 4Rock Type 5
MeanSDMeanSDMeanSDMeanSDMeanSD
Quartz0.7838.13%0.72016.24%0.527513.50%0.35085.29%0.69170.00%
Alkali Feldspar0.0763.40%0.06541.01%0.05910.57%0.06911.53%0.05120.00%
Kaolinite0.04151.52%0.04661.67%0.12377.04%0.15393.19%0.03310.00%
Smectites0.03342.51%0.0452.36%0.10143.74%0.13682.83%0.01450.00%
Chlorite0.02330.89%0.05152.64%0.05990.19%0.091.51%0.01440.00%
Illite0.00860.57%0.02140.65%0.04371.98%0.08241.37%0.00990.00%
Magnesite0.0060.32%0.00560.27%0.00980.33%0.0180.99%0.01720.00%
Siderite0.00010.01%0.00110.23%0.0010.06%0.00390.51%0.00010.00%
Ankerite0.00190.23%0.00130.46%00.00%00.00%0.09920.00%
Calcite00.00%00.01%00.00%00.00%0.00080.00%
Dolomite0.00040.04%0.00030.09%00.00%00.00%0.02060.00%
Plagioclase0.01210.45%0.01950.64%0.02620.60%0.02540.60%0.01860.00%
Muscovite0.0090.69%0.01270.50%0.03212.21%0.05171.69%0.01080.00%
Pyrite0.00260.16%0.00140.10%0.00941.33%0.01381.55%0.00010.00%
Pyrophyllite0.00070.04%0.00040.03%0.00160.08%0.00090.03%0.00040.00%
Ilmenite0.00060.06%0.00250.10%0.00140.09%0.00060.01%0.00610.00%
Rutile0.00060.04%0.00290.11%0.00280.06%0.00230.03%0.00710.00%
Zircon0.00020.01%0.00230.36%0.00060.03%0.00040.01%0.00420.00%
Table 3. The five rock type classes along with the defining criteria of flow properties, mineral compositions and grain size distribution. # gives the number of samples used for analysis of the respective property. Carbonate mineral % has been derived from hyperspectral analysis while clay mineral % and modal grain size class have been derived from QEMSCAN analysis.
Rock Type NamePorosity Range (fraction)Permeability Range (mD)Bulk Carbonate Content (%)Mean Bulk Clay Content (%)Most Recurring Modal Grain Size Range (mm)Capillary Entry Pressure (Pa)
Coarse sandstone>0.25 (#21)>1000 (#21)<5 (#21)5–20 (#5)0.40–0.45 (#5)100–1000
Fine sandstone>0.25 (#23)100-1000 (#23)<5 (#23)10–30 (#13)0.08–0.09 (#13)100–1000
Siltstone<0.25 (#5)10–100 (#5)<5 (#5)25–60 (#4)<0.01 (#4)1000–10000
Mudstone<0.25 (#21)<10 (#21)<5 (#21)40–60 (#7)<0.01 (#7)1000–10000
Carbonate-cemented sandstone<0.25 (#10)<10 (#10)>5 (#10)<10 (#1)0.07-0.08 (#1)10000–160000

