Article

Undrained Cyclic Laboratory Behavior of Sandy Soils

by
Francesco Castelli
1,
Antonio Cavallaro
2,
Salvatore Grasso
3,* and
Valentina Lentini
1
1
Faculty of Engineering and Architecture, University of Enna “Kore”, 94100 Enna, Italy
2
National Research Council (CNR), Institute of Cultural Heritage Sciences (ISPC), 95124 Catania, Italy
3
Department of Civil Engineering and Architecture, University of Catania, 95123 Catania, Italy
*
Author to whom correspondence should be addressed.
Geosciences 2019, 9(12), 512; https://doi.org/10.3390/geosciences9120512
Submission received: 1 August 2019 / Revised: 25 November 2019 / Accepted: 2 December 2019 / Published: 11 December 2019

Abstract

:
The complex cyclic shear stress path experienced by the soil during an earthquake, which could also induce liquefaction phenomena, can be approximated in the laboratory only by using sophisticated testing apparatuses. Cyclic triaxial tests have been widely used, especially for coarse grained soils, as in this study. In the framework of the design for the seismic retrofitting of the ‘‘Ritiro viaduct’’ foundations along the A20 motorway connecting Messina with Palermo (Italy), a soil liquefaction study was also carried out. With this aim, a detailed geological and geotechnical characterization of the area was performed by in situ and laboratory tests, including seismic dilatometer Marchetti tests (SDMTs), the combined resonant column (RCT) and cyclic loading torsional shear tests (CLTSTs), and undrained cyclic loading triaxial tests (CLTxTs). In particular, the paper presents the results of cyclic triaxial tests carried out on isotropically consolidated specimens of a sandy soil. The seismic retrofitting works include the reinforcement of the foundation and replacement of the decks with newly designed type and structural schemes, mixed steel, and concrete with continuous girder. During the investigation, data were acquired for the characterization of materials, for the definition of degradation phenomena with the relative identification of possible causes, and for the estimation of the residual performance characteristics of the building. The structural campaign of investigations necessary to determine all of the key parameters useful for a correct definition of the residual performance capabilities of the work was divided into two phases: One in situ and one in the laboratory.

1. Introduction

The present program of in situ investigations and laboratory tests originates from the static and seismic retrofitting works of the "Ritiro viaduct". The "Ritiro viaduct" (Figure 1), of the A20 Messina-Palermo (Italy) motorway, represents a vital node for the viability of Messina, the main connection to the motorway junctions. The works include the reinforcement of the foundations and replacement of the decks with newly designed type and structural schemes, mixed steel, and concrete with continuous girder.
During the investigation program, data were acquired for the characterization of materials, for the definition of degradation phenomena with the relative identification of possible causes, and for the estimation of the residual performance characteristics of the building. The structural campaign of investigations necessary to determine all of the parameters useful for a correct definition of the residual performance capabilities of the work has been useful to design the retrofitting works.
The campaign phase, in order to obtain as much data as possible without being extremely invasive towards the structural elements, was articulated through the execution of semi-destructive tests, such as the removal of concrete carrots, and non-destructive tests by means of execution of sclerometric tests, of pull-out with post-inserted grafts and in situ micro-seismic reliefs.
The area of the "Ritiro viaduct" was influenced by liquefaction phenomena during the 28 December 1908 Messina and Reggio Calabria historical earthquake. The evaluation of the liquefaction potential during earthquakes is an important subject in seismically active regions.
After the Niigata earthquake in 1964, which caused a lot of damage due to liquefaction, several studies [1,2,3,4,5,6,7,8,9] were performed in order to understand the cyclic behavior of sands.
During liquefaction, granular cohesionless saturated soil (gravel, sand, and low plasticity silt) loses its strength for a short interval of time, but long enough to cause significant failures. The liquefaction effects are usually evident on the ground surface (sand boils, large deformation, or fracture of the ground, etc.). The liquefaction susceptibility of soil deposits may be estimated by comparison between resistance profiles (i.e., Standard Penetration Test (SPT) blow count or Cone Penetration Test (CPT) tip resistance with depth) and critical values or estimation of a liquefaction safety factor (as a ratio of liquefaction resistance and action) function of depth.
The liquefaction potential can be obtained using either an estimation based on the maximum acceleration at the ground surface by a semi-empirical equation, or a dynamic calculation, including the reduction of soil stiffness due to built-up of pore pressure. Alternatively, the liquefaction resistance can be assessed by cyclic undrained laboratory tests on undisturbed or reconstituted specimens [10,11,12] or from correlations with the resistance measured by in situ tests (i.e., SPT or CPT).
In order to study the possible amplification phenomena of the "Ritiro viaduct" site, a comprehensive laboratory and in situ investigation was carried out to obtain a soil profile, with special attention being paid to the variation of the shear modulus (G) and damping ratio (D) with depth. This paper tries to summarize this information in a comprehensive way in order to provide a case record of site characterization for seismic response analysis.

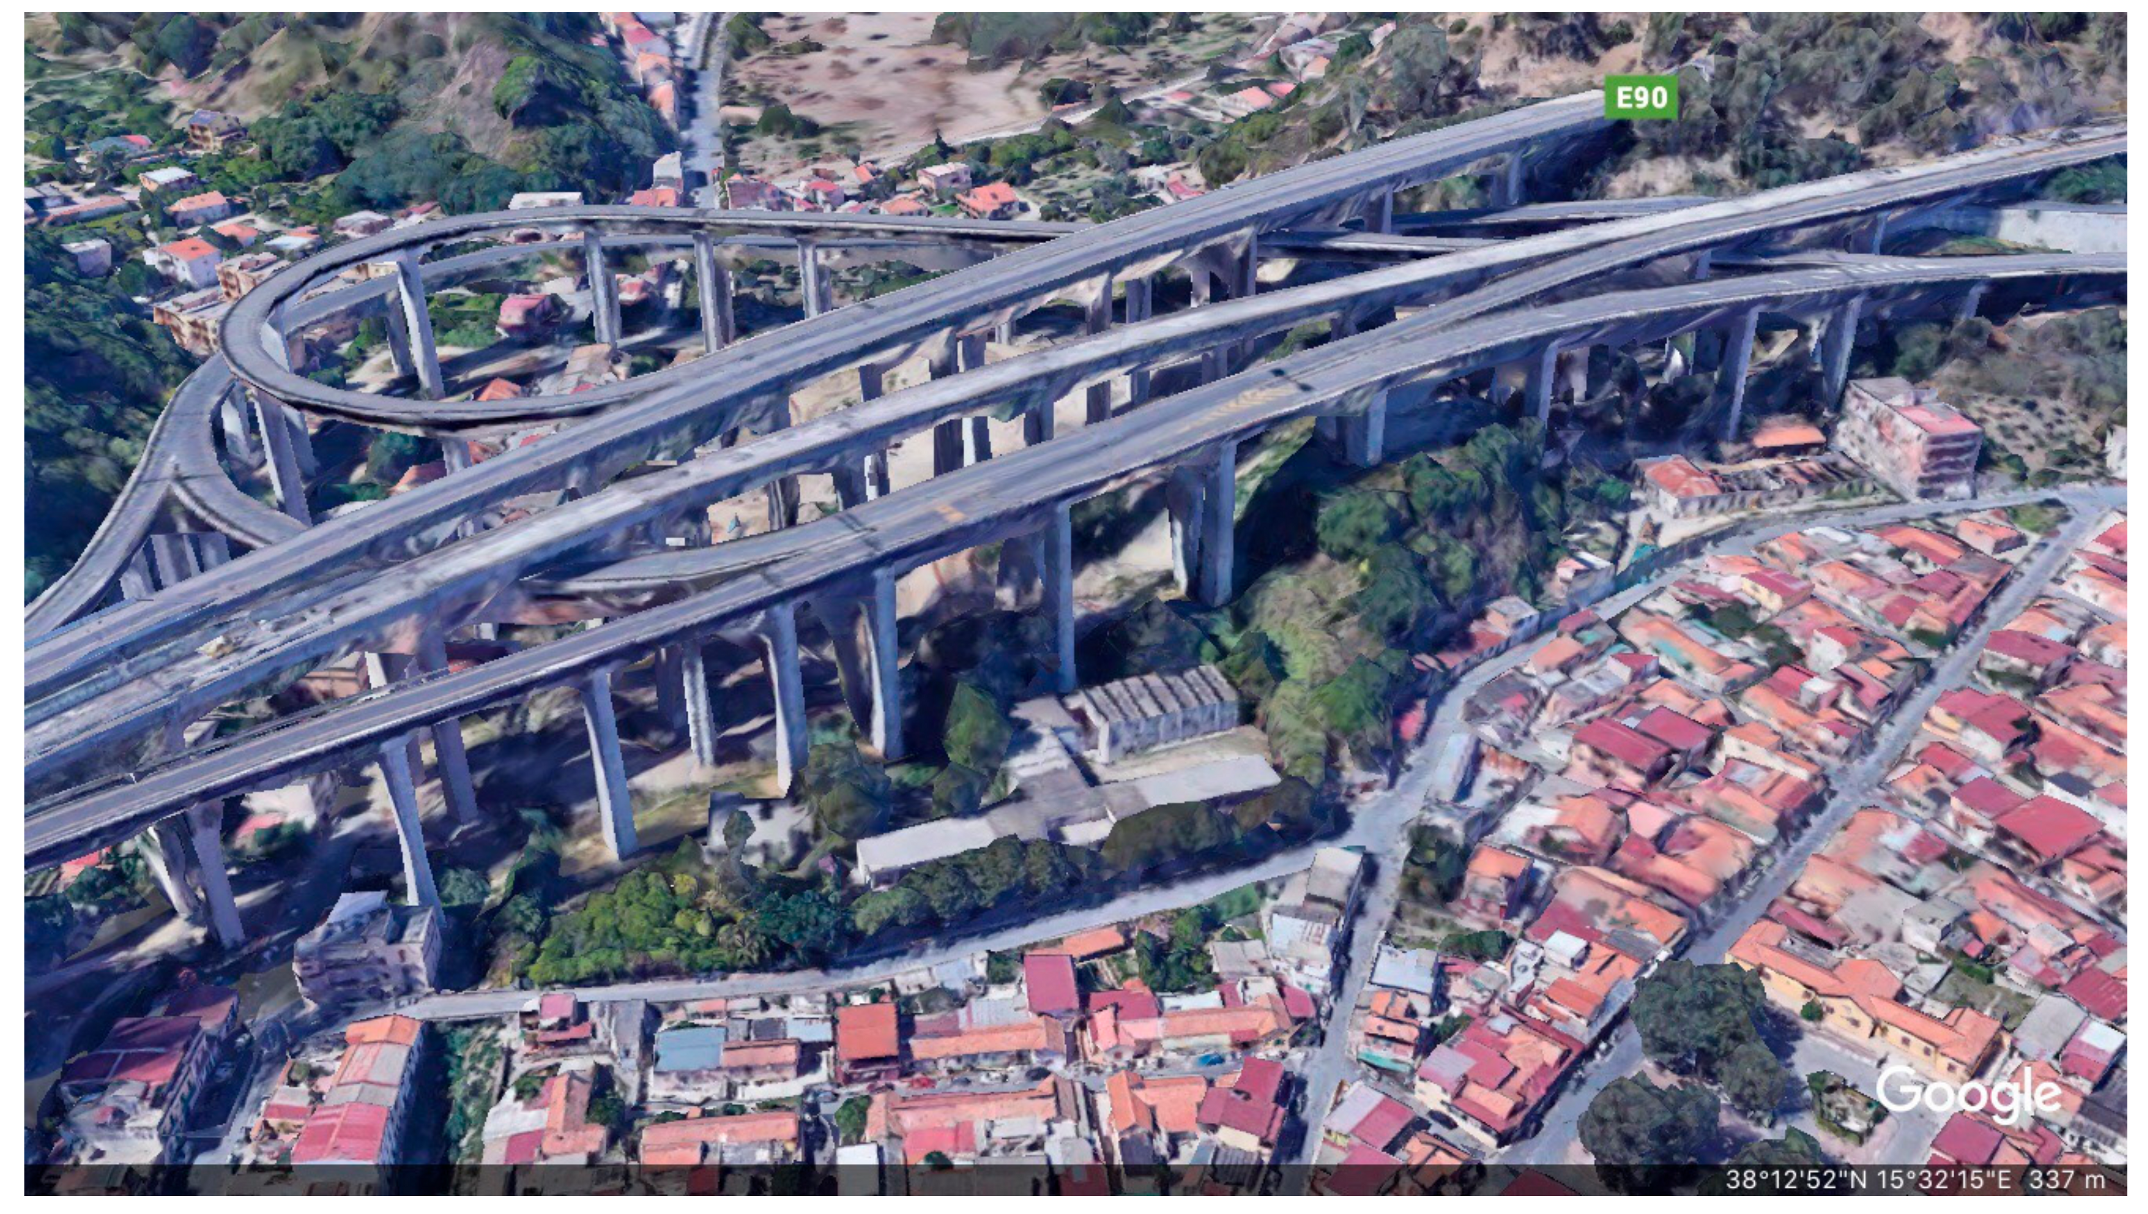
2. Geology and Seismicity of the Area

In Italy, recent strong earthquakes include the earthquake in central Italy that occurred on 24 August 2016 [13], the Emilia Romagna earthquake that occurred on 29 May 2012 [14,15,16], the L’Aquila earthquake that occurred on 6 April 2009 [17,18], the San Giuliano di Puglia earthquake that occurred on 31 October 2002 [19], the Umbria–Marche earthquake sequence of September–October 1997 [20], and the Catania earthquake that occurred on 13 December 1990 in southeastern Sicily.
The area under study is placed in the northeastern part of Sicily (Italy), at about 5 km from Messina old town. An example of its geological features is shown in Figure 2.
The area is covered by metamorphic complex in facies, with pan-African relicts in facies of granulitic deposits. The Messina Strait is located in the middle of the Calabrian Arc, one of the most seismically active areas of the Italian region and of the entire Mediterranean basin. The Strait’s area itself has been struck several times in the past, though not with the same violence as in 1908.
Among Italian regions, Sicily is one of the most seismically active areas. In the past, strong earthquakes occurred in southeastern Sicily (1169, 1693) and in northeastern Sicily (1908). The MW 7.1, 28 December 1908, Messina Straits earthquake (Figure 3) was the deadliest earthquake in recent European history, and also one of the first to be investigated with modern instrumental data [21]. The shaking was distinctly felt in Albania, Montenegro, and the Greek Ionian islands, about 400 km to the east and northeast of the Strait; and in Malta, about 250 km to the south. The earthquake was catastrophic in the epicentral area and was immediately followed by fires and by a large tsunami. Messina and Reggio Calabria were almost completely destroyed, buildings were severely damaged (Figure 3) over an area in excess of 6000 km2 [21], and liquefaction phenomena occurred in the area.
According to [22] and [23] the main events reported in the historical catalogues and measured by Mercalli- Cancani- Sieberg scale (MCS) start around 91 BC (Reggio Calabria, IX–X MCS), 17 AD (Reggio Calabria, VIII–IX MCS), 361–363 (Messina Strait, X MCS), 853 (Messina, IX–X MCS), 1172 (Messina, VIII MCS), 1494 (Messina, VII–VIII MCS), 1509 sequence (area of Reggio Calabria, VIII MCS), 1659 (Southern Calabria, X MCS), 1783 sequence (Southwestern Calabria, X–XI MCS), 1894 (Southern Calabria, IX MCS), 1905 (Southwestern Calabria, XI MCS), and 1907 (Southern Calabria, VIII–IX MCS).
Figure 2. Geological synthesis of Messina area [24].
Geosciences 09 00512 g002
Figure 3. Messina Strait region with the 1908 earthquake epicenter and shocked localities with different colors according to Mercalli-Cancani-Sieberb scale [25].
Geosciences 09 00512 g003
As well known, the characteristics of soil shaking are strongly influenced by local geological, geomorphological, and geotechnical conditions. These can modify significantly the amplitude, frequency, and duration of the seismic motion corresponding to the seismic hazard with reference to outcropping bedrock with horizontal topographical surface.
To this aim, seismic microzonation defines the local seismic hazard through the identification of zones characterized by homogeneous seismic behavior that also includes the earthquake-induced effects, such as the slope instability, liquefaction in saturated granular soil, etc.
According to the Italian Guidelines for the Seismic Microzonation of the Department of Civil Defence, it is possible to distinguish three susceptibility classes: (1) Stable zones where no local effects occur (outcropping bedrock with a low steep morphological surface–slope angle\15°); (2) stable zones but susceptible of local seismic amplification, where seismic input motion amplifications are expected, as a result of the local litho-stratigraphic and morphological structure; (3) unstable zones, where the expected seismic effects can be attributed to irreversible soil deformations (slope instability, liquefaction, etc.).
A zoom of the Seismic Microzonation map of the area, and particularly of the “Ritiro Viaduct”, is shown in Figure 4. In the map, the zones identified as homogeneous are characterized by similar parameters as lithological and litho-technical characteristics, depth of bedrock, geomorphological conditions, etc. The area of the “Ritiro Viaduct” is within the local amplification stable zones (Zone 0, Zone 1, and Zone 5) of the Messina microzonation map.
Therefore the seismicity that affected the area, but also the effects induced by earthquakes [26,27], constitute a hazard that should not be ignored in the design or in the seismic retrofitting works of infrastructure.

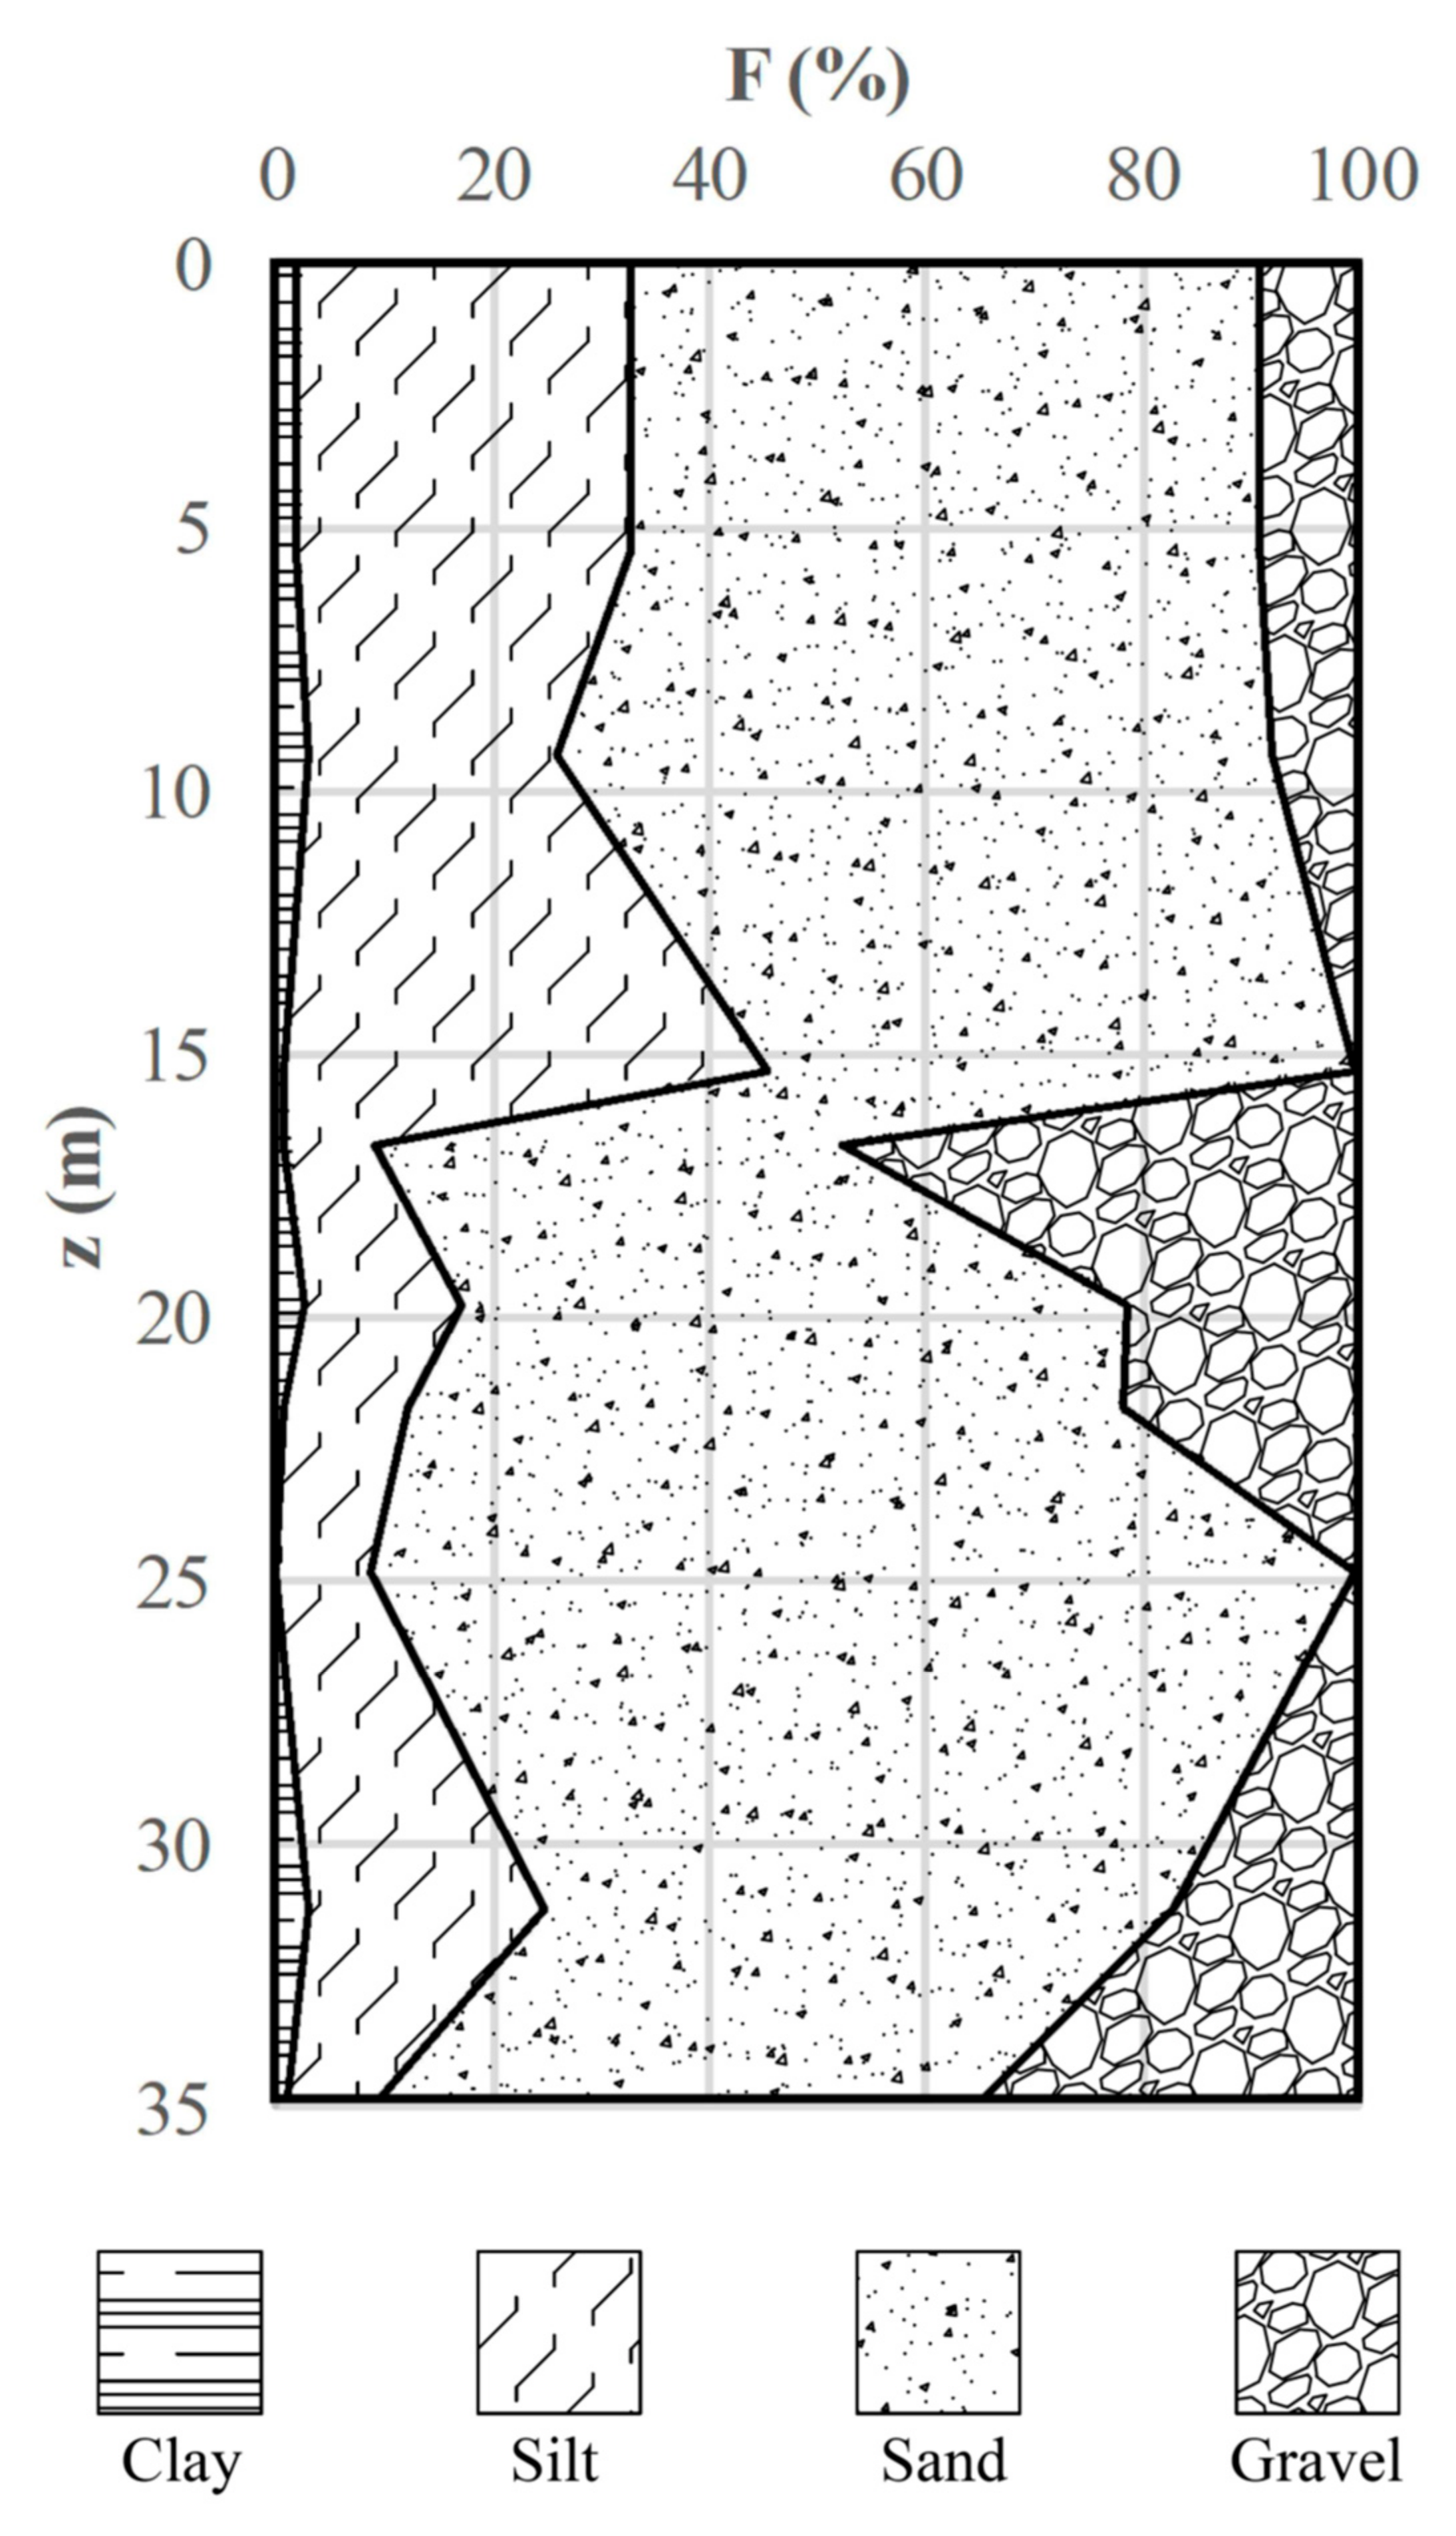
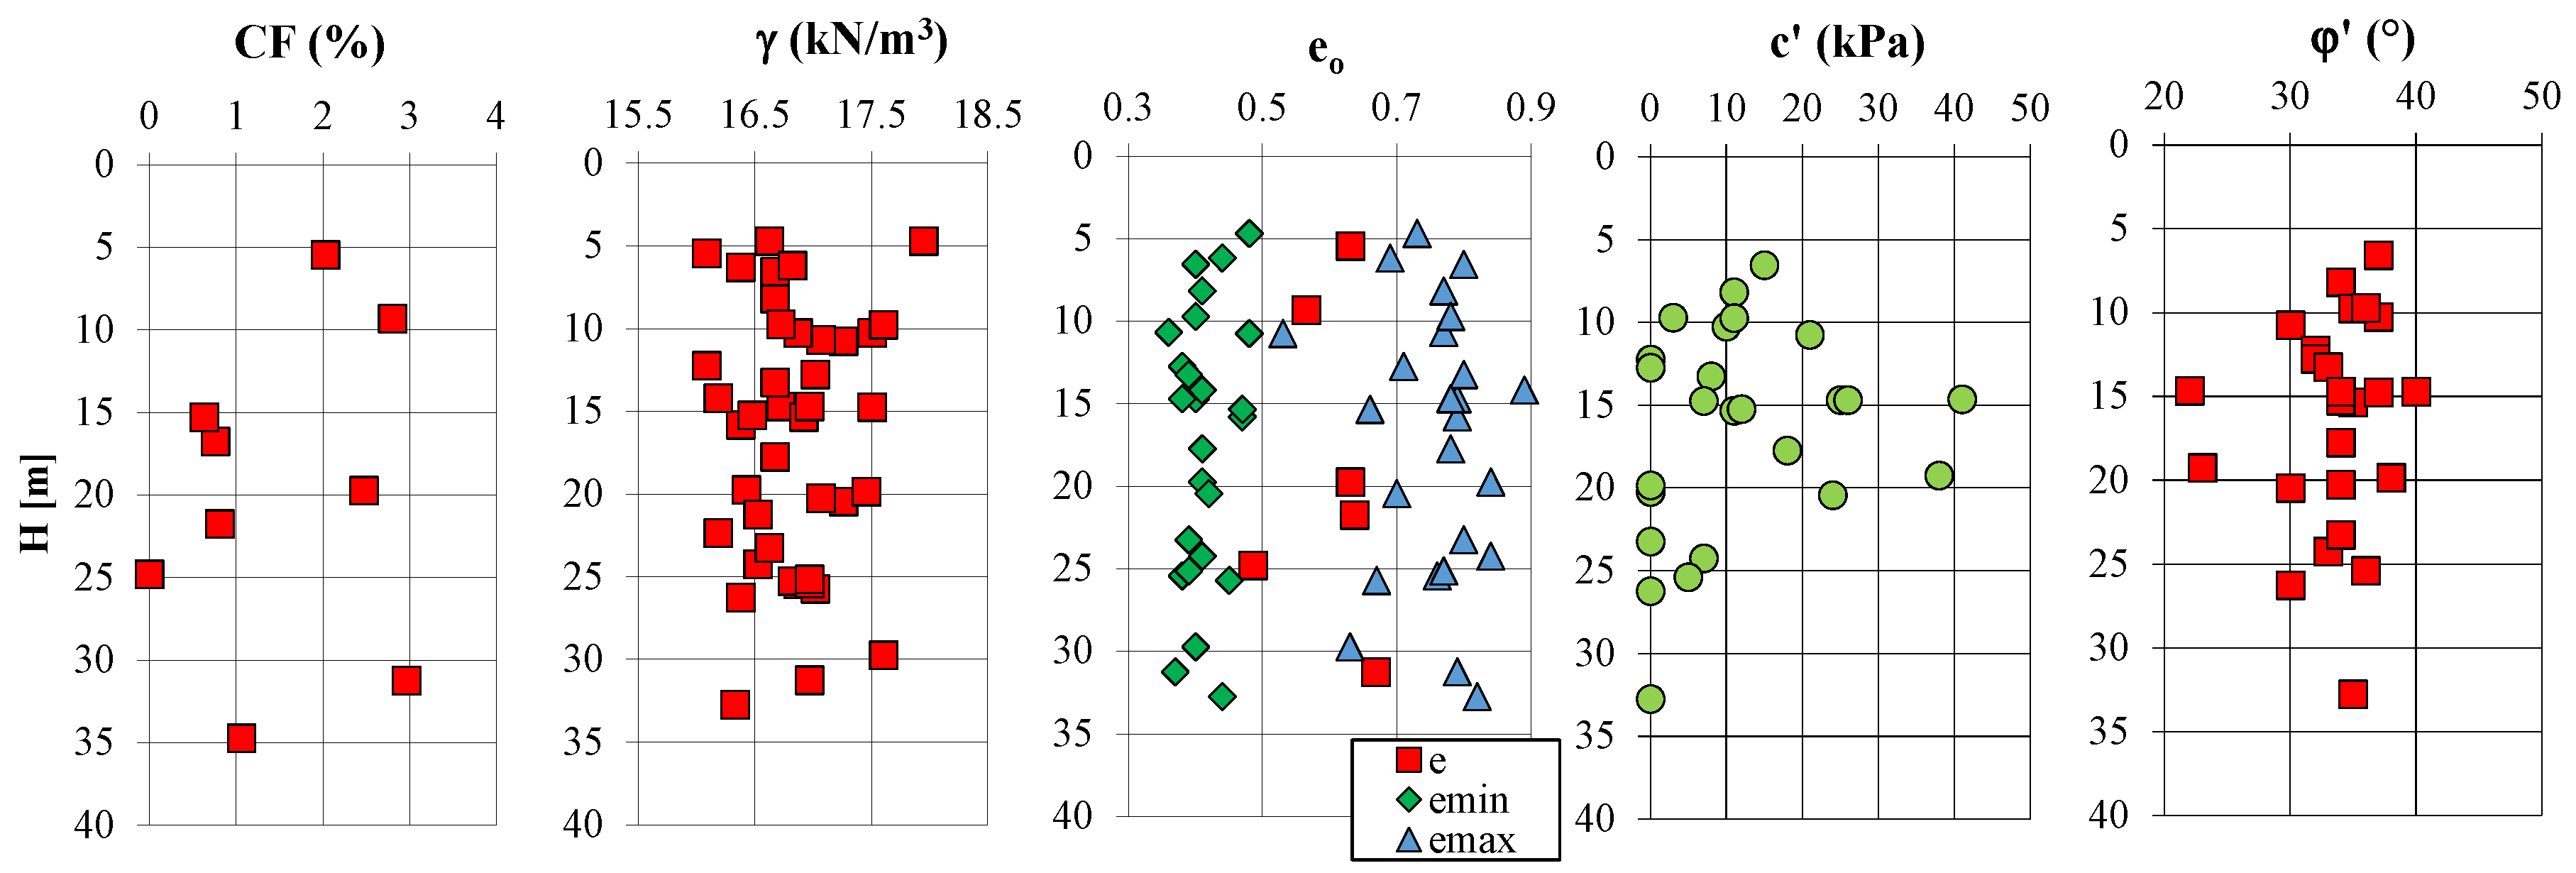
3. Site Characterization Program and Basic Geotechnical Soil Properties

The site investigation was performed within the area of the "Ritiro viaduct" and reached a maximum depth of 35.00 m. Laboratory tests were performed on nine disturbed samples retrieved by means of a 101 mm tube sampler. To evaluate the geotechnical characteristics, the following in situ and laboratory tests were performed in the foundation soil located in the area of the "Ritiro viaduct": 28 Boreholes, 7 seismic dilatometer Marchetti tests (SDMTs) [28,29,30,31]; 9 particle size analysis, 25 direct shear tests (DST), 1 undrained triaxial test (UTxT), 8 cyclic loading torsional shear tests (CLTSTs) [32,33], 8 resonant column tests (RCTs) [34,35,36], and 3 cyclic loading triaxial tests (CLTxTs). The investigation program follows the approach and the methodology used in other test sites in the seismic areas of Catania and Messina [37,38,39,40,41]. On the basis of laboratory tests, the "Ritiro viaduct" deposits mainly consist of a normal consolidated grey/dark grey or dark brown sand with silty gravel or gravelly silt.
The results obtained by particle size analysis are shown in Figure 5 and Table 1. In Table 1, the soil samples were divided into Type A and Type B according to the depth and the presence of minor or major gravel. The uniformity coefficient (Cu), defined as the ratio of D60 to D10, varies in the range of 5.48–52.24 and it points out the considerable non-homogeneity of the particle size. The maximum dry density was evaluated using a vibrating table, available at the geotechnical laboratory of the University Kore of Enna, according to ASTM (4253-83) standard.
Physical parameters were derived from standard classification tests performed on the samples retrieved by geotechnical survey. The values of soil unit weight and the minimum (emin) and maximum (emax) void ratios are summarized in Table 2. Most of the samples are coarse-grained soils, classifiable as silty sands to gravelly sands, showing a lower percentage of clayey material.
The value of the natural moisture content wn prevalently ranges from between 22 to 35% (Figure 6). Characteristic values of strength parameters are (cohesion) c’ = 5–24 kPa and (angle of shear resistance)’ = 23–40°, obtained by direct shear test, (undrained cohesion) cu = 228 kPa obtained by a undrained triaxial test performed on a cohesive sample, with a water content of 17%, retrieved at the depth of 14.65 m; Gs (specific gravity) ranged between 2.65 and 2.75, while eo ranged between 0.29 and 0.67 (Table 2). Another stratum with a water content of 12% was found at the depth of about 19.25 m. Figure 6 shows index properties of the "Ritiro viaduct" area.

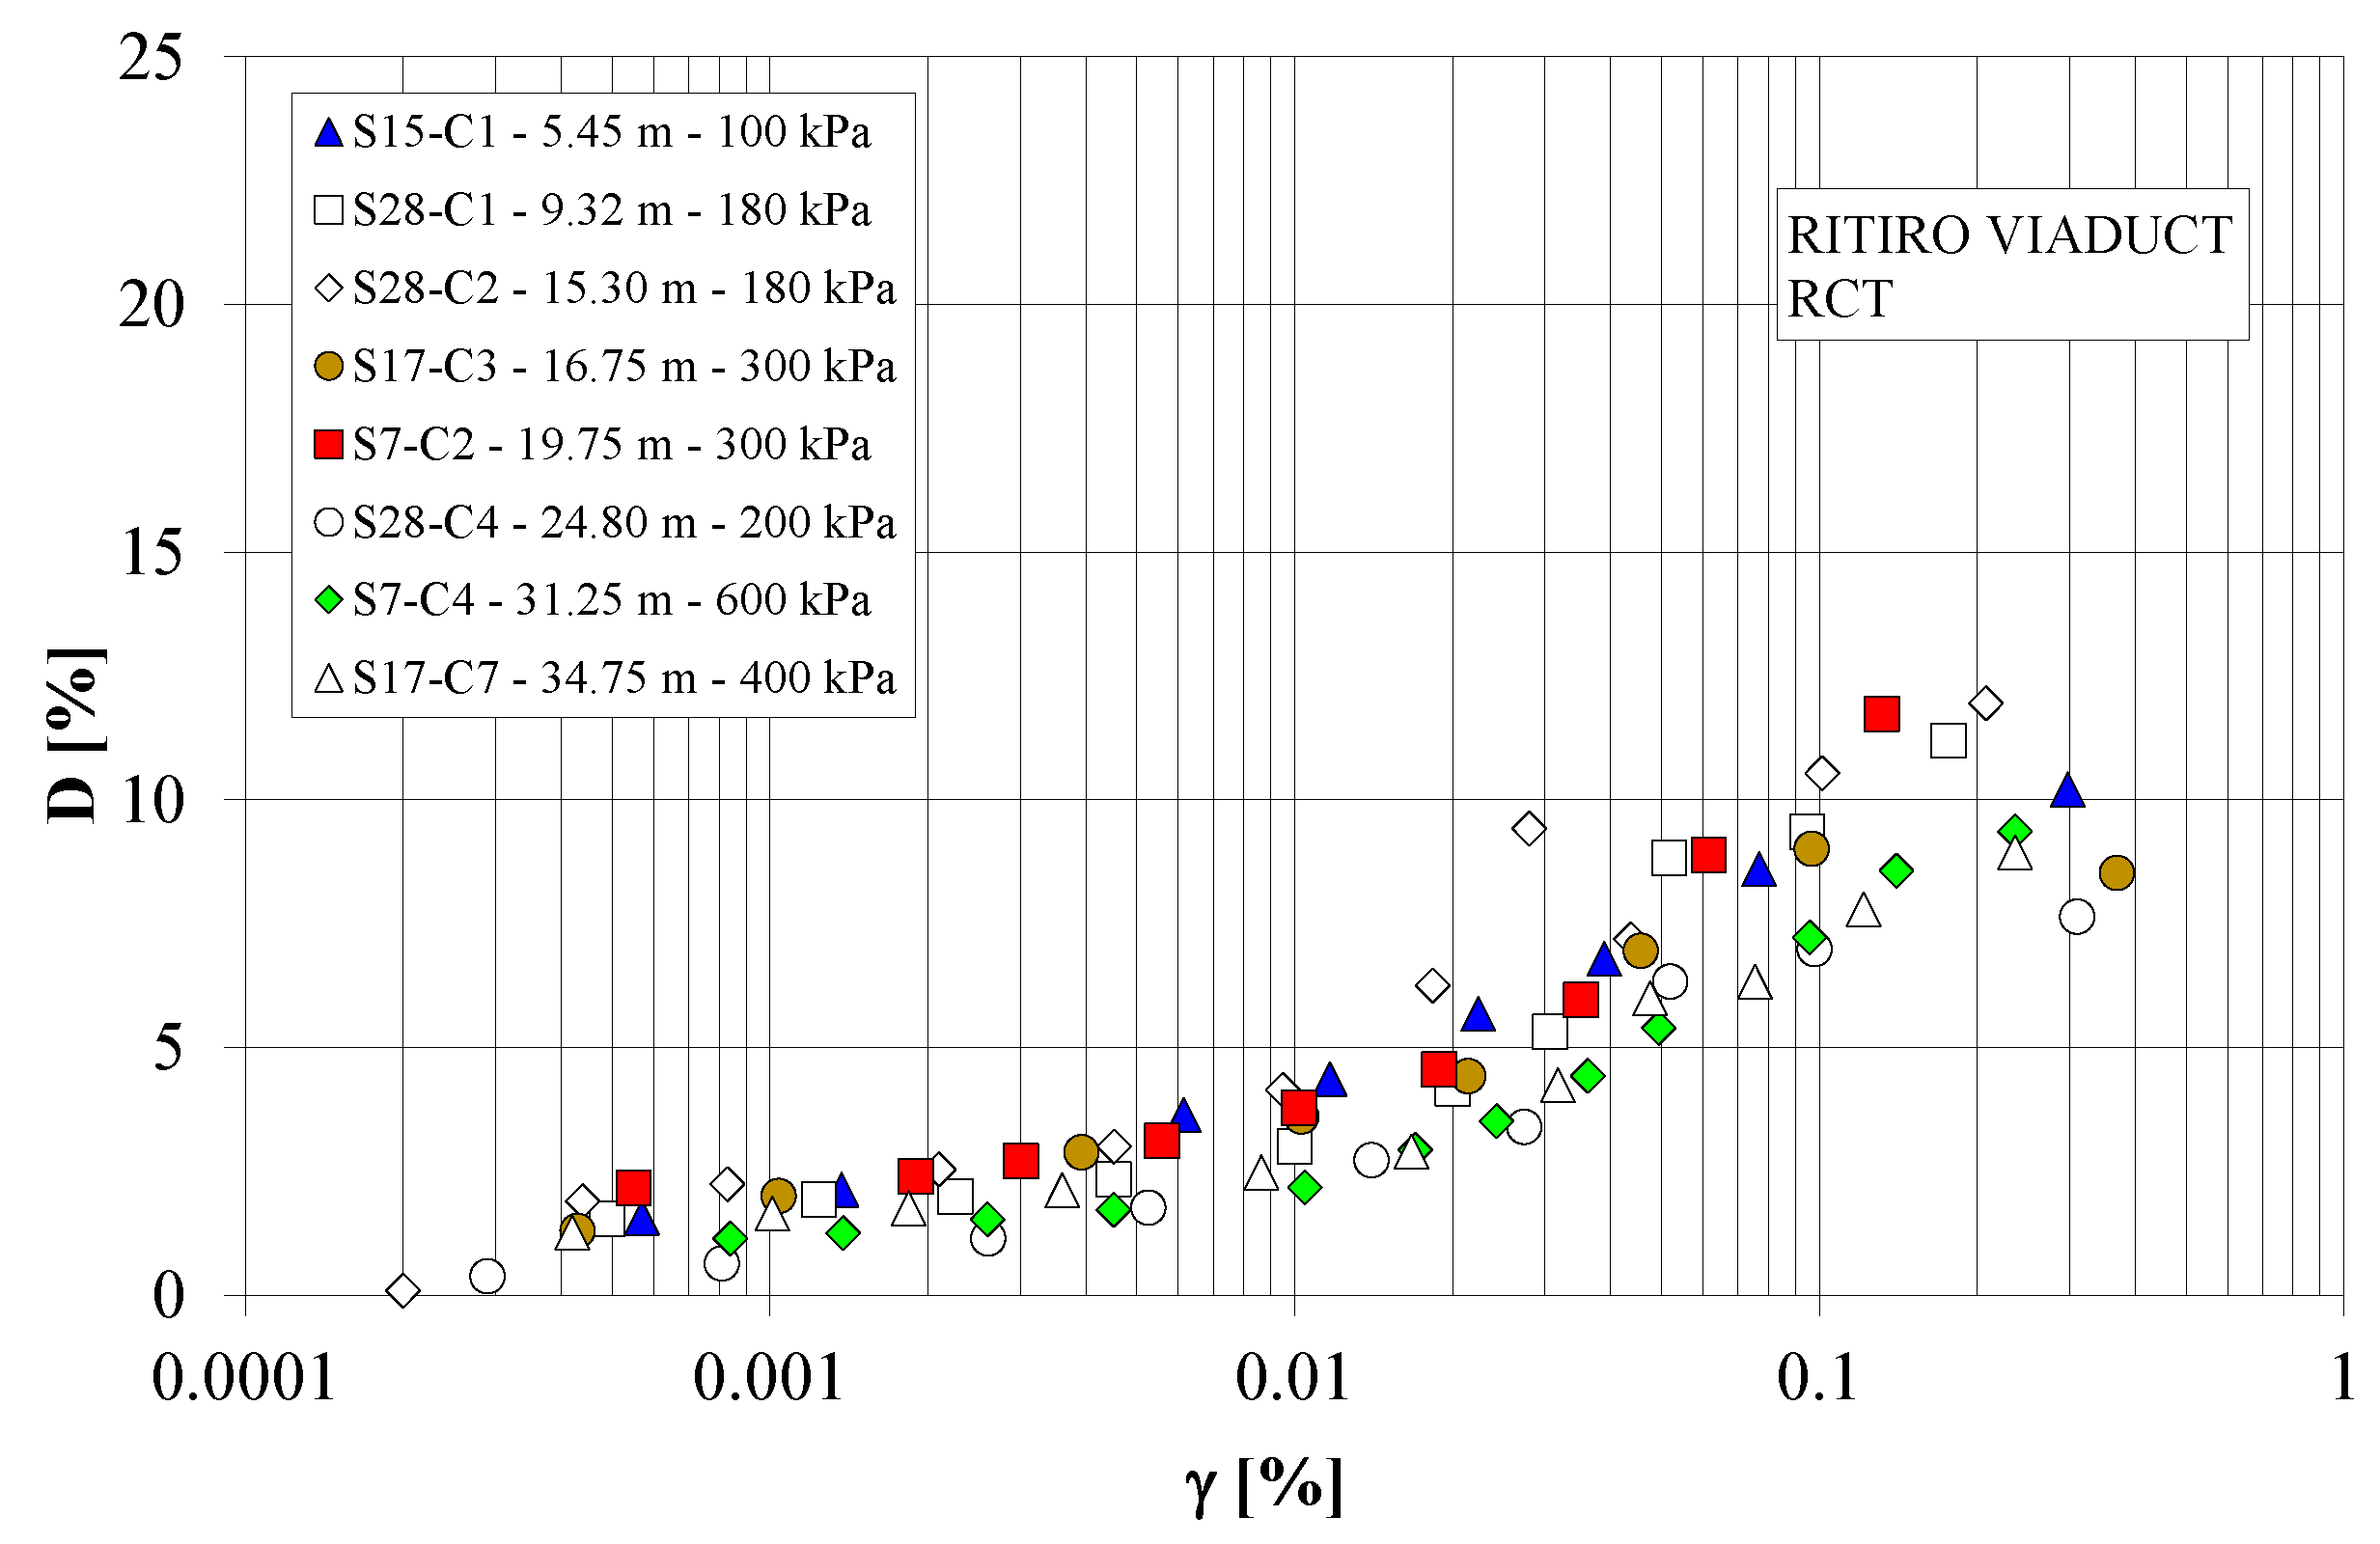
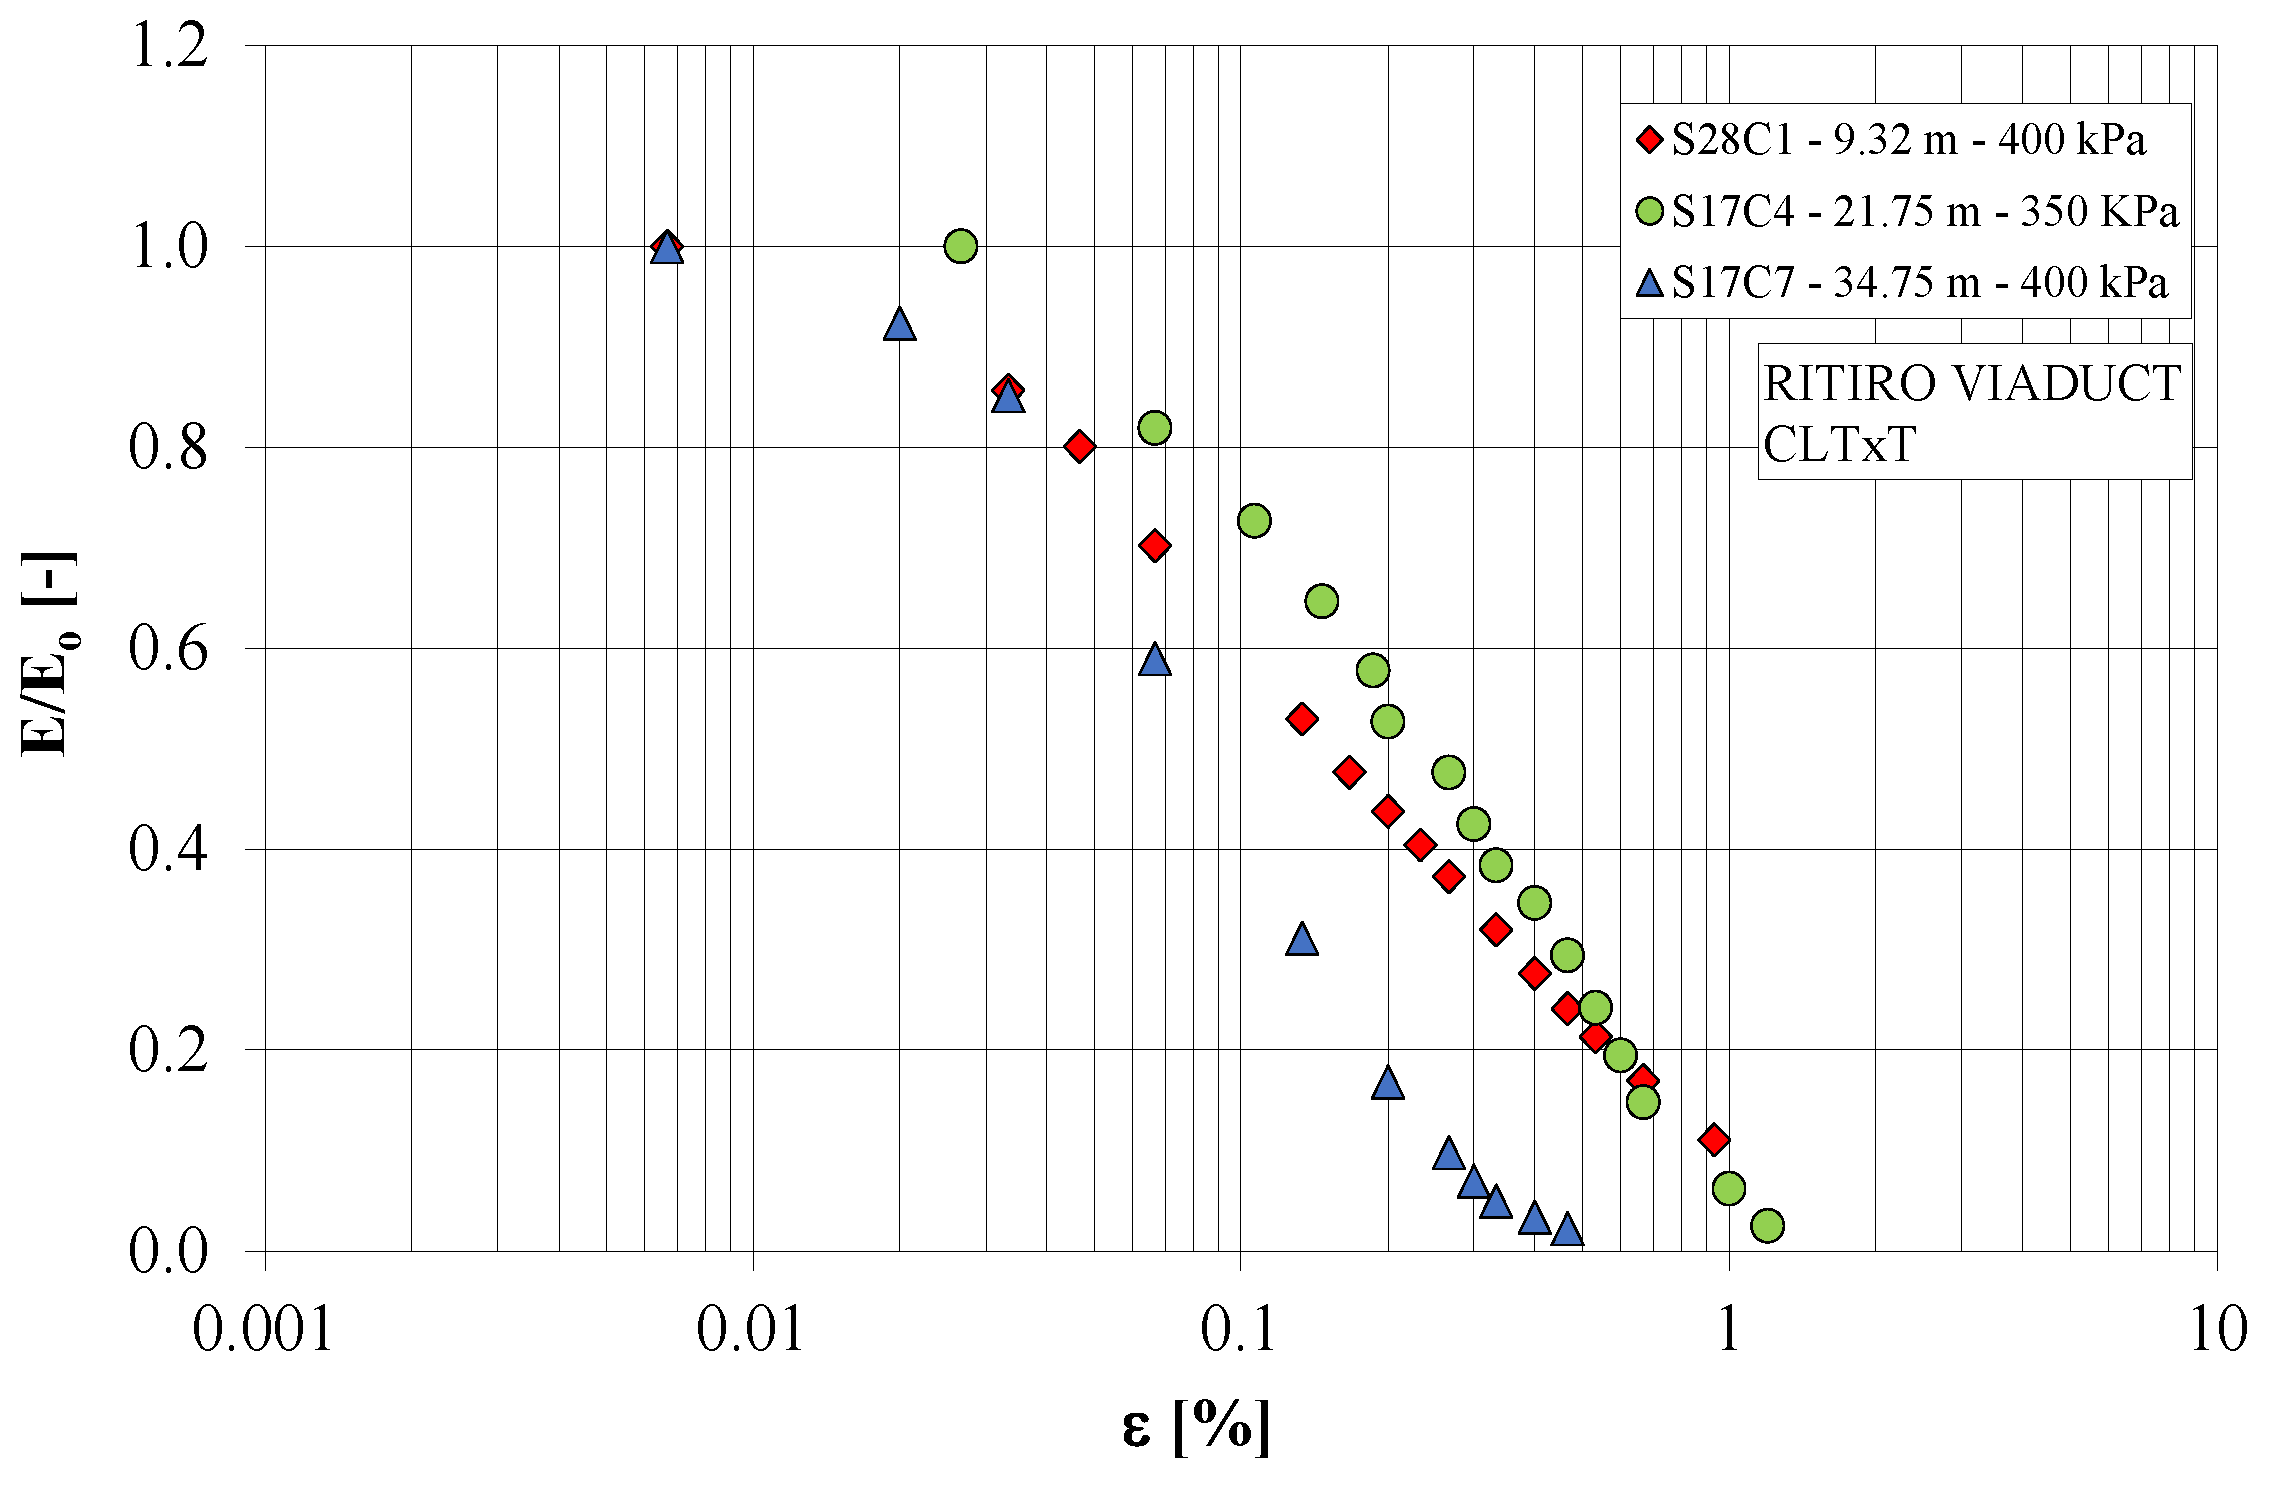
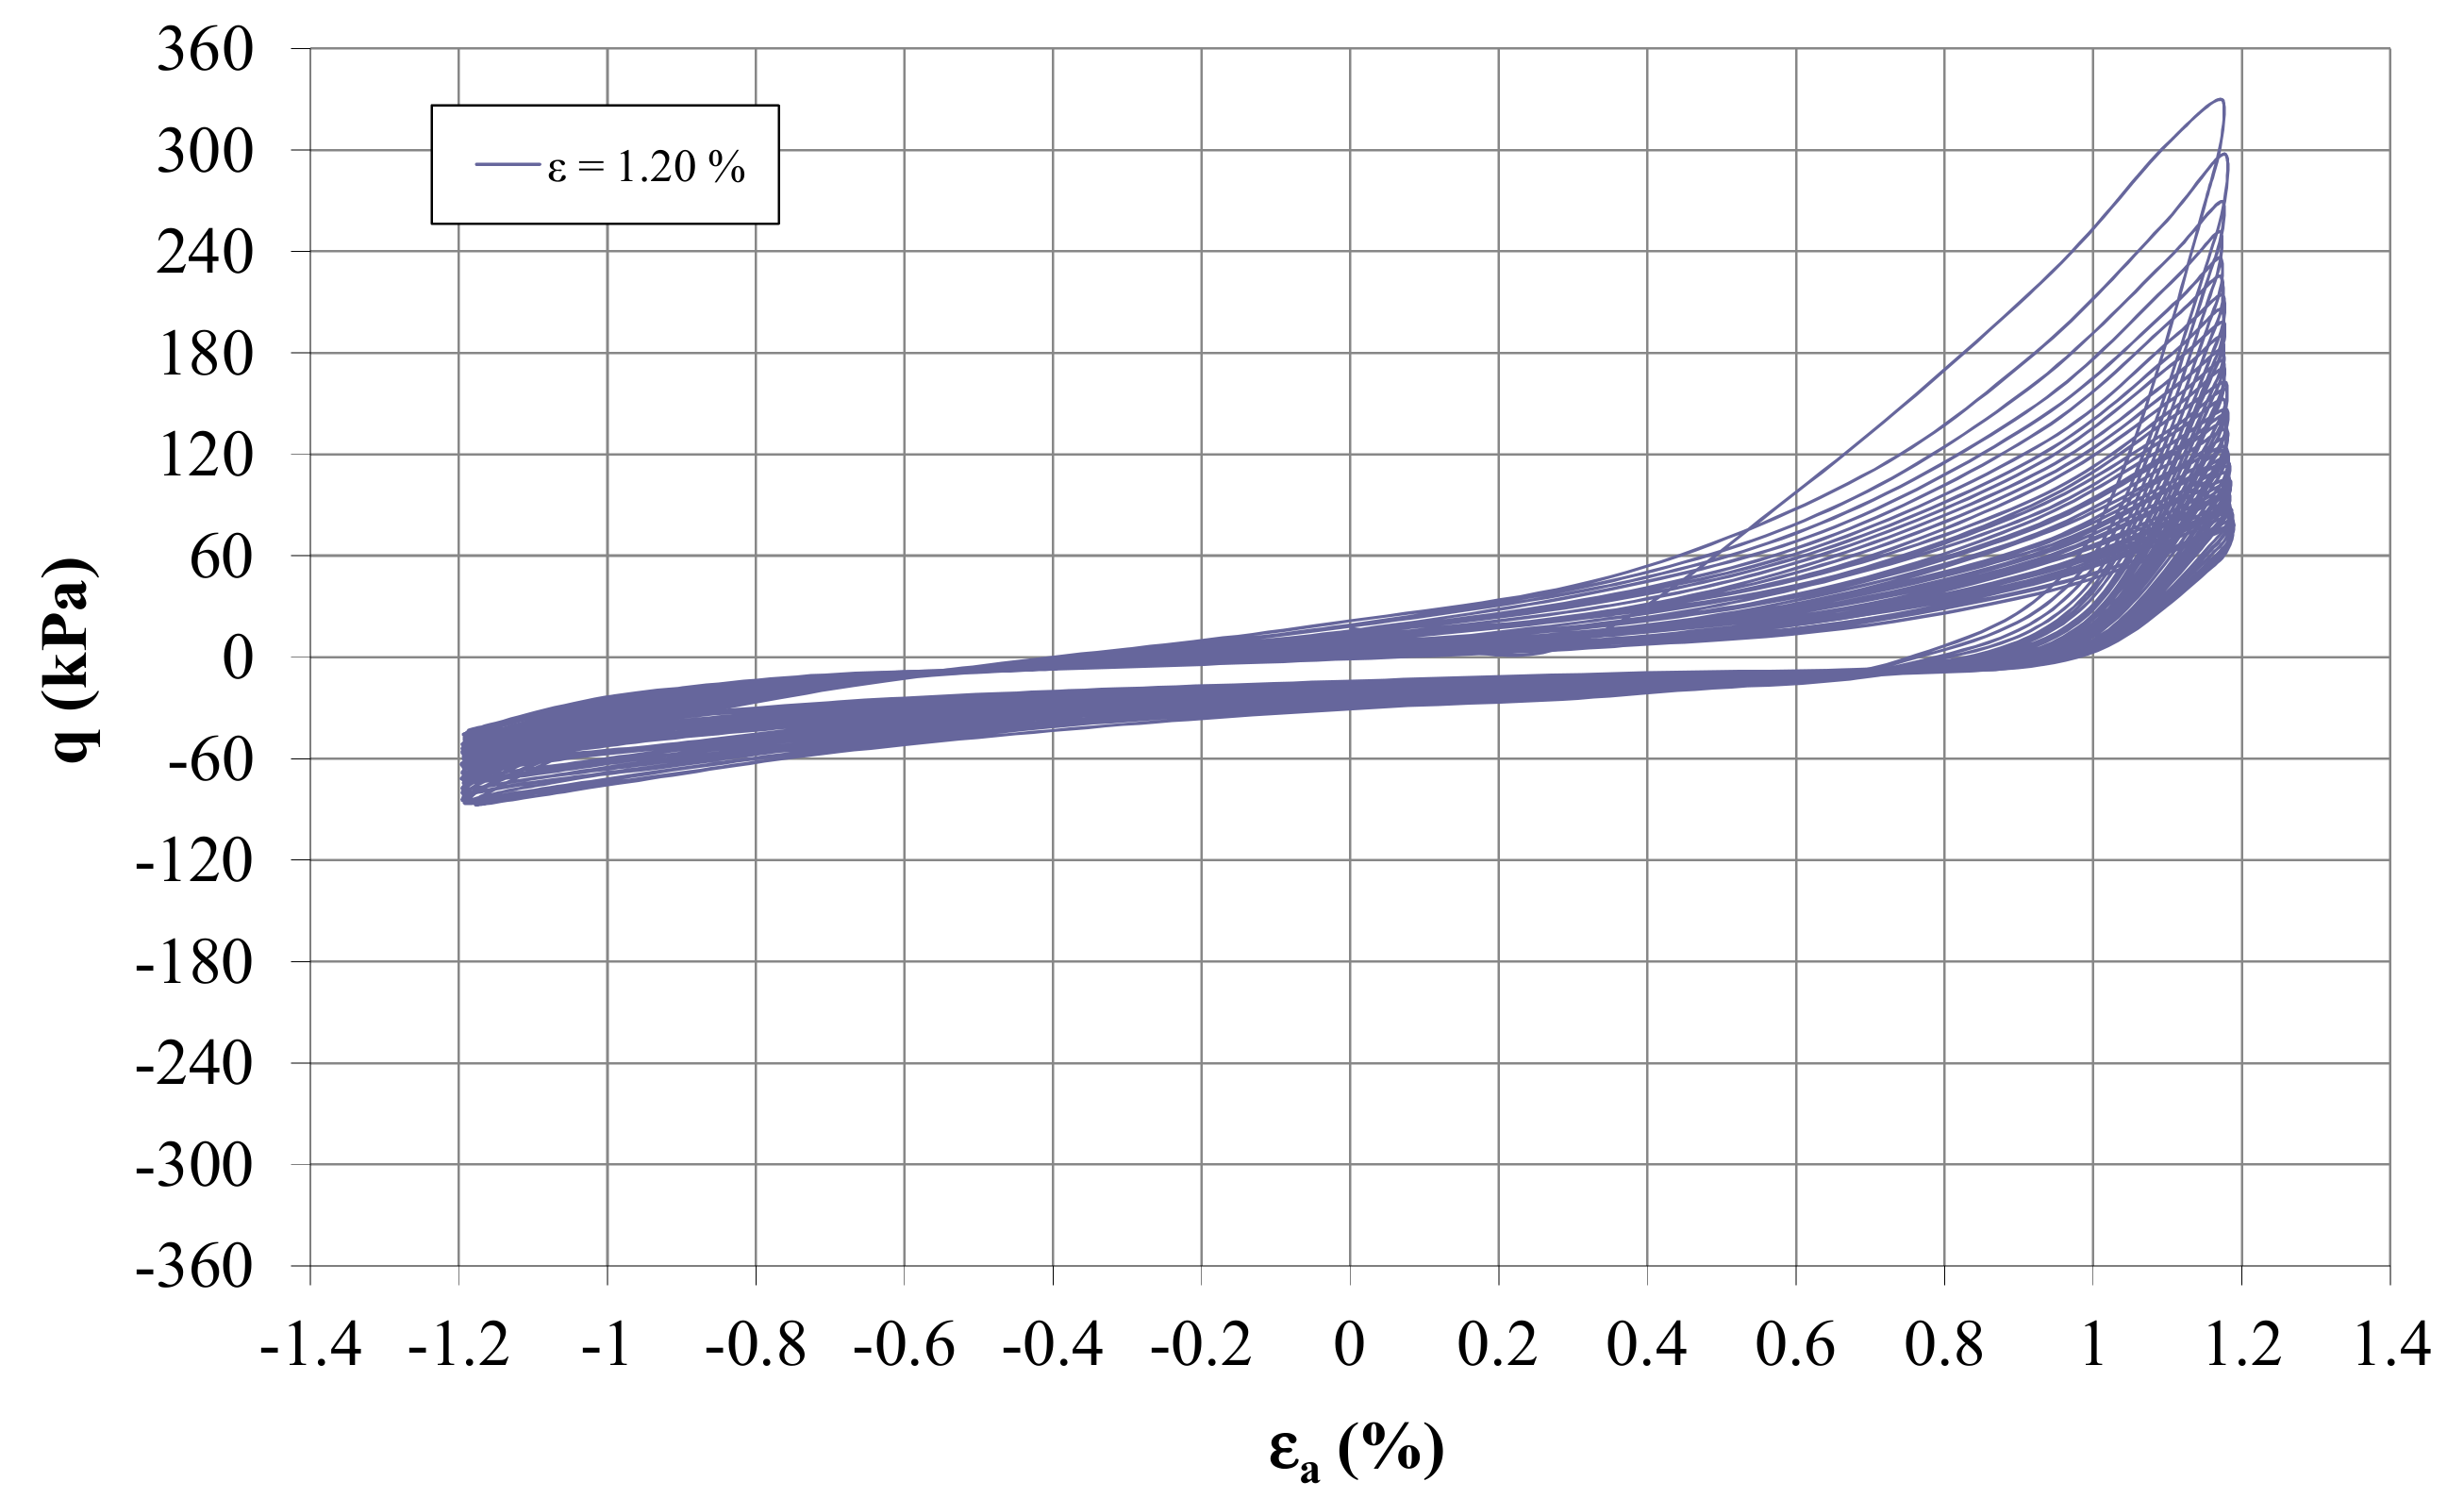
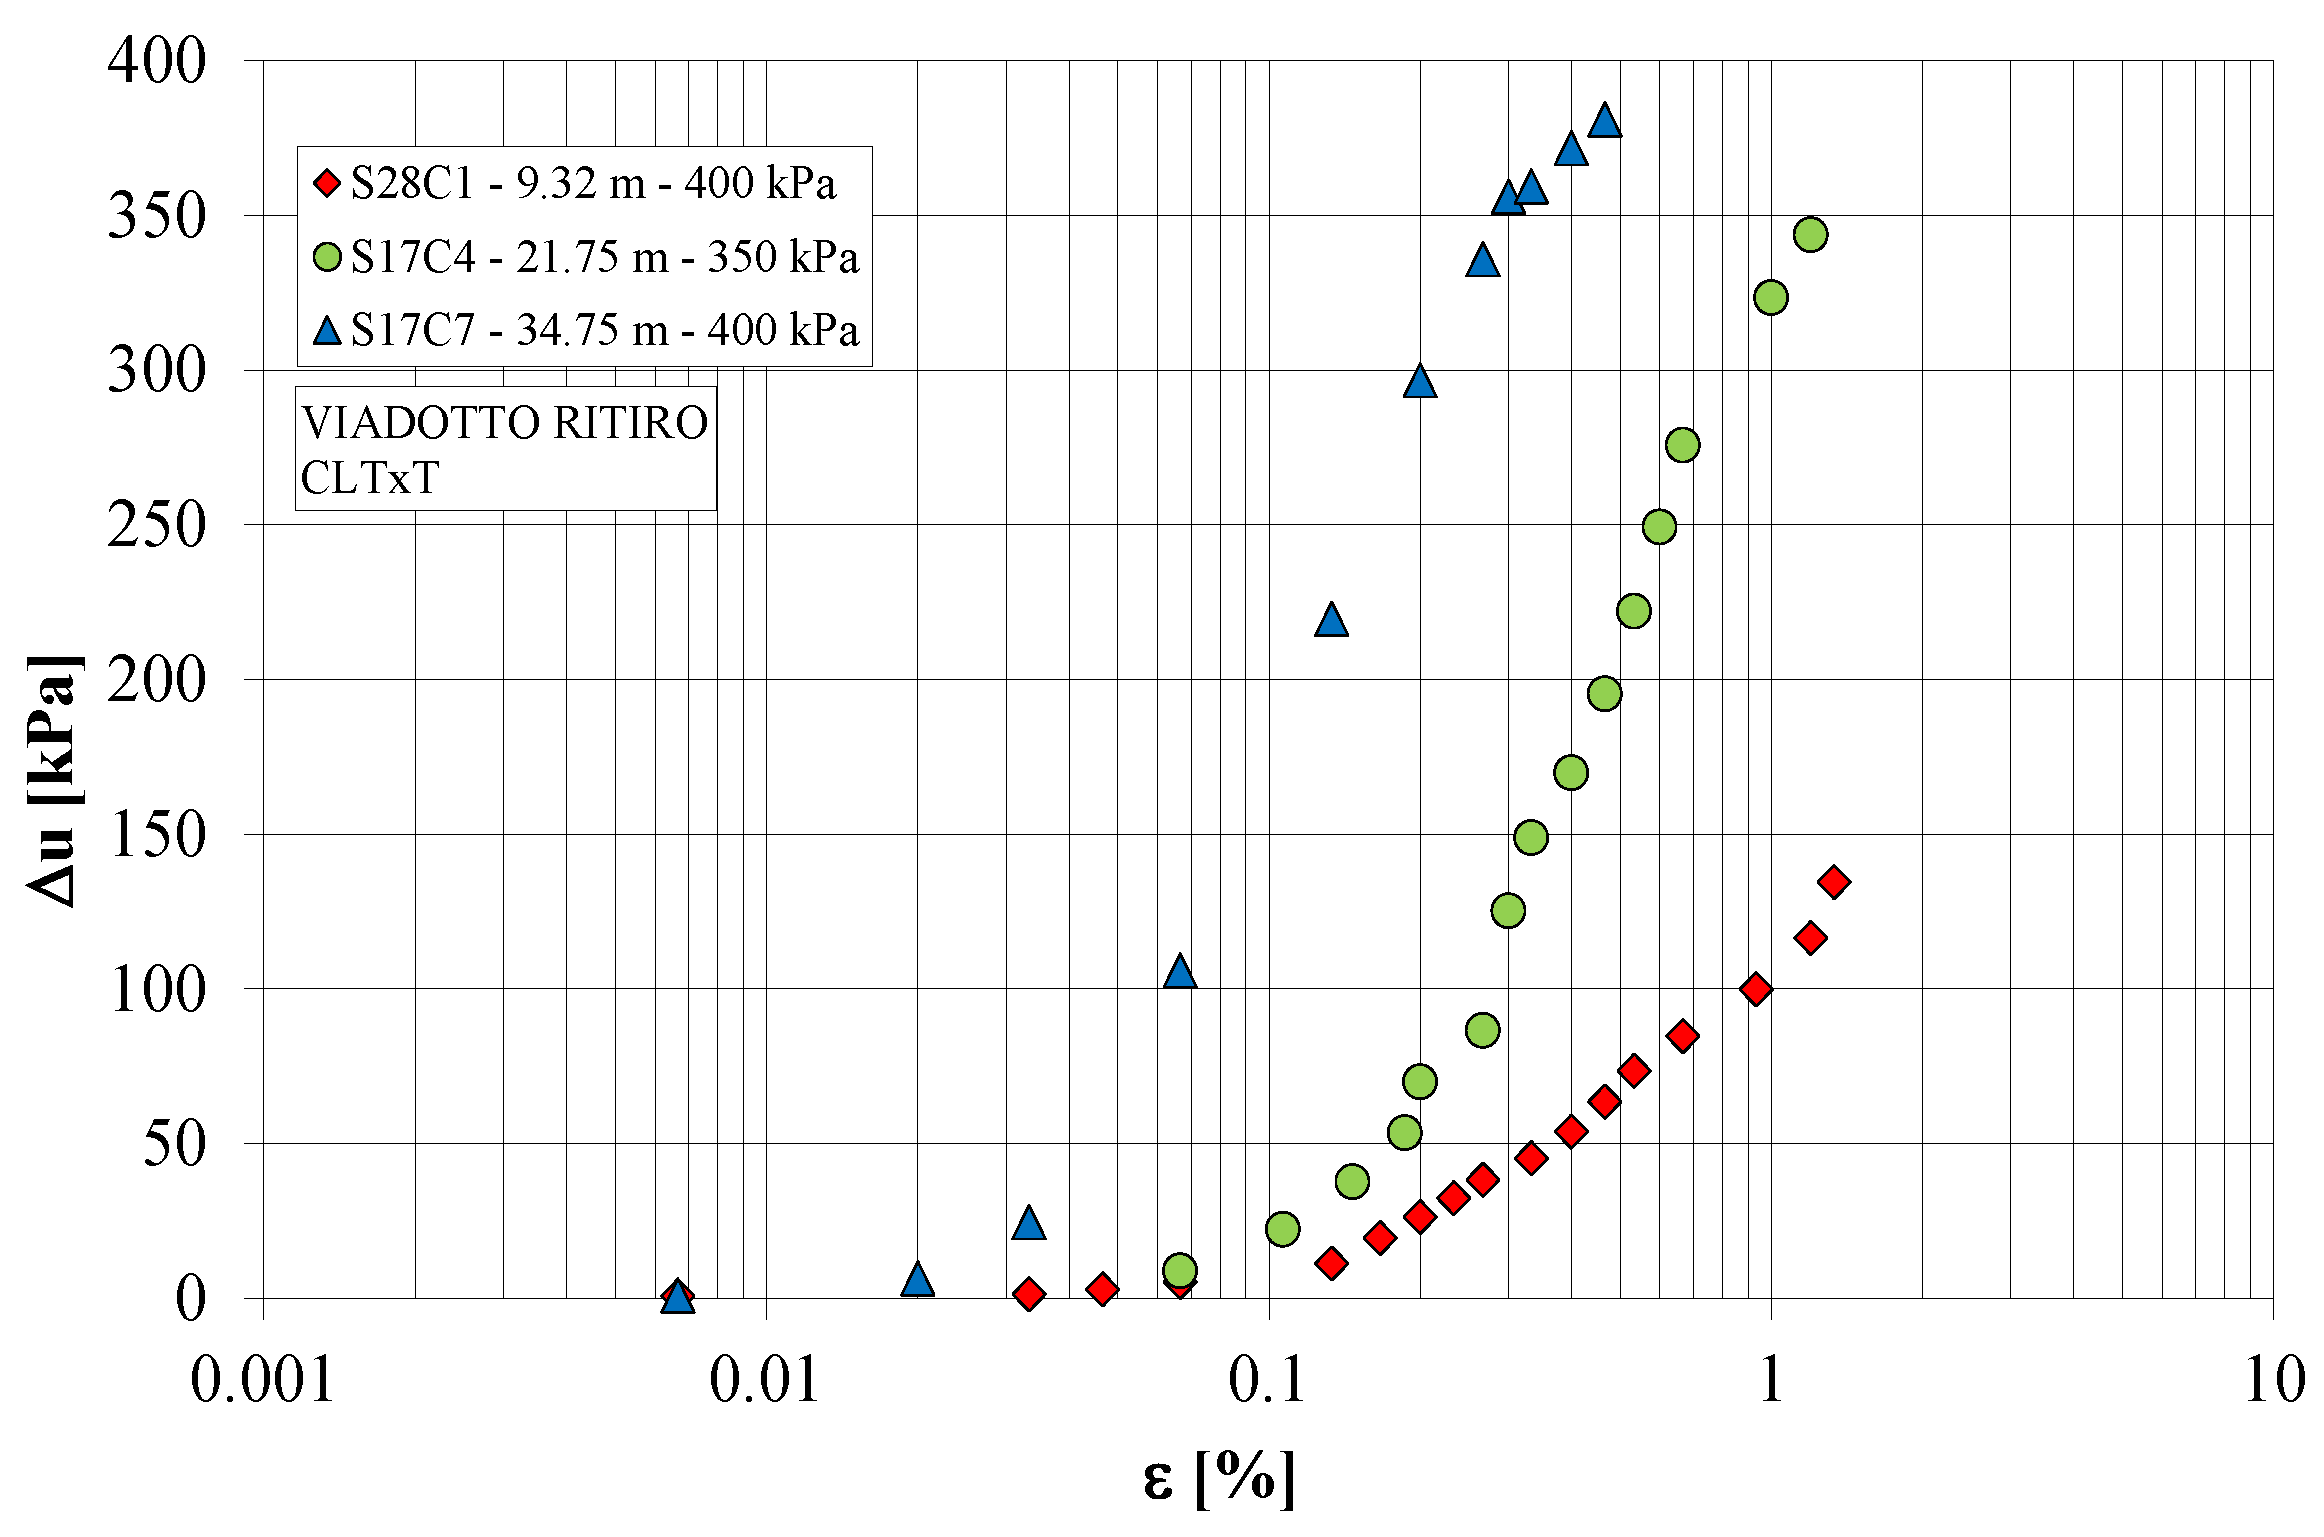
4. Soil Properties by Laboratory Tests

The equivalent shear modulus Geq and damping ratio D of "Ritiro viaduct" deposits were determined in the laboratory by means of a Resonant Column/Cyclic Loading Torsional Shear apparatus [42,43,44]. These dynamic parameters represent the basic data for the studies of local seismic response [45,46,47,48]. This apparatus was supplied at the Geotechnical Laboratory of the University Kore of Enna (Figure 7). A resonant column test consists of exciting one end of a confined solid or hollow cylindrical soil specimen. The specimen is fixed at the bottom (fixed-free test) and it is excited in torsion or flexure at the top by means of an electromagnetic drive system. Once the fundamental resonant frequency is established from measuring the motion of the free end, the velocity of the propagating wave and the degree of material damping are derived. The shear modulus is then obtained from the derived velocity Vs (in case of torsion) and the density of the sample.
The equivalent shear modulus Geq is the unload–reload shear modulus that is evaluated from RCT in function of velocity Vs and density ρ of the sample, while Go is the maximum value or also "plateau" value as observed in the G-log(γ) plot. G is the secant modulus. Generally, G is constant until a certain strain limit is exceeded. This limit is called the elastic threshold shear strain (γte) and it is believed that soils behave elastically at strains smaller than (γte). The elastic stiffness at γ < γte is thus already defined as Go. Damping ratio D is defined by Equation (1):
D = Δ W 4 π W ,
where ΔW is the area enclosed by the unloading–reloading loop and represents the total energy loss during the cycle, where W is the elastic stored energy. The RCT apparatus used is a fixed-free resonant column apparatus [49]. It enables the specimen consolidation under both isotropic and anisotropic stresses. It is composed of a drive system, a support system, and a base plate. The solid or hallow cylinder specimen is fixed at the bottom and its constraint at the base is due to the friction existing between the specimen and the porous synthesized bronze stone [50].
Torsional forces are applied at the top of the drive system, realized in aluminum. It is an electrical motor constituted of four magnets connected with the top of the sample and eight coils placed on the inox steel annular base, which is strictly linked to the support system. The weight of the motor is counterbalanced by a spring. A programmable function generator (PGF) excites the electrical motor of [51].
The support system, in addition to permitting the placement of the drive system, may possibly put the proximity transducers in and the filling in of water for saturated specimen tests. It is realized a Plexiglas cell pressure, to permit the isotropic consolidation using an air pressure source controlled with a manual pressure regulator. The base and the top plates are connected by three vertical rods inside the cell. In the resonant column test (RCT), the function generator produces a sinusoidal electric signal which is increased from an amplifier and transformed into torsional mechanical stress by an electromagnetic motor, consisting of eight coils and four magnets, connected to the head of the specimen. The magnetic field of the coils interacts with the magnets connected to the plate that transmits the torsional oscillation to the head of the specimen. Because the frequency of excitation is varied, the dynamic response of the sample varies in terms of amplitude. The latter is recorded by a accelerometer connected to the guide plate and proximity transducers measuring the relative movement between the plate and coils. Resonance frequency values were used for the calculation of the cutting module and the deformations. The decay curve, produced by interrupting the torsion excitation in resonance, allowed to evaluate the damping of the material following the amplitude decay method during the decrement of free vibration [42].
In the cyclic loading torsional shear test (CLTST), a cyclic torque is applied to the specimen by means of a torsional motor, to which a sinusoidal signal is sent at a fixed frequency of 0.5 Hz, continuously monitoring the torsion and angular deformation. The rotation of the specimen is measured thanks to the use of two proximity transducers. The data of the signal sent (proportional to the shear stress) and the corresponding torsion (proportional to the cutting deformation) are acquired simultaneously. The specimen shear module is then determined based on the average slope of the stress–strain hysteresis, while the damping is related to the cycle area of hysteresis as the ratio between the area enclosed by the unloading–reloading loop, and represents the total energy loss during the cycle and W is the elastic stored energy.
In the present work, solid cylindrical specimens were reconstituted by using tapping [50], in order to obtain the required relative and a good uniformity during the deposition.
The mold was assembled and a little depression was applied to let the membrane adhere to the inside surfaces. The material was placed in the mold using a funnel-pouring device. The soil was placed as loosely as possible in the mold by leaving the soil from the spout in a steady stream, holding the pouring device upright and vertical, and maintaining constant the fall height. It was possible to obtain different values of relative density changing the height of deposition. In order to realize high values of relative density, it could be necessary to beat delicately the mold surface during the deposition. Each sample was reconstituted with fresh sand. Each specimen was subjected to an isotropic load achieved in a Plexiglas pressure cell, using an air pressure source. The axial strain was measured by using a high-resolution proximity transducer, which monitors the aluminum top-cap displacement. Shear strain was measured by monitoring the top rotation with a couple of high-resolution proximity transducers. During a resonant column test, the proximity transducers were not able to appraise the value of the targets displacements, because of the high frequency of the oscillations. Then rotation on the top of the specimen was measured by means of an accelerometer.
The laboratory test conditions and the obtained small strain shear modulus Go are listed in Table 3. After the saturation phase, obtained by applying an appropriate back-pressure value, the undisturbed specimens were isotropically reconsolidated to the best estimate of the in situ mean effective stress. The same specimen was first subject to RCT, then to CLTST after a rest period of 24 h with opened drainage. CLTST was performed under stress control condition by applying a torque, with triangular time history, at a frequency of 0.1 Hz. The size of solid cylindrical specimens were radius = 25 mm and height = 100 mm.
The initial shear modulus Go of soil is mainly influenced by the state of the soil, expressed by a combination of the void index e (or by the relative density Dr) and by the soil structure that reflects the deposition and the subsequent structural transformation processes such as aging, diagenesis, and cementation. For higher strain levels, the shear modulus G depends also, and especially on the strain level, on the stress–strain history and on the strain rate [52].
The Go values (Go (1) and Go (2)), reported in Table 3, indicate moderate influence of strain rate, even at very small strain where the soil behavior is supposed to be elastic. Values of shear modulus G (MPa) and damping ratio D (%) versus from RCT and CLTST tests are reported in Figure 8, Figure 9, Figure 10 and Figure 11, respectively. The initial shear modulus obtained during CLTST shows the effect of the soil degradation because of RCT; this effect tends to become negligible with the shear strain build up (Figure 12). Meanwhile, the D values obtained during RCT and CLTST follow the same trend and are thus comparable (Figure 13). The damping ratio values obtained from RCT by amplitude decay and CLTST method are quasi constant until a strain level of about 0.01%, higher values of D have been obtained from strain level higher than 0.01%. It is possible to see that the damping ratio from RCT and CLTST, at very small strains, is so equal to about 2%. Greater values of D are obtained from RCT for the strain level of about 0.1%.
It is supposed that RCT provides larger values of D than CLTST because of the rate (frequency) effect, in agreement with data shown by [53] and [54]. According to these researchers, the nature of soil damping in soils can be linked to the following phenomena:
Non-linearity which governs the so-called hysteretic damping controlled by the current shear strain level. This kind of material damping is absent or negligible at very small strains.
Viscosity of the soil skeleton (creep), which is relevant at very small strain rates.
Viscosity of the pore fluid, which is relevant at very high frequencies.
Finally, higher values of the initial shear modulus (Go (3)) were obtained from SDMTs. Generally, the small strain stiffness, determined in the laboratory on high quality reconstructed sample using appropriate apparatuses and procedures, is very close to that obtained in situ from seismic tests. Probably, in the case of the "Ritiro viaduct", disturbance phenomena occurred during reconstruction operations and differences in stress conditions determined lower values of the initial shear modulo in the laboratory.
The experimental results were used to determine the empirical parameters of the equation proposed by [55] to describe the shear modulus decay with shear strain level (Figure 14a,b and Figure 15a,b):
G ( γ ) G o = 1 1 + α γ ( % ) β ,
where G(γ) = strain dependent shear modulus; γ = shear strain; α, β = soil constants.
Equation (2) allows the complete shear modulus degradation to be considered with strain level. The values of soil constants α and β obtained from RCTs and CLTSTs for soil type A and B are listed in Table 4.
As suggested by [55], the inverse variation of damping ratio with respect to the normalized shear modulus has an exponential form as that reported in Figure 16a,b and Figure 17a,b for the "Ritiro viaduct" area:
D ( γ ) ( % ) = η exp λ G γ G o ,
where D(γ) = strain dependent damping ratio; γ = shear strain; η, λ = soil constants.
The values of soil constants η and λ obtained from RCTs and CLTSTs for soil type A and B are listed in Table 4.
Equation (3) assumes maximum value Dmax = 45% for G(γ)/Go = 0 and minimum value Dmin = 3.18% for G(γ)/Go = 1. Therefore, Equation (3) can be re-written in the following normalized form:
D ( γ ) D ( γ ) max = exp λ G γ G o
Figure 18a,b and Figure 19a,b show a comparison between the enveloping curves of the experimental data obtained during the RCTs and CLTSTs. It is possible to observe how, in general, the CLTSTs, with respect to the RCTs, determine a behavior of the soil characterized by a wider elastic field with the same level of deformation reached. This phenomenon may be due to the intergranular reassembly of the sandy soil due to the effect of the RCTS. Moreover, overall, in the case of CLTSTs higher values of D are observed.
To perform triaxial tests, triaxial cells consisting of a structure were used for stainless steel and a Plexiglas cylinder (Figure 20). The maximum isotropic operating pressure was 1 MPa. For fluid of confinement, water was used. Sample drainage was allowed, when necessary, through porous stones placed on the two vertical load distribution bases. The specimen was subsequently placed in saturation by applying a back-pressure under an effective pressure isotropic, enough to prevent swelling. The test was then saturated by performing one measurement of parameter B. The value of approximately 0.95 was taken as an indirect measure of the complete saturation of the material. In the case of a value that is too low, saturation was prolonged for a further period of time, in some cases increasing counter-pressure again until a satisfactory value of B was reached and the specimen was brought, in several steps, to the final effective consolidation tension.
All test operations during saturation (until the Skempton B parameter reached at least 0.98) and isotropic consolidation were controlled by a panel that adjusts the confinement pressure and the counter-pressure and allows measurement of pressures and pressure volume variations of the specimen by means of a pressure transducer and a volumometer. The height variations of the specimen were detected by means of a displacement transducer. The application of cyclic loads took place by means of a contrast structure equipped with an electro-pneumatic system, which allowed to apply to the specimen a constant sinusoidal load of constant amplitude. The size of solid cylindrical specimens were radius = 35 mm and height = 140 mm. The laboratory test conditions and the obtained small strain shear modulus Eo are also listed in Table 3. During the cyclic triaxial test, the load sequence was characterized by steps of 40 strain controlled load cycles.
During the cyclic loading triaxial tests (CLTxTs) (Figure 21), the soil sample showed a rapid decrease of its mechanical characteristics at strain levels of about 10−2%. It seems that it is not possible to investigate the values of the modulus of normal elasticity (Young’s modulus) at very low strain levels (less than 10−3%) due to undesired deformations caused by the deformability of the mechanical structure (system compliance) of the triaxial apparatus.
Low values of the Young’s modulus were obtained in correspondence with the test performed on the S17C7 sample, probably due to the low initial value of Dr.
The initial damping values are around 1%, while the maximum values are between 6 and 8% at a strain level of about 1% (Figure 22).
During the cyclic loading triaxial tests (CLTxT), unload–reload cycles became unstable and degradation phenomena of material occured when a certain limit strain was exceeded (Figure 23 and Figure 24). This limit strain is defined as volumetric threshold shear strain and is rate-dependent. The degradation caused a decrease of stiffness, an increase of D and pore pressure build-up with the increase of N because of cyclic material degradation, as obtained from a CLTST and CLTxT on "Ritiro viaduct" soil [56].
Figure 25 shows the pore pressure build up during CLTxT. The pore pressure build up during CLTxT was so negligible at low strain. On the contrary, at strain level of about 0.15%, it is possible to observe an important increase of pore pressure due to the degradation phenomenon.
Values of shear modulus G (MPa) and damping ratio D (%) versus γ (%) from CLTST and CLTxT are reported in Figure 26 and Figure 27, respectively. In the case of CLTST, higher values of G were always obtained, compared to those of the CLTxT, also as a function of lower initial investigated strain levels. The trend of the G modulus seems to align only for strain levels higher than 0.1%, even if the results of the two types of tests are comparable only for a strain interval between 0.01 and 0.1%. This difference on G can probably be attributed to the high interstitial pressure values obtained during the CLTxT tests (Figure 25) due to the low initial value of Dr. Higher values of D were obtained from strain levels higher than 0.01%. Moreover, at the same strain level, in the case of CLTSTs, higher values of D were observed.

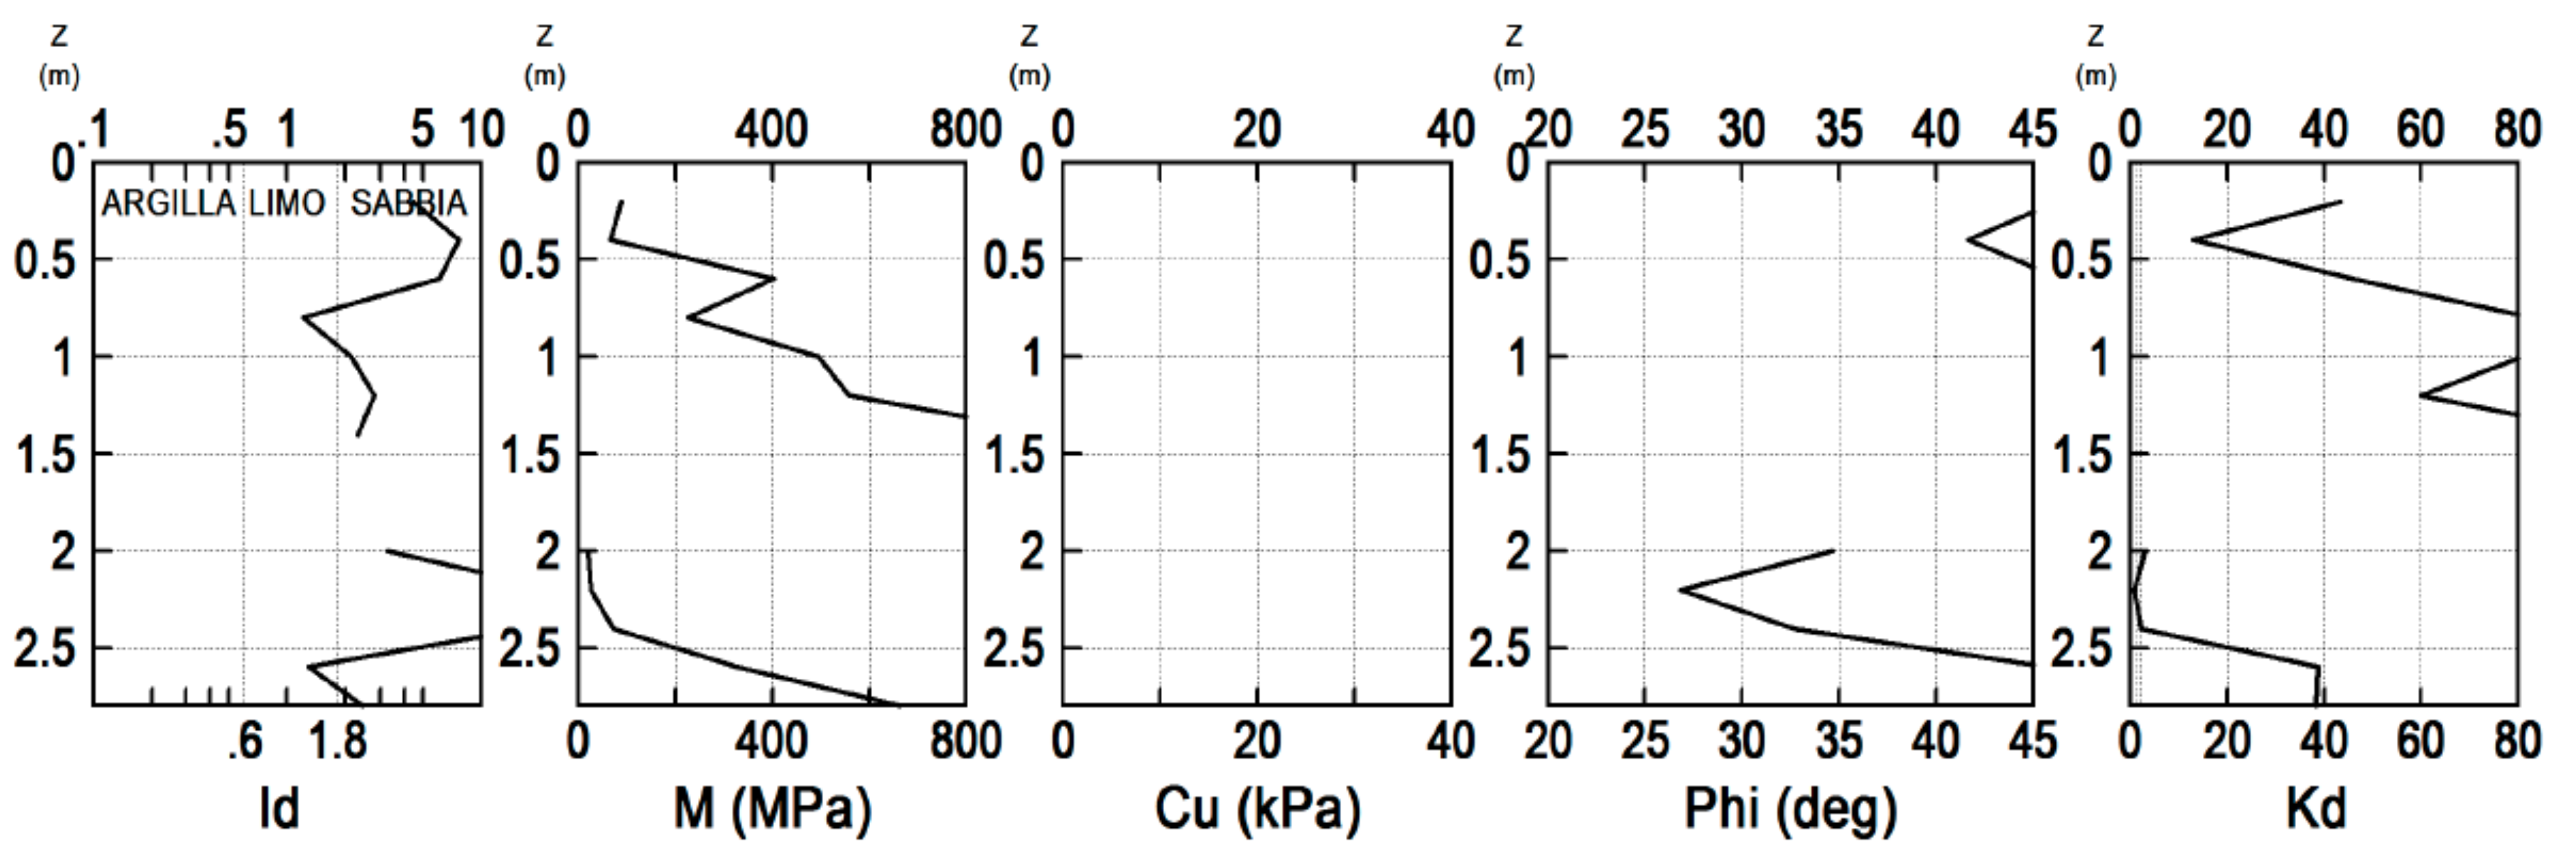
5. Soil Properties by in Situ Tests

The use of in situ tests as complementary experimental techniques to laboratory experiments is now commonly recognized [57]. The small strain (γ ≤ 0.001%) shear modulus, Go, was thus determined from SDMT. The SDMT provides a simple means for determining the initial elastic stiffness at very small strains and in situ shear strength parameters at high strains in natural soil deposits. Moreover, it was attempted to assess Go by means of empirical correlations, based either on penetration test results or on laboratory test results [57]. The SDMT [17,58] provides a simple means for determining the initial elastic stiffness at very small strains and in situ shear strength parameters at high strains in natural soil deposits [32,59]. This apparatus was also used in offshore conditions by [60,61]. The test is conceptually similar to the seismic cone (SCPT). First introduced by [62], the SDMT was subsequently improved at Georgia Tech, Atlanta, USA [63,64,65]. A new SDMT system has recently been developed in Italy. The seismic modulus is a cylindrical instrumented tube, located above the DMT blade [66], housing two receivers at a distance of 0.50 m (see Figure 28). The test configuration "two receivers"/"true interval" avoids the problem connected with the possible inaccurate determination of the "first arrival" time sometimes met with the "pseudo interval" configuration (just one receiver). Moreover, the pair of seismograms recorded by the two receivers at a given test depth correspond to the same hammer blow and not to different blows in sequence, which are not necessarily identical. The adoption of the "true interval" configuration considerably enhances the repeatability in the Vs measurement (observed repeatability Vs ≈ 1–2%). VS is obtained as the ratio between the difference in distance between the source and the two receivers (S2–S1) and the delay of the arrival of the impulse from the first to the second receiver (Δt). Vs measurements are obtained every 0.5 m of depth. The shear wave source at the surface is a pendulum hammer (≈10 kg), which hits horizontally a steel rectangular base pressed vertically against the soil (by the weight of the truck) and oriented with its long axis parallel to the axis of the receivers, so that they can offer the highest sensitivity to the generated shear wave.
Source waves are generated by striking a horizontal plank at the surface that is oriented parallel to the axis of a geophone connects by a co-axial cable with an oscilloscope [63,64]. The measured arrival times at successive depths provide pseudo interval Vs profiles for horizontally polarized vertically propagating shear waves. In Figure 28, the SDMT scheme for the measure of Vs is shown, while Figure 29 shows an example of seismograms obtained by SDMT at various test depths at the site of the "Ritiro viaduct" (it is a good practice to plot side-by-side the seismograms as recorded and re-phased according to the calculated delay). Vs may be converted into the initial shear modulus Go by the theory of elasticity.
In three SDMT test verticals, only the seismic measurements were carried out, in pre-holes performed by means of a probe and filled with gravel (with grains of a diameter strictly between 5 and 15 mm), statically advancing with a penetrometer having a maximum thrust capacity equal to 20 tons. The noticeable difference between the density of the in situ material and the filling material of the pre-hole made the interpretation of the results particularly difficult. The combined knowledge of Go and of the one dimensional modulus M (from DMT) may be helpful in the construction of the G–γ modulus degradation curves [67,68,69,70,71].
A summary of SDMT parameters is shown in Figure 30, where:
Id: Material index; gives information on soil type (sand, silt, clay).
M: Vertical drained constrained modulus.
Cu: Undrained shear strength.
Phi: Angle of shear resistance.
Kd: Horizontal stress index; the profile of Kd is similar in shape to the profile of the overconsolidation ratio OCR. Kd = 2 indicates in clays OCR = 1, Kd > 2 indicates overconsolidation. A first glance at the Kd profile is helpful to "understand" the deposit.
Vs: Shear wave velocity.
Figure 31 shows the values of Go obtained in situ from SDMT and those measured in the laboratory from RCT performed on reconstructed solid cylindrical specimens, which were isotropically reconsolidated to the best estimate of the in situ mean effective stress. The Go values are plotted in Figure 31 against depth. In the case of laboratory tests, the Go values are determined at shear strain levels of less than 0.001%. A comparability exists between the laboratory and in situ test results. On average, the ratio of Go (Lab) to Go (Field) by RCT and SDMT was equal to about 1.80 at the depth of 19.75 m.
It was also attempted to evaluate the small strain shear modulus by means of the following empirical correlations based on penetration tests results or laboratory results available in literature.
(a)
[72]
G o = 530 σ v / p a 0.25 γ D / γ w 1 2.7 γ D / γ w K o 0.25 σ v p a 0.5 ,
where Go, σ’v and pa are expressed in the same unit; pa = 1 bar is a reference pressure; γD and Ko are, respectively, the unit weight and the coefficient of earth pressure at rest, as inferred from SDMT results according to [66];
(b)
[57]
G o = 600 σ m 0.5 p a 0.5 e 1.3 ,
where σ’m = (σ’v + 2 · σ’h)/3; pa = 1 bar is a reference pressure; Go, σ’m, and pa are expressed in the same unit. The values for parameters which appear in Equation (6) are equal to the average values that result from laboratory tests performed on quaternary Italian clays and reconstituted sands. A similar equation was proposed by [73] for Holocene clay deposits.
Equation (6) incorporates a term which expresses the void ratio; the coefficient of earth pressure at rest only appears in Equation (5). However only Equation (5) tries to obtain all the input data from the SDMT results. The Go values obtained with the methods above are also plotted against depth in Figure 28. The method by [57] was applied considering a given profile of void ratio. The coefficient of earth pressure at rest was inferred from SDMT.
Since the purely dilatometric data only investigate the first meters of depth, the use of Equation (5) is limited. On the whole, Equation (6) seems to provide the most accurate trend of Go with depth, but is not able to analyze stratigraphic variation along the depth, as can be seen in Figure 28. The results obtained by SDMT are comparable with the data of the RCT tests and they are able to identify the stratigraphic variations.

6. Analysis of the Effects on the Physical Environment

The results of cyclic triaxial tests carried out can be used for the seismic retrofitting works, which include also the reinforcement of the foundation of buildings. Data include characterization of materials, definition of degradation phenomena with the relative identification of possible causes, and estimation of the residual performance characteristics of the building. To take into account the analysis of the effects on the natural environment, according to the “Manual for Zonation on Seismic Geotechnical Hazards”, local seismic response, slope instability, and liquefaction of the area were analyzed using the results of cyclic triaxial tests and the results of other laboratory tests, including the combined resonant column tests (RCT) and cyclic loading torsional shear tests (CLTST). Local seismic response analysis using ONDA and DEEPSOIL computer codes was performed on the Ritiro Viaduct [74]. Results of the numerical analyses are presented as comparisons in terms of maximum acceleration profiles, maximum shear strain profiles, response spectra, surface response seismograms, Fourier spectra, and amplification ratios. The local seismic response (LSR) analysis was performed by using seismograms obtained for the 28 December 1908 Messina and Reggio Calabria earthquake scenario. The results of cyclic triaxial tests performed on samples were also used for the evaluation of the liquefaction resistance of soils of the Ritiro Viaduct [12]. The complex cyclic shear stress path experienced by the soil during an earthquake can be reproduced in the laboratory only by using sophisticated testing apparatuses. Cyclic triaxial tests have been widely used to assess soil liquefaction potential, especially for coarse-grained soils, as in this study.

7. Conclusions

In the framework of the design for the seismic retrofitting of the ‘‘Ritiro Viaduct’’ foundations along the A20 motorway, connecting the cities of Messina and Palermo, located in one of the most hazardous Italian seismic areas, a detailed geotechnical characterization was carried out. Indeed, the seismic effects induced by earthquakes play an important role in the planning and construction, as well as in the seismic retrofitting works of important infrastructures, such as the ”Ritiro viaduct”.
This paper focuses on a comprehensive laboratory and in situ investigations carried out to obtain a soil profile, with special attention to the variation of the shear modulus (G) and damping ratio (D) with depth. A detailed geological and geotechnical characterization of the area was performed by in situ and laboratory tests, including seismic dilatometer Marchetti tests (SDMTs), the combined resonant column (RCT) and cyclic loading torsional shear tests (CLTSTs), and undrained cyclic loading triaxial tests (CLTxTs).
The RCT and CLTST show a moderate influence of strain rate, even at very small strain, where the soil behavior is supposed to be elastic, while the D values obtained during RCT and CLTST follow the same trend and are thus comparable. It is possible to see that the damping ratio from RCT and CLTST, at very small strains, is equal to about 2%. Moreover, higher values of the initial shear modulus Go were obtained from SDMTs. Probably, in the case of the "Ritiro viaduct", disturbance phenomena occurred during reconstruction operations and differences in stress conditions determined lower values of the initial shear modulus in the laboratory.
The experimental results were used to design the seismic retrofitting work and, in particular, to determine the empirical parameters of the proposed equation to describe the shear modulus decay and damping ratio build-up with shear strain level.
During the cyclic loading triaxial tests (CLTxTs), the soil sample showed a rapid decrease of its mechanical characteristics at strain levels of about 10−2%. It seems that it is not possible to investigate the values of the modulus of normal elasticity (Young’s modulus) at very low strain levels (less than 10−3%) due to undesired deformations caused by the deformability of the mechanical structure (system compliance) of the triaxial apparatus. Low values of the Young’s modulus were obtained in correspondence with the test performed on one sample, probably due to the low initial value of Dr. The initial damping values were around 1%. During CLTxT, unload–reload cycles became unstable and degradation phenomena of material occurred when a certain limit strain was exceeded. This limit strain is called volumetric threshold shear strain and it is rate-dependent. The degradation caused a decrease of stiffness, an increase of D, and pore pressure build-up with the increase of N because of cyclic material degradation. Finally, the in situ obtained results by SDMT, though higher, are comparable with the data of the RCT tests and they are able to identify the stratigraphic variations.

Author Contributions

F.C., A.C., S.G. and V.L. carried out the investigation and prepared the original manuscript according to the following percentages: 25% F.C., 25% A.C., 25% S.G. and 25% V.L.

Funding

This research received no external funding.

Conflicts of Interest

The authors declare no conflict of interest.

References

  1. Seed, H.B.; Lee, K.L. Liquefaction of Saturated Sands During Cyclic Loading. J. Soil Mech. Found. 1966, 92, 105–134. [Google Scholar]
  2. Yoshimi, Y.; Tokimatsu, K.; Kaneko, O.; Makihara, Y. Undrained Cyclic Shear Strength of Dense Nigata Sand. Soils Found. 1984, 24, 131–145. [Google Scholar] [CrossRef] [Green Version]
  3. Sladen, J.A.; D’Hollander, R.D.; Krahn, J. The Liquefaction of Sands, a Collapse Surface Approach. Can. Geotech. J. 1985, 22, 564–578. [Google Scholar] [CrossRef]
  4. Vaid, Y.P.; Chern, J.; Tumi, H. Confining Pressure, Grain Angularity and Liquefaction. J. Geotech. Eng. 1985, 111, 1229–1235. [Google Scholar] [CrossRef]
  5. Michetti, A.M.; Esposito, E.; Guerrieri, L.; Porfido, S.; Serva, L.; Tatevossian, R.; Vittori, E.; Audemard, F.; Azuma, T.; Clague, J.; et al. Intensity Scale ESI 2007. Mem. Descr. Della Carta Geol. D’italia 2007, 74, 11–20. [Google Scholar]
  6. Giona-Bucci, M.; Villamor, P.; Almond, P.; Tuttle, M.; Stringer, M.; Ries, W.; Smith, C.; Hodge, M.; Watson, M. Associations between Sediment Architecture and Liquefaction Susceptibility in Fluvial Settings: The 2010–2011 Canterbury Earthquake Sequence, New Zealand. Eng. Geol. 2018, 237, 181–197. [Google Scholar] [CrossRef]
  7. Serva, L. History of the Environmental Seismic Intensity Scale ESI-07. Geosciences 2019, 9, 210. [Google Scholar] [CrossRef] [Green Version]
  8. Tuttle, M.P.; Hartleb, R.; Wolf, L.; Mayne, P.W. Paleoliquefaction Studies and the Evaluation of Seismic Hazard. Geosciences 2019, 9, 311. [Google Scholar] [CrossRef] [Green Version]
  9. Naik, S.P.; Kim, Y.; Kim, T.; Su-Ho, J. Geological and Structural Control on Localized Ground Effects within the Heunghae Basin during the Pohang Earthquake (MW 5.4, 15th November 2017), South Korea. Geosciences 2019, 9, 173. [Google Scholar] [CrossRef] [Green Version]
  10. Toki, S.; Tatsukoa, F.; Miura, S.; Yoshimi, Y.; Yasuda, S.; Makihara, Y. Cyclic Undrained Triaxial Strength of Sand by a Cooperative Test Program. Soils Found. 1986, 26, 117–128. [Google Scholar] [CrossRef] [Green Version]
  11. Flora, A.; Lirer, S.; Silvestri, F. Undrained Cyclic Resistance of Undisturbed Gravelly Soil. Soil Dyn. Earthq. Eng. 2012, 43, 366–379. [Google Scholar] [CrossRef]
  12. Lentini, V.; Castelli, F. Liquefaction Resistance of Sandy Soils from Undrained Cyclic Triaxial Tests. Geotech. Geol. Eng. 2019, 37, 201. [Google Scholar] [CrossRef]
  13. De Silva, F.; Sica, S.; Silvestri, F.; Aversa, S. Estimation of the ground shaking from the response of rigid bodies. Ann. Geophy. 2016, 59, 5. [Google Scholar] [CrossRef]
  14. Facciorusso, J.; Madiai, C.; Vannucchi, G. The 2012 Emilia earthquake (Italy): Geotechnical characterization and ground response analyses of the paleo-Reno river levees. Soil Dyn. Earthq. Eng. 2016, 86, 71–88. [Google Scholar] [CrossRef]
  15. Alessio, G.; Alfonsi, L.; Brunori, C.A.; Burrato, P.; Casula, G.; Cinti, F.R.; Civico, R.; Colini, L.; Cucci, L.; De Martini, P.M.; et al. Technologies and New Approaches Used by the INGV EMERGEO Working Group for Real-Time Data Sourcing and Processing During the Emilia Romagna (Northern Italy) 2012 Earthquake Sequence. Ann. Geophys. 2012, 55. [Google Scholar] [CrossRef]
  16. Emergeo Working Group. Liquefaction Phenomena Associated with the Emilia Earthquake Sequence of May–June 2012 (Northern Italy). Nat. Hazards Earth Syst. Sci. 2012, 13, 935–947.
  17. Monaco, P.; Marchetti, S.; Totani, G.; Marchetti, D. Interrelationship Beetween Small Strain Modulus Go and Operative Modulus. In Proceedings of the International Conference on Performance-Based Design in Earthquake Geotechnical Engineering (IS-Tokyo 2009), Tsukuba, Japan, 15–17 June 2009; Kokusho, T., Ed.; Taylor & Francis Group: London, UK, 2009; pp. 1315–1323. [Google Scholar]
  18. Santucci de Magistris, F.; d’Onofrio, A.; Evangelista, L.; Foti, S.; Maraschini, M.; Monaco, P.; Amoroso, S.; Totani, G.; Lanzo, G.; Pagliaroli, A.; et al. Geotechnical characterization of the Aterno valley for site response analyses. Rivista Italiana di Geotecnica 2013, 3, 23–43. [Google Scholar]
  19. Cavallaro, A.; Grasso, S.; Maugeri, M. Site Response Analysis for Tito Scalo Area (PZ) in the Basilicata Region, Italy. In Proceedings of the 4th Geotechnical Earthquake Engineering and Soil Dynamics Conference, Sacramento, CA, USA, 18–22 May 2008. [Google Scholar]
  20. Cavallaro, A.; Maugeri, M. Dynamic Characterization of Soils at Sellano for Seismic Microzonation. Riv. Ital. Geotec. 2001, 4, 70–78. [Google Scholar]
  21. Pino, N.A.; Piatanesi, A.; Valensise, G.; Boschi, E. The 28 December 1908, Messina Straits Earthquake (MW 7.1): A Great Earthquake through a Century of Seismology. Seismol. Res. Lett. 2008, 80, 243–259. [Google Scholar] [CrossRef] [Green Version]
  22. Comerci, V.; Blumetti, A.M.; Brustia, E.; Di Manna, P.; Guerrieri, L.; Lucarini, M.; Vittori, E. Landslides Induced by the 1908 Southern Calabria: Messina Earthquake (Southern Italy). In Landslide Science and Practice; Margottini, C., Canuti, P., Sassa, K., Eds.; Springer: Berlin, Germany, 2013; Volume 5. [Google Scholar]
  23. Comerci, V.; Vittori, E.; Blumetti, A.M.; Brustia, E.; Di Manna, P.; Guerrieri, L.; Lucarini, M.; Serva, L. Environmental Effects of the December 28, 1908, Southern Calabria–Messina (Southern Italy) Earthquake. Nat. Hazards 2015, 76, 1849–1891. [Google Scholar] [CrossRef]
  24. ISPRA Istituto Superiore per la Protezione e la Ricerca Ambientale. Available online: http://www.isprambiente.gov.it/Media/carg/sicilia.html (accessed on 8 December 2019).
  25. Istituto Nazionale di Geofisica e Vulcanologia INGV. Available online: https://emidius.mi.ingv.it/CPTI15-DBMI15/ (accessed on 8 December 2019).
  26. Guerrieri, L.; Tatevossian, R.; Vittori, E.; Comerci, V.; Esposito, E.; Michetti, A.M.; Porfido, S.; Serva, L. Earthquake Environmental Effects (EEE) and Intensity Assessment: The Inqua Scale Project. Boll. Soc. Geol. Ital. 2007, 126, 375–386. [Google Scholar]
  27. Meschis, M.; Roberts, G.P.; Mildon, Z.K.; Robertson JMichetti, A.M.; Faure Walker, J.P. Slip on a Mapped Normal Fault for the 28th December 1908 Messina Earthquake (Mw 7.1) in Italy. Sci. Rep. 2019, 9, 6481. [Google Scholar]
  28. Castelli, F.; Cavallaro, A.; Grasso, S.; Ferraro, A. In Situ and Laboratory Tests for Site Response Analysis in the Ancient City of Noto (Italy). In Proceedings of the 1st IMEKO TC4 International Workshop on Metrology for Geotechnics, Benevento, Italy, 17–18 March 2016; pp. 85–90. [Google Scholar]
  29. Castelli, F.; Cavallaro, A.; Grasso, S. SDMT Soil Testing for the Local Site Response Analysis. In Proceedings of the 1st IMEKO TC4 International Workshop on Metrology for Geotechnics, Benevento, Italy, 17–18 March 2016; pp. 143–148. [Google Scholar]
  30. Cavallaro, A.; Maugeri, M.; Ragusa, A. In Situ Tests for the Geotechnical Characterization of Airship Hangar Soils in the City of Augusta. In Proceedings of the 2nd International Conference on Geotechnical Site Characterization, Porto, Portugal, 20–22 September 2004; pp. 1053–1059. [Google Scholar]
  31. Cavallaro, A.; Capilleri, P.; Maugeri, M. Soil Characterisation of Catania Harbour by the Seismic Dilatometer Marchetti Test (SDMT). In Proceedings of the 3rd International Conference on the Flat Dilatometer, Roma, Italy, 15–17 June 2015. [Google Scholar]
  32. Cavallaro, A.; Maugeri, M.; Lo Presti, D.C.F.; Pallara, O. Characterising Shear Modulus and Damping from in Situ and Laboratory Tests for the Seismic Area of Catania. In Proceedings of the 2nd International Symposium on Pre-Failure Deformation Characteristics of Geomaterials, Torino, Italy, 28–30 September 1999; pp. 51–58. [Google Scholar]
  33. Lo Presti, D.C.F.; Jamiolkowski, M.; Cavallaro, A.; Pallara, O. Anisotropy of Small Strain Stiffness in Undisturbed and Reconstituted Clays. In Proceedings of the 2nd International Symposium on Pre-failure Deformation Characteristics of Geomaterials, Torino, Italy, 28–30 September 1999; pp. 3–10. [Google Scholar]
  34. Cavallaro, A.; Maugeri, M.; Ragusa, A. Design Parameters of a Cohesive Soil from Laboratory Tests. In Proceedings of the A. W. Skempton Memorial Conference, London, UK, 29–31 March 2004; pp. 381–392. [Google Scholar]
  35. Cavallaro, A.; Grasso, S.; Maugeri, M. Dynamic Clay Soils Behaviour by Different Laboratory and in Situ Tests. In Proceedings of the Geotechnical Symposium on Soil Stress-Strain Behavior: Measurement, Modelling and Analysis to Celebrate Prof. Tatsuoka’s 60th Birthday, Rome, Italy, 16–17 March 2006; Volume 146, pp. 583–594. [Google Scholar]
  36. Maugeri, M.; Cavallaro, A. Dynamic Characterisation of Soils from Laboratory Tests. In Proceedings of the 2nd International Conference on Earthquake Geotechnical Engineering, Lisbon, Portugal, 21–25 June 1999; pp. 863–868. [Google Scholar]
  37. Castelli, F.; Cavallaro, A.; Ferraro, A.; Grasso, S.; Lentini, V.; Massimino, M.R. Static and Dynamic Properties of Soils in Catania City (Italy). Ann. Geophys. 2018, 61, 221. [Google Scholar]
  38. Castelli, F.; Cavallaro, A.; Ferraro, A.; Grasso, S.; Lentini, V.; Massimino, M.R. Dynamic Characterisation of a Test Site in Messina (Italy). Ann. Geophys. 2018, 61, 222. [Google Scholar] [CrossRef] [Green Version]
  39. Grasso, S.; Castelli, F.; Massimino, M.R.; Lentini, V. In Situ Measurements for Evaluating Liquefaction Potential under Cyclic Loading. In Proceedings of the 1st IMEKO TC-4 International Workshop on Metrology for Geotechnics, Benevento, Italy, 17–18 March 2016; pp. 79–84. [Google Scholar]
  40. Castelli, F.; Lentini, V. Bearing capacity of shallow foundations on slopes: experimental analysis on reduced scale models. Poceedings of the 7th International Conference on Physical Modelling in Geotechnics, Zurich, Switzerland, 28 June–1 July 2010; Springman, L., Springman, S., Eds.; Taylor & Francis Group: London, UK; pp. 685–690, ISBN 978-0-415-59288-8. [Google Scholar]
  41. Castelli, F.; Maugeri, M. Experimental Analysis of Waste Compressibility. In GeoCongress 2008: Geotechnics of Waste Management and Remediation; GeoCongress: New Orleans, LA, USA, GSP 177.
  42. Capilleri, P.; Cavallaro, A.; Maugeri, M. Static and Dynamic Characterization of Soils at Roio Piano (AQ). Ital. Geotech. J. 2014, 35, 38–52. [Google Scholar]
  43. Cavallaro, A.; Massimino, M.R.; Maugeri, M. Noto Cathedral: Soil and Foundation Investigation. Constr. Build. Mater. 2003, 17, 533–541. [Google Scholar] [CrossRef]
  44. Cavallaro, A.; Cessari, L.; Gigliarelli, E. Site Characterization by in Situ and Laboratory Tests for the Structural & Architectural Restoration of Saint Nicholas Church, Nicosia, Cyprus. In Proceedings of the 2nd International Symposium on Geotechnical Engineering for the Preservation of Monuments and Historic Sites, Napoli, Italy, 30–31 May 2013; pp. 241–247. [Google Scholar]
  45. Castelli, F.; Cavallaro, A.; Ferraro, A.; Grasso, S.; Lentini, V. A Seismic Geotechnical Hazard Study in the Ancient City of Noto (Italy). In Proceedings of the 6th Italian Conference of Researchers in Geotechnical Engineering (CNRIG), Bologna, Italy, 22–23 September 2016; Volume 158, pp. 535–540. [Google Scholar]
  46. Cavallaro, A.; Grasso, S.; Maugeri, M. Volcanic Soil Characterisation and Site Response Analysis in the City of Catania. In Proceedings of the 8th National Conference on Earthquake Engineering, San Francisco, CA, USA, 18–22 April 2006; Volume 1290, pp. 835–844. [Google Scholar]
  47. Cavallaro, A.; Castelli, F.; Ferraro, A.; Grasso, S.; Lentini, V. Site Response Analysis for the Seismic Improvement of a Historical and Monumental Building: The Case Study of Augusta Hangar. Bull. Eng. Geol. Environ 2018, 77, 1217–1248. [Google Scholar] [CrossRef]
  48. Silvestri, F. Looking for objective Criteria in the Interpretation of Laboratory Stress-Strain Tests. In Proceedings of the 2nd International Symposium on Pre-failure Deformation Characteristics of Geomaterials, Torino, Italy, 28–30 September 1999; pp. 1305–1316. [Google Scholar]
  49. Hall, J.R., Jr.; Richart, F.E., Jr. Dissipation of Elastic Wave Energy in Granular Soils. J. Soil Mech. Found. Div. 1936, 89, 27–56. [Google Scholar]
  50. Drnevich, V.P.; Hardin, B.O.; Shippy, D.J. Modulus and Damping of Soils by Resonant Column Method. In Dynamic Geotechnical Testing; ASTM STP: West Conshohocken, PA, USA, 1978; Volume 654, pp. 91–125. [Google Scholar]
  51. Stokoe, K.H., II; Hoar, R.J. Variable Affecting in Situ Seismic Measurement. Proceeding of the Conference on Earthquake Engineering and Soil Dynamics, Pasadena, CA, USA, 19–21 1978; ASCE: Pasadena, CA, USA, 1978; Volume 2, pp. 919–939. [Google Scholar]
  52. Lo Presti, D.C.F. General Report: Measurement of Shear Deformation of Geomaterials in the Laboratory. In Proceedings of the Pre-failure Deformation of Geomaterials, Sapporo, Japan, 12–14 September 1994; pp. 1067–1088. [Google Scholar]
  53. Shibuya, S.; Mitachi, T.; Fukuda, F.; Degoshi, T. Strain Rate Effect on Shear Modulus and Damping of Normally Consolidated Clay. Geotech. Test. J. 1995, 18, 365–375. [Google Scholar]
  54. Tatsuoka, F.; Lo Presti, D.C.F.; Kohata, Y. Deformation Characteristics of Soils and Soft Rocks Under Monotonic and Cyclic Loads and Their Relations. In Proceedings of the 3rd International Conference on Recent Advances in Geotechnical Earthquake Engineering and Soil Dynamic, State of the Art 1, St. Louis, Missouri, 2–7 April 1995; Volume 2, pp. 851–879. [Google Scholar]
  55. Yokota, K.; Imai, T.; Konno, M. Dynamic Deformation Characteristics of Soils Determined by Laboratory Tests. Oyo Tec. Rep. 1981, 3, 13–37. [Google Scholar]
  56. Cavallaro, A.; Grasso, S.; Ferraro, A. A Geotechnical Engineering Study for the Safeguard, Restoration and Strengthening of Historical Heritage. In Proceedings of the 6th Italian Conference of Researchers in Geotechnical Engineering (CNRIG), Bologna, Italy, 22–23 September 2016; Volume 158, pp. 134–139. [Google Scholar]
  57. Jamiolkowski, M.; Lo Presti, D.C.F.; Pallara, O. Role of In-Situ Testing in Geotechnical earthquake Engineering. In Proceedings of the 3rd International Conference on Recent Advances in Geotechnical Earthquake Engineering and Soil Dynamic, State of the Art 7, St. Louis, MO, USA, 2–7 April 1995; Volume II, pp. 1523–1546. [Google Scholar]
  58. Marchetti, S.; Monaco, P.; Totani, G.; Marchetti, D. In Situ Tests by Seismic Dilatometer (SDMT). In From Research to Practice in Geotechnical Engineering; American Society of Civil Engineers: Reston, VA, USA, 2008; GSP 180. [Google Scholar] [CrossRef]
  59. Cavallaro, A.; Ferraro, A.; Grasso, S.; Maugeri, M. Topographic Effects of the Monte Po Hill in Catania. Soil Dyn. Earthq. Eng. 2012, 43, 97–113. [Google Scholar] [CrossRef]
  60. Cavallaro, A.; Grasso, S.; Maugeri, M.; Motta, E. An Innovative Low-Cost SDMT Marine Investigation for the Evaluation of the Liquefaction Potential in the Genova Harbour (Italy). In Proceedings of the 4th International Conference on Geotechnical and Geophysical Site Characterization (ISC’4), Porto de Galinhas, Brazil, 18–21 September 2012; Volume 1, pp. 415–422. [Google Scholar]
  61. Cavallaro, A.; Grasso, S.; Maugeri, M.; Motta, E. Site Characterisation by in Situ and Laboratory Tests of the Sea Bed in the Genova Harbour (Italy). In Proceedings of the 4th International Conference on Geotechnical and Geophysical Site Characterization (ISC’4), Porto de Galinhas, Brazilian, 18–21 September 2012; Volume 1, pp. 637–644. [Google Scholar]
  62. Hepton, P. Shear Wave Velocity Measurements during Penetration Testing. In Proceedings of the Geotechnology Conference Organized by the Institution of Civil Engineers, Birmingham, UK, 6–8 July 1988; pp. 275–278. [Google Scholar]
  63. Martin, G.K.; Mayne, P.W. Seismic Flat Dilatometers Tests in Connecticut Valley Vaeved Clay. Astm Geotech. Test. J. 1997, 20, 357–361. [Google Scholar]
  64. Martin, G.K.; Mayne, P.W. Seismic Flat Dilatometers Tests in Piedmont Residual Soils. Geotech. Site Charact. 1998, 2, 837–843. [Google Scholar]
  65. Mayne, P.W.; Schneider, J.A.; Martin, G.K. Small and Large Strain Soil Properties from Seismic Flat Dilatometer Tests. In Proceedings of the 2nd International Symposium on Pre-Failure Deformation Characteristics of Geomaterials, Torino, Italy, 28–30 September 1999; Volume 1, pp. 419–427. [Google Scholar]
  66. Marchetti, S. In Situ Tests by Flat Dilatometer. J. Geotech. Eng. Div. 1980, 106, 299–321. [Google Scholar]
  67. Cavallaro, A.; Grasso, S.; Maugeri, M. Dynamic Geotechnical Characterization of Sangiuliano di Puglia Seismic Area. In Proceedings of the 6th International Conference on Case Histories in Geotechnical Engineering, Arlington, WV, USA, 11–16 August 2008. [Google Scholar]
  68. Cavallaro, A.; Ferraro, A.; Grasso, S.; Maugeri, M. Site Response Analysis of the Monte Po Hill in the City of Catania. In Proceedings of the 2008 Seismic Engineering International Conference Commemorating the 1908 Messina and Reggio Calabria Earthquake MERCEA’08, Reggio Calabria, Italy, 8–11 July 2008; AIP Conference Proceedings. American Institute of Physics: College Park, MD, USA, 2008; Volume 1020, pp. 240–594. [Google Scholar]
  69. Cavallaro, A.; Grasso, S.; Ferraro, A. Study on Seismic Response Analysis in “Vincenzo Bellini” Garden Area by Seismic Dilatometer Marchetti Tests. In Proceedings of the 5th International Conference on Geotechnical and Geophysical Site Characterization (ISC’5), Queensland, Australian, 5–9 September 2016; Volume 2, pp. 1309–1314. [Google Scholar]
  70. Castelli, F.; Cavallaro, A.; Grasso, S.; Lentini, V. Seismic Microzoning from Synthetic Ground Motion Earthquake Scenarios Parameters: The Case Study of the City of Catania (Italy). Soil Dyn. Earthq. Eng. 2016, 88, 307–327. [Google Scholar] [CrossRef]
  71. Cavallaro, A.; Capilleri, P.; Grasso, S. Site Characterization by in Situ and Laboratory Tests for Liquefaction Potential Evaluation during Emilia Romagna Earthquake. Geosciences 2018, 8, 242. [Google Scholar] [CrossRef] [Green Version]
  72. Hryciw, R.D. Small Strain Shear Modulus of Soil by Dilatometer. JGED 1990, 116, 1700–1715. [Google Scholar]
  73. Shibuya, S.; Tanaka, H. Estimate of Elastic Shear Modulus in Holocene Soil Deposits. Soils Found. 1996, 36, 45–55. [Google Scholar] [CrossRef] [Green Version]
  74. Grasso, S.; Di Benedetto, C.; Ferraro, A.; Massimino, M.R.; Cavallaro, A. A comparative study on seismic response analysis of soils using different numerical codes. In Proceedings of the XVII ECSMGE-2019. Geotechnical Engineering Foundation of the Future, Reykjavík, Iceland, 1–6 September 2019; ISBN 978-9935-9436-1-3. [Google Scholar]
Figure 1. The “Ritiro Viaduct” in Messina (Italy).
Geosciences 09 00512 g001
Figure 4. Microzonation map of Messina in the area of the “Ritiro viaduct”.
Geosciences 09 00512 g004
Figure 5. Profile of grain size distribution of the "Ritiro viaduct" area.
Geosciences 09 00512 g005
Figure 6. Particle size analysis of the "Ritiro viaduct" area.
Geosciences 09 00512 g006
Figure 7. Resonant column/cyclic torsional shear apparatus.
Geosciences 09 00512 g007
Figure 8. G–γ curves from RCTs.
Geosciences 09 00512 g008
Figure 9. D–γ curves from RCTs.
Geosciences 09 00512 g009
Figure 10. G–γ curves from CLTSTs.
Geosciences 09 00512 g010
Figure 11. D–γ curves from CLTSTs.
Geosciences 09 00512 g011
Figure 12. G–γ curves from RCTs and CLTSTs.
Geosciences 09 00512 g012
Figure 13. D–γ curves from RCTs and CLTSTs.
Geosciences 09 00512 g013
Figure 14. G/Go–γ curves from RCTs. (a) Type A; (b) Type B.
Geosciences 09 00512 g014
Figure 15. G/Go–γ curves from CLTSTs. (a) Type A; (b) Type B.
Geosciences 09 00512 g015
Figure 16. D–G/Go curves from RCTs. (a) Type A; (b) Type B.
Geosciences 09 00512 g016
Figure 17. D–G/Go curves from CLTSTs. (a) Type A; (b) Type B.
Geosciences 09 00512 g017
Figure 18. G/Go–γ curves from RCTS and CLTSTs by [55]. (a) Type A; (b) Type B.
Geosciences 09 00512 g018
Figure 19. D–G/Go curves from RCTS and CLTSTs by [55]. (a) Type A; (b) Type B.
Geosciences 09 00512 g019
Figure 20. Cyclic triaxial apparatus.
Geosciences 09 00512 g020
Figure 21. E/Eo–ε curves from CLTxTs.
Geosciences 09 00512 g021
Figure 22. D–ε curves from CLTxTs.
Geosciences 09 00512 g022
Figure 23. Stable cycles from CLTxT.
Geosciences 09 00512 g023
Figure 24. Unstable cycles from CLTxT.
Geosciences 09 00512 g024
Figure 25. Δu–ε curves from CLTxTs.
Geosciences 09 00512 g025
Figure 26. G–γ curves from CLTST and CLTxT.
Geosciences 09 00512 g026
Figure 27. D–γ curves from CLTST and CLTxT.
Geosciences 09 00512 g027
Figure 28. Seismic dilatometer equipment (a). Schematic layout of the flat dilatometer test (b) and of the seismic dilatometer test (c).
Geosciences 09 00512 g028
Figure 29. Example of seismograms obtained by SDMT at the site of the “Ritiro viaduct”.
Geosciences 09 00512 g029
Figure 30. Results of the SDMTs (SDMT 4a) in terms of geotechnical parameters.
Geosciences 09 00512 g030
Figure 31. Go obtained from SDMT, RCT, and empirical correlations.
Geosciences 09 00512 g031
Table 1. Particle size analysis for the "Ritiro viaduct" area.
BoreholesType of SoilH[m]Gravel
[%]
Sand
[%]
Silt
[%]
Clay
[%]
dmax
[mm]
D60
[mm]
D10
[mm]
Cu
[-]
S15C1A5.4511.0956.1630.712.03<9.50.18980.012415.31Sand and gravelly silt of light gray color
S28C1A9.327.8266.0623.312.80<19.00.11200.01806.22Silty sand of light brown color
S28C2A15.300.3554.3544.670.63<9.50.06990.01156.08Sand and silt of dark gray color
S17C3B16.7547.8843.048.330.76<9.53.55200.068052.24Gravel and silty sand of dark brown color
S7C2B19.7521.3361.5214.682.47<9.50.57300.017133.51Sand and silty gravel of dark gray color
S17C4B21.7521.6866.3411.170.81<19.00.73600.035420.79Sand and silty gravel of dark brown color
S28C4B24.800.2491.008.760.00<4.750.49570.09055.48Sand lightly silty of light gray color
S7C4B31.2517.1858.2221.642.96<9.50.35320.010234.63Sand and silty of light gray color
S17C7B34.7534.4155.568.971.06<9.51.60100.063025.41Sand and silty gravel of dark brown color
Type of soil A = soil with minor gravel; Type of soil B = soil with major gravel; H = depth; dmax = maximum diameter; D60 = the particle-size diameter for which 60% of the sample was finer; D10 = the particle-size diameter for which 10% of the sample was finer; Cu = uniformity coefficient.
Table 2. Mechanical characteristics for the “Ritiro viaduct” area.
BoreholesType of SoilH [m]γ [kN/m3]D60 [mm]Cu[-]Gs[-]eo [-]emin [-]emax [-]Dr [%]CF [%]
S15C1A5.4516.080.1915.32.670.630.390.6817.242.03
S28C1A9.3218.240.116.22.800.570.440.6948.002.80
S28C2A15.3020.710.076.12.620.590.490.7154.550.63
S17C3B16.7515.183.5552.22.490.640.520.7240.000.76
S7C2B19.7516.430.5733.52.670.630.410.8448.842.47
S17C4B21.7516.800.7420.82.750.640.510.7031.580.81
S28C4B24.8016.500.495.52.600.640.530.8059.260.00
S7C4B31.2516.970.3534.62.690.670.370.7928.572.96
S17C7B34.7517.031.6025.42.690.580.490.6543.751.06
Type of soil A = soil with minor gravel; Type of soil B = soil with major gravel; H = depth; γ = total unit weight; D60 = the particle-size diameter for which 60% of the sample was finer; Cu = uniformity coefficient; Gs = specific gravity; eo = initial void ratio; emin = void ratio of soil in densest condition; emax = void ratio of soil in loosest condition; Dr = relative density; CF = clay fraction.
Table 3. Test condition for the "Ritiro viaduct" area.
BoreholesType of SoilH [m] σ v c   [ kPa ] TestGo (1)
[MPa]
Go (2)
[MPa]
Go (3)
[MPa]
Eo
[MPa]
Δumax
[kPa]
S15C1A5.45100RCT–CLTST515421--
S28C1A9.32180RCT–CLTST10583324--
S28C1A9.32400CLTxT---102134
S28C2B15.30180RCT–CLTST9587161--
S17C3B16.75300RCT–CLTST123107163--
S7C2B19.75300RCT–CLTST149121269--
S17C4B21.75350CLTxT---209344
S28C4B24.80200RCT–CLTST10999378--
S7C4B31.25600RCT–CLTST160135---
S17C7B34.75400RCT–CLTST 158142---
S17C7B34.75400CLTxT---74381
Type of soil A = soil with minor gravel; Type of soil B = soil with major gravel; H = depth; U = undrained; RCT = resonant column test; CLTST = cyclic loading torsional shear tests; CLTxT = cyclic loading triaxial test; Go (1) from RCT, Go (2) from CLTST after 24 h, Go (3) from seismic dilatometer Marchetti test (SDMT).
Table 4. Soil constants for the "Ritiro viaduct" area from RCTs and CLTSTs.
TestType of Soilα [-]β [-]η [-]λ [-]
RCTA180.9214.51.7
RCTB130.90182.2
CLTSTA110.97453.1
CLTSTB100.95653.5

