Article

An Assessment of Stress States in Passive Margin Sediments: Iterative Hydro-Mechanical Simulations on Basin Models and Implications for Rock Failure Predictions

1
IFP Energies nouvelles, 1 et 4 avenue de Bois-Préau, 92852 Rueil-Malmaison, France
2
Total ABK, East Tower, Mall Street 10, Abu Dhabi 4058, UAE
3
Total SA, CSTJF, Avenue Larribau, 64000 Pau, France
*
Author to whom correspondence should be addressed.
Geosciences 2019, 9(11), 469; https://doi.org/10.3390/geosciences9110469
Submission received: 21 October 2019 / Revised: 1 November 2019 / Accepted: 4 November 2019 / Published: 6 November 2019

Abstract

:
Capturing the past and present hydro-mechanical behavior of passive margin sediments raises noticeable interest, notably in geo-hazard risk assessment and hydrocarbon exploration. In this work, we aim at assessing the stress states undergone by these sedimentary deposits through geological time. To do so, we use an iterative coupling between a basin simulator and a finite element mechanical solver. This method conciliates a computation of the full stress tensors with a dynamic and geologically detailed modelling of the sedimentation. It is carried out on a dedicated set of 2D synthetic basin models, designed to be representative of siliciclastic deposition in passive margins and integrating variations in their geological history. Contrary to common assumptions in operational basin modelling studies, our results imply that passive margin sedimentary wedges are multidimensional mechanical systems, which endure significant non-vertical stress without external tectonic input. Our results also highlight the variability of the stress states through space and time, with a strong control from the geometry and lithological heterogeneities of the deposits. Lastly, we used the simulation results to predict a location and timing for the development of weakness zones in the sedimentary stacks, as privileged areas for rock failure. The outcome underlines the influence of the basal tilt angle, with a slight tilt impacting the wedges stability to a similar extent as a substantial increase in sedimentation rate. Altogether, this study emphasizes the need for careful consideration of non-vertical stresses in basin simulations, including in passive tectonic contexts. It also suggests that the iterative coupling method employed is a promising way to match industrial needs in this regard.

1. Introduction

Passive margins represent a cumulated length of 105,000 km of coastal areas around the world and are privileged locations for marine sediment deposition [1]. They are well-studied environments, notably in terms of morphology, geology, and underground resources [2,3]. On the latter topic, passive margins are historically key areas in the hydrocarbon industry, as they host more than 300 giant oil and gas fields [4].
Passive margin sediments are subject to a large range of hydraulic and mechanical phenomena, which creates specific interests. Remarkably, understanding their hydro-mechanical behavior is critical in civil engineering and geo-hazard prediction, as passive margin sediments are naturally likely to collapse at local or regional scales [5,6]. In petroleum exploration, analyzing slope instability and mechanical compaction through geological ages helps to accurately estimate the location of distal sand reservoirs and their volumes at the present time [7,8]. Furthermore, in all conventional petroleum systems, hydrocarbon migration is controlled by gradients of fluid overpressure and impacted by natural fracturing of cap rocks [9,10]. Lastly, assessment of present-day pore pressure appears as a crucial step to ensure drilling safety [11,12].
In the present study, our objective is to assess the stress states undergone by siliciclastic sediments in passive margins and the development of weakness zones as favorable locations for rock failure. To do so, our simulation strategy is rooted on an iterative hydro-mechanical coupling between a basin simulator, ArcTem [13], and a finite element mechanical solver, Code Aster [14]. The hydro-mechanical coupling was applied on a set of synthetic basin models, designed with the target to be representative of siliciclastic sedimentation in passive margins and of operational models in the hydrocarbon industry. This aims at depicting the stress states endured by the different parts of the sedimentary wedges through deposition, with an emphasis on non-vertical effects. Our goal is also to appraise how basal slope tilting and sedimentation rate variations affect the location and expansion of weakness areas, thus addressing the geological control on rock failure preconditioning through passive margins history.

2. Observations

Passive margins are locations of siliciclastic sediment accumulations, up to 12 km thick [15]. These accumulations usually consist of a stacking of several stratigraphic units, following well-described patterns in terms of geometry and lithology [16]. Most layers present a clinoform shape, with maximal slopes ranging from 1 to 10° in siliciclastic environments [17].
Passive margin deposits are highly compactable and experience significant volume reduction, but important under-compaction and fluid overpressure are also observed [18]. This excess of pore pressure is notably induced by high sedimentation rates and low permeability layers, keeping the hydrodynamic system out of equilibrium [19,20]. Sequence stratigraphy patterns, controlling the relative distribution of sealing shaly facies and draining sandy ones, reflect on the pore pressure profiles and cause substantial lateral flows [21,22].
Sedimentary wedges in passive margins are dynamic and unstable systems, leading to failure events of different scales and amplitudes. Locally, buried and overpressured sediments are prone to natural hydraulic fracturing, known to damage the sealing capacity of shaly layers [23,24]. At a larger scale, instability can lead to the failure of the sedimentary slope, triggering important mass transport, from superficial sliding to wider slumping and even broad landslips [25,26,27,28,29,30]. Lastly, at a regional scale, gravity collapse of passive margin sediments set common structural features, with normal faulting observed in the proximal part of the wedge and fold-and-thrust belts in the most distal areas [31,32].
Although punctual and exceptional events are often needed to trigger the amplest incidents, failure at all scales is favored by preconditioning factors resulting in weakness areas in the sedimentary stack [5,6,33]. Pore pressure rise is noted as a key factor, in relation to sealing lithology or high deposition rates [34,35,36,37]. However, the geometrical evolution of the wedge is also reported to play a major role in its destabilisation, with an influence of the clinoform slopes [38,39], progradation rates [40], and basal angles [41,42]. Lastly, mechanical heterogeneities can be decisive, with regional collapses facilitated by deep low-friction layers, for instance evaporites [43] or overpressured shales [44].

3. Simulation Strategy

3.1. Traditional Approaches

Several methods are described in the literature to model the hydro-mechanical behavior of passive margin sediments. They can be sorted into two main families.
A first approach relies on slope stability analysis. It covers a range of methods of increasing complexity, including critical Coulomb wedge theory, infinite slope and limit analyzes, their combinations, and their extensions [45,46,47,48,49,50,51]. These methods use slope and pore pressure estimates to compute the shear stress and the rock strength, leading to a likelihood of failure for the wedge. However, they are often based on a strong idealization of the sedimentary stack, notably in terms of geometry, lateral facies variations, and overpressured layers [6]. In addition, this kind of modelling is essentially static. Even when it is implemented in a sequential manner, each time step remains independent from the previous ones, with no consideration of fluid flows and past stress states [52].
A second approach relies on basin simulation technologies [53,54,55,56,57,58,59]. From a representation of the basin at the present day, the evolution of its geometry through geological ages is restored with a backward process. Then, the physical variables of interest are computed for each geological event with a forward simulation using this geometrical framework. This methodology can handle a high degree of realism in the description of the sedimentary deposits, notably in terms of slope breaks, truncated layering, lateral lithological heterogeneities, and complex overpressure distribution. The resulting models are also intrinsically dynamic: the simulation results at a given geological age are strongly dependent on the flow and stress history of the margin, and they are also significantly impacted by the evolutive geometry previously restored [60].
Nonetheless, using basin simulation methodologies, it is classical to reduce the stress state to its sole vertical component, to overcome numerical complexity or absence of calibration data [56,57,61,62]. Implicitly, the contribution of lateral efforts to porosity loss, fluid overpressure build-up and system instability is then estimated as marginal. Horizontal stresses are often considered as direct functions of the burial depth or simple ratios of the vertical stress. In the latter case, the ratios are homogenous in the sedimentary stack or solely variable with depth and lithology [57,63].
The limitations of the usual stress state simplification and their impact on hydro-mechanical simulation results have already been documented [64,65]. Notably, they can imply incorrect estimates for sediment compaction and rock failure likelihood. In a petroleum exploration context, this may produce misleading conclusions on cap rock integrity, migration flowpaths, and present-day overpressure. These observations motivated the design of several alternative methods aiming to better account for the 3D nature of the stress tensor [66,67]. Nevertheless, the focus is traditionally on basins overcoming important lateral tectonic solicitations, with large shortening or extension rates. As a result, the value of integrating non-vertical stresses in the modelling of passive geological settings appears more questionable, especially when considering the associated increase in computation costs. Basin modellers often deal with passive margin sediments as one-dimensional mechanical systems through geological ages [68,69,70], in line with simplistic models for horizontal stresses computation and the assumption that the maximal principal stress is perfectly aligned with the vertical axis [18].

3.2. Iterative Hydro-Mechanical Coupling

In this work, we aim at conciliating the geological realism and dynamic aspect of basin simulations with the integration of lateral mechanical effects. To do so, we use a coupling between two codes: ArcTem, a basin simulator [13], and Code Aster, a finite element mechanical solver [14]. ArcTem relies on the classical 1D stress simplification while Code Aster computes a full stress tensor.
The coupling is implemented in a prototype software named A² [71]. Following an iterative procedure, the two codes exchange inputs and outputs at each simulation step, until providing a consistent set of porosity, permeability, fluid pressure, and stress tensor in each cell of the basin model. This differs from the integrated numerical model of [72] but shares similar objectives.
The coupling algorithm uses an updated Lagrangian approach and is inspired from the work of [73] and [74] for reservoir simulations. The same grid is used by the two codes and the convergence criterion is based on a comparison between the porosity values they compute. A full description can be read in [71] and [75].

3.3. Rheology

The ArcTem simulator uses a direct relationship between porosity and vertical effective stress, known as the Schneider’s law [76,77]. This law is widely used in the basin modelling community for its practicability, notably to reproduce porosity–depth data measured from cores or well logs [57].
In the iterative coupling, we model the rheology of passive margin sediments with a tensor extension of the Schneider’s law. Concretely, the model describes an elasto-plastic behavior, with the rock stiffness varying with compaction. It accounts for the full stress tensor but is designed to trigger the same volume variations as the Schneider’s law in the case of tabular sedimentation with no lateral deformation (i.e., oedometer test conditions). It is presented in detail in [71]. Other relevant models describing sediment compaction can be found in the literature [78,79]. However, we see the one used herein as a suitable compromise with several practical needs, notably applicability on geologically detailed passive margin models, easy comparison with classical basin simulators, and integration in the iterative coupling at a reasonable computation cost.

4. Set of Synthetic Basin Models

This study relies on a dedicated set of five synthetic 2D basin models, designed to be representative of actual siliciclastic sedimentation in passive margins. They share a common design, but differ in geological history, with variations in basal slope tilt and sedimentation rate.

4.1. Design

4.1.1. Geological Setting

Our modelling work focuses on a few stratigraphic sequences of siliciclastic deposition. It aims at representing the sedimentary dynamics classically observed in a passive margin, notably the morphology of stratigraphic system tracks, with gradating deposition, discordant stratification, and lateral facies’ variations. These geological features are commonly integrated in operational basin models of the petroleum industry, but more rarely in published hydro-mechanical simulations, as they often involve a higher level of idealization.
Among other inspirations, the modeled sequences can be related to the sediments of Eocene age in the Brazilian oil-bearing Santos basin, as described in [80]. In this example, they were deposited in a relatively short amount of space and time (30 km and 12 My). More generally, the modeled sequences represent common sedimentation patterns, but the accumulations in passive margin basins usually consists in their repetition through longer time periods and deposited volumes. Consequently, the structural evolution of passive margins at large time or space scales (i.e., hundreds of km and My) is beyond the scope of this work.

4.1.2. Common Features

All models in the set correspond to a 33 km long section and a succession of 40 gradating sedimentary layers, distributed in stratigraphic sequences of transgressive, highstand, lowstand, and turbiditic system tracks (Figure 1). The sedimentation is globally prograding and most layers present a clinoform morphology, with a slope dipping up to 10°. This angle refers to the highest value measured in clastic deposits on passive margins around the world [17]. Maximum sediment pile thickness is 3 km. Under the sediments, 2 km of a stiff geo-material are previously set up to create a hard basis to the model.

4.1.3. Variations between Models

Keeping a common design, we introduced different geological histories for the models in the set. Our objective is to appraise the geological control on failure preconditioning in passive margin sediments, and to assess the development of weakness areas in terms of timing and expansion. Among the numerous geological factors varying through a margin history, we specifically focused on the sedimentation rate and on the angle of the basal slope, which usually undergoes a progressive tilt during the subsidence of the sedimentary stack.
High sedimentation rates favor fluid overpressure build-up, and in the literature previous physical simulations illustrate how rapid deposition can create weakness zones in deeply buried parts of the sedimentary wedges [35,46]. However, weakness and rock failure are also observed in margins with slow sedimentation, and other published simulation studies showed that additional preconditioning factors than overpressure should be considered [33,49]. In this regard, the models presented in this work are a way to specifically evaluate the impact of the basal angle tilt during sedimentation.
Table 1 presents the three sedimentation rate scenarios simulated in this study. In each case, a specific duration is assigned to all sedimentation events regardless of their thickness, which makes the sedimentation rate vary with time. However, the resulting values are consistent with the ones estimated on actual passive margins around the world [26,81,82]. Table 2 presents the three tilting scenarios simulated. In every model, the bottom horizon starts horizontal and then tilts at an increment angle at each transgressive event, until reaching the target value in the present day.

4.2. Present-Day Grids

For all models, a grid was built from the present-day geometry by dividing the 40 layers by 70 vertical pillars. The total number of cells is then 2760, but 47% of them are flattened because of the discordant nature of the sedimentation.
The sediments were filled with five lithological types, representative of different shale-sand proportions: “sandy” (70% sand 30% shale), “intermediate” (50% sand 50% shale), “quite shaly” (30% sand 70% shale), “shaly” (20% sand 80% shale), and “very shaly” (10% sand 90% shale). High-stand and transgressive system tracks are wholly filled with “very shaly” facies, turbiditic deposits are wholly filled with “sandy” facies, and low-stand system tracks show the full gradation from “sandy” to “very shaly” based on distality (Figure 2).

4.3. Past Geometries

The restoration of past geometries for all models was performed with a backstripping method [83,84], implemented in the TemisFlowTM software (2016 version, Beicip-Franlab, Rueil-Malmaison, France) [85]. The uncompacting used a different Porosity vs. Depth table for each lithological type. Shalier facies have larger deposit porosities but compact more quickly with burial than the sandier ones (plots available in Figure A1 in the Appendix A).
The model bottom was used as a reference horizon. Its shape was arbitrarily input for each deposition event in order to model a progressive subsidence and tilting for the margin basement, following Table 2. The paleo-bathymetry profiles were then computed by the algorithm from the compaction tables and the basement shape. Lastly, absolute sea level variations were input by translating the full model upward or downward from the 0 mark on the vertical axis. These variations were set in accordance with the sedimentary track being deposited, and keeping the full model immersed during the whole simulation.

4.4. Simulation Parameters

Once built and restored, all models were simulated with the same parameters.

4.4.1. Mechanical Properties
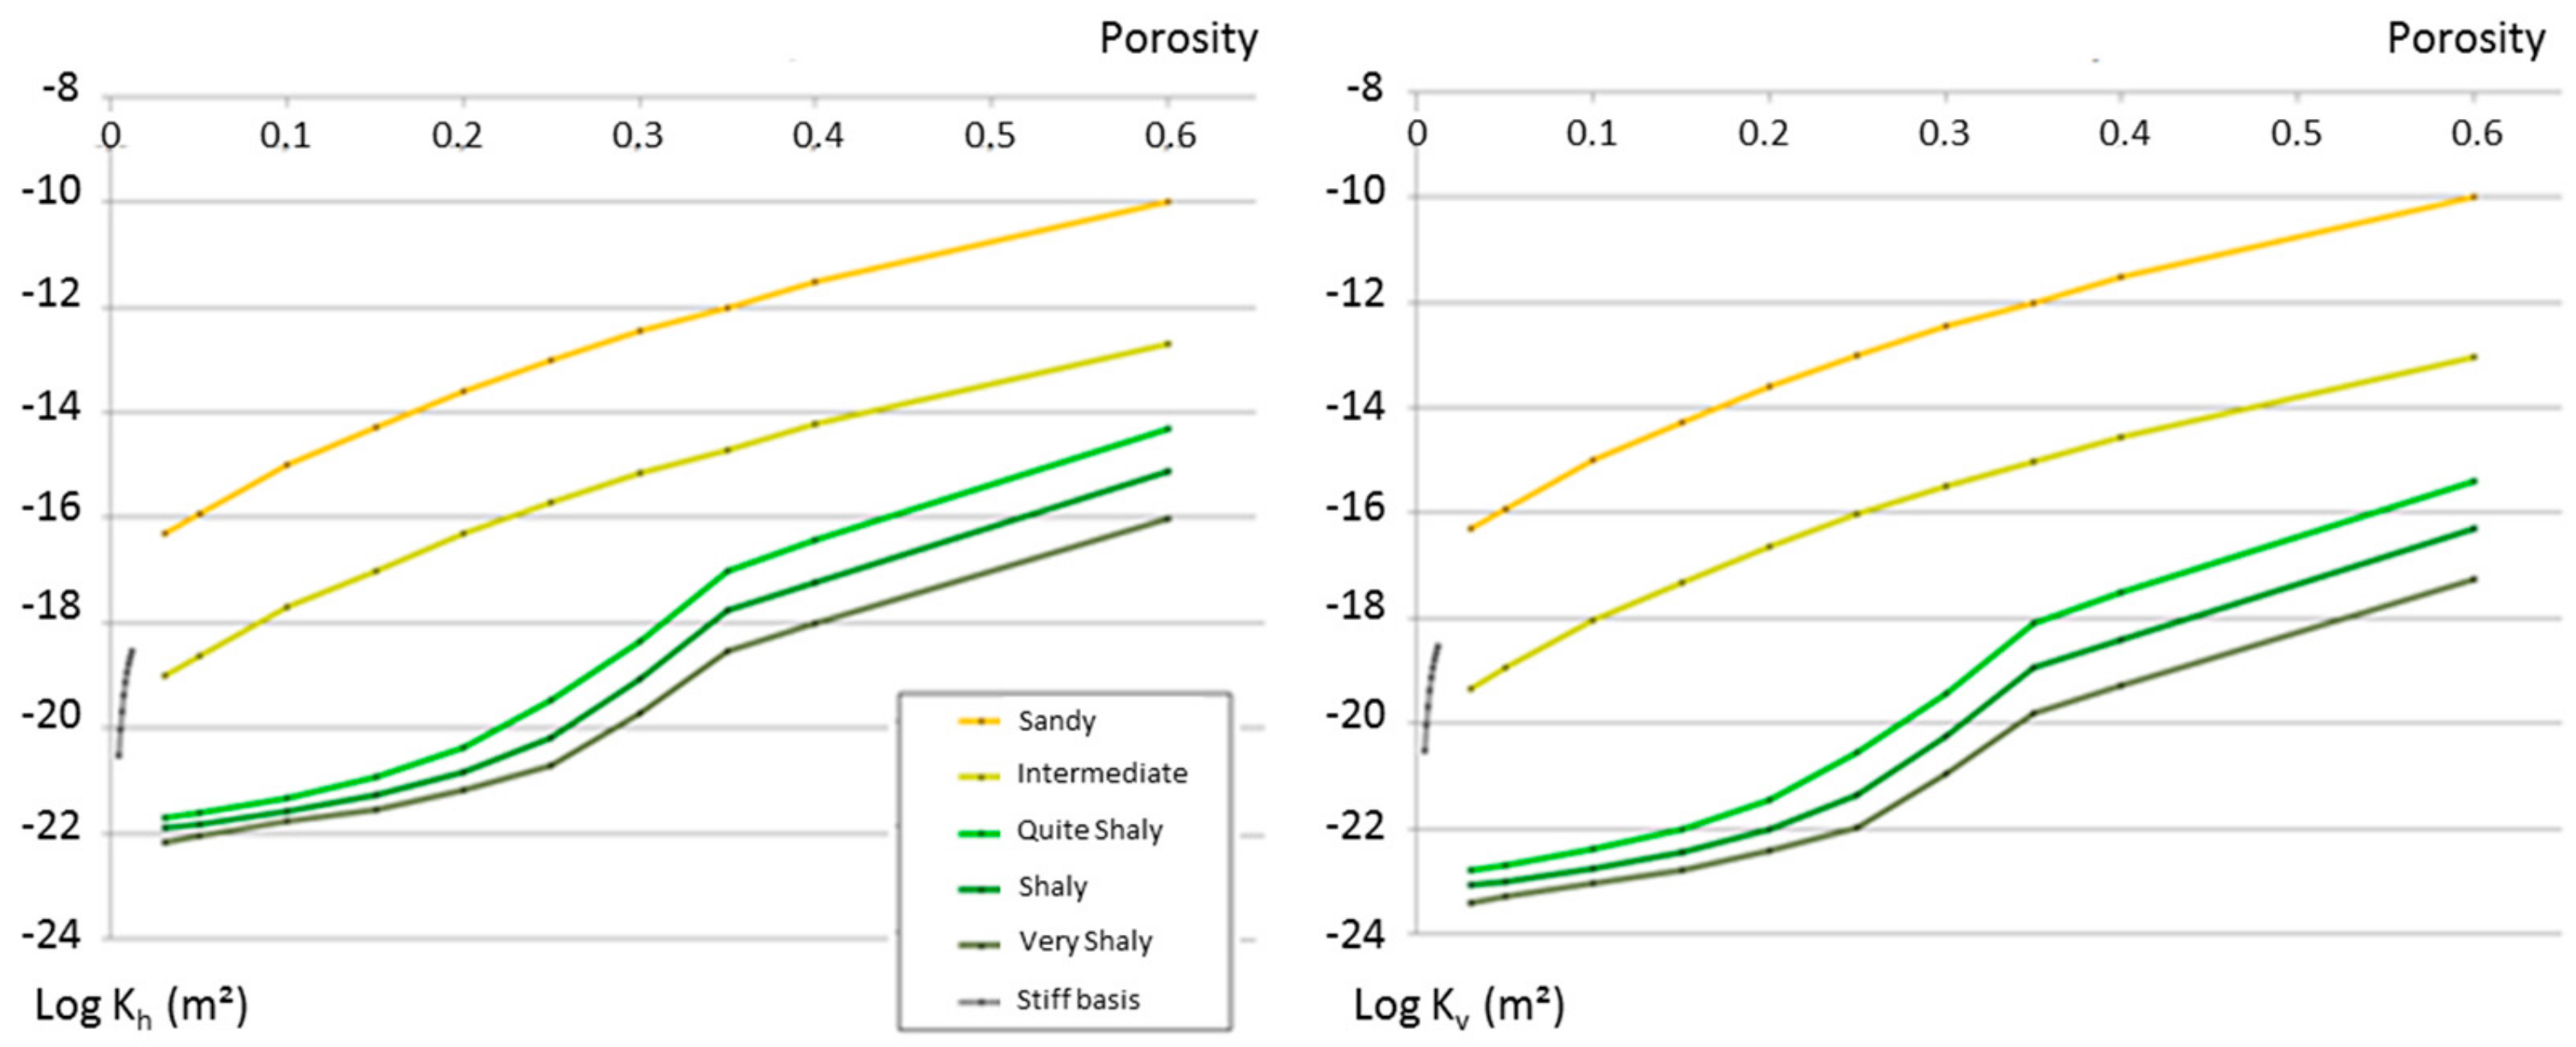
The Schneider’s law and its tensor extension were used with specific coefficients for each lithological type, in order to model different compaction behaviors (plots available in Figure A1 in the Appendix A). These coefficients were all calibrated to be perfectly consistent in hydrostatic conditions with the Porosity–Depth tables used in the backstripping restoration. In addition, the whole model was given a solid density of 2.7 g·cm−3 and a Poisson’s ratio of 0.32, seen as average values for well-consolidated siliciclastic sediments [86,87].

4.4.2. Permeability

Different Permeability–Porosity tables were associated with each of the six facies (plots available in Figure A2 in the Appendix A). These tables were designed to be representative of the actual petro-physical properties of layered siliciclastic sediments at the basin scale. Insights from various references were combined, notably experimental data and empirical relationships for shale rocks [88,89] and sandstones [90,91], literature review [92], and basin-modelling guidelines [57].
For the two sandier facies, permeability decreases with compaction following a classical convex-shaped profile. Still, for the three shalier facies, a high permeability drop is modelled between 0.35 and 0.2 porosity to represent the mineralogical transformations observed during the burial of shaly sediments, with kaolinite-rich clays converting to less permeable illite-rich ones [93]. In addition, permeability anisotropy was added to the model to represent the stratification of the sedimentation. The ratios between horizontal and vertical permeability range from 1 for the sandiest facies to 18 for the shaliest one, in accordance with diverse data available in the literature [57,94,95].

4.4.3. Boundary Conditions

When running the iterative coupling, the geo-mechanical solver was strongly constrained by the backstripping restoration, and no external tectonic loading was added. Practically, the input boundary conditions were fixed nodal displacements for the bottom horizon and normal displacements blocked on lateral boundaries.
The basis was given a very stiff behavior with very little deposit porosity, similar for instance to an intact Barre granite [96]. Its permeability was defined accordingly, from several laboratory measurements on such granites [96,97,98].

5. Simulation Results

In this section, we analyze the simulation results in three steps. First, we observe on the base case model the classical basin modelling outputs which are porosity and pore pressure, to verify their consistency with our modelling objectives. Second, we focus on the additional output provided by the iterative hydro-mechanical coupling technology: a computation of the full stress tensor in every cell of the model at every geological age. We characterize the multidimensional nature of the simulated stress states and appraise their variability through space and time. Lastly, we use the stress tensors simulated to predict the development of weakness areas in the sedimentary stack, seen as favorable locations for rock failure. We benefit from the full set of basin models to compare the influence of two geological factors impacting the sedimentary wedge stability: deposition rate and basal angle tilting.

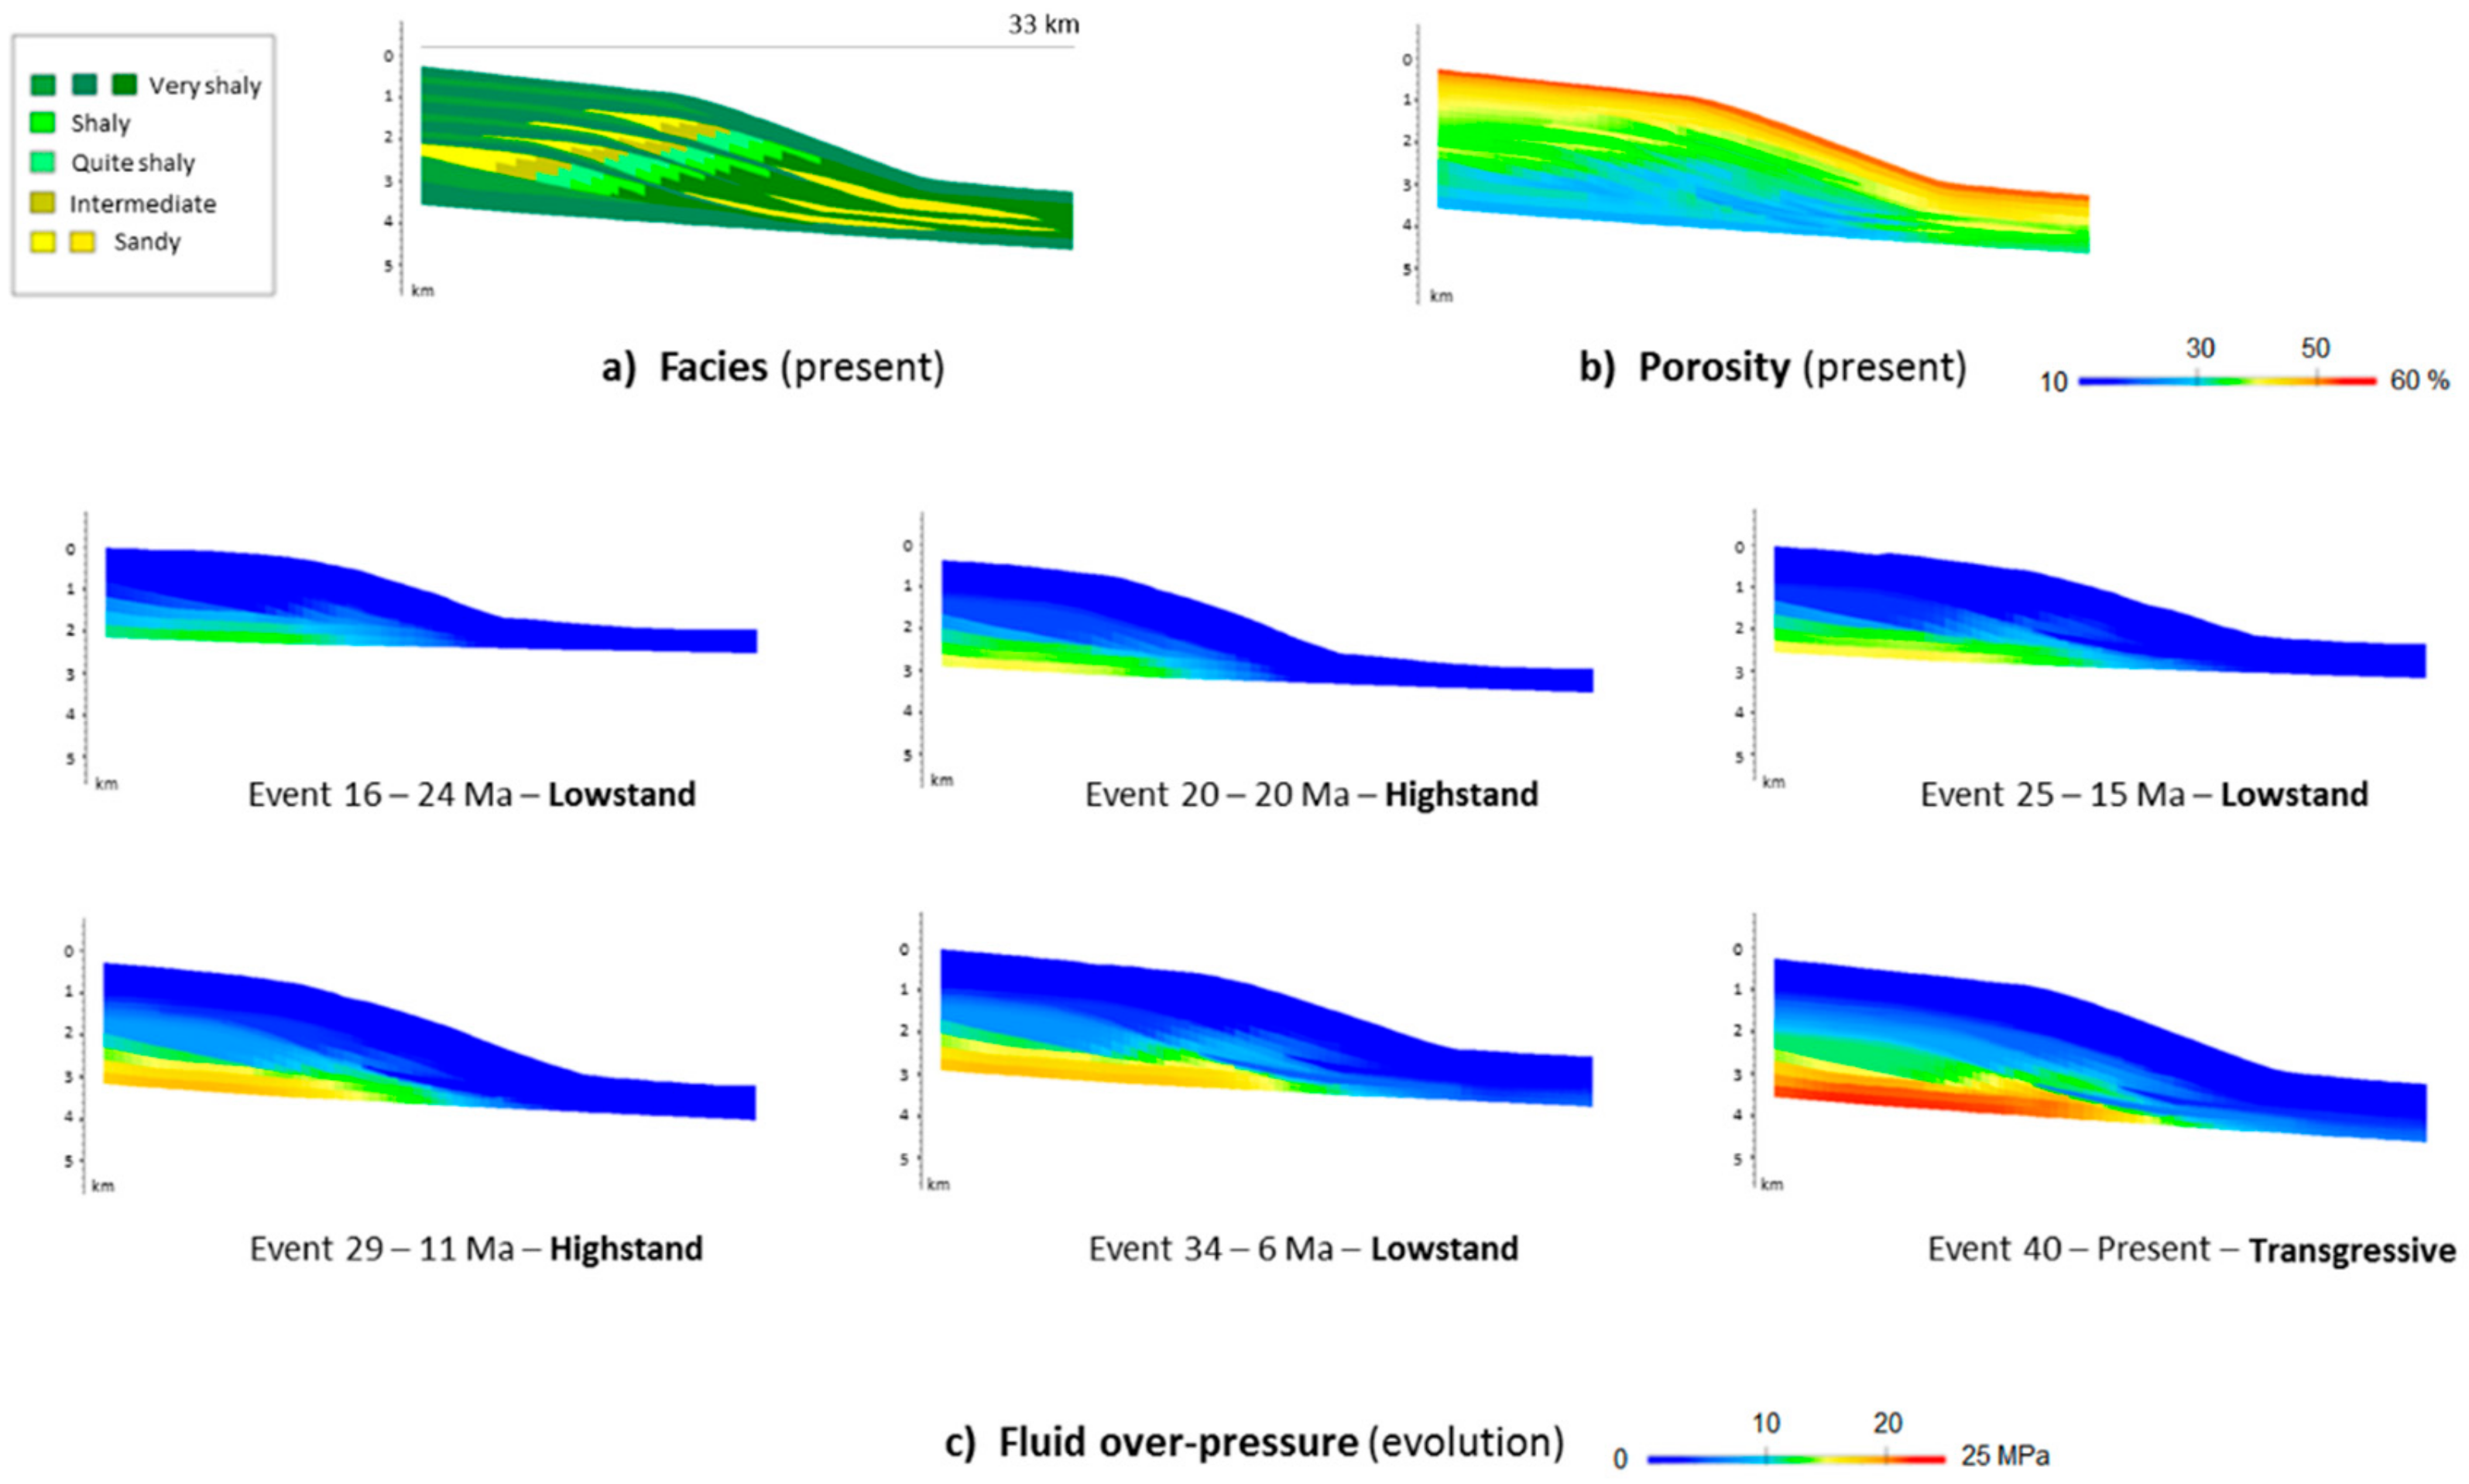
5.1. Pore Pressure and Porosity

Figure 3 depicts the simulation results on the base case model in terms of present-time porosity and fluid overpressure evolution through geological ages. We can assess whether compaction and overpressure levels are sufficient to be representative of actual passive margins, and whether their changes through space and time can be related to the lithology and the geometry of the modelled deposition.
Despite moderate burial, strong overpressure is simulated, with a maximum of 21.8 MPa in the present day. The highest values are located in a proximal and deep area, where the overlying sediment stack is the thickest. The simulated overpressure rises in this area during the deposition of highstand system tracks, increasing its burial. During the deposition of lowstand system tracks, the simulated overpressure rather rises beneath the continental slope, in the previously deposited lowstand wedges. The lateral facies variations then reverberate on the pressure profile: the simulated overpressure build-up concentrates in the inferior part of the wedges, presenting a shaly lithology, while the sandier superior part remains well drained.
Meanwhile, the simulated sediment compaction is significant but not extreme, with the lowest present-day porosity value at 25%, which corresponds to approximately half of the value at deposition. For a given burial, porosity estimations reflect both the lithological heterogeneities and the pore pressure profile, with higher values in the areas of sandy lithology or strong overpressures.
At first-order and considering the strong differences in sediment stack thickness, the simulation results in the present day appear consistent with those previously predicted in real passive margins from seismic data, in situ measurements or idealised basin models, notably in New England [18,34,99], the Gulf of Mexico [36,100] or the Storegga slide area offshore Norway [46].

5.2. Stress States

With the iterative hydro-mechanical coupling, a stress tensor is computed in each cell of the basin model at each geological event. It represents the total stresses endured by the passive margin sediments during this event. In this study, we note S as this stress tensor, X the distality axis oriented from onshore to offshore, and Z the depth axis oriented downward. Consequently, SXX corresponds to the horizontal stress, SZZ to the vertical stress, and SXZ to the shear stress. We use the sign convention with positive compressive stresses. The stress tensor is then diagonalized to determine the principal stresses. We note SMAX the maximum principal stress and SMIN the minimum one. In addition, effective stresses are computed from total stresses and pore pressure values using Terzaghi’s theory [101]. The resulting tensor is noted S .
We note p the confinement pressure, or average effective stress, computed from S :
p =   1 3   ×   ( S X X   + S Y Y   +   S Z Z )
With the confinement pressure, it is possible to isolate the deviatoric part Q of the effective stress tensor:
Q = S p × I
In rock mechanics, the multidimensional nature of the stress states is then commonly characterized by the equivalent deviatoric stress   q , defined as follows:
q =   3   ×     Q   ×   Q 2
The value of this equivalent stress is not necessarily meaningful on its own, and should be compared to the confinement pressure, notably in rock failure predictions. However, from a physical standpoint, a rise in deviatoric stress can be related to two phenomena: (1) development of shear stresses, leading to the rotation of the principal stress system, and (2) higher anisotropy in the principal stresses, leading to a more strongly extensional tectonic regime [102]. Consequently, in the following, we evaluate the significance of these two mechanical effects in our models and consider their variability through space and time, in relation to the lithology and geometry of the sediments deposited.

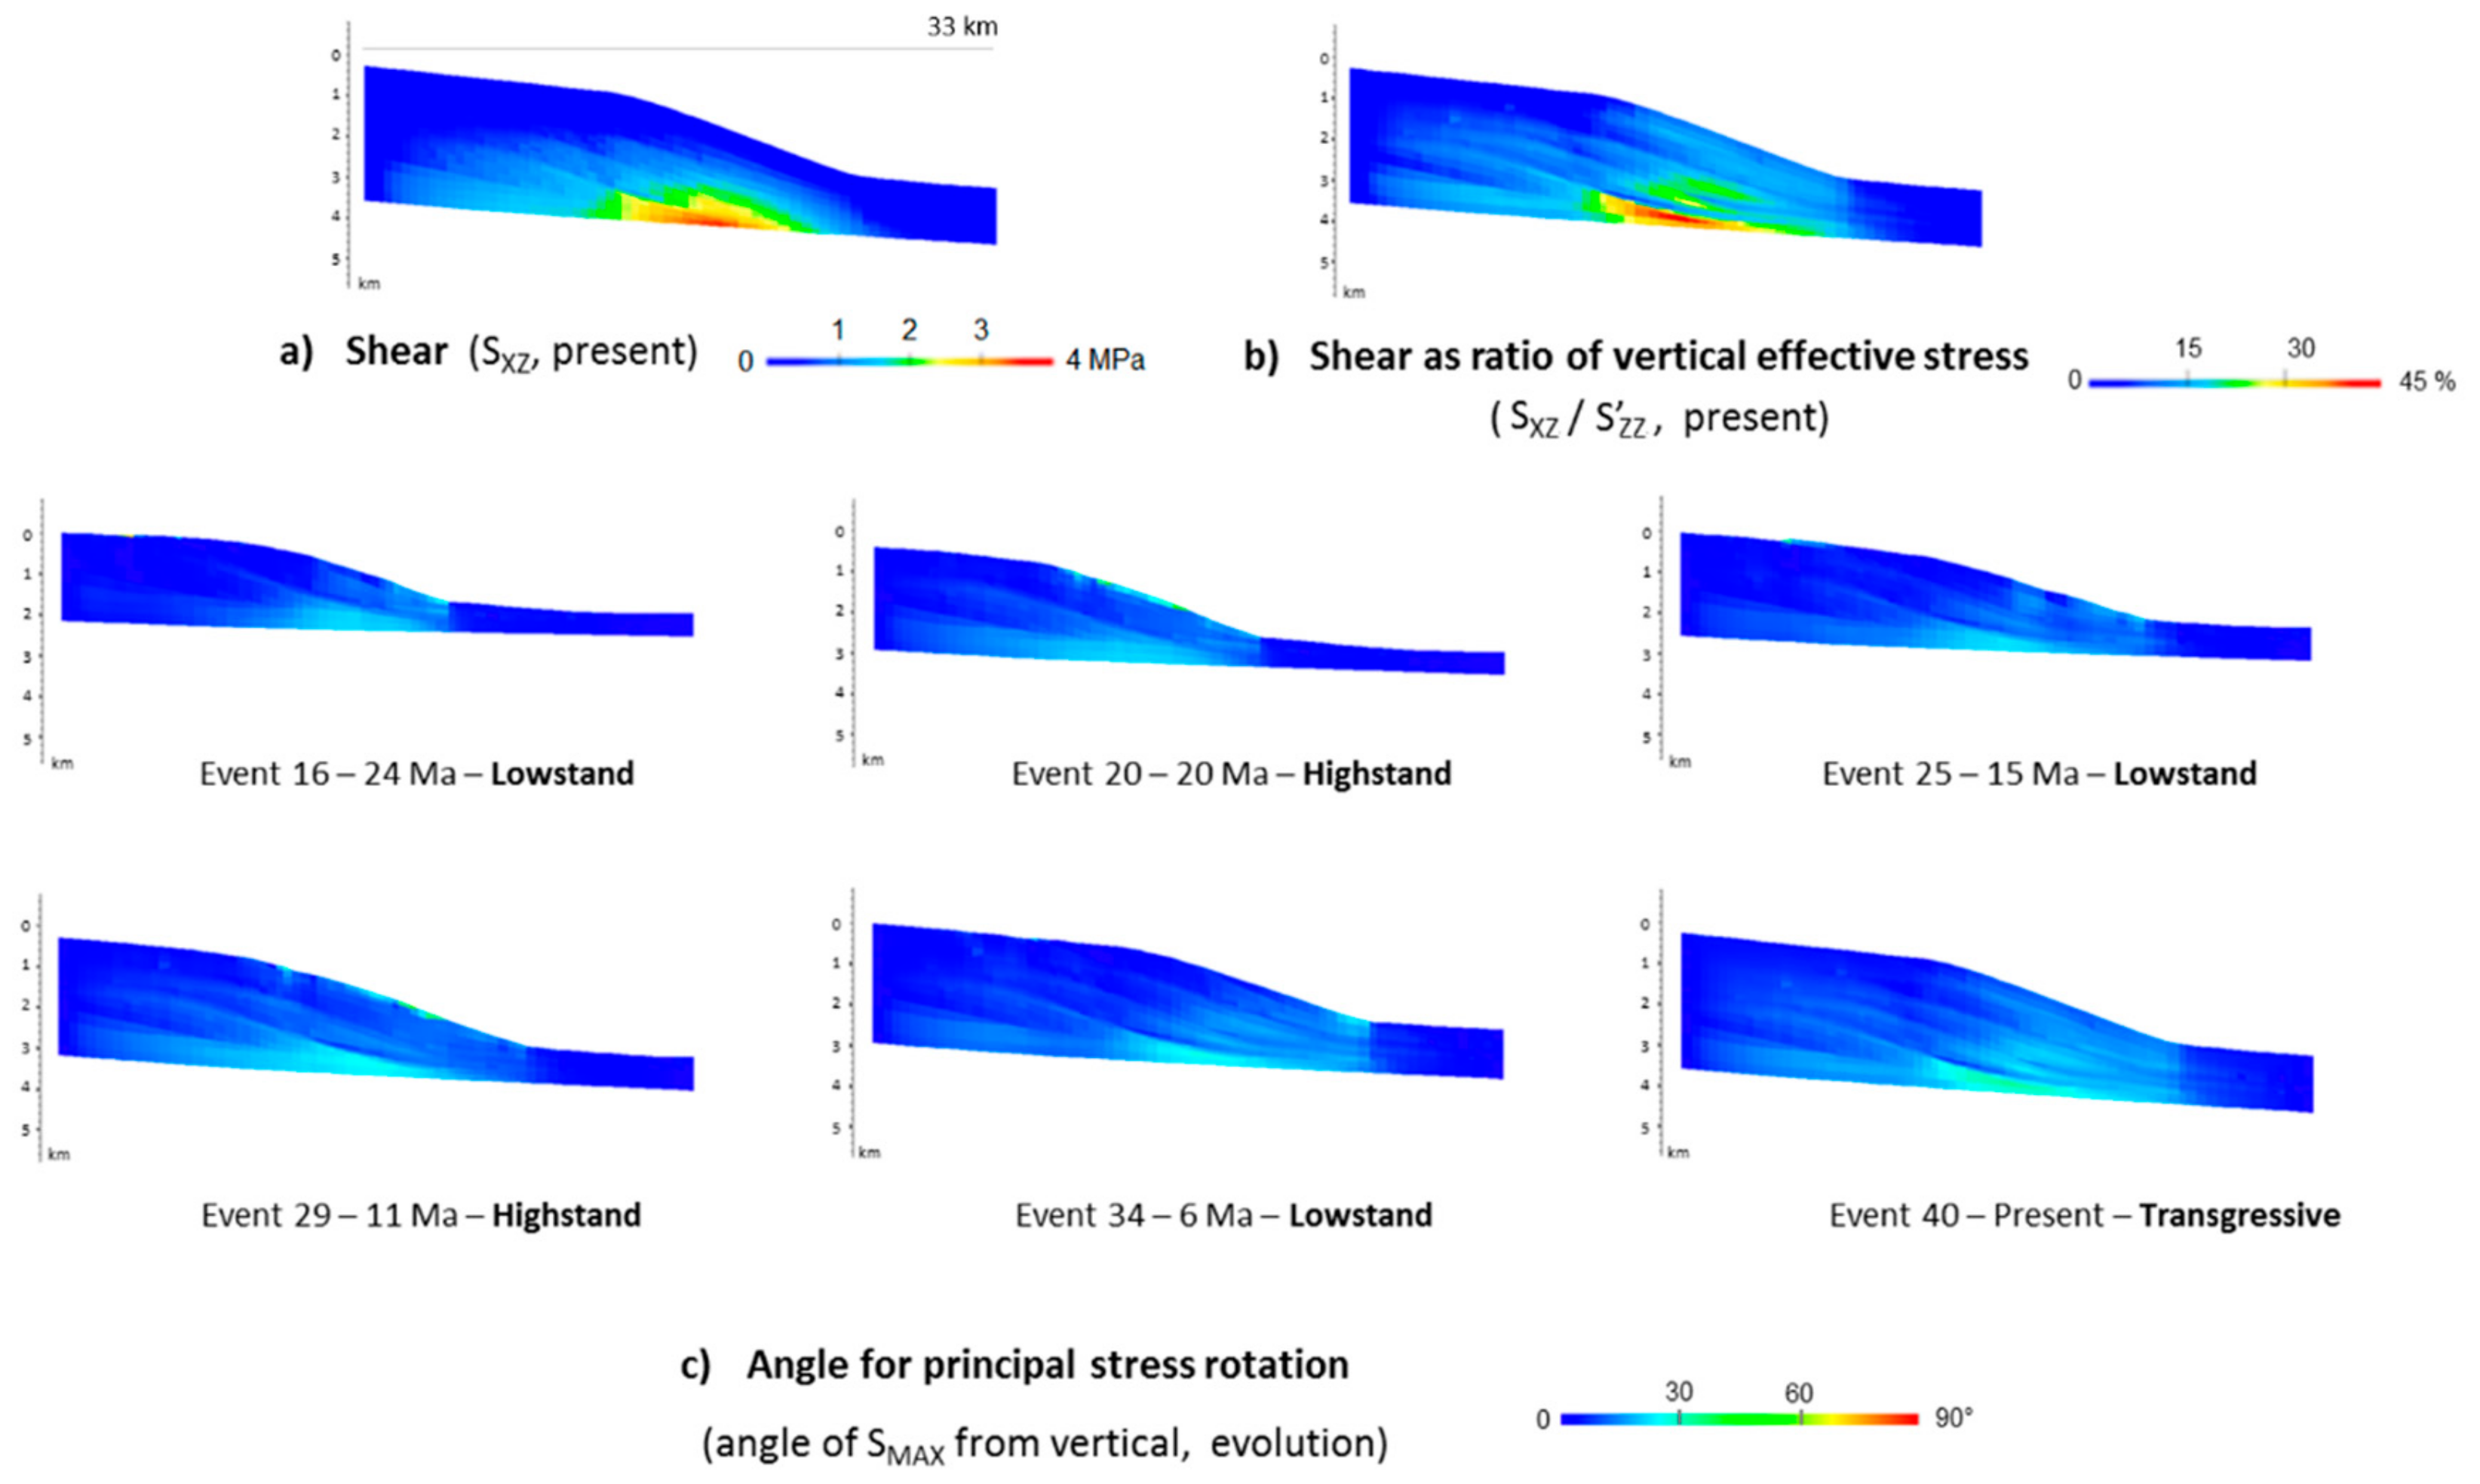
5.2.1. Shear Stress and Rotation of Principal Stresses

The shear stress in the present day simulated on the base case model is presented in Figure 4. The highest absolute values are concentrated in a deep area, located beneath the center of the continental slope. These values are quite moderate, as they do not exceed 3.5 MPa (Figure 4a). However, they appear much more significant when expressed as a ratio of the vertical effective stress. On the base case model, the shear stress in the present day represents up to 40% of the vertical effective stress (Figure 4b). The greatest ratios are simulated in the area of strongest shear but also in the inferior part of the overlying lowstand wedges, where the vertical effective stress is lowered by high overpressure.
Shear stresses reflect on the local rotation of the principal stress system, measurable by the angle from vertical for the orientation of the maximal principal stress. Figure 4c presents these rotations in the margin sediments through geological time, as simulated on the base case model. Rotations up to 32° are observed. The highest rotation angles are found in the area of highest absolute shear, deep beneath the center of the continental slope. However, strong rotations are also simulated in much shallower areas, due to low vertical stresses and sloping geometries for the deposits. These shallow zones of principal stress rotation mostly appear downslope during the deposition of the lowstand system tracks, and upslope during the deposition of highstand system tracks.

5.2.2. Extension and Compression

Even if substantial rotations of the principal stresses are simulated, the angle values displayed in Figure 4c show the normal efforts remains higher than the tangential ones in every part of the model. This means the tectonic regime of all sediments in the model remains extensional through their history. However, the ratio between minimal and maximal principal stresses varies with space and time, delineating areas and ages where the regime nears compression. These variations simulated on the base case model are represented in Figure 5.
A clear zoning is visible in the simulation results: the proximal part of the model hosts the lowest principal stress ratios and the most extensional regimes, while the distal part gets very close to compression with ratios above 95%. This is in line with the structural style commonly observed after the collapse of passive margin sediments. Extensional normal faults usually appear in a proximal section of the wedge and compressional fault-and-thrust belts in a distal one. However, if the principal stress ratios simulated in the distal area remain quite constant through time, those in the proximal area varies significantly with the stratigraphic units being deposited. They appear significantly lower during the lowstand periods, with large areas under 80%, than during the highstand periods, with most of the model above 85%. This can be related to a more proximal and deeply immersed sedimentation during the highstand ages.

5.3. Failure Preconditioning

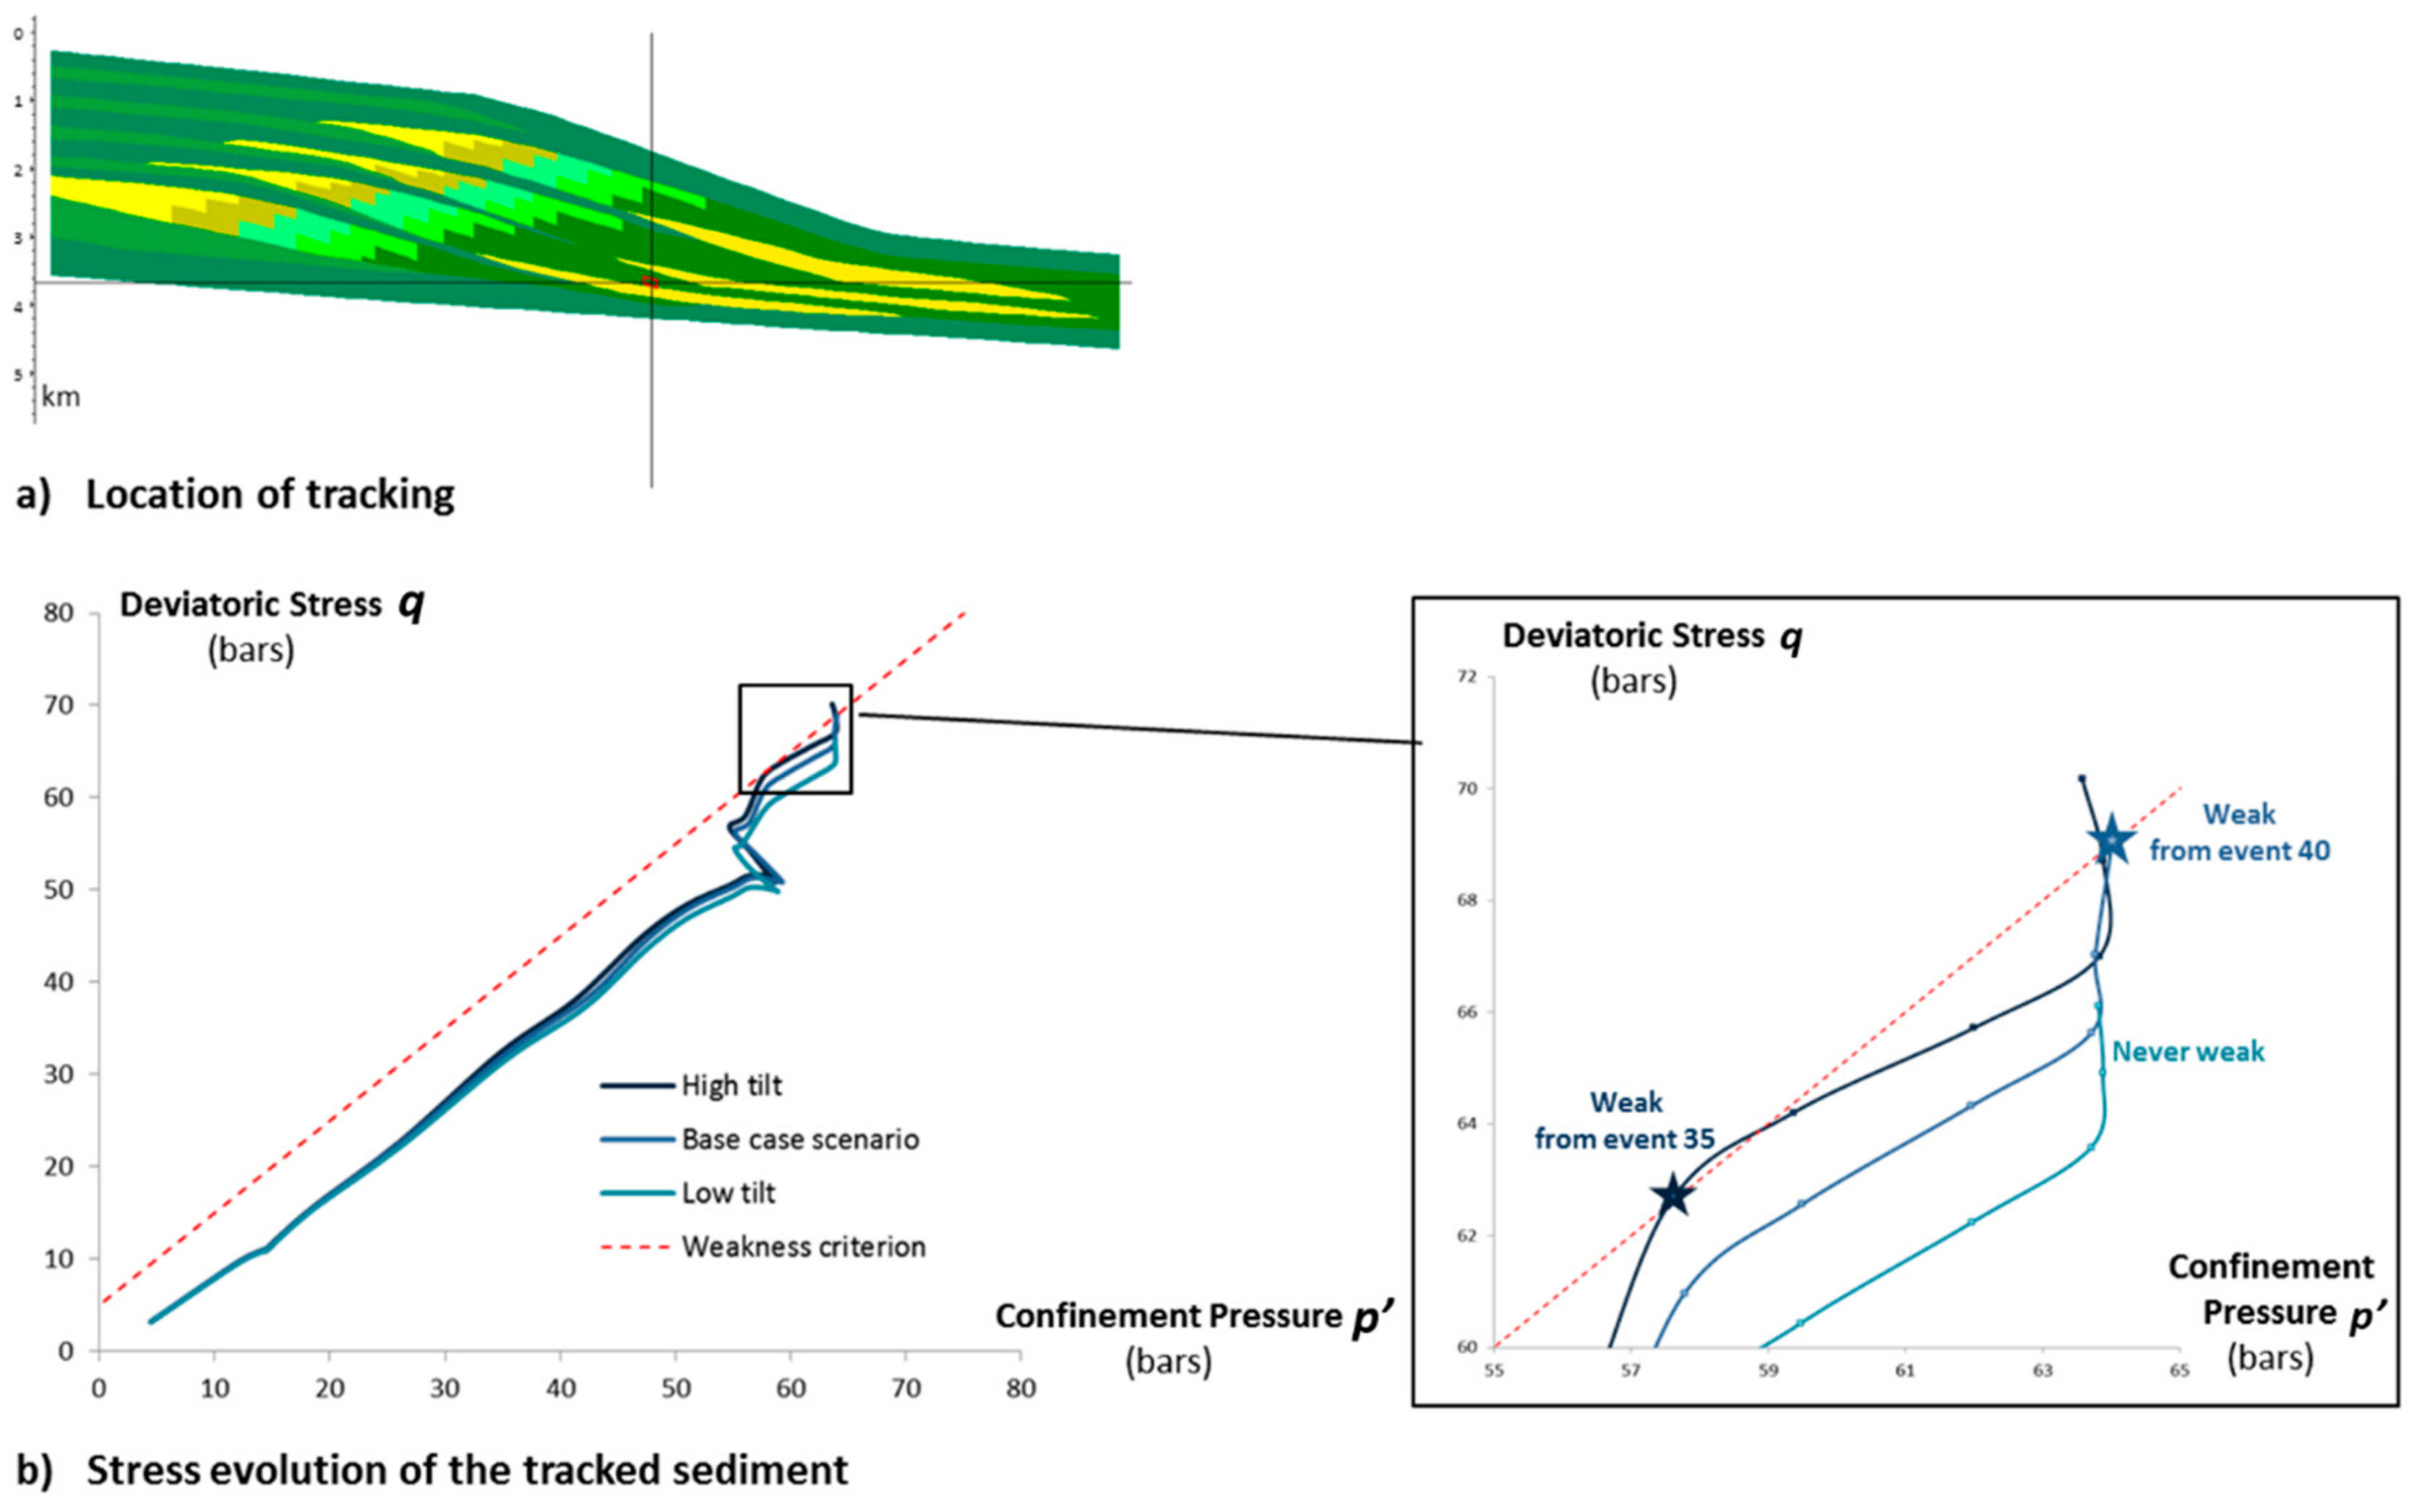
5.3.1. Weakness Prediction

The simulated stress states can be used to estimate a timing and spatial distribution for the development of weakness areas in the sedimentary wedge, considered as privileged locations for local natural fracturing or wider failure initiation. In this study, we introduce a weakness criterion based on the work of [103]. As presented in [71], this criterion corresponds to the shear plasticity threshold of the rheology used in the iterative hydro-mechanical coupling and can be assimilated to a critical state line. It is defined from the confinement pressure and the equivalent deviatoric stress. Concretely, a sediment is considered weak when:
q > A × p + B
A and B are usually deduced from the internal friction angle and cohesive strength of the rock material. In this work, we used A = 1 (friction angle equal to 25°) and   B = 0.5   MPa.
At each geological age in the model, the simulation results are post-processed to highlight the areas above the weakness criterion. It is worth mentioning the permeability of the sediments in these areas remain unchanged, as the criterion is considered to only represent a favorable pre-condition to failure and not directly natural fracturing. However, the corresponding cells in the model are tagged for the rest of the simulation, thus recording the progressive expansion of the weakness in the wedge. Practically, this methodology is only applied on the sediments qualified as sufficiently consolidated, which is previously defined with a porosity cut-off of 35%.
The results on the base case model are presented in Figure 6. The weakness zone in the present day corresponds to 144 cells of the base case model, covering approximatively 10% of the sedimentary wedge. Weakness appears quite late in the sedimentation history, at the 24th event out of 40. It initiates deep beneath the center of the continental slope, in a location of strong shear (visible in Figure 4). Next, the weak area grows downward and upward, forming a stripe roughly parallel to the continental slope, which seems in line with the slip plane orientations commonly observed in passive margin sediments [5,35]. Afterwards, a second weakness stripe initiates at the 33th event, also beneath the center of the continental slope, but in a shallower location. Then, both weakness areas expand through time, until joining in a single continuous weak zone. This result suggests that several levels of different shallowness can simultaneously be preconditioned to failure. This seems also in line with field observations, where superficial slides can coincide with more deeply rooted instabilities [6,26].

5.3.2. Influence of Sedimentation Rate

The influence of sedimentation rate on failure preconditioning is addressed with the variations introduced between the different basin models of the set. The iterative hydro-mechanical coupling was run on the three models described in Table 1 and the development of weakness areas predicted from the simulated stress states. The results are presented in Figure 7.
As expected, a sedimentation rate increase reflects on higher fluid overpressure. For instance, the strongest present-day overpressure simulated in the high rate scenario is 22.7 MPa when it only reaches 20.5 MPa in the low rate one. This leads to a weakness area of earlier initiation and wider expansion. Weakness appears at the 15th event and covers 186 cells in the high rate scenario, when it initiates 10 events later and only covers 88 cells in the low rate one. These differences between scenarios can be explained physically. With high sedimentation rates, the increase in pore pressure engenders a decrease in confinement pressure, while the shear stresses remain identical. Consequently, the ratio between confinement pressure and deviatoric stress rises compared with lower sedimentation rate scenarios, which results in the sediments getting closer to the weakness criterion.
Our physical interpretation can be confirmed by local analyses—for instance, tracking the ratio between confinement pressure and deviatoric stress through time for a given cell and comparing scenarios. Such analysis was carried out for a cell corresponding to deep shaly sediments directly overlying the deepest turbiditic deposits (Figure 8a). In a petroleum exploration context, these sediments could form a sealing cap rock above a sandy reservoir. Assessing their likelihood of failure through geological ages would then be critical to appraise the economic interest of the prospect. The output is displayed in Figure 8b. The decrease in compaction originated by the increase in pore pressure is then clearly visible, with higher sedimentation rates conducing to stress paths shifted leftward in the p - q system. This leads the corresponding sediments to reach the weakness criterion at an earlier age in the high rate scenario than in the base case one, while the criterion is never reached in the low rate hypothesis.

5.3.3. Influence of Subsidence Tilt

Thanks to the variations in subsidence tilt angle introduced between the different basin models of the set, the influence of the basal slope on failure preconditioning can be compared with the influence of sedimentation rate. This aims at providing insights on the instability likelihood in situations of slow sedimentation, and at appraising the relative weight of geometrical factors (such as basal angle, clinoform slopes, or progradation rates) and hydro-dynamical ones (such as sedimentation rate or seal permeability) in the geological control of weakness development through the margin history. The iterative hydro-mechanical coupling was run on the three models described in Table 2, and weaker zones were delineated at each age from the simulated stress states. The results are presented in Figure 9.
An increase in tilt angle, contrary to an increase in sedimentation rate, barely changes the simulated pore pressure. However, it engenders stronger shear stresses and rotations of the principal stresses. In the high tilt scenario, the absolute value of the shear stress S X Z reaches 3.9 MPa when it does not exceed 3.0 MPa in the low tilt scenario. This also leads to an earlier initiation and a wider expansion of the weakness area. In this regard, the differences between our tilt scenarios are of similar magnitude as the differences between our sedimentation rate scenarios (visible in Figure 7), and even slightly more. Weakness appears at the 15th event and covers 192 cells in the high tilt scenario, when it initiates 10 events later and only covers 73 cells in the low tilt one.
The physical interpretation for the impact of subsidence tilt on weakness development differs from the sedimentation rates one. With high tilt angles, the average effective stress is merely impacted, but the increase in shear stress results in an increase in deviatoric stress. Consequently, the ratio between confinement pressure and deviatoric stress rises compared with lower tilt angle scenarios, which results in the sediments getting closer to the weakness criterion. This different way of reaching failure-prone conditions is confirmed by analyzing the local stress paths in the basal tilt scenarios, with exactly the same methods as done for the sedimentation rate ones. The output of this analysis is displayed in Figure 10. The increase in deviatoric stress originated by the increase in shear stresses is then clearly visible, with higher subsidence tilts leading to stress paths shifted upward in the p q system. This upward shift has similar consequences as the leftward shift caused by high sedimentation rates. The studied sediments reach the weakness criterion at an earlier age in the high tilt scenario than in the base case one, while the criterion is never reached in the low tilt hypothesis.
The simulations presented herein confirm that geometrical factors like the evolution of the basal angle can be decisive in the destabilisation of passive margin sedimentary wedges. Although the influence of sedimentation rate is more often invoked and more thoroughly studied in the scientific literature, our study indicates a slight tilting of the sedimentary stack can be of equal significance in failure preconditioning. This advocates for not overlooking geological and geometrical uncertainties in petroleum exploration or geo-hazard risk management, as they can crucially impact predictions of local natural fracturing or wider collapse for the passive margin sediments.

6. Conclusions and Perspectives

6.1. Stress States in Passive Margin Sediments

Altogether, our simulation results reflect the complexity of stress states in siliciclastic passive margin sediments. Notably, the geo-mechanical effects simulated are far from purely vertical, with significant rotations of the principal stress system and stress regimes nearing compression in the distal part of the wedge. It is noticeable that no external tectonic solicitation is needed to trigger the simulated non-vertical effects. They are only driven by the geometric evolution of the sedimentary wedge, with a moderately sloping clinoform deposition and a slightly tilting basis as the two key features.
Another finding is the variability of the non-vertical mechanical effects through space and time. Their magnitude differs considerably depending on the zone considered in the sedimentary wedge. For instance, in our models, the proximal part of the margin hosts the most extensional regimes, whereas the tangential stresses are close to the amount of the normal ones in the abyssal plain. Meanwhile, the highest shear stresses are concentrated beneath the continental slope. These lateral variations are directed by the geometry of the sedimentary stack and reflect the lithological heterogeneities, inferring a strong geological control on the stress distribution. The magnitude of the non-vertical mechanical effects simulated also changes with the stratigraphic age considered. As an example, the highstand periods coincide with higher principal stress ratios in the proximal area, while the lowstand periods coincide with higher downslope rotation of principal stresses.
The significance and variability of the simulated non-vertical effects suggest their integration in physical simulations worth the computation cost, even when studying passive geological contexts. Our work implies that considering passive margin sedimentation as a one-dimensional mechanical system or assessing non-vertical stresses with too simplistic methods may prove misleading. For instance, simply comparing the simulated pore pressure to 85% of weight of the overlying layers, which is often the default option of industrial basin modelling software, would result in predicting rock failure on the most proximal and deep areas of our models, which host the strongest overpressure values, rather than under the shelf break and the continental slope. Likewise, as the magnitude of non-vertical mechanical effects in our simulations appeared strongly controlled by the changing geometry of the wedge and the represented lithological heterogeneities, modellers should beware of excessive idealization of these two elements considering passive margin sediments.

6.2. Geological Control on Rock Failure Preconditioning

The importance of considering non-vertical mechanical effects in passive margin sediments was further illustrated by comparing the relative impact of sedimentation rate and subsidence tilt on our simulations results in terms of weakness development and failure preconditioning. Our models suggest that the rise in deviatoric stress caused by the tilting of the deposits can affect the stability of the wedge as significantly as the pore pressure rise caused by an increase in sedimentation rate. This could explain how rock failure arises in margins of slow sedimentation with relatively well-drained accumulations. However, appraising the impact of this kind of geological and geometrical uncertainty on rock failure predictions cannot be achieved easily with traditional basin models relying on a one-dimensional mechanical scheme. It requires alternative technologies accounting for the 3D nature of the stress states, as the one used in this study.

6.3. Modelling Hypotheses and Way Forward

This study relies on several modelling choices, and we find it useful to remind the main ones here. A first series of choices relate to the synthetic basin models used for the simulation. Notably, the slope of the modelled clinoforms corresponds to the steepest siliciclastic wedges actually observed. A second series of choices relate to the physical simulation itself. Average values were picked for the solid density and the Poisson’s ratio of the rock material. Thermal effects were neglected for the sake of simplicity and to focus on the hydro-mechanical phenomena. We also chose not to increase the permeability of the sediments reaching our weakness criterion, as it only represents a favorable precondition to failure. Lastly, the rheology law implemented in the coupling remains quite simple and was essentially implemented for its practicability in terms of comparison with classical basin simulations and numerical cost.
The following step in this research would be to apply a similar methodology to an actual passive margin where the results can then be related to abundant geological knowledge. Doing so, the level of geological realism of the models could be further increased by linking the iterative hydro-mechanical coupling with a forward stratigraphic simulator [104]. First attempts in a carbonate platform context are addressed in [105].

6.4. Integration of Non-Vertical Stresses in Basin Simulators

The results of this study highlight the value of integrating non-vertical mechanical effects in basin simulations. In our passive margin context, it notably appeared paramount to appraise the impact of geometrical and geological factors like basal angle tilting on the timing and location of failure preconditioning in the sedimentary wedge. In a petroleum exploration context, this would facilitate estimates and risk assessment for reservoirs’ location and cap rocks’ integrity. Logically, integrating non-vertical mechanical effects is even more crucial in more structurally complex areas, enduring significant lateral tectonic input. Nonetheless, before meeting industrial needs, 3D hydro-mechanical simulators must reach an appropriate compromise between detailed physical models, easy integration in existing basin modelling software, and applicability on operational basin models. This still remains a stimulating topic for research and development activities.
In this work, we appraised a method based on a sequential and iterative coupling between a classical basin simulator and a finite element mechanical solver, as described in [70] and [74]. It showed satisfactory applicability on our set of 2D synthetic basin models, designed to be representative of siliciclastic sedimentation in passive margins, including laterally gradating deposition, discordant stratification, and lateral variations of lithological and mechanical properties. It also proved to be moderately expensive in computation cost as the total simulation time for a given model did not exceed 15 minutes with a standard workstation. Consequently, we consider this method as a promising way to capture and incorporate 3D mechanical effects in basin simulations, notably in an industrial oil and gas exploration context. Further appraisals must include heavier and 3D basin models as well as simulation of hydrocarbon maturation and migration.

Author Contributions

Conceptualization, A.B.; models design and building, A.B. and P.C.; simulator implementation, N.G., J.F., and D.C.; simulations, A.B. and P.C.; results analysis, A.B., N.G., J.F., D.C., and P.C.; article writing, A.B.; article review and editing, N.G., J.F., D.C., M.C.C.S., and T.C.; project coordination and supervision, M.C.C.S. and T.C.

Funding

The study presented in this paper was carried out in the NOMBA project, a scientific partnership between IFP Energies nouvelles and Total [106].

Acknowledgments

The authors would like to thank Jean-Luc RUDKIEWICZ (IFP Energies nouvelles) and Claude GOUT (Total) for their valuable input in the design of the passive margin basin models.

Conflicts of Interest

The authors declare no conflict of interest.

Appendix A. Petro-Physical Properties of the Modelled Lithological Facies

Figure A1. Porosity for the backward restoration and the forward basin simulator. At significant burial depths (e.g., 1 to 8 km), the shalier the facies, the less porous the sediment. However, this ranking is inverted at deposition.
Geosciences 09 00469 g0a1
Figure A2. Horizontal and vertical permeability. For a given porosity, the shalier the facies, the less permeable the sediment.
Geosciences 09 00469 g0a2

References

  1. Bradley, D.C. Passive margins through earth history. Earth Sci. Rev. 2008, 91, 1–26. [Google Scholar] [CrossRef] [Green Version]
  2. Levell, B.; Argent, J.; Doré, A.G.; Fraser, S. Passive margins: Overview. In Geological Society, London, Petroleum Geology Conference Series; Geological Society of London: London, UK, 2011; Volume 7, pp. 823–830. [Google Scholar] [CrossRef]
  3. Wen, Z.; Xu, H.; Wang, Z.; He, Z.; Song, C.; Chen, X.; Wang, Y. Classification and hydrocarbon distribution of passive continental margin basins. Pet. Explor. Dev. 2016, 43, 740–750. [Google Scholar] [CrossRef]
  4. Mann, P.; Gahagan, L.; Gordon, M.B. Tectonic setting of the world’s giant oil and gas fields. In Giant Oil and Gas Fields of the Decade 1990–1999, AAPG Memoir; American Association of Petroleum Geologists: Tulsa, OK, USA, 2003; Volume 78, pp. 15–105. [Google Scholar] [CrossRef]
  5. Canals, M.; Lastras, G.; Urgeles, R.; Casamor, J.L.; Mienert, J.; Cattaneo, A.; De Batist, M.; Haflidason, H.; Imbo, Y.; Laberg, J.; et al. Slope failure dynamics and impacts from seafloor and shallow sub-seafloor geophysical data: case studies from the COSTA project. Mar. Geol. 2004, 213, 9–72. [Google Scholar] [CrossRef]
  6. Vanneste, M.; Sultan, N.; Garziglia, S.; Forsberg, C.F.; L’Heureux, J.-S. Seafloor instabilities and sediment deformation processes: The need for integrated, multi-disciplinary investigations. Mar. Geol. 2014, 352, 183–214. [Google Scholar] [CrossRef] [Green Version]
  7. Stow, D.A.; Johansson, M. Deep-water massive sands: nature, origin and hydrocarbon implications. Mar. Pet. Geol. 2000, 17, 145–174. [Google Scholar] [CrossRef]
  8. Shanmugam, G. New perspectives on deep-water sandstones: Implications. Pet. Explor. Dev. 2013, 40, 316–324. [Google Scholar] [CrossRef]
  9. Magara, K. Compaction and Fluid Migration; Elsevier: Amsterdam, The Netherlands, 1978; Volume 9, ISBN 0-444-41654-4. [Google Scholar]
  10. Du Rouchet, J. Stress Fields, A Key to Oil Migration. AAPG Bull. 1981, 65, 74–85. [Google Scholar]
  11. Zhang, J. Effective stress, porosity, velocity and abnormal pore pressure prediction accounting for compaction disequilibrium and unloading. Mar. Pet. Geol. 2013, 45, 2–11. [Google Scholar] [CrossRef]
  12. Li, S.; George, J.; Purdy, C. Pore-Pressure and Wellbore-Stability Prediction to Increase Drilling Efficiency. J. Pet. Technol. 2012, 64, 98–101. [Google Scholar] [CrossRef]
  13. Faille, I.; Thibaut, M.; Cacas, M.-C.; Havé, P.; Willien, F.; Wolf, S.; Agelas, L.; Pegaz-Fiornet, S. Modeling Fluid Flow in Faulted Basins. Oil Gas Sci. Technol. Rev. l’IFP 2014, 69, 529–553. [Google Scholar] [CrossRef] [Green Version]
  14. Available online: https://www.code-aster.org (accessed on 18 October 2019).
  15. Watts, A. Models for the evolution of passive margins. In Regional Geology and Tectonics: Phanerozoic Rift Systems and Sedimentary Basins; Elsevier: Amsterdam, The Netherlands, 2012; Volume 1, pp. 32–57. [Google Scholar]
  16. Catuneanu, O. Principles of Sequence Stratigraphy; Elsevier: Amsterdam, The Netherlands, 2006; ISBN 978-0-444-51568-1. [Google Scholar]
  17. O’Grady, D.B.; Syvitski, J.P.M.; Pratson, L.F.; Sarg, J.F. Categorizing the morphologic variability of siliciclastic passive continental margins. Geology 2000, 28, 207. [Google Scholar] [CrossRef]
  18. Dugan, B.; Sheahan, T.C. Offshore sediment overpressures of passive margins: Mechanisms, measurement, and models. Rev. Geophys. 2012, 50. [Google Scholar] [CrossRef]
  19. Osborne, M.J.; Swarbrick, R.E. Mechanisms for Generating Overpressure in Sedimentary Basins: A Reevaluation. AAPG Bull. 1997, 81, 1023–1041. [Google Scholar]
  20. Grauls, D. Overpressures: Causal Mechanisms, Conventional and Hydromechanical Approaches. Oil Gas Sci. Technol. Rev. l’IFP 1999, 54, 667–678. [Google Scholar] [CrossRef]
  21. Shaker, S. Sequence stratigraphy: Key to geopressure profile assessment. CSEG Rec. 2002, 9, 88–91. Available online: https://csegrecorder.com/articles/view/sequence-stratigraphy-key-to-geopressure-profile-assessment (accessed on 5 November 2019).
  22. Flemings, P.B. Flow focusing in overpressured sandstones: Theory, observations, and applications. Am. J. Sci. 2002, 302, 827–855. [Google Scholar] [CrossRef]
  23. Xie, X.; Li, S.; Dong, W.; Zhang, Q. Overpressure development and hydrofracturing in the Yinggehai basin, South China Sea. J. Pet. Geol. 1999, 22, 437–454. [Google Scholar] [CrossRef]
  24. Hustoft, S.; Mienert, J.; Bünz, S.; Nouzé, H. High-resolution 3D-seismic data indicate focussed fluid migration pathways above polygonal fault systems of the mid-Norwegian margin. Mar. Geol. 2007, 245, 89–106. [Google Scholar] [CrossRef] [Green Version]
  25. Hampton, M.A.; Lee, H.J.; Locat, J. Submarine landslides. Rev. Geophys. 1996, 34, 33–59. [Google Scholar] [CrossRef]
  26. Wynn, R.B.; Kenyon, N.H.; Weaver, P.P.E.; Evans, J. Continental margin sedimentation, with special reference to the north-east Atlantic margin. Sedimentology 2000, 47, 239–256. [Google Scholar]
  27. Hühnerbach, V.; Masson, D.; Costa-Project, P.O.T. Landslides in the North Atlantic and its adjacent seas: an analysis of their morphology, setting and behaviour. Mar. Geol. 2004, 213, 343–362. [Google Scholar] [CrossRef]
  28. Krastel, S.; Lehr, J.; Winkelmann, D.; Schwenk, T.; Preu, B.; Strasser, M.; Wynn, R.B.; Georgiopoulou, A.; Hanebuth, T.J.J. Mass wasting along Atlantic continental margins: A comparison between NW-Africa and the de la Plata River region (northern Argentina and Uruguay). In Submarine Mass Movements and Their Consequences; Springer: Cham, Switzerland, 2014; pp. 459–469. [Google Scholar] [CrossRef]
  29. Le Bouteiller, P.; Lafuerza, S.; Charléty, J.; Reis, A.T.; Granjeon, D.; Delprat-Jannaud, F.; Gorini, C. A new conceptual methodology for interpretation of mass transport processes from seismic data. Mar. Pet. Geol. 2019, 103, 438–455. [Google Scholar] [CrossRef] [Green Version]
  30. Camargo, J.M.; Silva, M.V.; Ferreira Júnior, A.V.; Araújo, T. Marine Geohazards: A Bibliometric-Based Review. Geosciences 2019, 9, 100. [Google Scholar] [CrossRef]
  31. Rowan, M.G.; Peel, F.J.; Vendeville, B.C. Gravity-driven fold belts on passive margins, In Thrust Tectonics and Hydrocarbon Systems. AAPG Memoir 2004, 82, 157–182. [Google Scholar] [CrossRef]
  32. Morley, C.; King, R.; Hillis, R.; Tingay, M.; Backé, G.; Morley, C. Deepwater fold and thrust belt classification, tectonics, structure and hydrocarbon prospectivity: A review. Earth Sci. Rev. 2011, 104, 41–91. [Google Scholar] [CrossRef]
  33. Locat, J.; Leroueil, S.; Locat, A.; Lee, H. Weak layers: Their definition and classification from a geotechnical perspective. In Submarine Mass Movements and Their Consequences; Springer: Cham, Switzerland, 2014; pp. 3–12. [Google Scholar] [CrossRef]
  34. Dugan, B. Flemings Overpressure and fluid flow in the new jersey continental slope: implications for slope failure and cold seeps. Science 2000, 289, 288–291. [Google Scholar] [CrossRef]
  35. Sultan, N.; Cochonat, P.; Canals, M.; Cattaneo, A.; Dennielou, B.; Haflidason, H.; Laberg, J.; Long, D.; Mienert, J.; Trincardi, F.; et al. Triggering mechanisms of slope instability processes and sediment failures on continental margins: a geotechnical approach. Mar. Geol. 2004, 213, 291–321. [Google Scholar] [CrossRef] [Green Version]
  36. Behrmann, J.H.; Flemings, P.B.; John, C.M. Rapid Sedimentation, Overpressure, and Focused Fluid Flow, Gulf of Mexico Continental Margin. Sci. Drill. 2006, 3, 12–17. [Google Scholar] [CrossRef]
  37. Urgeles, R.; Locat, J.; Dugan, B. Recursive Failure of the Gulf of Mexico Continental Slope: Timing and Causes. In Submarine Mass Movements and Their Consequences; Springer: Dordrecht, The Netherlands, 2007; pp. 209–219. [Google Scholar] [CrossRef]
  38. Wolinsky, M.A.; Pratson, L.F. Overpressure and slope stability in prograding clinoforms: Implications for marine morphodynamics. J. Geophys. Res. Space Phys. 2007, 112. [Google Scholar] [CrossRef] [Green Version]
  39. Ai, F.; Strasser, M.; Preu, B.; Hanebuth, T.J.J.; Krastel, S.; Kopf, A. New constraints on oceanographic vs. seismic control on submarine landslide initiation: a geotechnical approach off Uruguay and northern Argentina. Geo-Mar. Lett. 2014, 34, 399–417. [Google Scholar] [CrossRef] [Green Version]
  40. Xie, X.; Müller, R.D.; Ren, J.; Jiang, T.; Zhang, C. Stratigraphic architecture and evolution of the continental slope system in offshore Hainan, northern South China Sea. Mar. Geol. 2008, 247, 129–144. [Google Scholar] [CrossRef]
  41. Mauduit, T.; Guerin, G.; Brun, J.-P.; Lecanu, H. Raft tectonics: the effects of basal slope angle and sedimentation rate on progressive extension. J. Struct. Geol. 1997, 19, 1219–1230. [Google Scholar] [CrossRef]
  42. Mourgues, R.; Lacoste, A.; Garibaldi, C. The Coulomb critical taper theory applied to gravitational instabilities. J. Geophys. Res. Solid Earth 2014, 119, 754–765. [Google Scholar] [CrossRef]
  43. Brun, J.-P.; Fort, X. Salt tectonics at passive margins: Geology versus models. Mar. Pet. Geol. 2011, 28, 1123–1145. [Google Scholar] [CrossRef]
  44. Yuan, X.P.; Leroy, Y.M.; Maillot, B. Reappraisal of gravity instability conditions for offshore wedges: Consequences for fluid overpressures in the Niger Delta. Geophys. J. Int. 2017, 208, 1655–1671. [Google Scholar] [CrossRef]
  45. Dahlen, F.A. Noncohesive critical Coulomb wedges: An exact solution. J. Geophys. Res. Space Phys. 1984, 89, 10125–10133. [Google Scholar] [CrossRef]
  46. Leynaud, D.; Sultan, N.; Mienert, J. The role of sedimentation rate and permeability in the slope stability of the formerly glaciated Norwegian continental margin: The Storegga slide model. Landslides 2007, 4, 297–309. [Google Scholar] [CrossRef]
  47. Sultan, N.; Gaudin, M.; Berné, S.; Canals, M.; Urgeles, R.; Lafuerza, S. Analysis of slope failures in submarine canyon heads: An example from the Gulf of Lions. J. Geophys. Res. Space Phys. 2007, 112, 1–29. [Google Scholar] [CrossRef]
  48. Dan, G.; Sultan, N.; Savoye, B.; Deverchere, J.; Yelles, K. Quantifying the role of sandy–silty sediments in generating slope failures during earthquakes: Example from the Algerian margin. Int. J. Earth Sci. 2009, 98, 769–789. [Google Scholar] [CrossRef]
  49. Urlaub, M.; Zervos, A.; Talling, P.J.; Masson, D.G.; Clayton, C.I. How do ~2° slopes fail in areas of slow sedimentation? A sensitivity study on the influence of accumulation rate and permeability on submarine slope stability. In Submarine Mass Movements and Their Consequences; Springer: Dordrecht, The Netherlands, 2012; pp. 277–287. [Google Scholar] [CrossRef]
  50. Ai, F.; Kuhlmann, J.; Huhn, K.; Strasser, M.; Kopf, A. Submarine slope stability assessment of the central Mediterranean continental margin: The Gela Basin. In Submarine Mass Movements and their Consequences; Springer: Cham, Switzerland, 2014; pp. 225–236. [Google Scholar] [CrossRef]
  51. Yuan, X.P.; Leroy, Y.M.; Maillot, B. Tectonic and gravity extensional collapses in overpressured cohesive and frictional wedges. J. Geophys. Res. Solid Earth 2015, 120, 1833–1854. [Google Scholar] [CrossRef]
  52. Berthelon, J.; Yuan, X.; Bouziat, A.; Souloumiac, P.; Pubellier, M.; Cornu, T.; Maillot, B. Mechanical restoration of gravity instabilities in the Brunei margin, N.W. Borneo. J. Struct. Geol. 2018, 117, 148–162. [Google Scholar] [CrossRef]
  53. Rudkiewicz, J.L.; Penteado, H.D.B.; Vear, A.; Vandenbroucke, M.; Brigaud, F.; Wendebourg, J.; Duppenbecker, S. Integrated Basin Modeling Helps to Decipher Petroleum Systems. In Petroleum Systems of South Atlantic Margins. AAPG Memoir 2000, 73, 27–40. [Google Scholar] [CrossRef]
  54. Schneider, F.; Wolf, S.; Faille, I.; Pot, D. A 3d Basin Model for Hydrocarbon Potential Evaluation: Application to Congo Offshore. Oil Gas Sci. Technol. Rev. l’IFP 2000, 55, 3–13. [Google Scholar] [CrossRef]
  55. Xie, X.; Bethke, C.M.; Li, S.; Liu, X.; Zheng, H. Overpressure and petroleum generation and accumulation in the Dongying Depression of the Bohaiwan Basin, China. Geofluids 2001, 1, 257–271. [Google Scholar] [CrossRef]
  56. Tuncay, K.; Ortoleva, P. Quantitative basin modeling: present state and future developments towards predictability. Geofluids 2004, 4, 23–39. [Google Scholar] [CrossRef]
  57. Hantschel, T.; Kauerauf, A.I. Fundamentals of Basin and Petroleum Systems Modeling; Springer Science & Business Media: Berlin/Heidelberg, Germany, 2009. [Google Scholar] [CrossRef]
  58. Thibaut, M.; Jardin, A.; Faille, I.; Willien, F.; Guichet, X. Advanced Workflows for Fluid Transfer in Faulted Basins. Oil Gas Sci. Technol. Rev. l’IFP 2014, 69, 573–584. [Google Scholar] [CrossRef]
  59. Fjeldskaar, W.; Andersen, Å.; Johansen, H.; Lander, R.; Blomvik, V.; Skurve, O.; Michelsen, J.K.; Grunnaleite, I.; Mykkeltveit, J.; Mykkeltveit, J. Bridging the gap between basin modelling and structural geology. Reg. Geol. Metallog 2017, 72, 65–77. [Google Scholar]
  60. Crook, A.J.; Obradors-Prats, J.; Somer, D.; Peric, D.; Lovely, P.; Kacewicz, M. Towards an integrated restoration/forward geomechanical modelling workflow for basin evolution prediction. Oil Gas Sci. Technol. Rev. l’IFP 2018, 73, 18. [Google Scholar] [CrossRef] [Green Version]
  61. Burgreen-Chan, B.; Meisling, K.E.; Graham, S. Basin and petroleum system modelling of the East Coast basin, New Zealand: A test of overpressure scenarios in a convergent margin. Basin Res. 2016, 28, 536–567. [Google Scholar] [CrossRef]
  62. Woillez, M.N.; Souque, C.; Rudkiewicz, J.L.; Willien, F.; Cornu, T. Insights in fault flow behavior from onshore Nigeria petroleum system modelling. Oil Gas Sci. Technol. Rev. d’IFP Energies Nouvelles 2017, 72, 31. [Google Scholar] [CrossRef]
  63. Schneider, F.; Bouteca, M.; Sarda, J.P. Hydraulic Fracturing at Sedimentary Basin Scale. Oil Gas Sci. Technol. Rev. l’IFP 1999, 54, 797–806. [Google Scholar] [CrossRef]
  64. Hauser, M.R.; Couzens-Schultz, B.A.; Chan, A.W. Estimating the influence of stress state on compaction behavior. Geophysics 2014, 79, D389–D398. [Google Scholar] [CrossRef]
  65. Prats, J.O.; Rouainia, M.; Aplin, A.C.; Crook, A.J. Stress and pore pressure histories in complex tectonic settings predicted with coupled geomechanical-fluid flow models. Mar. Pet. Geol. 2016, 76, 464–477. [Google Scholar] [CrossRef] [Green Version]
  66. Tuncay, K.; Park, A.; Ortoleva, P. Sedimentary basin deformation: an incremental stress approach. Tectonophysics 2000, 323, 77–104. [Google Scholar] [CrossRef]
  67. Obradors-Prats, J.; Rouainia, M.; Aplin, A.C.; Crook, A.J. Assessing the implications of tectonic compaction on pore pressure using a coupled geomechanical approach. Mar. Pet. Geol. 2017, 79, 31–43. [Google Scholar] [CrossRef] [Green Version]
  68. Campher, C.; Kuhlmann, G.; Adams, S.; Anka, Z.; Di Primio, R.; Horsfield, B. 3D petroleum systems modelling within a passive margin setting, orange basin, blocks 3/4, offshore south Africa—Implications for gas generation, migration and leakage. S. Afr. J. Geol. 2011, 114, 387–414. [Google Scholar]
  69. Ducros, M.; Carpentier, B.; Wolf, S.; Cacas, M.C. Integration of biodegradation and migration of hydrocarbons in a 2D petroleum systems model: Application to the Potiguar Basin, NE Brazil. J. Pet. Geol. 2016, 39, 61–78. [Google Scholar] [CrossRef]
  70. Barabasch, J.; Ducros, M.; Hawie, N.; Daher, S.B.; Nader, F.H.; Littke, R. Integrated 3D forward stratigraphic and petroleum system modeling of the Levant Basin, Eastern Mediterranean. Basin Res. 2019, 31, 228–252. [Google Scholar] [CrossRef]
  71. Guy, N.; Colombo, D.; Frey, J.; Cornu, T.; Cacas-Stentz, M.C. Coupled Modeling of Sedimentary Basin and Geomechanics: A Modified Drucker–Prager Cap Model to Describe Rock Compaction in Tectonic Context. Rock Mech. Rock Eng. 2019, 52, 3627–3643. [Google Scholar] [CrossRef]
  72. Morency, C.; Huismans, R.S.; Beaumont, C.; Fullsack, P. A numerical model for coupled fluid flow and matrix deformation with applications to disequilibrium compaction and delta stability. J. Geophys. Res. Space Phys. 2007, 112, 1–25. [Google Scholar] [CrossRef]
  73. Mainguy, M.; Longuemare, P. Coupling Fluid Flow and Rock Mechanics: Formulations of the Partial Coupling Between Reservoir and Geomechanical Simulators. Oil Gas Sci. Technol. Rev. l’IFP 2002, 57, 355–367. [Google Scholar] [CrossRef] [Green Version]
  74. Guy, N.; Enchéry, G.; Renard, G. Numerical Modeling of Thermal EOR: Comprehensive Coupling of an AMR-Based Model of Thermal Fluid Flow and Geomechanics. Oil Gas Sci. Technol. Rev. l’IFP 2012, 67, 1019–1027. [Google Scholar] [CrossRef]
  75. Guy, N.; Colombo, D.; Frey, J.; Vincke, O.; Gout, C. Method for Exploitation of Hydrocarbons from a Sedimentary Basin by Means of a Basin Simulation Taking Account of Geomechanical Effects. U.S. Patent No. 10296679, 19 December 2016. [Google Scholar]
  76. Schneider, F.; Potdevin, J.L.; Wolf, S.; Faille, I. Elastoplastic and Viscoplastic Compaction Model for the Simulation of Sedimentary Basins. Oil Gas Sci. Technol. 1994, 49, 141–148. [Google Scholar] [CrossRef]
  77. Schneider, F.; Potdevin, J.; Wolf, S.; Faille, I. Mechanical and chemical compaction model for sedimentary basin simulators. Tectonophysics 1996, 263, 307–317. [Google Scholar] [CrossRef]
  78. Zhang, K.; Zhou, H.; Shao, J. An Experimental Investigation and an Elastoplastic Constitutive Model for a Porous Rock. Rock Mech. Rock Eng. 2013, 46, 1499–1511. [Google Scholar] [CrossRef]
  79. Brüch, A.; Maghous, S.; Ribeiro, F.; Dormieux, L. A thermo-poro-mechanical constitutive and numerical model for deformation in sedimentary basins. J. Pet. Sci. Eng. 2018, 160, 313–326. [Google Scholar] [CrossRef]
  80. Pinheiro-Moreira, J.L.; Nalpas, T.; Joseph, P.; Guillocheau, F. Stratigraphie sismique de la marge éocène du Nord du bassin de Santos (Brésil): Relations plate-forme/systèmes turbiditiques; distorsion des séquences de dépôt. Comptes Rendus Acad. Sci. Ser. IIA Earth Planet. Sci. 2001, 332, 491–498. [Google Scholar] [CrossRef]
  81. Dingle, R.V. Continental margin subsidence: A Comparison between the east and west coasts of Africa. In Reflection Seismology: A Global Perspective; American Geophysical Union (AGU): Washington, DC, USA, 1982; Volume 6, pp. 59–71. [Google Scholar]
  82. Stow, D.A.V.; Tabrez, A.R. Hemipelagites: Processes, Facies and Model; Geological Society: London, UK, 1998; Volume 129, pp. 317–337. [Google Scholar]
  83. Perrier, R.; Quiblier, J. Thickness changes in sedimentary layers during compaction history; methods for quantitative evaluation. AAPG Bull. 1974, 58, 507–520. [Google Scholar] [CrossRef]
  84. Allen, P.A.; Allen, J.R. Basin Analysis: Principles and Application to Petroleum Play Assessment; John Wiley & Sons: Hoboken, NJ, USA, 2013; ISBN 978-0-470-67377-5. [Google Scholar]
  85. Available online: http://www.beicip.com/petroleum-system-assessment (accessed on 18 October 2019).
  86. Manger, G.E. Porosity and Bulk Density of Sedimentary Rocks; Bulletin (US Geological Survey), 1144-E; U.S. Government Publishing Office: Washington, DC, USA, 1963; pp. 1–55. [CrossRef]
  87. Gerçek, H. Poisson’s ratio values for rocks. Int. J. Rock Mech. Min. Sci. 2007, 44, 1–13. [Google Scholar] [CrossRef]
  88. Mondol, N.H.; Castagna, T.P.C.J. Porosity and permeability development in mechanically compacted silt-kaolinite mixtures. In SEG Technical Program Expanded Abstracts 2009; Society of Exploration Geophysicists: Tulsa, OK, USA, 2009; pp. 2139–2143. [Google Scholar]
  89. Yang, Y.; Aplin, A.C. A permeability–porosity relationship for mudstones. Mar. Pet. Geol. 2010, 27, 1692–1697. [Google Scholar] [CrossRef]
  90. Chilingar, G.V. Relationship Between Porosity, Permeability, and Grain-Size Distribution of Sands and Sandstones. In Developments in Sedimentology; Elsevier: Amsterdam, The Netherlands, 1964; Volume 1, pp. 71–75. [Google Scholar]
  91. Doyen, P.M. Permeability, conductivity, and pore geometry of sandstone. J. Geophys. Res. Space Phys. 1988, 93, 7729. [Google Scholar] [CrossRef]
  92. Luijendijk, E.; Gleeson, T. How well can we predict permeability in sedimentary basins? Deriving and evaluating porosity–permeability equations for noncemented sand and clay mixtures. Geofluids 2015, 15, 67–83. [Google Scholar] [CrossRef]
  93. Lanson, B.; Beaufort, D.; Berger, G.; Bauer, A.; Cassagnabère, A.; Meunier, A. Authigenic kaolin and illitic minerals during burial diagenesis of sandstones: A review. Clay Miner. 2002, 37, 1–22. [Google Scholar] [CrossRef]
  94. Bolton, A.J.; Maltman, A.J.; Fisher, Q. Anisotropic permeability and bimodal pore-size distributions of fine-grained marine sediments. Mar. Pet. Geol. 2000, 17, 657–672. [Google Scholar] [CrossRef]
  95. Hu, K.; Issler, D.R. A Comparison of Core Petrophysical Data with Well Log Parameters, Beaufort-Mackenzie Basin; Geological Survey of Canada: Ottawa, ON, Canada, 2009. [Google Scholar] [CrossRef]
  96. Selvadurai, A.P.S.; Boulon, M.J.; Nguyen, T.S. The Permeability of an Intact Granite. Pure Appl. Geophys. 2005, 162, 373–407. [Google Scholar] [CrossRef]
  97. Brace, W.F.; Walsh, J.B.; Frangos, W.T. Permeability of granite under high pressure. J. Geophys. Res. Space Phys. 1968, 73, 2225–2236. [Google Scholar] [CrossRef]
  98. Moore, D.E.; Lockner, D.A.; Byerlee, J.D. Reduction of Permeability in Granite at Elevated Temperatures. Science 1994, 265, 1558–1561. [Google Scholar] [CrossRef] [Green Version]
  99. Flemings, P.B.; Dugan, B. Fluid flow and stability of the US continental slope offshore New Jersey from the Pleistocene to the present. Geofluids 2002, 2, 137–146. [Google Scholar] [Green Version]
  100. Stigall, J.; Dugan, B. Overpressure and earthquake initiated slope failure in the Ursa region, northern Gulf of Mexico. J. Geophys. Res. Space Phys. 2010, 115, 1–11. [Google Scholar] [CrossRef]
  101. Terzaghi, K.; Peck, R.B.; Mesri, G. Soil Mechanics in Engineering Practice; John Wiley & Sons: Hoboken, NJ, USA, 1996; ISBN 978-0-471-08658-1. [Google Scholar]
  102. Nauroy, J.F. Geomechanics Applied to the Petroleum Industry; Editions Technip: Paris, France, 2011; ISBN 978-2-710-80932-6. [Google Scholar]
  103. Drucker, D.C.; Prager, W. Soil mechanics and plastic analysis or limit design. Q. Appl. Math. 1952, 10, 157–165. [Google Scholar] [CrossRef] [Green Version]
  104. Granjeon, D.; Joseph, P.; Harbaugh, J.W.; Watney, W.L.; Rankey, E.C.; Slingerland, R.; Goldstein, R.H.; Franseen, E.K. Concepts and Applications of A 3-D Multiple Lithology, Diffusive Model in Stratigraphic Modeling. In Numerical Experiments in StratigraphyRecent Advances in Stratigraphic and Sedimentologic Computer Simulations; Society for Sedimentary Geology: Tulsa, OK, USA, 1999. [Google Scholar]
  105. Busson, J. Caractérisation et Modélisation des Transferts Gravitaires de la Plate-Forme au Basin en Contexte Carbonaté. Ph.D. Thesis, University of Bordeaux, Bordeaux, France, 2018. [Google Scholar]
  106. Cornu, T.; Gout, C.; Cacas-Stenz, M.C.; Woillez, M.N.; Guy, N.; Bouziat, A.; Colombo, D.; Frey, J. NOMBA an integrated project for coupling basin modeling and geomechanical simulations. In Proceedings of the AAPG Hedberg Conference: The Future of Basin and Petroleum System Modelin, Santa Barbara, CA, USA, 3–8 April 2016. [Google Scholar]
Figure 1. Geometry and stratigraphy of the study-case in the present day; vertical exaggeration × 3.
Geosciences 09 00469 g001
Figure 2. Mesh and lithology distribution of the study-case in the present-day; vertical exaggeration × 2.
Geosciences 09 00469 g002
Figure 3. Porosity and overpressure simulated on the base case scenario. (a) reminder of the lithological facies distribution; (b) present-day porosity; (c) overview of the fluid overpressure evolution from six geological events; vertical exaggeration × 2.
Geosciences 09 00469 g003
Figure 4. Shear and rotation of principal stresses simulated on the base case scenario. (a) present-day shear: absolute values; (b) present-day shear: ratios of vertical effective stress; (c) overview of the rotation of the principal stress system through time from six geological events; vertical exaggeration × 2.
Geosciences 09 00469 g004
Figure 5. Minimal principal stress simulated on the base case scenario. (a) reminder of the lithological facies distribution; (b) present-day minimal principal stress: absolute values; (c) overview of the minimal principal stress evolution from six geological events: ratios of maximal principal stress; vertical exaggeration × 2.
Geosciences 09 00469 g005
Figure 6. Weakness area simulated on the base case scenario. (a) reminder of the lithological facies distribution; (b) event of criterion first reach: the stronger the red color, the earlier the area becomes weak; (c) overview of the weakness expansion through time from six geological events; vertical exaggeration × 2.
Geosciences 09 00469 g006
Figure 7. Influence of sedimentation rate on weakness development: globally. (a) present-day fluid overpressure simulated on the three scenarios; (b) event of criterion first reach in the three scenarios: the stronger the red color, the earlier the area becomes weak; vertical exaggeration × 2.
Geosciences 09 00469 g007
Figure 8. Influence of sedimentation rate on weakness development: locally. (a) location of the cell whose mechanical state was tracked through time; (b) evolution of the tracked cell in the p′–q system for the three scenarios. The rightmost curve corresponds to the low rate scenario and the leftmost curve to the high rate scenario. The weakness criterion is reached earlier in the high rate scenario due to higher fluid pressure resulting in lower confinement pressure.
Geosciences 09 00469 g008
Figure 9. Influence of subsidence tilt on weakness development: globally. (a) present-day shear simulated on the three scenarios; (b) event of criterion first reach in the three scenarios: the stronger the red color, the earlier the area becomes weak; vertical exaggeration × 2.
Geosciences 09 00469 g009
Figure 10. Influence of subsidence tilt on weakness development: locally. (a) location of the cell whose mechanical state was tracked through time; (b) evolution of the tracked cell in the p q system for the three scenarios. The upmost curve corresponds to the high tilt scenario and the downmost curve to the low tilt scenario. The weakness criterion is reached earlier in the high tilt scenario due to higher shear resulting in higher deviatoric stress.
Geosciences 09 00469 g010
Table 1. Values of sedimentation rate in the models set.
ModelDuration of Each Event (My)Lowest Rate (m/My)Average Rate (m/My)Highest Rate (m/My)
Low rate23782165
Base case175165330
High rate0.5150330660
Table 2. Values of subsidence tilt angle in the models set.
ModelInitial
Basal Slope
Tilt in Each
Transgressive Event
Present-Day Basal Slope
Low tilt0.0625°0.75°
Base case0.125°1.5°
High tilt0.250°

